vistracer: a visual analytics tool to investigate routing...
TRANSCRIPT

VisTracer: A Visual Analytics Tool to InvestigateRouting Anomalies in Traceroutes
Fabian FischerUniversity of Konstanz
Johannes FuchsUniversity of Konstanz
Pierre-Antoine VervierInstitut Eurecom
Florian MansmannUniversity of Konstanz
Olivier ThonnardSymantec Research LabsOlivier_Thonnard@
symantec.com
ABSTRACTRouting in the Internet is vulnerable to attacks due to theinsecure design of the border gateway protocol (BGP). Onepossible exploitation of this insecure design is the hijack-ing of IP blocks. Such hijacked IP blocks can then be usedto conduct malicious activities from seemingly legitimate IPaddresses. In this study we actively trace and monitor theroutes to spam sources over several consecutive days afterhaving received a spam message from such a source. How-ever, the real challenge is to distinguish between legitimaterouting changes and those ones that are related to system-atic misuse in so-called spam campaigns. To combine thestrengths of human judgement and computational efficiency,we thus present a novel visual analytics tool named Vis-tracer in this paper. This tool represents analysis resultsof our anomaly detection algorithms on large traceroute datasets with the help of several scalable representations to sup-port the analyst to explore, identify and analyze suspiciousevents and their relations to malicious activities. In particu-lar, pixel-based visualization techniques, novel glyph-basedsummary representations and a combination of temporalglyphs in a graph representation are used to give an overviewof route changes to specific destinations over time. To eval-uate our tool, real-world case studies demonstrate the usageof Vistracer in practice on large-scale data sets.
Categories and Subject DescriptorsC.2.0 [Computer-Communication Networks]: General—Security and protection; C.3.8 [Computer Graphics]: Ap-plication; H.5.2 [Information Interfaces and Presenta-tion]: User Interfaces
General TermsNetwork Security, Visual Analytics, Traceroutes, Anomalies
Permission to make digital or hard copies of part or all of this work forpersonal or classroom use is granted without fee provided that copies are notmade or distributed for profit or commercial advantage and that copies bearthis notice and the full citation on the first page. Copyrights for componentsof this work owned by others than ACM must be honored. Abstracting withcredit is permitted. To copy otherwise, to republish, to post on servers or toredistribute to lists, requires prior specific permission and/or a fee.VizSec ’12, October 15 2012, Seattle, WA, USACopyright 2012 ACM 978-1-4503-1413-8/12/10 ...$15.00.
1. INTRODUCTIONRouting is a fundamental concept in the Internet. Cor-
rect path announcements are important to reach the correctdestination servers. Despite of the importance and the se-vere consequences of routing issues, the responsible bordergateway protocol (BGP) is quite vulnerable. Announcingmalicious routing paths can be used to hijack IP blocks. Asa result the attacker can conduct malicious activities from le-gitimate IP addresses. Distribution of vast amounts of spamis a scenario where the misuse of legitimate IP prefixes helpsthe attackers to circumvent widely used IP-based blacklists.The focus of this work is the large-scale analysis and explo-ration of routing anomalies for IP addresses starting to sendspam in the Internet. This is achieved by actively trackingand measuring the traceroutes to the origin IP addressesover longer periods of time to eventually monitor possiblymalicious path changes. Because of the vast amount of tracedata with their changing underlying BGP routes, it is nothelpful to just visualize the raw data. To make sense of thedata it is important to algorithmically identify anomaliesfirst. The tight integration of visual displays can be used toget an overview for quick ad-hoc analysis to identify note-worthy events and to differentiate them from false positives.The proposed visualizations in our work help to gain deepinsights and visually explore the events within their contextof historic and related anomalous traceroutes. Furthermorethe analysts can push their findings back to the system. Thisfeedback could then be used for further improving the un-derlying anomaly detection algorithms.
The three main contributions of our work are (i) a vi-sual analytics tool called Vistracer to analyze large-scaletraceroute data, (ii) the integration into our large-scale au-tomatic analysis system and (iii) novel glyph- and graph-based summary visualizations for traceroutes. Additionally,we present an in-depth discussion of recent case studies forsuspicious routing anomalies with respect to spam activi-ties. The remainder of the paper is organized as follows. InSection 2 we discuss the most relevant related work. In Sec-tion 3 we describe the data infrastructure and the anomalydetection of our analysis approach. In Section 4 we presentthe proposed visual analytics tool and discuss real case stud-ies in Section 5 to evaluate the system. Section 6 concludeswith a summary and future work.

2. RELATED WORKThere are many tools, which visualize raw BGP update
messages. Because these do also reflect the routing changes,such tools are highly related to our approach to visualizetraceroutes. A popular approach to visualize such updatemessages are animated graphs, which can be seen in BG-Play [4], LinkRank [8] and TAMP [20]. Additionally, tem-poral information is presented as line charts, to explore andguide the animation of the path changes. Different pathsare colored to enhance the readability or encode additionalinformation. This helps to visually understand route with-drawals or update announcements. BGPEye [17] and [18]provide additional statistical information in a different viewto monitor real-time routing activity like the moving av-erage of the total number of BGP events or the deviationfrom historical trends. A combination of visualizing the In-ternet topology as a graph in a 3D display can be foundin VAST [9]. Elisha [16] also uses a 3D display in combi-nation with a pixel-based approach. Single pixels representIP addresses and are colored according to previously clas-sified BGP events. This space filling approach is enhancedby zooming and filtering techniques for gaining additionaldetails. Again animation is used to visualize changes overtime to be able to detect routing anomalies and MOASes.BGPeep [12] uses a more IP-space centered view in contrastto the previous approaches. Interesting ASes are visualizedwith a visualization similar to a parallel coordinates plot.One axis represents the AS and the other four the differ-ent octets of the IP address. A line traversing through theaxes shows single update messages. There are also severalcommercial tools available related to visualizing BGP paths.RIPE provides visualizations for investigating BGP updatemessages. Similar to BGPlay their web-based tool BGPviz 1
visualizes routing changes as animated graphs in combina-tion with a timeline. RIPEstat2 offers various widgets withcharts, tables and geographic maps to communicate detailedinformation about specific ASes. Statistical information en-riches the data to better compare the current status withthe historic activity. There is also a variety of tools visu-ally representing single traceroutes as lines, either on a timeaxis or mapped on top to a geographic map. These visualtracerouting tools directly represent executed traces to sin-gle destinations.
Our approach instead makes use of a combination of pixel-based techniques to present anomalous events in an overviewand glyph-based techniques to represent historical informa-tion for analyzed targets. We do also include a graph rep-resentation. However, our focus is the direct integration oftemporal information into the nodes of the graph using atemporal glyph representation. Besides of the optional ani-mation, this static integration in our approach can help theanalyst to get a quick overview of the path without havingto replay the whole communication as animation to under-stand the temporal changes.
Besides the visualizations of routing data, several solu-tions to secure BGP have already been studied in [3, 6]but the high computational cost of using cryptography andthe required changes in the protocol and the infrastructureretain their deployment. BGP hijack detection techniquesattempt to uncover abnormal changes in the routing infras-
1http://www.ris.ripe.net/bgpviz/2https://stat.ripe.net/
tructure likely due to a BGP hijack by monitoring the con-trol plane and/or the data plane. Methods described in [7,10] only monitor BGP updates and trigger an alert when anew advertisement conflicts with their model of the Inter-net topology. In [2, 5, 21, 22, 15] data plane informationis also used to collect information about the different hostsand networks along the forwarding path from a source toa monitored network. Several features of data plane tracescan be leveraged to help detect abnormal routing changes,e.g., a network reachability change [15], an AS-level tracer-oute deviation [21], a significant change in the traceroutepath length [22]. Finally, in [5] they combine control planeBGP hijack detection techniques with host fingerprints.
In our system we leverage different features of the tracer-outes like the IP/AS paths, the route length, the host andAS reachability as well as some BGP information to detectabnormal routing changes. We also correlate them to helpdetermine whether observed routing changes are benign ormalicious.
3. DATA INFRASTRUCTUREManipulating the Internet routing infrastructure to hijack
a block of IP addresses involves modifying the route taken bydata packets so that they reach the physical network of theattacker. A system called Spamtracer [19] has been devel-oped to monitor the routes towards malicious hosts by per-forming traceroute measurements repeatedly for a certainperiod of time. IP-level routes are translated into AS-levelroutes using live BGP feeds. The motivation for monitoringdata plane routes towards specific hosts involved in spamcampaigns is to collect the route taken by data packets toreach these hosts as soon as a spam is received from them.By performing multiple measurements on consecutive daysfor a certain period of time, typically one week, routes to-wards a given host or network can be compared and analyzedin depth to find evidences of a possible manipulation by anattacker of the routing infrastructure.
This system is based on a linear data flow where a feedof IP addresses to monitor is given as input and a series ofenriched traceroute paths produced as output from whichabnormal patterns can be uncovered. The incoming feed ofIP addresses are retrieved from Symantec.cloud3 spamtraps.This data is enriched with IP traceroutes. A customizedversion of the classic traceroute function is implementedand takes advantage of ICMP, UDP and TCP packets toincrease the likelihood of hosts to be reached by them. Dueto the many artifacts that can be found in IP-level traces,we also build the AS-level routes. The IP-to-AS mapping isperformed using live and distributed BGP feeds from Route-Views 4 to obtain as accurate and complete mappings as pos-sible. Additionally, information about the different hosts,AS owners, IP networks and geo locations is collected.
3.1 Extracting Routing AnomaliesWe analyze the collected routes to uncover abnormal rout-
ing changes and classify them as benign or malicious. Rout-ing anomalies are extracted independently for every mon-itored IP addresses. The first approach does focus on ex-tracting routing anomalies from BGP hijacking scenarios,while the second one searches for suspicious patterns basedon different metrics.
3http://www.symanteccloud.com/4http://www.routeviews.org/
To identify malicious BGP hijacks, we start from exist-ing scenarios of BGP hijacking [5] for which we know theresulting routing anomalies. However, it has to be consid-ered that such routing anomalies can also result from benignBGP routing practices, e.g., multi-homing of customer ASesby ISPs, or from non-malicious incidents due to misconfigu-ration or operational errors. Prefix Ownership Conflictsoccur when a block of IP addresses appears in the Internetrouting infrastructure as originated by multiple ASes. Thisrouting behavior can be the result of a hijacker advertisingsomeone else’s IP space in order to attract traffic to or orig-inate traffic from that IP space. Advertising the same prefixis a possible way for BGP hijacking, if the IP prefix is al-ready advertised by a different AS. This technique creates arouting anomaly referred to as Multiple Origin AS (MOAS).Announcing a slightly different prefix can also be used fortampering the ownership of a given IP prefix, which can bemore (resp. longer) or less specific (resp. shorter). In thiscase, we refer to this anomaly as a Sub Multiple Origin AS(subMOAS). BGP AS Path Anomalies occur, when thelocation of a network in the Internet AS topology changes.As a result of a BGP hijack it is likely that the sequence ofASes traversed from two different points will change. Signif-icant changes in the BGP AS paths should be investigatedto determine if they are indeed benign or if they result froma malicious manipulation of the routing infrastructure. TheNext-Hop AS anomaly can be observed with a certain num-ber of different next-hop ASes, i.e., ASes next to the originAS in an AS path, for a given origin AS and BGP collec-tor. A Complete AS Path anomaly consists in observing asignificant change in the AS paths for a given origin AS andBGP collector.
The second approach searches for suspicious patterns intraceroutes based mostly on metrics already used in previousworks [22, 15]. Traceroute Destination Anomalies referto suspicious values in features related to traceroute meta-data. Host/AS reachability defines if a destination host orAS towards a given IP address is reachable (unreachable) fora certain number of days during the monitoring period andsuddenly becomes unreachable (reachable) and remains likethis until the end of the monitoring period. This reachabil-ity anomaly can result from a major routing change whichcauses the destination host or AS to become (un)reachable.The hop count or the length of a traceroute path is the valueof the last TTL for which a reply to our probe IP packetshas been received. The hop count anomaly is the conse-quence of a significant and sudden change in the hop count.This situation suggests that an important routing changeoccurred to permanently change the route taken by pack-ets to reach the destination network. Traceroute PathAnomalies refer to suspicious changes in the sequence ofhops traversed by traceroute paths to a given destinationhost. Using the different features collected for IP/AS hops,we can consider a traceroute not only as a sequence of IP ad-dresses or ASes, but also as a sequence of countries, domainnames, RIRs, etc. These alternate paths are leveraged inthis detection of suspicious traceroute paths. The AS-levelPath Anomaly consists in observing a significant change inthe AS-level paths towards a given IP address. Country-levelPath Anomalies are observed by extracting traceroute pathstowards a given host exhibiting significant discrepancies inthe sequence of traversed countries. This assumes that the
countries traversed to reach a given destination from a givensource is likely to remain constant even if routing changesoccur at the IP or AS levels.
4. VISTRACERThe continuously growing Spamtracer database can be
accessed by the analyst using our visual exploration toolcalled Vistracer. The graphical user interface is built in away to satisfy the needs of experienced analysts by providingan overview linked to more detailed visualizations. Thishelps to solve the different analysis tasks. The individualviews can be placed according to the user’s preference oradjusted to the working environment which is important,when the tool is used in multi-display environments.
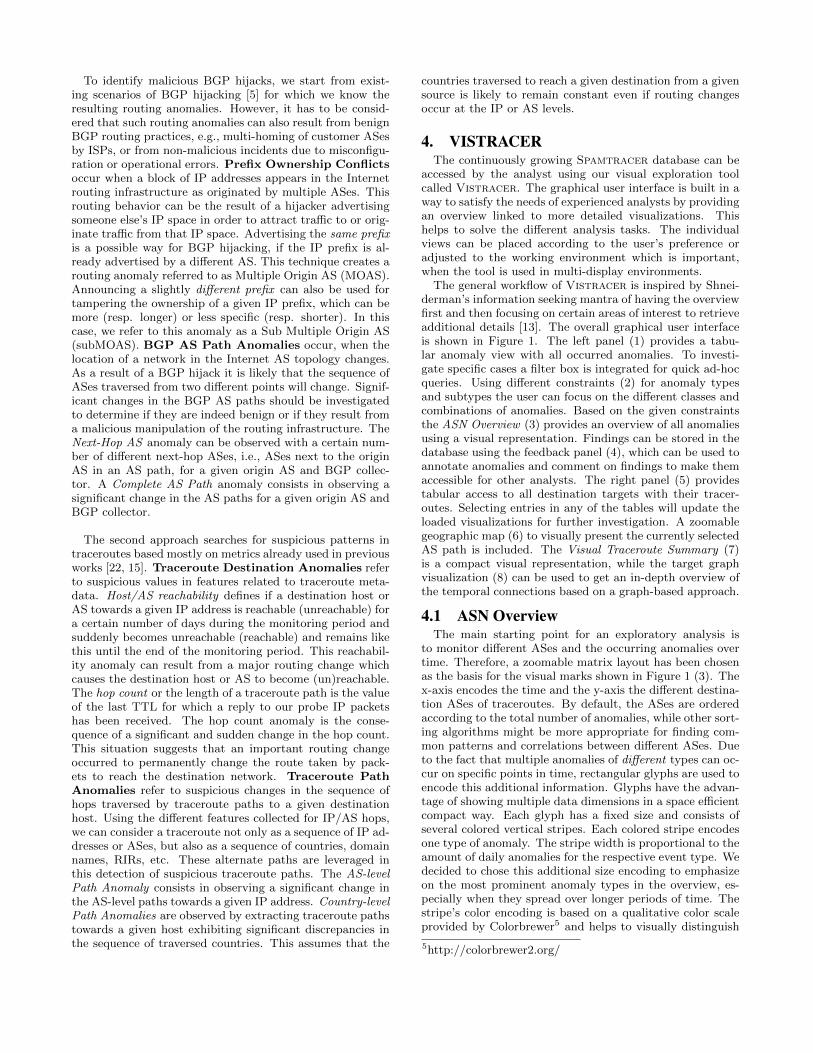
The general workflow of Vistracer is inspired by Shnei-derman’s information seeking mantra of having the overviewfirst and then focusing on certain areas of interest to retrieveadditional details [13]. The overall graphical user interfaceis shown in Figure 1. The left panel (1) provides a tabu-lar anomaly view with all occurred anomalies. To investi-gate specific cases a filter box is integrated for quick ad-hocqueries. Using different constraints (2) for anomaly typesand subtypes the user can focus on the different classes andcombinations of anomalies. Based on the given constraintsthe ASN Overview (3) provides an overview of all anomaliesusing a visual representation. Findings can be stored in thedatabase using the feedback panel (4), which can be used toannotate anomalies and comment on findings to make themaccessible for other analysts. The right panel (5) providestabular access to all destination targets with their tracer-outes. Selecting entries in any of the tables will update theloaded visualizations for further investigation. A zoomablegeographic map (6) to visually present the currently selectedAS path is included. The Visual Traceroute Summary (7)is a compact visual representation, while the target graphvisualization (8) can be used to get an in-depth overview ofthe temporal connections based on a graph-based approach.
4.1 ASN OverviewThe main starting point for an exploratory analysis is
to monitor different ASes and the occurring anomalies overtime. Therefore, a zoomable matrix layout has been chosenas the basis for the visual marks shown in Figure 1 (3). Thex-axis encodes the time and the y-axis the different destina-tion ASes of traceroutes. By default, the ASes are orderedaccording to the total number of anomalies, while other sort-ing algorithms might be more appropriate for finding com-mon patterns and correlations between different ASes. Dueto the fact that multiple anomalies of different types can oc-cur on specific points in time, rectangular glyphs are used toencode this additional information. Glyphs have the advan-tage of showing multiple data dimensions in a space efficientcompact way. Each glyph has a fixed size and consists ofseveral colored vertical stripes. Each colored stripe encodesone type of anomaly. The stripe width is proportional to theamount of daily anomalies for the respective event type. Wedecided to chose this additional size encoding to emphasizeon the most prominent anomaly types in the overview, es-pecially when they spread over longer periods of time. Thestripe’s color encoding is based on a qualitative color scaleprovided by Colorbrewer5 and helps to visually distinguish
5http://colorbrewer2.org/
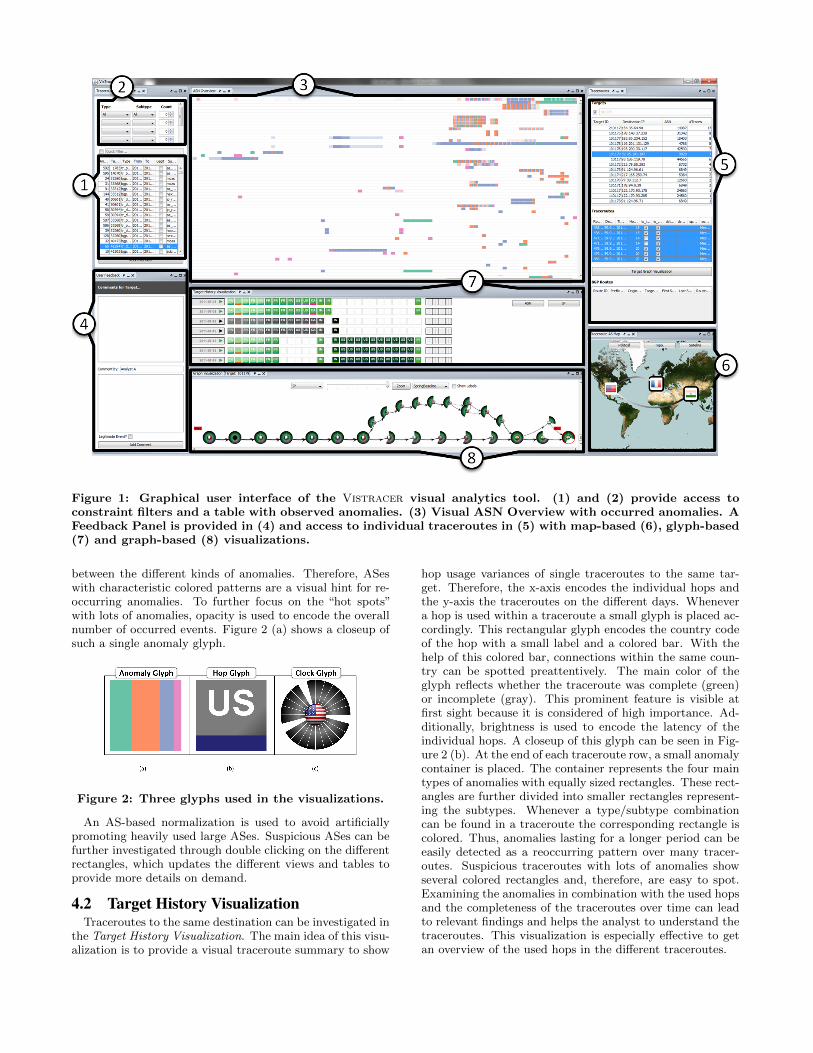
Figure 1: Graphical user interface of the Vistracer visual analytics tool. (1) and (2) provide access toconstraint filters and a table with observed anomalies. (3) Visual ASN Overview with occurred anomalies. AFeedback Panel is provided in (4) and access to individual traceroutes in (5) with map-based (6), glyph-based(7) and graph-based (8) visualizations.
between the different kinds of anomalies. Therefore, ASeswith characteristic colored patterns are a visual hint for re-occurring anomalies. To further focus on the “hot spots”with lots of anomalies, opacity is used to encode the overallnumber of occurred events. Figure 2 (a) shows a closeup ofsuch a single anomaly glyph.
Figure 2: Three glyphs used in the visualizations.
An AS-based normalization is used to avoid artificiallypromoting heavily used large ASes. Suspicious ASes can befurther investigated through double clicking on the differentrectangles, which updates the different views and tables toprovide more details on demand.
4.2 Target History VisualizationTraceroutes to the same destination can be investigated in
the Target History Visualization. The main idea of this visu-alization is to provide a visual traceroute summary to show
hop usage variances of single traceroutes to the same tar-get. Therefore, the x-axis encodes the individual hops andthe y-axis the traceroutes on the different days. Whenevera hop is used within a traceroute a small glyph is placed ac-cordingly. This rectangular glyph encodes the country codeof the hop with a small label and a colored bar. With thehelp of this colored bar, connections within the same coun-try can be spotted preattentively. The main color of theglyph reflects whether the traceroute was complete (green)or incomplete (gray). This prominent feature is visible atfirst sight because it is considered of high importance. Ad-ditionally, brightness is used to encode the latency of theindividual hops. A closeup of this glyph can be seen in Fig-ure 2 (b). At the end of each traceroute row, a small anomalycontainer is placed. The container represents the four maintypes of anomalies with equally sized rectangles. These rect-angles are further divided into smaller rectangles represent-ing the subtypes. Whenever a type/subtype combinationcan be found in a traceroute the corresponding rectangle iscolored. Thus, anomalies lasting for a longer period can beeasily detected as a reoccurring pattern over many tracer-outes. Suspicious traceroutes with lots of anomalies showseveral colored rectangles and, therefore, are easy to spot.Examining the anomalies in combination with the used hopsand the completeness of the traceroutes over time can leadto relevant findings and helps the analyst to understand thetraceroutes. This visualization is especially effective to getan overview of the used hops in the different traceroutes.
4.3 Temporal Graph RepresentationThe previous visualization does not focus on following the
exactly used routes or the identification of the most commonroute in the correct order. To solve this task, an additionalgraph visualization is provided. The graph layout is ex-tended with an additional glyph encoding to show routingchanges over time. The nodes represent the different hops,the edges show the connections with each other. The widthof an edge depends on the amount of traces using this ex-act connection. The nodes are visualized by circular glyphswith equally sized slices and small flags reflecting the coun-try of the hop as can be seen in Figure 2 (c). Because of theaspect ratio, the circular glyphs can directly be integratedinto the graph nodes without wasting additional space forthis temporal information or requiring disturbing and moretime-consuming animation. The number of slices depends onthe amount of traceroutes shown in the graph. The clock-wise arranged slices represent the different traceroutes forthe selected days. When a hop was used in a traceroute therespective slice is colored, otherwise it is not displayed atall. The color depends on whether the traceroute reaches itsdestination or not. This encoding supports the analyst indetecting the main route (i.e., based on the path’s width),the usage of hops (i.e., the proportion of colored slices), thereachability of the destination (i.e., the hue of the coloredslices) and the temporal development of the route (i.e., thepartition of the slices). Additionally, the geographic loca-tion of the corresponding country can be taken into accountin the layout to highlight possible route flappings betweendifferent countries with the help of the graph’s layout. To fo-cus on the main route, we additionally propose an EnhancedBaseline Layout which displays the most common path atthe bottom. The hops, not being part of the baseline arearranged in a force-directed way above the baseline.
Combining the different views or looking at them individ-ually supports the user in the different analysis tasks. Toevaluate the tool’s effectiveness, the following section de-scribes the analyst’s workflow and how the visualizationshelp.
5. CASE STUDIESIn this section we describe how suspicious routing events
are identified and how the Vistracer framework reflectsthis workflow to assist the analyst. We also present twocase studies of routing events identified as suspicious usingthe developed visualization tool.
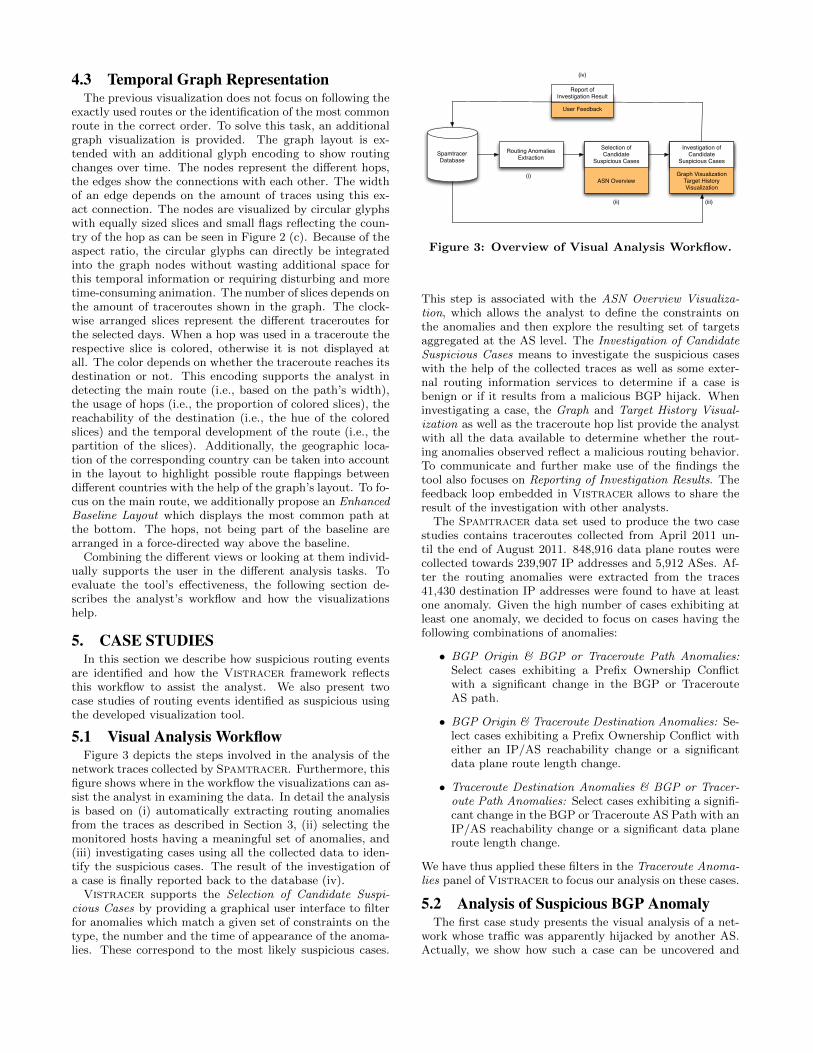
5.1 Visual Analysis WorkflowFigure 3 depicts the steps involved in the analysis of the
network traces collected by Spamtracer. Furthermore, thisfigure shows where in the workflow the visualizations can as-sist the analyst in examining the data. In detail the analysisis based on (i) automatically extracting routing anomaliesfrom the traces as described in Section 3, (ii) selecting themonitored hosts having a meaningful set of anomalies, and(iii) investigating cases using all the collected data to iden-tify the suspicious cases. The result of the investigation ofa case is finally reported back to the database (iv).
Vistracer supports the Selection of Candidate Suspi-cious Cases by providing a graphical user interface to filterfor anomalies which match a given set of constraints on thetype, the number and the time of appearance of the anoma-lies. These correspond to the most likely suspicious cases.
User Feedback
Graph VisualizationTarget History Visualization
ASN Overview
SpamtracerDatabase
Routing AnomaliesExtraction
Selection ofCandidate
Suspicious Cases
Report ofInvestigation Result
Investigation ofCandidate
Suspicious Cases
(i)
(ii) (iii)
(iv)
Figure 3: Overview of Visual Analysis Workflow.
This step is associated with the ASN Overview Visualiza-tion, which allows the analyst to define the constraints onthe anomalies and then explore the resulting set of targetsaggregated at the AS level. The Investigation of CandidateSuspicious Cases means to investigate the suspicious caseswith the help of the collected traces as well as some exter-nal routing information services to determine if a case isbenign or if it results from a malicious BGP hijack. Wheninvestigating a case, the Graph and Target History Visual-ization as well as the traceroute hop list provide the analystwith all the data available to determine whether the rout-ing anomalies observed reflect a malicious routing behavior.To communicate and further make use of the findings thetool also focuses on Reporting of Investigation Results. Thefeedback loop embedded in Vistracer allows to share theresult of the investigation with other analysts.
The Spamtracer data set used to produce the two casestudies contains traceroutes collected from April 2011 un-til the end of August 2011. 848,916 data plane routes werecollected towards 239,907 IP addresses and 5,912 ASes. Af-ter the routing anomalies were extracted from the traces41,430 destination IP addresses were found to have at leastone anomaly. Given the high number of cases exhibiting atleast one anomaly, we decided to focus on cases having thefollowing combinations of anomalies:
• BGP Origin & BGP or Traceroute Path Anomalies:Select cases exhibiting a Prefix Ownership Conflictwith a significant change in the BGP or TracerouteAS path.
• BGP Origin & Traceroute Destination Anomalies: Se-lect cases exhibiting a Prefix Ownership Conflict witheither an IP/AS reachability change or a significantdata plane route length change.
• Traceroute Destination Anomalies & BGP or Tracer-oute Path Anomalies: Select cases exhibiting a signifi-cant change in the BGP or Traceroute AS Path with anIP/AS reachability change or a significant data planeroute length change.
We have thus applied these filters in the Traceroute Anoma-lies panel of Vistracer to focus our analysis on these cases.
5.2 Analysis of Suspicious BGP AnomalyThe first case study presents the visual analysis of a net-
work whose traffic was apparently hijacked by another AS.Actually, we show how such a case can be uncovered and

investigated using the visualizations and other informationprovided by Vistracer.
From the ASN Overview visualization, one particular casecaught our attention, which can be seen in Figure 4. TwoASes actually appeared to share several anomalies, whichoccurred on the same day. The visualization allows to ex-tract such time correlation between anomalies in differentASes thanks to the ASNs and time dimensions. Lookingat the anomalies extracted for the two ASes reveals (i) aTraceroute Destination Anomaly (related to the destinationAS reachability), (ii) Traceroute Path Anomalies, (iii) BGPPath Anomalies (AS Path Deviation) and, (iv) a BGP Ori-gin Anomaly (related to a subMOAS conflict).
Figure 4: Closeup of the ASN Overview showingtwo nearly identical anomaly distributions for twodifferent ASN at the same point in time.
We can make use of the Target History Visualization tohave a first view of the traceroute paths and the uncov-ered routing anomalies. Figure 5 shows the set of IP hopstraversed by traceroutes from the vantage point in Franceto the destination host throughout the monitoring period.From this visualization we can say that there is a noticeablechange in the set of traversed IP hops between the third andthe fourth traceroute. The six routing anomalies uncoveredfor these traceroutes on the fourth day confirm that a ma-jor routing change occurred. In this case, a change in theorigin AS of the destination IP prefix occurred at the sametime as a change in the sequence of ASes traversed both inthe traceroutes and in the BGP AS paths. The BGP OriginAnomaly, in the third column, has been marked as benign(green) by Spamtracer, because the two conflicting ASeswere found to have a provider-customer relationship.
Figure 5: Target History Visualization of the firstcase study: The visualization shows the significantdifference in the ASes traversed between the thirdand fourth day. The routing anomalies observed onthe fourth day are also shown.
To further investigate the case, we make use of the GraphVisualization, which is presented in Figure 6 for the samemonitored host. The Graph Visualization allows the ana-lyst to look at the IP-, AS- or the Country-level traceroutepaths, i.e., the sequence of IP hops, ASes or countries tra-versed. While the AS-level graph is particularly well suited
to investigate abnormal changes in inter-domain routing, theIP- or Country-level graphs can also be leveraged to investi-gate routing anomalies. Actually, they are complementary.It is thus interesting to start from the high-level view of theCountry-level graph and go down the levels to analyze inmore details specific parts of the routes.
In the present case we decide to make use of the AS-levelgraph to compare the sequence of traversed ASes before andafter the change of origin AS. The origin and destination ASbefore the change belongs to a backbone ISP, which adver-tises an aggregated IP prefix including the destination IPprefix. The unreachability of the destination AS after thechange can be observed on day four and correlated with theTraceroute Destination Anomaly seen on the same day in theTarget History Visualization. Also, the last AS that couldbe reached by traceroutes appears in the collected BGP ASpaths, as the next-hop AS, which is the direct upstreamprovider, of the new origin AS. This provider-customer re-lationship could not be officially explained. Hijacking a net-work can actually be performed by advertising it with acorrect origin AS and by putting the attacking AS as thenext-hop AS.
Figure 6: The Graph Visualization shows the signif-icant difference in the ASes traversed between thethird and fourth day.
After an investigation, it turned out that the next-hop ASbelonged to a company providing DDoS mitigation as ser-vice by sink holing the attacking traffic of their customers.The analysis suggests that either the security company redi-rected the traffic of their customer’s AS because they wereunder attack or the security company may sometimes act asan ISP for some companies’ AS to easily protect them fromundesired traffic. Given the fact that the security companyadvertised the route in BGP for at least three days, we be-lieve that it actually acted as an ISP for its customer.
Although we have detected abnormal routing changes re-garding this network, it is quite difficult to validate theseanomalies as a real hijack case since we lack the feedbackfrom the owner of the network.
5.3 Link Telecom BGP HijackThis second case study presents the visual analysis of a
validated BGP hijack performed by a spammer to send spamfrom the stolen IP address space. The hijacking spammerphenomenon has already been observed in [11, 5] and con-sists of spammers taking control of unused IP address spacein order to send spam from clean, non-blacklisted IP ad-dresses.
From the ASN Overview (Figure 7), AS31733 caught ourattention, because many diverse routing anomalies occurredwithin a limited period of time. Moreover, several anomaliesoccurred on the same day, which reinforced the idea that amajor routing change occurred at that time for this AS. The

uncovered anomalies related to AS31733 include (i) Tracer-oute Destination Anomalies (related to the destination hostand AS reachability), (ii) Traceroute Path Anomalies and,(iii) BGP AS Path Anomalies (AS Path Deviation).
Figure 7: The ASN Overview of AS31733 revealsmany different anomalies over a longer period oftime.
The Target History Visualization of a monitored host withinAS31733 exhibiting a combination of Traceroute DestinationAnomalies, Traceroute Path Anomalies and BGP AS PathAnomalies. Figure 8 presents the Target History Visualiza-tion which shows the set of ASes traversed by traceroutesfrom the vantage point in France to AS31733 throughout themonitoring period. We can clearly see that the set of tra-versed ASes changes significantly. By looking at the anoma-lies extracted for that case, we can also see that all anomalieswere observed on a particular day, i.e., just after the changein the traceroute path. The observation of the set of IPhosts traversed by the traceroutes shows the exact same be-havior. From these observations we can say that the locationof the monitored AS in the Internet AS topology changedsignificantly.
Figure 8: The Target History Visualization showsthe significant difference in the set of ASes tra-versed between the fourth and fifth day. The routinganomalies observed are also shown.
Figure 9 presents the Graph Visualization of the samemonitored host within AS31733. This visualization showsthe sequence of IP hops, ASes or countries traversed by thetraceroutes. In this case, looking at the Country-level pathswould show that packets always seem to go through the USto go from a source in France to a destination in Russia.While this routing behavior can be considered abnormal,we also know that some big ISPs, i.e., backbone ISPs, arespread across continents and may be introduce US hops in aEuropean route. If we now look at the AS-level graph we cansee that US ISPs Level-3 (AS3356) and Internap (AS12182)both appear in the routes. Besides being a backbone ISP,Level-3 also appears in every traceroute during the moni-
toring period. However, Internap only appears in the firsttraceroute, before the routing change. To have more detailsabout the traceroute going through AS12182 Internap, wecan have a look at the IP-level graph. The graph reveals thatthe first traceroute goes through two routers of AS12182 ap-parently located in the US and then directly ends in AS31733apparently located in Russia. This suggests that the desti-nation host currently using an IP of AS31733 is likely locatedin the US instead of Russia. Furthermore, the visualizationalso shows that the destination host and AS could not bereached from the fifth day until the end of the monitoringperiod. This observation is corroborated by the TracerouteDestination Anomalies (related to the host/AS reachability)uncovered on the fifth day. All this suggests that the rout-ing change observed lead to the destination host and AS tobecome unreachable.
Figure 9: The Graph Visualization shows the signifi-cant difference in the sequence of ASes traversed. Italso highlights the unreachability of the destinationAS after the routing change occurred.
After the investigation, it turns out that on August 20th
2011 the network administrator of the Russian telecommu-nication company “Link Telecom”, whose AS31733 belongsto, complained on the North American Network Operators’Group (NANOG) mailing list that his network had beenhijacked by a spammer [1]. On both August 25th and Au-gust 29th 2011 changes were observed in the traceroutes andBGP routes towards AS31733. These changes were the re-sult of the owner regaining control over his network. Inthis case, the aggregation in the ASN Overview of the rout-ing anomalies extracted for the individual monitored hostswithin their AS actually uncovered the pattern of severaldiverse and timely close routing anomalies.
This hijack case is further described in [14]. Althoughthe prefix appeared to be announced by the correct originAS, i.e., AS31733, it was routed via a US ISP called Inter-nap (AS12182). During this period the network was underthe control of the spammer, spam messages were receivedby Symantec.cloud honeypots. The hijack lasted for fivemonths from April 2011 until August 2011 and is a vali-dated case of a hijacking spammer that managed to stealsomeone else’s IP space and sent spam from it.
6. CONCLUSIONIn this work we presented a novel visual analytics tool
called Vistracer to investigate routing anomalies and BGPhijacks. In particular, spamming activities were monitoredwith the help of a large-scale traceroute collection system.Special care was taken to design Vistracer to support theworkflow of analyzing the large-scale dataset according tothe analysts’ needs. The tool’s flexibility is derived from theintegration of several linked data views and visualizationsinto a powerful analysis suit, which can address a varietyof analysis questions. Furthermore, the usefulness and ef-
fectiveness of Vistracer for network security analysts wasdemonstrated in two case studies.
In the future we will integrate different additions to fur-ther improve the usability of the tool. Regular usage ofVistracer by our analysts will also show, which additionalviews should be integrated. To improve the scalability ofthe graph representation, further layout improvements willbe made to reduce possible clutter of traceroutes with verycomplex connections and to incorporate missing hops in thelayout.
7. ACKNOWLEDGMENTSThe research leading to these results has received funding
from the European Commission’s Seventh Framework Pro-gramme (FP7/2007-2013) under grant agreement no. 257495,“Visual Analytic Representation of Large Datasets for En-hancing Network Security” (VIS-SENSE).
8. REFERENCES[1] Prefix hijacking by michael lindsay via internap.
http://mailman.nanog.org/pipermail/nanog/
2011-August/039381.html, August 2011.
[2] H. Ballani, P. Francis, and X. Zhang. A study of prefixhijacking and interception in the Internet. InProceedings of the 2007 conference on Applications,technologies, architectures, and protocols for computercommunications, SIGCOMM ’07, pages 265–276, NewYork, NY, USA, 2007. ACM.
[3] R. Bush and R. Austein. The RPKI and OriginValidation, June 2009.
[4] L. Colitti, G. Di Battista, F. Mariani, M. Patrignani,and M. Pizzonia. Visualizing Interdomain Routingwith BGPlay. Journal of Graph Algorithms andApplications, 9(1):117–148, 2005.
[5] X. Hu and Z. M. Mao. Accurate Real-TimeIdentification of IP Prefix Hijacking. In Proceedings ofthe 2007 IEEE Symposium on Security and Privacy,SP ’07, pages 3–17, Washington, DC, USA, 2007.IEEE Computer Society.
[6] S. Kent. Securing the Border Gateway Protocol: AStatus Update. In In Seventh IFIP TC-6 TC-11Conference on Communications and MultimediaSecurity, pages 2–3, 2003.
[7] M. Lad, D. Massey, D. Pei, Y. Wu, B. Zhang, andL. Zhang. Phas: A prefix hijack alert system. In Proc.USENIX Security Symposium, 2006.
[8] M. Lad, D. Massey, and L. Zhang. Visualizing internetrouting changes. IEEE Transactions on Visualizationand Computer Graphics, pages 1450–1460, 2006.
[9] J. Oberheide, M. Karir, and D. Blazakis. VAST:visualizing autonomous system topology. InProceedings of the 3rd international workshop onVisualization for computer security, pages 71–80.ACM, 2006.
[10] J. Qiu and L. Gao. Detecting bogus bgp routeinformation: Going beyond prefix hijacking. Technicalreport, In Proc. SecureComm, 2007.
[11] A. Ramachandran and N. Feamster. Understandingthe network-level behavior of spammers. InSIGCOMM ’06: Proceedings of the 2006 conference onApplications, technologies, architectures, and protocols
for computer communications, pages 291–302, NewYork, NY, USA, 2006. ACM.
[12] J. Shearer, K. Ma, and T. Kohlenberg. BGPeep: AnIP-Space Centered View for Internet Routing Data.Visualization for Computer Security, pages 95–110,2008.
[13] B. Shneiderman. The Eyes Have It: A Task by DataType Taxonomy for Information Visualizations. InProceedings 1996 IEEE Symposium on VisualLanguages, pages 336–343. IEEE Computer Society,1996.
[14] Symantec Corporation. Symantec Internet SecurityThreat Report.http://www.symantec.com/threatreport/, April2012.
[15] M. Tahara, N. Tateishi, T. Oimatsu, and S. Majima.A Method to Detect Prefix Hijacking by Using PingTests. In APNOMS ’08: Proceedings of the 11thAsia-Pacific Symposium on Network Operations andManagement, pages 390–398, Berlin, Heidelberg, 2008.Springer-Verlag.
[16] S. T. Teoh, K. L. Ma, S. F. Wu, and X. Zhao. Casestudy: interactive visualization for internet security. InProceedings of the conference on Visualization ’02,VIS ’02, pages 505–508, Washington, DC, USA, 2002.IEEE Computer Society.
[17] S. T. Teoh, S. Ranjan, A. Nucci, and C.-N. Chuah.Bgp eye: a new visualization tool for real-timedetection and analysis of bgp anomalies. In VizSEC’06: Proceedings of the 3rd international workshop onVisualization for computer security, pages 81–90, NewYork, NY, USA, 2006. ACM.
[18] S. T. Teoh, K. Zhang, S.-M. Tseng, K.-L. Ma, andS. F. Wu. Combining visual and automated datamining for near-real-time anomaly detection andanalysis in bgp. In VizSEC/DMSEC ’04: Proceedingsof the 2004 ACM workshop on Visualization and datamining for computer security, pages 35–44, New York,NY, USA, 2004. ACM.
[19] P.-A. Vervier and O. Thonnard. Spamtracer: UsingTraceroute To Tracking Fly-By Spammers (underreview). In The 8th International Conference onemerging Networking EXperiments and Technologies,CoNEXT ’12, Nice, France, 2012. ACM.
[20] T. Wong and C. Alaettinoglu. Internet routinganomaly detection and visualization. In DependableSystems and Networks, 2005. DSN 2005. Proceedings.International Conference on, pages 172–181. IEEE,2005.
[21] Z. Zhang, Y. Zhang, Y. Charlie, H. Z. Morley, andM. R. Bush. iSPY: Detecting IP Prefix Hijacking onMy Own. In In Proc. ACM SIGCOMM, 2008.
[22] C. Zheng, L. Ji, D. Pei, J. Wang, and P. Francis. Alight-weight distributed scheme for detecting IP prefixhijacks in real-time. In Proceedings of the 2007conference on Applications, technologies, architectures,and protocols for computer communications,SIGCOMM ’07, pages 277–288, New York, NY, USA,2007. ACM.