visual attention guided bit allocation in video...
TRANSCRIPT

Image and Vision Computing 29 (2011) 1–14
Contents lists available at ScienceDirect
Image and Vision Computing
j ourna l homepage: www.e lsev ie r.com/ locate / imav is
Visual attention guided bit allocation in video compression
Zhicheng Li a,b, Shiyin Qin a, Laurent Itti b,⁎a School of Automation Science and Electrical Engineering, Beihang University, Beijing, Chinab Computer Science Department, University of Southern California, Los Angeles, CA, USA
⁎ Corresponding author. University of Southern CaliBuilding, room HNB-07A - 3641 Watt Way, Loa AngTel./fax: +1 (213) 740 3527/5687.
E-mail address: [email protected] (L. Itti).
0262-8856/$ – see front matter © 2010 Elsevier B.V. Aldoi:10.1016/j.imavis.2010.07.001
a b s t r a c t
a r t i c l e i n f oArticle history:Received 2 November 2009Received in revised form 13 May 2010Accepted 12 July 2010
Keywords:Visual attentionVideo compressionEye-trackingVideo subjective quality
A visual attention-based bit allocation strategy for video compression is proposed. Saliency-based attentionprediction is used to detect interesting regions in video. From the top salient locations from the computedsaliency map, a guidance map is generated to guide the bit allocation strategy through a new constrainedglobal optimization approach, which can be solved in a closed form and independently of video framecontent. Fifty video sequences (300 frames each) and eye-tracking data from 14 subjects were collected toevaluate both the accuracy of the attention prediction model and the subjective quality of the encoded video.Results show that the area under the curve of the guidance map is 0.773±0.002, significantly above chance(0.500). Using a new eye-tracking-weighted PSNR (EWPSNR) measure of subjective quality, more than 90%of the encoded video clips with the proposed method achieve better subjective quality compared to standardencoding with matched bit rate. The improvement in EWPSNR is up to over 2 dB and on average 0.79 dB.
fornia - Hedco Neuroscienceseles, CA 90089-2520 - USA.
l rights reserved.
© 2010 Elsevier B.V. All rights reserved.
1. Introduction
Significant improvements in video coding efficiency have beenachieved with modern hybrid video coding methods such as H.264/AVC [1,2] in the last two decades. Spatial and temporal redundancy invideo sequences has been dramatically decreased by introducingintensive spatial–temporal prediction, transform coding, and entropycoding. However, to achieve better compression performance,reducing such kind of so-called objective redundancy is limited andhighly complex in computation.
On the other hand, research on human visual characteristics showsthat people only perceive clearly a small region of 2–5° of visual angle.The human retina possesses a non-uniform spatial resolution ofphotoreceptors, with highest density on that part of the retina alignedwith the visual axis (the fovea), and the resolution around the foveadecreases logarithmically with eccentricity [3]. What's more, researchresults show that observers' scanpaths are similar, and predictable tosome extent [3]. These research results provide a new pathway tocompress images/videos based on human visual characteristics: onlyencode a small number of well selected interesting regions (attentionregions) with high priority to keep a high subjective quality, whiletreating less interesting regions with low priority to save bits.
Recently, many subjective quality-based video coding methodshave been developed. According to the way of obtaining attentionregions, they can be coarsely classified into four categories, as follows:
(1) In the first approach, considering that human attention predictionis still an open problem, human–machine interaction methods areadopted to obtain the attention regions. One example of onlinehuman–machine interactive methods is gaze-contingent video trans-mission, which uses an eye-tracking device to record eye positionfrom a human observer on the receiving end and applies in real-time afoveation filter to the video contents at the source [4–8]. Thisapproach is particularly effective because observers usually do notnotice any degradation of the received frames, since high-qualityencoding continuously follows the high-acuity central region of theobservers' foveas. However, this application is restricted to specificcases where an eye-tracking apparatus is available at the receivingend. For general-purpose video compression, this approach facessevere limitations if an eye-tracker is not available or several viewersmay watch a video stream simultaneously. To address this, offlineinteractive methods are designed to obtain the interesting regions byasking subjects to manually draw regions which are interesting, andthen applying this to the encoding procedure [9]. (2) The second classof approaches uses machine vision algorithms to automatically detectinteresting regions. For instance, due to the importance of humanfaces while people perceive the world [10,11], it is reasonable toconsider that human facesmay likely constitute interesting regions. In[12–14], face regions are thus defined as the regions-of-interest. Facedetection and tracking methods are explored to keep the interestingregions focused onto human faces, and more resources are allocatedduring encoding to these face regions, to keep these regions in highquality.With the development of face detection algorithms and objecttracking methods in machine vision, this kind of video compression isvery effective in the occasions where human faces indeed are centralto the visual understanding of a video sequence, such as for video

2 Z. Li et al. / Image and Vision Computing 29 (2011) 1–14
telephone or video conference. However, this type of approach isobviously only workable when human faces are present. Forunconstrained video compression where there may or may not befaces in the streams to be encoded, this method will fail to findinteresting regions. (3) The third class of approaches uses knowledgeabout human psychophysics to guide the encoding process. Forexample, research results show that the human visual system (HVS)can tolerate certain amounts of noise (distortion) depending on itssensitivity to the source and type of noise for a given region in a givenframe. Under certain conditions, the HVS can tolerate more distortionthan the objective distortion measurements such as mean squareerror (MSE) would predict; on the other hand, there are some types ofdistortions which, despite low MSE, are vividly perceived and impairthe viewing experience [15–17]. Based on this theory, many image/video encoding techniques have sought to optimize perceptual ratherthan objective (MSE) quality: these techniques allocate more bits tothe image areas where human can easily see coding distortions, andallocate fewer bits to the areas where coding distortions are lessnoticeable. Experimental subjective quality assessment results showthat visual artifacts can be reduced through this approach; however,there are two problems: one is that the mechanisms of humanperceptual sensitivity are still not fully understood, especially ascaptured by computational models; the other is that perceptualsensitivity may not necessarily explain people's attention. Forexample, smoothly textured regions and objects with regular motionsoften belong to the background of a scene and do not necessarily catchpeople's attention, but these types of regions are highly perceptuallysensitive if attended to. (4) The fourth class of approaches exploitsrecent computational neuroscience models to predict which regionsin video streams are more likely to attract human attention and to begazed at. With the development of brain and human vision science,progress has been made in understanding visual selective attention ina plausible biological way, and several computational attentionmodels have been proposed [18–20]. In these models, low-levelfeatures such as orientation, intensity, motion, etc. are first extracted,and then through nonlinear biologically inspired combination of thesefeatures, an attention map (usually called saliency map) can begenerated. In this map, the interesting locations are highlighted andthe intensity value of the map represents the attention importance.Under the guidance of the attention map, resource can be allocatednon-uniformly to improve the subjective quality or save thebandwidth [21–24]. Although such research shows promising results,it is still not a completely resolved problem.
Once interesting regions are extracted, a number of strategies havebeen proposed to modulate compression and encoding quality ofinteresting vs. uninteresting regions [21,25–29]. One straightforwardapproach is to reduce the information in the input frames. In [4,21,22],the frames to be encoded are first blurred (foveated) according to theattentionmap. The foveated image only keeps the attention regions inhigh quality while the other regions are all blurred. Through theblurring, redundancy is reduced significantly, and the compressionratio can be several times higher than the normal encoding method.However, blurring yields obvious degradation of subjective quality inthe low saliency regions. In [23], a bit allocation scheme throughtuning the quantization parameter is proposed with a constrainedglobal optimization approach. Results show that 60% of the test videosequences encoded by this approach have better subjective visualquality compared to the video encoded by the normal method underthe same bandwidth. In rate-distortion optimization, different modemay get different video quality and bit rate. The mode decision isusually determined by minimize the cost function which is the sum ofencode error and bit rate multiple by a parameter (called Lagrangemultiplier). Considering that the Lagrange multiplier will affect themode decision in rate-distortion optimization, a Lagrange multiplieradjustment method is explored in [25]. An optimized rate controlalgorithm with foveated video is proposed in [26], and foveal peak
signal-to-noise ratio (FPSNR) is introduced as subjective qualityassessment. In [28], a region-of-interest based resource allocationmethod is proposed, in which the quantization parameter, modedecision, number of referenced frames, accuracy of motion vectors,and search range of motion estimation are adaptively adjusted at themacroblock (MB) level according to the relative importance (obtainedfrom the attention map) of each MB.
How to evaluate the quality of a compressed image/video is still anopen problem.Many quality assessment metrics have been developedto evaluate the objective or subjective quality of video. Among them,MSE and PSNR are two widely adopted objective quality measure-ments, even though they often are not consistent with humanperception. Many additional types of objective (including humanvision-based objective) quality assessment methods have beenproposed [26,30–32]. However, the research results of the videoquality experts group (VQEG) show that there is no objectivemeasurement which can reflect the subjective quality in all condi-tions [33]. The suggested subjective quality from VQEG was obtainedby using the mean opinion score (MOS) from pool of human subjects.Specifically, subjective quality scales ranging between excellent, good,fair, poor and bad (weight values are 5, 4, 3, 2, and 1, respectively) canbe obtained from naive observers, and the weighted mean MOS scorecan be used as the subjective quality.
In this paper, we use a neurobiological model of visual attention,which automatically selects (predicts) high saliency regions inunconstrained input frames to generate a saliency map (SM).Considering the human's foveated retina characteristic, a guidancemap (GM) is generated by finding the top salient locations in thesaliency map. The GM is then used to guide the bit allocation in videocoding through tuning the quantization parameters in a constrainedoptimization method. The overview of the proposed method can beseen in Fig. 1. For experimental validation, 50 high-definition(1920×1080) video sequences were captured using a raw uncom-pressed video camera, which include scenes at a library, pool, roadtraffic, gardens, a dinner hall, lab rooms, etc. Instead of using asubjective rating method, an eye-tracking experiment which recordshuman subjects' eye fixation positions over the video frames wasconducted to validate both the attention prediction model and thecompressed video subjective quality. The focus of this paper is tocombine the attention model with the latest video compressionframework, and to validate the result in a quantitative way through aneye-tracking approach. The experiment results showthat the proposedmethod is effective in both predicting human attention regions andimproving subjective video quality while keeping the same bit rate.
The present paper complements our previous work [21], in whichwe showed that a saliency map model can predict human gaze wellabove chance, and can be used to guide video compression throughselective blurring of low-salience image regions. The key innovationin the present work is to replace the selective blurring step, whichyields quite obvious distortions in low-salience video regions, with amore sophisticated and more subtle localized modulation of theH.264 encoding parameters. Our new algorithm employs a con-strained global optimization approach to derive the encodingparameters at every location in every video frame. We find thatthe optimization can be solved in closed form, which gives rise to anefficient implementation. This new optimization approach is animportant step as it yields encoded videos that subjectively look verynatural and are not degraded by blurring. Further, we develop andtest a new eye-tracking weighted PSNR (EWPSNR) measure ofsubjective quality. Using this measure, we find that videoscompressed with the proposed technique have better EWPSNR onour test video clips. Because our proposed method is purelyalgorithmic, requires no human intervention or parameter tuning,is applicable to a wide variety of video scenes, and yields improvedEWPSNR, we suggest that it could be integrated to future genera-tions of general-purpose video codecs.

Fig. 1. Overview of the model. For the attention model path, the current input frame is first decomposed into multi-scale analysis with channels sensitive to low-level visual features(two color contrasts: blue–yellow, red–green; temporal flicker; intensity contrast; four orientations, 0°, 45°, 90°, and 135°; and for directional motion energies, up, right, down, andleft). The saliency map is obtained after within-channel within-scales and cross-scales nonlinear competition. Assuming that the top salient locations in the saliency map are likely toattract attention and gaze of viewers, a guidance map is generated by foveating these positions. On the compression path, the current macroblocks (MBs) are predicted by previousencoded frame MBs through intra (which means the prediction result is generated from the current frame) or inter (which means the prediction result is generated from theprevious frame) mode. The prediction error (difference) is then passed through transform and quantization; here the generated guidance map is used to adjust the quantizationparameters to realize the non-uniform bit allocation. An encoded frame is complete after quantization and entropy encoding.
3Z. Li et al. / Image and Vision Computing 29 (2011) 1–14
2. Method
2.1. Attention model
The model computes a topographic saliency map which indicateshow conspicuous every location in the input image is. We used thefreely available implementation of the Itti–Koch saliency model[34]. In this model, an image is analyzed along multiple low-levelfeature channels to give rise to multi-scale feature maps, whichdetect potentially interesting local spatial discontinuities usingsimulated center-surround neurons. Twelve feature channels areused to simulate the neural features which is sensitive to colorcontrasts (red/green and blue/yellow), temporal intensity flicker,intensity contrast, four orientations (0°, 45°, 90°, and 135°) and fouroriented motion energies (up, down, left, and right). The particularlow-level features extracted here have been shown to attractattention in humans and monkeys, as had been previously inves-tigated in details [19,35,36]. Center-surround scales are obtainedfrom dyadic pyramids with 9 scales, from scale 0 (the originalimage) to scale 8 (the image reduced by factor to 28=256 in boththe horizontal and vertical dimensions). Six center-surrounddifference maps are then computed as point-to-point differenceacross pyramid scales, for combination of three center scalesc = f2;3;4gð Þ and two center-surround scale differencesδ = f3;4gð Þ. Thus, six feature maps are computed for each of the12 features, yielding a total of 72 feature maps. Each feature map isadditionally endowed with internal dynamics that provide a strongspatial within-feature and within-scale competition for activity,followed by within-feature, across-scale competition [37]. In thisway, initially possibly very noisy feature maps are reduced to sparserepresentations of only those locations which strongly stand outfrom their surroundings. All feature maps finally contribute to theunique scalar saliency map, which represents visual conspicuity ofeach location in the visual field.
After the saliency map is computed, a small number of discretevirtual foveas endowed with mass/spring/friction dynamics attemptto track a collection of most salient objects, using proximity as wellas feature similarity to establish association between n salientlocations and p fovea centers (similar to the approach described in
our previous work [21,22]). The association is established throughan exhaustive scoring of all n×p possible parings between a newsalient location Xt
A(i)=(xtA(i), ytA(i)), i∈ {1...n} and an old foveationcenter Xt( j)=(xt( j), yt( j)), j∈ {1...p} at time t. (Typically, p is fixedand n=p+4 to ensure robustness against varying saliency orderingfrom frame to frame, p=10 in the present implementation). Fourcriteria are included to determine the correspondence: (1) Euclid-ean spatial distance between the locations of i and j; (2) Euclideandistance between feature vectors extracted at the locations of i and jwhich coarsely capture the visual appearance of each of the twolocations; (3) a penalty term ji−jj that discourages permutingprevious pairings by encouraging a fixed ordered pairing; and (4)a tracking priority that increases with salience, enforcing strongtracking of only very salient objects. Combining these criteria tendsto assign the most salient object to the first fovea, the second mostsalient object to the second fovea, etc. Video compression priority atevery location is then related to the distance to the closest foveacenter (using a 2D chamfer distance transform). For implementationdetails, please refer to [21] and [34]. It is important to note that thedynamics of the virtual foveas do not attempt to emulate humansaccadic eye movement but track salient objects in a smooth anddamped manner. The adopted correspondence and tracking algo-rithm compromises between reliably tracking the few most salientobjects, and time-sharing remaining foveas among a larger set of lesssalient objects.
2.2. Bit allocation strategy
Assume that the rate-distortion (R-D) function is as follows [23,38]for a given region (typically, macroblock) i in an image:
DiðRiÞ = σ2i�e−γRi ð1Þ
in which Di denotes the mean square error, Ri stands for the bit rate,and σi
2 is a measurement of the variance of the encoding signal (bothspatial and temporal) and describes the complexity of the videocontent, γ is a constant coefficient. This approach assumes that thedistortion is to be computed in a uniform manner, i.e., distortion indifferent areas of an image is equally important. However, if we take

4 Z. Li et al. / Image and Vision Computing 29 (2011) 1–14
the human's visual spatial resolution into consideration, then theencoding distortion in area i can be written as follows:
D′i = wi
�Di ð2Þ
here wi is the weight coefficient, it stands for the human's spatialresolution in area i. In the area around the center of gaze (the fovea),wi should be higher than in areas far from the gaze position, becauseeven small distortions in the foveal region can cause people'sawareness while in peripheral regions relatively larger distortionsmay not catch people's attention.
According to this non-uniform distribution of human eye resolu-tion, there are two ways to optimize the bit allocation in encoding.One is as proposed in [23]: keep the sum of bit rate as a constant valueandmaximize the subjective quality. Under the hypothesis that σi
2 areequal at every location, the conclusion is then that the quantizationparameter QPi is inverse exponentially with the optimized bit rate:
Ri = R +1
γNS∑j≠i
Sj⋅ logwi
wjði = 1;2:::NÞ ð3Þ
QPi = eα−Ri
β ð4Þ
where S is the area size of the entire frame, Si is the area of region i,N isthe region number in one frame. α accounts for overhead bits and β isthe adjustment parameter. However, in reality, σi
2are quite differentover space within one frame and it is hard to determine the para-meters correctly. In [23], the parameters are calculated from trainingvideos that are similar to those to be encoded by the system, which istime consuming and may be unreliable if the test set differssubstantially from the training set. To avoid this, we take a differentapproach: preserve the subjective quality while minimizing the bitrate. With this method, we find that the optimized distortiondistribution is independent of the video frame contents and onlydepends on theweight coefficients. The details of this newmethod aredescribed as follows:
To minimize the bit rate while keeping the subjective quality thesame, we can write this global optimization problem as follows:
Min∑i
Si �Ri = S
s:t:∑i
wi�Di =W = D
8<: ð5Þ
hereW is the sum of all of the weight coefficients in different areas, Dis the target distortion. With the Lagrange multiplier method we cansolve this equation in closed form:
f ðD1;D2;…DNÞ = ∑i
si �Ri = S + λð∑i
wi�Di =W−DÞ
Ri =1γðlog σ 2
i − log DiÞ
8>><>>: ð6Þ
in which N is the number of areas in the encoded image. To obtain theminimum value, we pose that, at the minimum:
∂f∂D1
=∂f∂D2
= … =∂f∂DN
= 0 ð7Þ
Solving these equations above, we obtain:
Di =W �siwi
�S�D ði = 1;2;…;NÞ ð8Þ
We can see from this equation that the optimum Di is independentof the video characteristic related parameters γ and σi. Hence theoptimum process can be applied to any video no matter what thecontent of the video is, and we need not train on any sample videos to
compute the optimum parameters. Furthermore, from the Eq. (8) wecan see that the optimized distortion should be inversely proportionalto theweight coefficient. One special condition is when all weights areequal over all locations, in which case the distortion should be equallydistributed.
Now we can determine the bit allocation strategy with thecalculated distortion distribution. In mainstream video compressionschemes developed so far, the distortion stems only from quantiza-tion. The basic quantization operation is as follows:
Y = round X =Q step
� �ð9Þ
where X usually is the coefficient after the transform (DCT, DWT, etc.),Q step is the quantization step and Y is the quantized result. TheQ step-distortion mapping is linear and we can simply write theQ step-distortion (Q-D) model as follows:
D = k�Q step ð10Þ
where k is a constant coefficient related to the video content. Then theoptimized distortion for each area transformed to the optimizedquantization step is, at every location i:
Q istep =W �siwi
�S Q step ð11Þ
The formula above shows that in the human visual characteristicbased video coding, the quantization step should be inverselyproportional to the subjective quality weight coefficient.
According to the analysis above, we can apply the GM to guide thequantization parameter adjustment to conduct the optimized bitallocation. The GM values can be seen as the subjective weightcoefficients and the quantization parameters then can be computedfrom above formula.
3. Video acquisition
Fifty video clips (1920×1080) were collected for this experimentand each of them was cut to 300 frames (Fig. 2). All these clips werecaptured by a Silicon Imaging SI-1920HD camera with an EPIX E4frame grabber card at frame rate of 30±0.2 fps. The original frameswere captured as Bayer format without any compression and saved inround-robin onto 4 separate hard drives to avoid limitations in framerate due to limited disk bandwidth. The clips were captured aroundthe USC campus and include both outdoor and indoor scenes atdaytime. The outdoor scenes include library, pool, traffic road,gardens, museum, park, gates, fountains, square, lawn, track & field,and the indoor scenes include dinner hall, lab rooms, etc. After videocapture, all the frames were converted to RGB color images throughlinear interpolation [39] and enhanced by gamma correction. Finallythe frames were assembled into video clips in the YUV (4:2:0) formatfor further processing.
To facilitate future research, this raw uncompressed video dataset,as well as all the eye-tracking data described below, are made freelyavailable on the Internet (http://iLab.usc.edu/vagba/). We hope thatthis comprehensive dataset and the associated human eye move-ments can benefit a number of research projects aiming at improvingvideo compression quality, and beyond.
4. Human eye-tracking
The collected 50 uncompressed YUV format video clips werepresented to 14 subjects and their eye fixation points were recordedover frames from each clip by an eye-tracker machine. The recordedeye traces represent the subjects' shifting overt attention, thus the

Fig. 2. Example of captured frames, first row: dance01, seagull01, and garden09, second row: road02, fountain01 and robarm01, third row: park01, gate03 and lot01, fourth row:foutain05, room02 and field06.
5Z. Li et al. / Image and Vision Computing 29 (2011) 1–14
eye-tracking data are qualified to validate the performance of theattention prediction model and the visual subjective quality.
Subjects were naïve to the purpose of the experiment and hadnever seen these video clips before. They were also naïve to attentiontheory, saliency theory, and video compression theory. Theywere USCstudents and staff (7 males, 7 females, mixed ethnicities, ages 22–32,normal or corrected-to-normal vision). Theywere instructed to watchthe video clips without any specific task, and to attempt to follow
Fig. 3. Eye fixation distribution examples. The maps are histogrammed over 10×10 image tiltoward the center of the display. (b) Eye fixation distribution from one of the subjects over
whatever interesting things they might like. Later they were askedsome general questions about what they hadwatched. Themotivationof these instructions was to try to make the experiment similar toordinary video watching. We believe that our instructions did not biassubjects toward low-level salient frame locations as defined by theItti–Koch Model [18].
Stimuli were presented on a Sony Bravia XBR-III 46″ 60 Hz 1080 pLCD-TV display connected to a Linux computer. Subjects were seated
es and normalized to 1. (a) The overall distribution for all subjects and clips shows a biasall the clips.

Fig. 5. Ordinal dominance analysis, there are 1,455,279 fixation points in total.(a) Histogram of guidance map values at eye positions and random locations.(b) Ordinal dominance curve, the dashed line is the chance level.
6 Z. Li et al. / Image and Vision Computing 29 (2011) 1–14
on an adjustable chair at a viewing distance of 97.8 cm, whichresponded to a field of view of 54.8×32.7°, and rested on a chin-rest. Anine-point eye-tracker calibration was performed every ten clips.Each calibration point consisted of fixating first a central cross, then ablinking dot at a random point on a 3×3 matrix covering the screenarea. For each clip, subjects first fixated a central cross, pressed a keyto start, at which point the eye-tracker was triggered, the crossblinked for 1066 ms, and the clip started. After each clip, the displaybecame grey and the eye-tracker was disabled. The experiment wasself-paced: the next clip was shown when the subject pressed thespace button. Every ten clips, subjects could stretch before the nine-point calibration. Stimuli were presented on a Linux computer, underSCHED_FIFO scheduling (process would keep 100% of the CPU as longas needed) to guarantee timing. Each uncompressed clip(1920×1080, YUV 4:2:0 format)was entirely preloaded intomemory.Frame displays were hardware-locked to the vertical retrace of themonitor (one movie frame was shown for two screen retraces,yielding a playback rate of 30.00 fps). Microsecond-accurate time-stampswere stored inmemory as each framewas presented, and latersaved to disk to check for dropped frames. No frame drop everoccurred and all timestamps were spaced by 33.333±0.001 ms. Eyeposition was tracked using a 240-Hz infrared-video-based eye-tracker(ISCAN, Inc., model RK-464). Methods were similar to previouslydescribed [21]. In brief, this machine estimates point of regard (POR)in real-time from comparative tracking of both the center of the pupiland the specular reflection of the infrared light source on the cornea.This technique renders POR measurements immune to small headtranslations (tested up to 10 mm in our laboratory). All analysis wasperformed offline. Linearity of the machine's POR-to-stimuluscoordinate mapping was excellent, as previously tested using a 7×5calibration matrix in our laboratory, justifying a 3×3 here. The eye-tracker calibration traces were filtered for blinks and segmented intotwo fixation periods (the central cross, then the flashing point), ordiscarded if that segmentation failed a number of quality controlcriteria. An affine POR-to-stimulus transform was computed in theleast-square sense, outlier calibration points were eliminated, and theaffine transform was recomputed. If fewer than six points remainedafter outlier elimination, recordings were discarded until the nextcalibration. Otherwise, a thin-plate-spline nonlinear warping wasthen applied to account for any small residual nonlinearity. Data wasdiscarded until the next calibration if residual errors greater than34 pixels (about 1° field of view) on any calibration point or 17 pixels(about 0.5° field of view) overall remained. Eye traces for the ten clipsfollowing a calibration were remapped to screen coordinates, ordiscarded if they failed some quality control criteria (excessive eye-blinks, motion, eye wetting, or squinting). Calibrated eye traces werevisually inspected when superimposed with the clips.
Fig. 4. Examples of eye fixation distribution map at different clips, the maps are histogram(d) seagull01.
Eye fixation distribution examples can be seen in Figs. 3 and 4.We can see from Fig. 3 that the overall distribution of eye fixations isquite strongly center-biased on average, however, for differentcontent clips, the eye fixation distributions are totally different andnot necessarily center-biased (Fig. 4). This is important as itsuggests that a simplistic saliency map – which would simplymark central screen regions as more salient – may work well onaverage but not necessarily for individual video clips (see [21] for
med over 16×16 image tiles and normalized to 1. (a) gate03, (b) park01, (c) room02,

7Z. Li et al. / Image and Vision Computing 29 (2011) 1–14
further discussion). In our results below we not only report averageperformance but also performance on individual clips and worst-case performance.
5. Experiment result
Uncompressed videos were shown to the subjects and the eye-tracking data was used to validate both the attention predictionmodel and the attention-based bit allocation scheme.
Considering that a good attention prediction model shouldoutput a model map which highlights the eye's fixation point,differences between guidance map values at subjects' gaze targetsand at randomly selected locations were quantified, to evaluateperformance, using ordinal dominance analysis [40]. Model mapvalues at subjects' fixation points and at randomly selectedlocations were first normalized by the maximum value in the mapwhen the eye fixation occurred (100 random locations are se-lected in this paper). Then, histograms of values at eye positionsand random locations were created. Fig. 5(a) shows the results ofthe histograms over all video clip types and subjects. It is easy tosee from the figure that many more human fixations were to highmodel salience values than expected by chance, which means theproposed model performs better than the random model atpredicting human gaze. The mean observer value at the guidancemap is 0.778 while the median value is 0.922, compared tomean 0.435 and median 0.400 obtained with random fixations(both model values are significantly higher than random value,pb10–20, considering both t-tests for mean value comparisonsand sign tests for median value comparisons). Fig. 6 shows theexample of frames and their corresponding guidance maps. Thesubjects' eye fixation points are marked as small color patch inthe frames.
To further measure the difference between the observer andrandom histograms, a threshold was decremented from 1 to 0, andat each threshold the percentage of eye positions and of random
Fig. 6. Example of video frames (top) and the corresponding guidance maps (bottom). Supatches in (b) means a saccade. (a) Frame from park03, (b) frame from room02.
positions that were to a map value larger than the threshold(“hits”) were computed. An ordinal dominance curve (similar to areceiver operating characteristic curve) was created with “observ-er-hits” versus “random-hits”. The curve summarizes how well abinary decision rule based on thresholding the map values coulddiscriminate signal (map values at observer eye positions) fromnoise (map values at random locations). The overall performancecan be summarized by the area under the curve (AUC). An AUCarea of 0.5 stands for a model which is at chance at predictinghuman gaze, while larger AUC values indicate better predictionperformance. In our experiment, the ordinal dominance curve isplotted in Fig. 5(b), and the AUC value is 0.773±0.002. As an upperbound, inter-observer correlations among humans yield an AUCof 0.854±0.001.
As to the attention-based bit allocation in video compression, thelatest video compression standard H.264/AVC and its referencesoftware JM9.8 are adopted to implement the experiment. In H.264,a total of 52 different values of Q step are supported and they areindexed by a Quantization Parameter (QP). Q step increases by 12.5%for each increment of 1 in QP. In this paper, QPs are adjusted at theMB level, which means different QPs are computed for each MB.There are two reasons for this: first, in H.264 frames are encoded atthe MB level, second, the generated guidance map has the same sizeas the frame size in MBs. QPs are computed according to Eq. (11)where wi are replaced by the corresponding GM values and Q step aretaken from the baseline QP value. Furthermore, in order to keep thesmoothness of perceptual quality, the biggest Q step is constrained toequal or less than 2 times of the smallest Q step, this means thedifference between QPs in one frame is constrained into 6. In theimplementation, the smallest QP is set to QPbaseline−2 while thebiggest QP is set to QPbaseline+3.
To measure the subjective quality of encoded frames, eye-trackingdata are applied to compute theweighted distortion. Here we proposeto use a new eye-tracking weighted mean square error (EWMSE) andeye-tracking weighted peak signal-to-noise ratio (EWPSNR) metrics
bjects' eye fixations are marked as small square color patches in the frame, the white
8 Z. Li et al. / Image and Vision Computing 29 (2011) 1–14
to measure subjective quality. The corresponding computationformulas are as follows:
EWMSE =1
MN ∑M
x=1∑N
y=1wx;y
∑M
x=1∑N
y=1wx;y• Ix;y
′ −Ix;y� �2� �
ð12Þ
EWPSNR = 10� log ð2n−1Þ2EWMSE
!ð13Þ
wx;y =1
2πσxσye− ðx−xe Þ2
2σ2x+ ðy−ye Þ2
2σ2y
� �ð14Þ
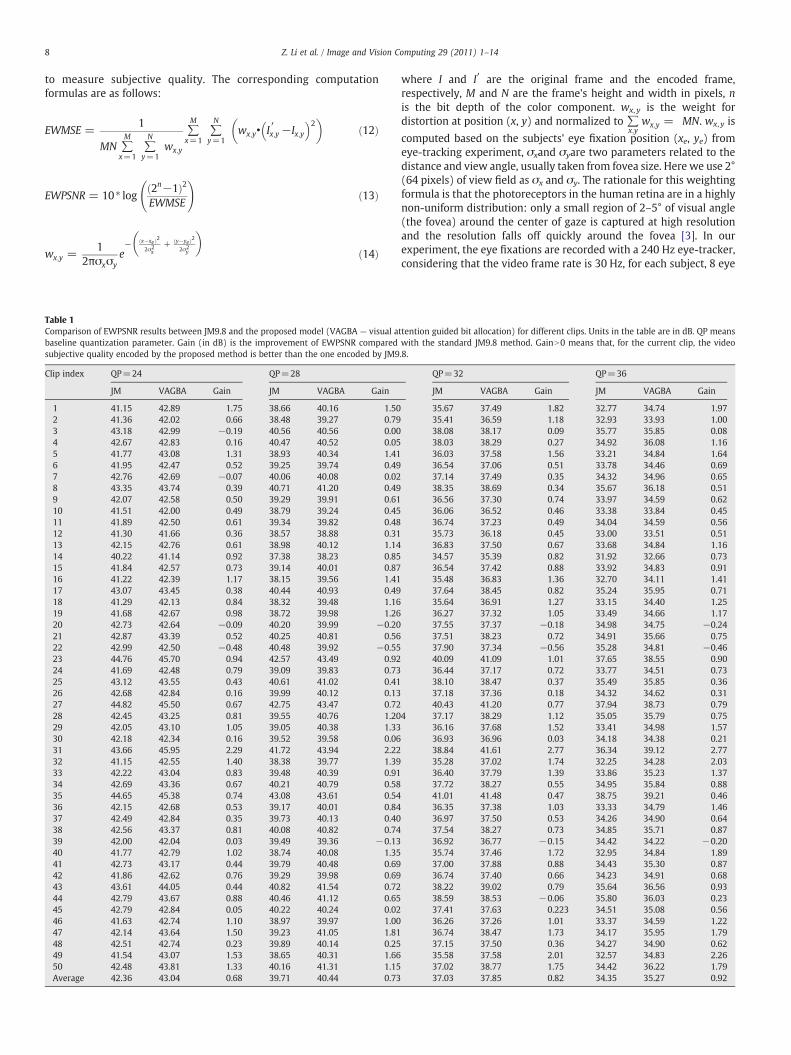
Table 1Comparison of EWPSNR results between JM9.8 and the proposed model (VAGBA — visual abaseline quantization parameter. Gain (in dB) is the improvement of EWPSNR comparedsubjective quality encoded by the proposed method is better than the one encoded by JM9
Clip index QP=24 QP=28
JM VAGBA Gain JM VAGBA Gain
1 41.15 42.89 1.75 38.66 40.16 1.502 41.36 42.02 0.66 38.48 39.27 0.793 43.18 42.99 −0.19 40.56 40.56 0.004 42.67 42.83 0.16 40.47 40.52 0.055 41.77 43.08 1.31 38.93 40.34 1.416 41.95 42.47 0.52 39.25 39.74 0.497 42.76 42.69 −0.07 40.06 40.08 0.028 43.35 43.74 0.39 40.71 41.20 0.499 42.07 42.58 0.50 39.29 39.91 0.6110 41.51 42.00 0.49 38.79 39.24 0.4511 41.89 42.50 0.61 39.34 39.82 0.4812 41.30 41.66 0.36 38.57 38.88 0.3113 42.15 42.76 0.61 38.98 40.12 1.1414 40.22 41.14 0.92 37.38 38.23 0.8515 41.84 42.57 0.73 39.14 40.01 0.8716 41.22 42.39 1.17 38.15 39.56 1.4117 43.07 43.45 0.38 40.44 40.93 0.4918 41.29 42.13 0.84 38.32 39.48 1.1619 41.68 42.67 0.98 38.72 39.98 1.2620 42.73 42.64 −0.09 40.20 39.99 −0.2021 42.87 43.39 0.52 40.25 40.81 0.5622 42.99 42.50 −0.48 40.48 39.92 −0.5523 44.76 45.70 0.94 42.57 43.49 0.9224 41.69 42.48 0.79 39.09 39.83 0.7325 43.12 43.55 0.43 40.61 41.02 0.4126 42.68 42.84 0.16 39.99 40.12 0.1327 44.82 45.50 0.67 42.75 43.47 0.7228 42.45 43.25 0.81 39.55 40.76 1.2029 42.05 43.10 1.05 39.05 40.38 1.3330 42.18 42.34 0.16 39.52 39.58 0.0631 43.66 45.95 2.29 41.72 43.94 2.2232 41.15 42.55 1.40 38.38 39.77 1.3933 42.22 43.04 0.83 39.48 40.39 0.9134 42.69 43.36 0.67 40.21 40.79 0.5835 44.65 45.38 0.74 43.08 43.61 0.5436 42.15 42.68 0.53 39.17 40.01 0.8437 42.49 42.84 0.35 39.73 40.13 0.4038 42.56 43.37 0.81 40.08 40.82 0.7439 42.00 42.04 0.03 39.49 39.36 −0.1340 41.77 42.79 1.02 38.74 40.08 1.3541 42.73 43.17 0.44 39.79 40.48 0.6942 41.86 42.62 0.76 39.29 39.98 0.6943 43.61 44.05 0.44 40.82 41.54 0.7244 42.79 43.67 0.88 40.46 41.12 0.6545 42.79 42.84 0.05 40.22 40.24 0.0246 41.63 42.74 1.10 38.97 39.97 1.0047 42.14 43.64 1.50 39.23 41.05 1.8148 42.51 42.74 0.23 39.89 40.14 0.2549 41.54 43.07 1.53 38.65 40.31 1.6650 42.48 43.81 1.33 40.16 41.31 1.15Average 42.36 43.04 0.68 39.71 40.44 0.73
where I and I′ are the original frame and the encoded frame,respectively, M and N are the frame's height and width in pixels, nis the bit depth of the color component. wx, y is the weight fordistortion at position (x, y) and normalized to ∑
x;ywx;y = MN. wx, y is
computed based on the subjects' eye fixation position (xe, ye) fromeye-tracking experiment, σxand σyare two parameters related to thedistance and view angle, usually taken from fovea size. Here we use 2°(64 pixels) of view field as σx and σy. The rationale for this weightingformula is that the photoreceptors in the human retina are in a highlynon-uniform distribution: only a small region of 2–5° of visual angle(the fovea) around the center of gaze is captured at high resolutionand the resolution falls off quickly around the fovea [3]. In ourexperiment, the eye fixations are recorded with a 240 Hz eye-tracker,considering that the video frame rate is 30 Hz, for each subject, 8 eye
ttention guided bit allocation) for different clips. Units in the table are in dB. QP meanswith the standard JM9.8 method. GainN0 means that, for the current clip, the video.8.
QP=32 QP=36
JM VAGBA Gain JM VAGBA Gain
35.67 37.49 1.82 32.77 34.74 1.9735.41 36.59 1.18 32.93 33.93 1.0038.08 38.17 0.09 35.77 35.85 0.0838.03 38.29 0.27 34.92 36.08 1.1636.03 37.58 1.56 33.21 34.84 1.6436.54 37.06 0.51 33.78 34.46 0.6937.14 37.49 0.35 34.32 34.96 0.6538.35 38.69 0.34 35.67 36.18 0.5136.56 37.30 0.74 33.97 34.59 0.6236.06 36.52 0.46 33.38 33.84 0.4536.74 37.23 0.49 34.04 34.59 0.5635.73 36.18 0.45 33.00 33.51 0.5136.83 37.50 0.67 33.68 34.84 1.1634.57 35.39 0.82 31.92 32.66 0.7336.54 37.42 0.88 33.92 34.83 0.9135.48 36.83 1.36 32.70 34.11 1.4137.64 38.45 0.82 35.24 35.95 0.7135.64 36.91 1.27 33.15 34.40 1.2536.27 37.32 1.05 33.49 34.66 1.1737.55 37.37 −0.18 34.98 34.75 −0.2437.51 38.23 0.72 34.91 35.66 0.7537.90 37.34 −0.56 35.28 34.81 −0.4640.09 41.09 1.01 37.65 38.55 0.9036.44 37.17 0.72 33.77 34.51 0.7338.10 38.47 0.37 35.49 35.85 0.3637.18 37.36 0.18 34.32 34.62 0.3140.43 41.20 0.77 37.94 38.73 0.79
4 37.17 38.29 1.12 35.05 35.79 0.7536.16 37.68 1.52 33.41 34.98 1.5736.93 36.96 0.03 34.18 34.38 0.2138.84 41.61 2.77 36.34 39.12 2.7735.28 37.02 1.74 32.25 34.28 2.0336.40 37.79 1.39 33.86 35.23 1.3737.72 38.27 0.55 34.95 35.84 0.8841.01 41.48 0.47 38.75 39.21 0.4636.35 37.38 1.03 33.33 34.79 1.4636.97 37.50 0.53 34.26 34.90 0.6437.54 38.27 0.73 34.85 35.71 0.8736.92 36.77 −0.15 34.42 34.22 −0.2035.74 37.46 1.72 32.95 34.84 1.8937.00 37.88 0.88 34.43 35.30 0.8736.74 37.40 0.66 34.23 34.91 0.6838.22 39.02 0.79 35.64 36.56 0.9338.59 38.53 −0.06 35.80 36.03 0.2337.41 37.63 0.223 34.51 35.08 0.5636.26 37.26 1.01 33.37 34.59 1.2236.74 38.47 1.73 34.17 35.95 1.7937.15 37.50 0.36 34.27 34.90 0.6235.58 37.58 2.01 32.57 34.83 2.2637.02 38.77 1.75 34.42 36.22 1.7937.03 37.85 0.82 34.35 35.27 0.92

Fig. 8. Comparison of histograms of PSNR results at eye fixation regions with standardJM9.8 method and the proposed VAGBA method (initial QP=28). The fixation regionsare used 2° of view.
9Z. Li et al. / Image and Vision Computing 29 (2011) 1–14
fixation points need to be taken into account for each frame.Therefore, the weight wx, y in reality is a combination of all 8 differenteye fixation points. Furthermore, the saccade data are not consideredin computing the EWPNSR and only the fixation points are taken intoaccount. We did this because human take saccade very quickly and donot pay much attention to the saccade regions. The mean EWPSNRfrom all the subjects is adopted as the measurement to evaluate thevideo subjective quality: the higher EWPNSR value, the bettersubjective quality.
To show the effectiveness of the proposed visual attention guidedbit allocation method in improving the video subjective quality, wecompare the encoded video EWPSNR from the proposed method andthe standard method in JM9.8 with matched bit rate through theframe-level rate control algorithm. The configuration of the encoder isas follows: intra period=30, Hadamard transform, UVLC, no fastmotion estimation, no B frame, high complexity RDO mode, norestriction in search range. We test 4 baseline QPs (initial QP): 24, 28,32 and 36, and the bit rates range from 260 Kbps to 10 Mbps. The rate-controlled bit rates with the standard encoder precisely match the bitrate with the proposed new encoder (within 1% difference). Table 1lists all the EWPSNR results from proposed method, the results fromthe JM9.8 standard method, and the subjective quality improvement(gain). Better EWMSE and EWPSNR is expected to be obtained for ourmethod vs. JM only if, on average, the predictions of the saliencymodel agree with where humans look, and, when they disagree, thehigher distortions that our system will introduce at the locationslooked at by humans do not outweigh the lower distortions obtainedwhen the model is correct. In addition, Fig. 7 plots the results atdifferent baseline QP, and sorts the results according to improvement.It is easy to see that only for a few (3–4) clips the subjective quality isworse with our proposed method than with the standard method,while most of the clips achieve a better subjective quality, with
Fig. 7. EWPSNR results comparison between our proposed VAGBA model and JM9.8 at the squality improvement (the red bars shown in each plot).
improvement for some of them up to about 2 dB EWPSNR. Thus, theproposed scheme can significantly (pb0.002, t-test) achieve bettersubjective quality (as defined by our EWPSNR measure) whilekeeping the same bit rate. Furthermore, the comparison of histogramsof PSNR results at eye fixation regions (2° of visual field) with differentmethods is plotted in Fig. 8, from the figure it is easy to see that moreencoded frames have higher PSNR in the fixation region with theproposed method compared with the standard JM9.8 method. Fig. 9shows two examples of EWPSNR over the clip frames. We can see
ame bit rate, the horizontal axis represent the clip index, after sorting by the subjective
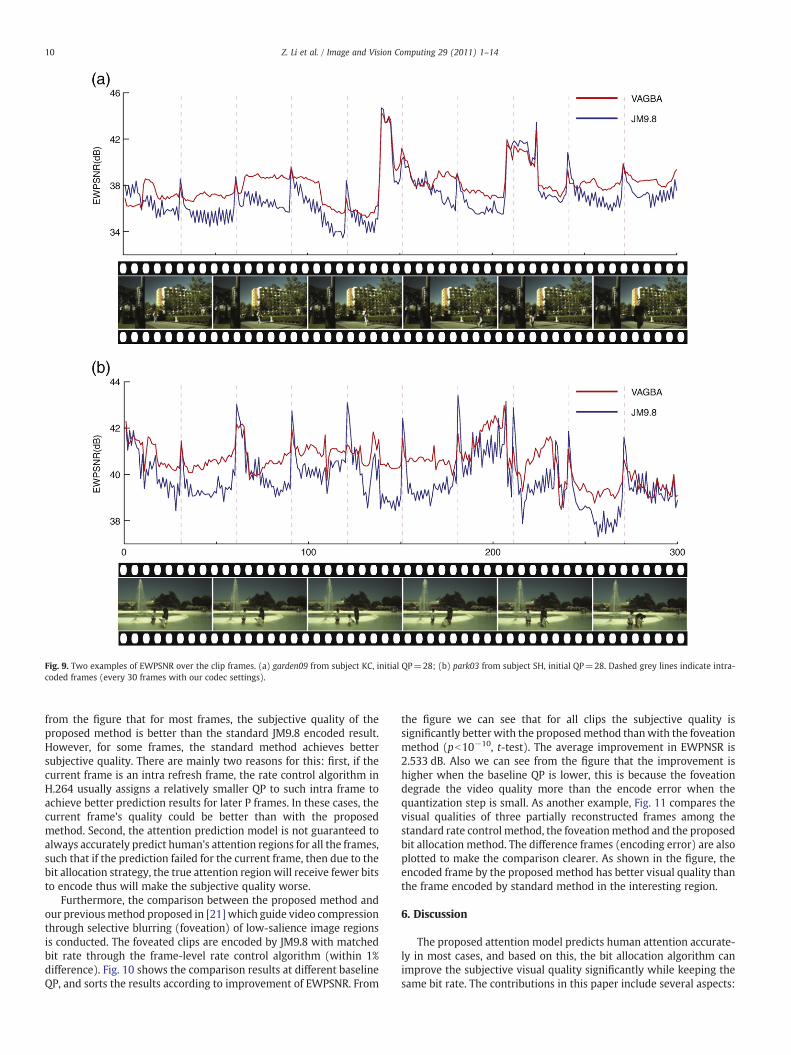
Fig. 9. Two examples of EWPSNR over the clip frames. (a) garden09 from subject KC, initial QP=28; (b) park03 from subject SH, initial QP=28. Dashed grey lines indicate intra-coded frames (every 30 frames with our codec settings).
10 Z. Li et al. / Image and Vision Computing 29 (2011) 1–14
from the figure that for most frames, the subjective quality of theproposed method is better than the standard JM9.8 encoded result.However, for some frames, the standard method achieves bettersubjective quality. There are mainly two reasons for this: first, if thecurrent frame is an intra refresh frame, the rate control algorithm inH.264 usually assigns a relatively smaller QP to such intra frame toachieve better prediction results for later P frames. In these cases, thecurrent frame's quality could be better than with the proposedmethod. Second, the attention prediction model is not guaranteed toalways accurately predict human's attention regions for all the frames,such that if the prediction failed for the current frame, then due to thebit allocation strategy, the true attention region will receive fewer bitsto encode thus will make the subjective quality worse.
Furthermore, the comparison between the proposed method andour previousmethod proposed in [21] which guide video compressionthrough selective blurring (foveation) of low-salience image regionsis conducted. The foveated clips are encoded by JM9.8 with matchedbit rate through the frame-level rate control algorithm (within 1%difference). Fig. 10 shows the comparison results at different baselineQP, and sorts the results according to improvement of EWPSNR. From
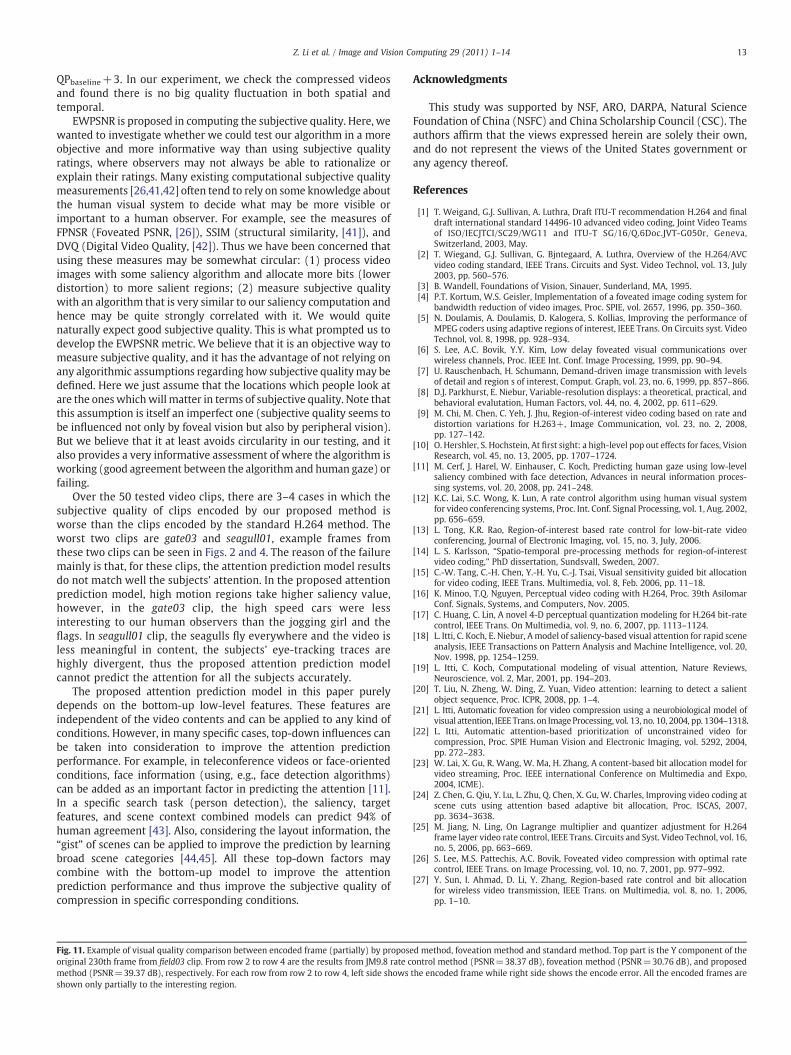
the figure we can see that for all clips the subjective quality issignificantly better with the proposedmethod thanwith the foveationmethod (pb10−10, t-test). The average improvement in EWPNSR is2.533 dB. Also we can see from the figure that the improvement ishigher when the baseline QP is lower, this is because the foveationdegrade the video quality more than the encode error when thequantization step is small. As another example, Fig. 11 compares thevisual qualities of three partially reconstructed frames among thestandard rate control method, the foveationmethod and the proposedbit allocation method. The difference frames (encoding error) are alsoplotted to make the comparison clearer. As shown in the figure, theencoded frame by the proposed method has better visual quality thanthe frame encoded by standard method in the interesting region.
6. Discussion
The proposed attention model predicts human attention accurate-ly in most cases, and based on this, the bit allocation algorithm canimprove the subjective visual quality significantly while keeping thesame bit rate. The contributions in this paper include several aspects:
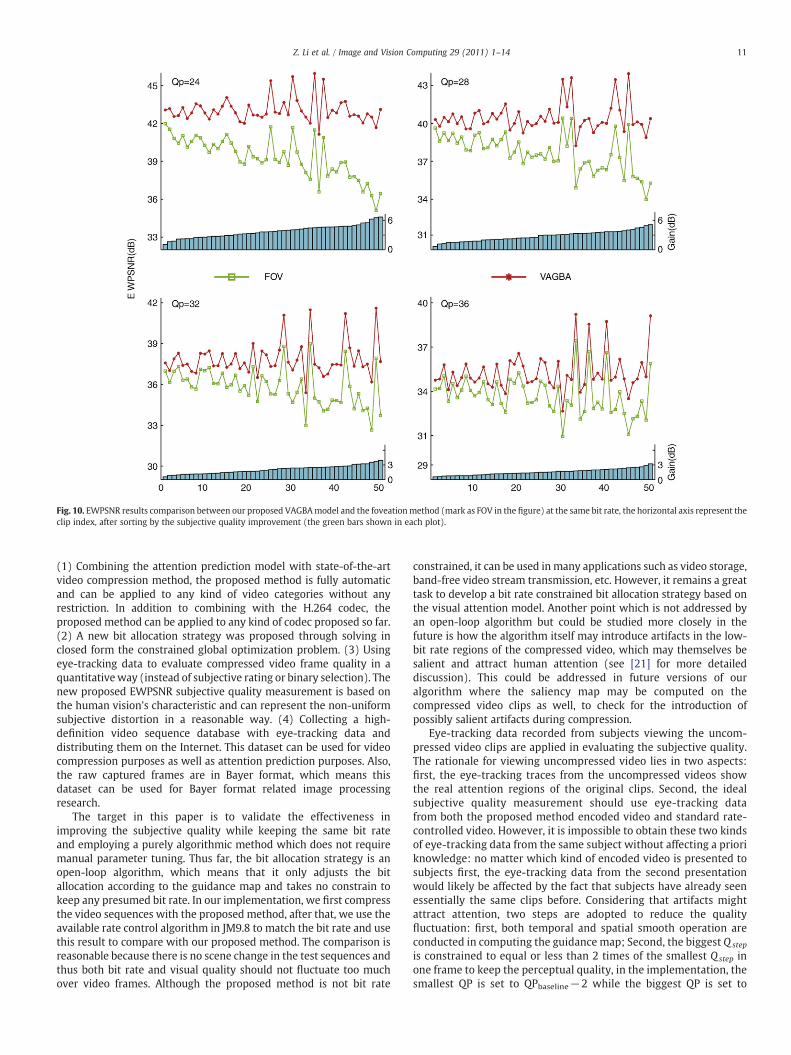
Fig. 10. EWPSNR results comparison between our proposed VAGBAmodel and the foveationmethod (mark as FOV in the figure) at the same bit rate, the horizontal axis represent theclip index, after sorting by the subjective quality improvement (the green bars shown in each plot).
11Z. Li et al. / Image and Vision Computing 29 (2011) 1–14
(1) Combining the attention prediction model with state-of-the-artvideo compression method, the proposed method is fully automaticand can be applied to any kind of video categories without anyrestriction. In addition to combining with the H.264 codec, theproposed method can be applied to any kind of codec proposed so far.(2) A new bit allocation strategy was proposed through solving inclosed form the constrained global optimization problem. (3) Usingeye-tracking data to evaluate compressed video frame quality in aquantitativeway (instead of subjective rating or binary selection). Thenew proposed EWPSNR subjective quality measurement is based onthe human vision's characteristic and can represent the non-uniformsubjective distortion in a reasonable way. (4) Collecting a high-definition video sequence database with eye-tracking data anddistributing them on the Internet. This dataset can be used for videocompression purposes as well as attention prediction purposes. Also,the raw captured frames are in Bayer format, which means thisdataset can be used for Bayer format related image processingresearch.
The target in this paper is to validate the effectiveness inimproving the subjective quality while keeping the same bit rateand employing a purely algorithmic method which does not requiremanual parameter tuning. Thus far, the bit allocation strategy is anopen-loop algorithm, which means that it only adjusts the bitallocation according to the guidance map and takes no constrain tokeep any presumed bit rate. In our implementation, we first compressthe video sequences with the proposed method, after that, we use theavailable rate control algorithm in JM9.8 to match the bit rate and usethis result to compare with our proposed method. The comparison isreasonable because there is no scene change in the test sequences andthus both bit rate and visual quality should not fluctuate too muchover video frames. Although the proposed method is not bit rate
constrained, it can be used in many applications such as video storage,band-free video stream transmission, etc. However, it remains a greattask to develop a bit rate constrained bit allocation strategy based onthe visual attention model. Another point which is not addressed byan open-loop algorithm but could be studied more closely in thefuture is how the algorithm itself may introduce artifacts in the low-bit rate regions of the compressed video, which may themselves besalient and attract human attention (see [21] for more detaileddiscussion). This could be addressed in future versions of ouralgorithm where the saliency map may be computed on thecompressed video clips as well, to check for the introduction ofpossibly salient artifacts during compression.
Eye-tracking data recorded from subjects viewing the uncom-pressed video clips are applied in evaluating the subjective quality.The rationale for viewing uncompressed video lies in two aspects:first, the eye-tracking traces from the uncompressed videos showthe real attention regions of the original clips. Second, the idealsubjective quality measurement should use eye-tracking datafrom both the proposed method encoded video and standard rate-controlled video. However, it is impossible to obtain these two kindsof eye-tracking data from the same subject without affecting a prioriknowledge: no matter which kind of encoded video is presented tosubjects first, the eye-tracking data from the second presentationwould likely be affected by the fact that subjects have already seenessentially the same clips before. Considering that artifacts mightattract attention, two steps are adopted to reduce the qualityfluctuation: first, both temporal and spatial smooth operation areconducted in computing the guidance map; Second, the biggest Q step
is constrained to equal or less than 2 times of the smallest Qstep inone frame to keep the perceptual quality, in the implementation, thesmallest QP is set to QPbaseline−2 while the biggest QP is set to

13Z. Li et al. / Image and Vision Computing 29 (2011) 1–14
QPbaseline+3. In our experiment, we check the compressed videosand found there is no big quality fluctuation in both spatial andtemporal.
EWPSNR is proposed in computing the subjective quality. Here, wewanted to investigate whether we could test our algorithm in a moreobjective and more informative way than using subjective qualityratings, where observers may not always be able to rationalize orexplain their ratings. Many existing computational subjective qualitymeasurements [26,41,42] often tend to rely on some knowledge aboutthe human visual system to decide what may be more visible orimportant to a human observer. For example, see the measures ofFPNSR (Foveated PSNR, [26]), SSIM (structural similarity, [41]), andDVQ (Digital Video Quality, [42]). Thus we have been concerned thatusing these measures may be somewhat circular: (1) process videoimages with some saliency algorithm and allocate more bits (lowerdistortion) to more salient regions; (2) measure subjective qualitywith an algorithm that is very similar to our saliency computation andhence may be quite strongly correlated with it. We would quitenaturally expect good subjective quality. This is what prompted us todevelop the EWPSNR metric. We believe that it is an objective way tomeasure subjective quality, and it has the advantage of not relying onany algorithmic assumptions regarding how subjective qualitymay bedefined. Here we just assume that the locations which people look atare the oneswhichwill matter in terms of subjective quality. Note thatthis assumption is itself an imperfect one (subjective quality seems tobe influenced not only by foveal vision but also by peripheral vision).But we believe that it at least avoids circularity in our testing, and italso provides a very informative assessment of where the algorithm isworking (good agreement between the algorithm and human gaze) orfailing.
Over the 50 tested video clips, there are 3–4 cases in which thesubjective quality of clips encoded by our proposed method isworse than the clips encoded by the standard H.264 method. Theworst two clips are gate03 and seagull01, example frames fromthese two clips can be seen in Figs. 2 and 4. The reason of the failuremainly is that, for these clips, the attention prediction model resultsdo not match well the subjects' attention. In the proposed attentionprediction model, high motion regions take higher saliency value,however, in the gate03 clip, the high speed cars were lessinteresting to our human observers than the jogging girl and theflags. In seagull01 clip, the seagulls fly everywhere and the video isless meaningful in content, the subjects' eye-tracking traces arehighly divergent, thus the proposed attention prediction modelcannot predict the attention for all the subjects accurately.
The proposed attention prediction model in this paper purelydepends on the bottom-up low-level features. These features areindependent of the video contents and can be applied to any kind ofconditions. However, in many specific cases, top-down influences canbe taken into consideration to improve the attention predictionperformance. For example, in teleconference videos or face-orientedconditions, face information (using, e.g., face detection algorithms)can be added as an important factor in predicting the attention [11].In a specific search task (person detection), the saliency, targetfeatures, and scene context combined models can predict 94% ofhuman agreement [43]. Also, considering the layout information, the“gist” of scenes can be applied to improve the prediction by learningbroad scene categories [44,45]. All these top-down factors maycombine with the bottom-up model to improve the attentionprediction performance and thus improve the subjective quality ofcompression in specific corresponding conditions.
Fig. 11. Example of visual quality comparison between encoded frame (partially) by proposeoriginal 230th frame from field03 clip. From row 2 to row 4 are the results from JM9.8 rate cmethod (PSNR=39.37 dB), respectively. For each row from row 2 to row 4, left side showsshown only partially to the interesting region.
Acknowledgments
This study was supported by NSF, ARO, DARPA, Natural ScienceFoundation of China (NSFC) and China Scholarship Council (CSC). Theauthors affirm that the views expressed herein are solely their own,and do not represent the views of the United States government orany agency thereof.
References
[1] T. Weigand, G.J. Sullivan, A. Luthra, Draft ITU-T recommendation H.264 and finaldraft international standard 14496-10 advanced video coding, Joint Video Teamsof ISO/IECJTCI/SC29/WG11 and ITU-T SG/16/Q.6Doc.JVT-G050r, Geneva,Switzerland, 2003, May.
[2] T. Wiegand, G.J. Sullivan, G. Bjntegaard, A. Luthra, Overview of the H.264/AVCvideo coding standard, IEEE Trans. Circuits and Syst. Video Technol, vol. 13, July2003, pp. 560–576.
[3] B. Wandell, Foundations of Vision, Sinauer, Sunderland, MA, 1995.[4] P.T. Kortum, W.S. Geisler, Implementation of a foveated image coding system for
bandwidth reduction of video images, Proc. SPIE, vol. 2657, 1996, pp. 350–360.[5] N. Doulamis, A. Doulamis, D. Kalogera, S. Kollias, Improving the performance of
MPEG coders using adaptive regions of interest, IEEE Trans. On Circuits syst. VideoTechnol, vol. 8, 1998, pp. 928–934.
[6] S. Lee, A.C. Bovik, Y.Y. Kim, Low delay foveated visual communications overwireless channels, Proc. IEEE Int. Conf. Image Processing, 1999, pp. 90–94.
[7] U. Rauschenbach, H. Schumann, Demand-driven image transmission with levelsof detail and region s of interest, Comput. Graph, vol. 23, no. 6, 1999, pp. 857–866.
[8] D.J. Parkhurst, E. Niebur, Variable-resolution displays: a theoretical, practical, andbehavioral evalutation, Human Factors, vol. 44, no. 4, 2002, pp. 611–629.
[9] M. Chi, M. Chen, C. Yeh, J. Jhu, Region-of-interest video coding based on rate anddistortion variations for H.263+, Image Communication, vol. 23, no. 2, 2008,pp. 127–142.
[10] O. Hershler, S. Hochstein, At first sight: a high-level pop out effects for faces, VisionResearch, vol. 45, no. 13, 2005, pp. 1707–1724.
[11] M. Cerf, J. Harel, W. Einhauser, C. Koch, Predicting human gaze using low-levelsaliency combined with face detection, Advances in neural information proces-sing systems, vol. 20, 2008, pp. 241–248.
[12] K.C. Lai, S.C. Wong, K. Lun, A rate control algorithm using human visual systemfor video conferencing systems, Proc. Int. Conf. Signal Processing, vol. 1, Aug. 2002,pp. 656–659.
[13] L. Tong, K.R. Rao, Region-of-interest based rate control for low-bit-rate videoconferencing, Journal of Electronic Imaging, vol. 15, no. 3, July, 2006.
[14] L. S. Karlsson, “Spatio-temporal pre-processing methods for region-of-interestvideo coding,” PhD dissertation, Sundsvall, Sweden, 2007.
[15] C.-W. Tang, C.-H. Chen, Y.-H. Yu, C.-J. Tsai, Visual sensitivity guided bit allocationfor video coding, IEEE Trans. Multimedia, vol. 8, Feb. 2006, pp. 11–18.
[16] K. Minoo, T.Q. Nguyen, Perceptual video coding with H.264, Proc. 39th AsilomarConf. Signals, Systems, and Computers, Nov. 2005.
[17] C. Huang, C. Lin, A novel 4-D perceptual quantization modeling for H.264 bit-ratecontrol, IEEE Trans. On Multimedia, vol. 9, no. 6, 2007, pp. 1113–1124.
[18] L. Itti, C. Koch, E. Niebur, Amodel of saliency-based visual attention for rapid sceneanalysis, IEEE Transactions on Pattern Analysis and Machine Intelligence, vol. 20,Nov. 1998, pp. 1254–1259.
[19] L. Itti, C. Koch, Computational modeling of visual attention, Nature Reviews,Neuroscience, vol. 2, Mar, 2001, pp. 194–203.
[20] T. Liu, N. Zheng, W. Ding, Z. Yuan, Video attention: learning to detect a salientobject sequence, Proc. ICPR, 2008, pp. 1–4.
[21] L. Itti, Automatic foveation for video compression using a neurobiological model ofvisual attention, IEEE Trans. on ImageProcessing, vol. 13, no. 10, 2004, pp. 1304–1318.
[22] L. Itti, Automatic attention-based prioritization of unconstrained video forcompression, Proc. SPIE Human Vision and Electronic Imaging, vol. 5292, 2004,pp. 272–283.
[23] W. Lai, X. Gu, R. Wang, W. Ma, H. Zhang, A content-based bit allocation model forvideo streaming, Proc. IEEE international Conference on Multimedia and Expo,2004, ICME).
[24] Z. Chen, G. Qiu, Y. Lu, L. Zhu, Q. Chen, X. Gu, W. Charles, Improving video coding atscene cuts using attention based adaptive bit allocation, Proc. ISCAS, 2007,pp. 3634–3638.
[25] M. Jiang, N. Ling, On Lagrange multiplier and quantizer adjustment for H.264frame layer video rate control, IEEE Trans. Circuits and Syst. Video Technol, vol. 16,no. 5, 2006, pp. 663–669.
[26] S. Lee, M.S. Pattechis, A.C. Bovik, Foveated video compression with optimal ratecontrol, IEEE Trans. on Image Processing, vol. 10, no. 7, 2001, pp. 977–992.
[27] Y. Sun, I. Ahmad, D. Li, Y. Zhang, Region-based rate control and bit allocationfor wireless video transmission, IEEE Trans. on Multimedia, vol. 8, no. 1, 2006,pp. 1–10.
d method, foveation method and standard method. Top part is the Y component of theontrol method (PSNR=38.37 dB), foveation method (PSNR=30.76 dB), and proposedthe encoded frame while right side shows the encode error. All the encoded frames are

14 Z. Li et al. / Image and Vision Computing 29 (2011) 1–14
[28] Y. Liu, Z. Li, Y.C. Soh, Region-of-interest based resource allocation for conversa-tional video communications of H.264/AVC, IEEE Trans. Circuits and Syst. VideoTechnol, vol. 18, no. 1, 2008, pp. 134–139.
[29] Z. Li, L. Itti, Visual attention guided video compression, Proc. Vision Science SocietyAnnual Meeting (VSS08), May, 2008.
[30] N. Wang, Q. Zhang, G. Li, Objective quality evaluation of digital video, Proc. PCCAS,2000, pp. 791–794.
[31] A.A. Webster, C.T. Jones, M.H. Pinson, S.D. Voran, S. Wolf, A.A. Webster, C.T. Jones,M.H. Pinson, S.D. Voran, S. Wolf, Objective video quality assessment system basedon human perception, Proc. SPIE, vol. 1913, 1993, pp. 15–26.
[32] A.B. Watson, J. Hu, J.F. McGowan, Digital video quality metric based on humanvision, Journal of Electronic Imaging, vol. 10, no. 1, 2001, pp. 20–29.
[33] “Tutorial: objective perceptual assessment of video quality: full referencetelevision,”, ITU-T Technical tutorials, 2005.
[34] http://ilab.usc.edu/toolkit.[35] J.M. Wolfe, Visual memory: what do you know about what you saw? Current
Biology, vol. 8, 1998, pp. 303–304.[36] A.M. Treisman, G. Gelade, A feature-integration theory of attention, Cognition
Psychology, vol. 12, 1980, pp. 97–136.[37] L. Itti, C. Koch, Feature combination strategies for saliency-based visual attention
systems, Journal of Electronic Imaging, vol. 10, Jan. 2001, pp. 161–169.
[38] Y. Wang, J. Ostermann, Y. Zhang, Video Processing and Communication, PearsonEducation, 2002.
[39] H.S. Malvar, L.W. He, R. Cutler, High-quality linear interporlation for demosaicingof bayer-patterned color images, Proc. ICASSP, 2004, pp. 485–488.
[40] D. Bamber, The area above the ordinal dominance graph and the area below thereceiver operating characteristic graph, Journal of Mathematical Psychology,vol. 12, 1975, pp. 375–387.
[41] M. Vranjes, S. Rimac-Drlje, D. Zagar, Subjective and objective quality evaluation ofthe H.264/AVC coded video, Proc. Systems, Signals and Image Processing, 2008.
[42] A.B. Watson, Toward a perceptual video quality metric, Human Vision, VisualProcessing, and Digital Display, vol. 3299, 1998, pp. 139–147.
[43] K. Ehinger, B. Hidalgo-Sotelo, A. Torralba, A. Oliva, Modeling search for people in900 scenes: a combined source model of eye guidance, Visual Cognition, vol. 17,no. 6&7, 2009, pp. 945–978.
[44] Z. Li, L. Itti, Gist based top-down templates for gaze prediction, Proc. VisionScience Society Annual Meeting, 2009, VSS09.
[45] J. Peters, L. Itti, Beyond bottom-up: incorporating task-dependent influences intoa computational model of spatial attention, Proc. CVPR, 2007.