visual inspection of surfaces - nasa · experiment purpose evaluate the parameters that affect...
TRANSCRIPT

Visual Inspection of Surfaces
David Hughes Xavier Perez
https://ntrs.nasa.gov/search.jsp?R=20080040791 2018-08-21T02:33:57+00:00Z

Experiment Purpose
Evaluate the parameters that affect visual inspection of cleanliness - Current standards do not account for surface
type, experience of inspector, etc
- Result is that surfaces meeting the same standard level may have very different cleanliness

Factors tested - Surface reflectance - Surface roughness - Largest particle size - Exposure time - Inspector
Measurement - Distance to sample

Reflectance Values Weighted by cleanroom lamp -- spectral power distribution
Three integrated reflectance values used - Black Kapton: 0.069 a v h - b h ~ - d - r - e
- Kapton: 0.456 0 9
- VDA: 0.889

Roughness Values Rough surface created by pressing sandpaper into film sample - Used 60 grit paper - 20 psi
- Approx 270 micron particle size ChwarIrc Reas k h n e - Because of random particle orientation, mhloar.
spacing and depth of indents was irregular
- Roughness assigned value of 0 for smooth or 1 for rough

Exposure and Particle Size
Samples exposed to clean room fallout for 1-7 days before the visual inspection After the visual inspection, the largest particles were collected by tape lift and measured
Pubcb on a Smooth Bkck Iedptrn %m$m

I est setup Three observers in parallel Light behind and to the side of the observers Samples arranged in grid on table (random order)

DOE Regression
Fit up to fourth order interactions - Except observer; added interactions one at a time - Only first order effects from observer had any
statistical significance
Analysis of Variance - Model equation is statistically significant with 99%
confidence Source DF Sum of Squares Mean Square F Ratio Model 15 30.762221 2.05081 3.3859 Error 33 19.988016 0.60570 Prob > F C. Total 48 50.750237 0.001 7
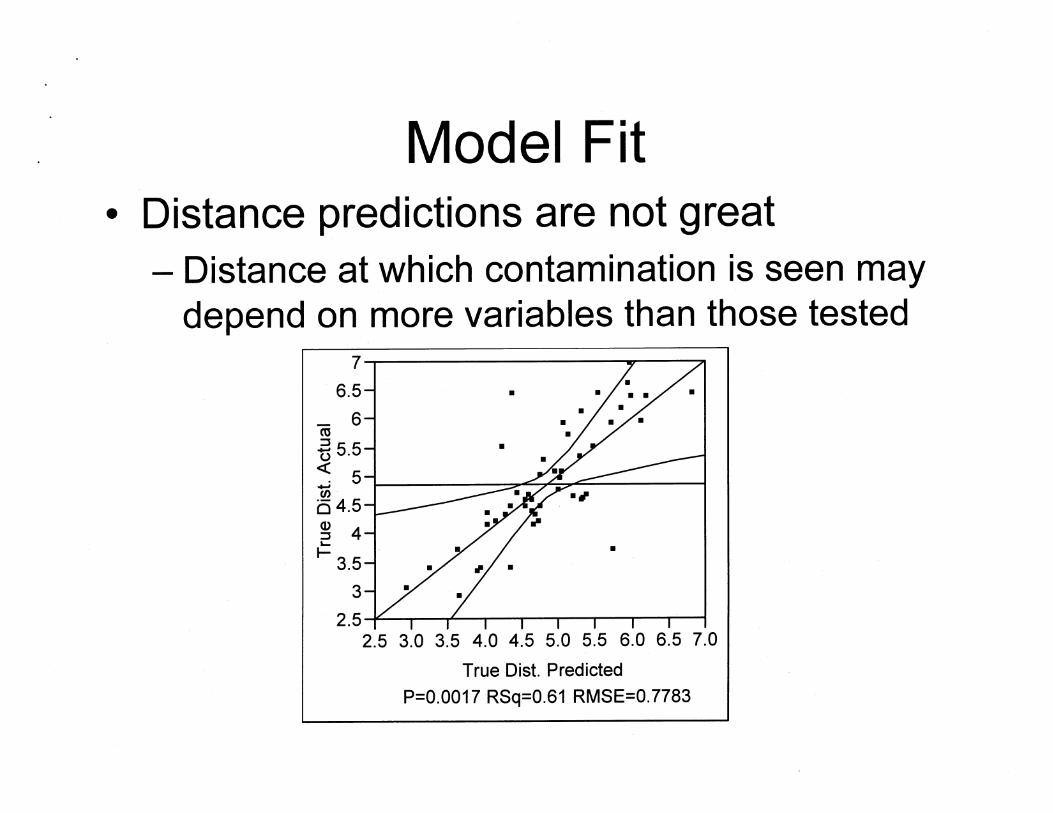
Model Fit Distance predictions are not great - Distance at which contamination is seen may
depend on more variables than those tested
2.5 3.0 3.5 4.0 4.5 5.0 5.5 6.0 6.5 7.0
True Dist. Predicted
P=0.0017 RSq=0.61 RMSE=0.7783

Parameter Estimates
Most parameter estimates have confidence of 95% or better Three exceptions (highlighted rows)
Term Intercept Refl Rough Exposure (Refl-0.49455)*(Exposure-4.53849) (Rough-0.551 02)*(Exposure-4.53849) (Refl-0.49455)*(Rough-0.55 102)*(Exposure-4.53849) Ferret (Refl-0.49455)*(Ferret-1060)
Estimate 8.4987743 -3.251 522 -1.285622 -0.405207 3.1261 103 1.681 0883 -3.622634 0.0012317 -0.004593
Std Error 1.043563 0.865699 0.648001 0.166506 0.727024 0.416319 1.1 10143 0.000398 0.001235
t Ratio Prob>ltl 8.14 <.0001
-3.76 0.0007 -1.98 0.0556 -2.43 0.0205 4.30 0.0001 4.04 0.0003
-3.26 0.0026 3.10 0.0040
-3.72 0.0007

Model Equation 8.499 + -3.252 * Refl + -1.286 * Rough + -0.4052 * Exposure + 0.001 232 * Ferret + ( Refl - 0.4946) * ( Exposure - 4.538) * (3.126) + ( Rough - 0.5510) * ( Exposure - 4.538) * (1.681) + ( Refl - 0.4946) * ( Rough - 0.5510) * ( Exposure - 4.5385) *( -3.623) + ( Refl - 0.4946) * ( Ferret - 1060) * (-0.004593) +
( Rough - 0.551 0) * ( Ferret - 1060) * (-0.002424) + ( Exposure - 4.538) * ( Ferret - 1060) * (-0.0003008) + ( Refl - 0.4946) * ( Exposure - 4.538) * ( Ferret - 1060) * (0.00221 7) + ( Rough - 0.5510) * ( Exposure - 4.538) * ( Ferret - 1060) * (0.001065) + ( Refl - 0.4946) * ( Rough - 0.551 0) * ( Exposure - 4.538) * ( Ferret - 1060) * (-0.001440) + Match Observer("L1": 0.04900, "L2": -0.351 5, "L3": 0.3025)

Response to Variables Distance at which surface is visibly contaminated decreases with increasing - Reflectance, Roughness, Exposure (PAC)
Increases with largest particle size Is only slightly affected by observer
- v g UJ a 6 $ 8
,Y 4.5
% 2.5 3.5 ~ : ~ ! ~ l ? l ? , ~ l ~ c\! I' 0 cu y cq o? 0 Ln Ln 7 c u m q m a 0 0 0 0 0 0 0 7 cu m
0 0 0 0 0 0 -1 -1 1 L n O L n O L D O
7 7 c u c u m 0 49455 0.551 4 5385 1060 L 1
Refl Rough Exposure Ferret Observer

Ttue Did.
36 30 24 18 12 6 5 4 3 2 1 0

The liaht source and obseiation point was fixed relative to the sample - In an actual inspection, the light
source is usually hand held, and the observer can move relative to the source
Perceived roughness may trick the brain into discarding particles - Diffuse scatter from increased
PAC may have the same effect Variability between observers was less than other effects - Experience did play a part in
differentiating scratches from fibers
C u d VDA Sample
Glare was a significant factor for some samples