visual recognition at the large scale - stanford university
TRANSCRIPT

Visual recognition at the Large‐Scale
Fei‐Fei Li(publish under L. Fei‐Fei)
Computer Science Dept.
Psychology Dept.
Stanford University


http://www.image‐net.org

is a knowledge ontology
• Taxonomy • Partonomy• The “social network” of visual concepts– Hidden knowledge and structure among visual concepts
– Prior knowledge– Context

is a knowledge ontology
• Taxonomy • Partonomy• The “social network” of visual concepts– Hidden knowledge and structure among visual concepts
– Prior knowledge– Context

is a knowledge ontology
• Taxonomy • Partonomy• The “social network” of visual concepts– Prior knowledge– Context– Hidden knowledge and structure among visual concepts

outline• Construction of ImageNet
– 2‐step process– Crowdsourcing: Amazon Mechanical Turk (AMT)– Properties of ImageNet
• Benchmarking: what does classifying 10k+ image categories tell us?– Computation matters– Size matters– Density matters– Hierarchy matters
• A “semanticvisual” hierarchy for personal albums– Building it from Flickr images and user tags– Using the hierarchy for visual recognition tasks

Constructing
Step 1:Collect candidate images
via the Internet
Step 2:Clean up the candidateImages by humans

• Query expansion– Synonyms: German shepherd, German police dog, German shepherd dog, Alsatian
– Appending words from ancestors: sheepdog, dog
• Multiple languages– Italian, Dutch, Spanish, Chinesee.g. ovejero alemán, pastore tedesco,德国牧羊犬
• More engines• Parallel downloading
Step 1: Collect Candidate Images from the Internet
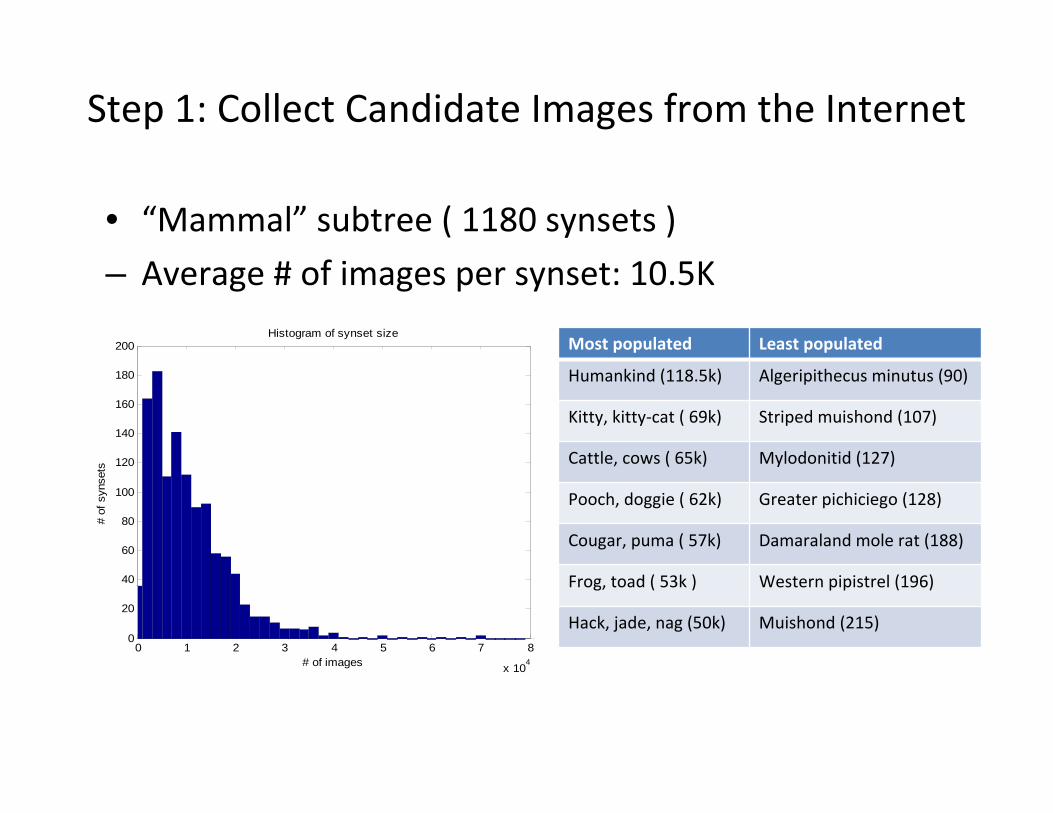
• “Mammal” subtree ( 1180 synsets )
– Average # of images per synset: 10.5K
0 1 2 3 4 5 6 7 8
x 104
0
20
40
60
80
100
120
140
160
180
200
# of images
# of
syn
sets
Histogram of synset sizeMost populated Least populated
Humankind (118.5k) Algeripithecus minutus (90)
Kitty, kitty‐cat ( 69k) Striped muishond (107)
Cattle, cows ( 65k) Mylodonitid (127)
Pooch, doggie ( 62k) Greater pichiciego (128)
Cougar, puma ( 57k) Damaraland mole rat (188)
Frog, toad ( 53k ) Western pipistrel (196)
Hack, jade, nag (50k) Muishond (215)
Step 1: Collect Candidate Images from the Internet

• “Mammal” subtree (1180 synsets )– Average accuracy per synset: 26%
0 0.1 0.2 0.3 0.4 0.5 0.6 0.7 0.8 0.9 10
0.05
0.1
0.15
0.2
0.25
percentage of positive images
perc
enta
ge o
f syn
sets
Histogram of synset precisionMost accurate Least accurate
Bottlenose dolpin (80%) Fanaloka (1%)
Meerkat (74%) Pallid bat (3%)
Burmese cat (74%) Vaquita (3%)
Humpback whale (69%) Fisher cat (3%)
African elephant (63%) Walrus (4%)
Squirrel (60%) Grison (4%)
Domestic cat (59%) Pika, Mouse hare (4%)
Step 1: Collect Candidate Images from the Internet

Step 2: verifying the images by humans
• # of synsets: 40,000 (subject to: imageability analysis)
• # of candidate images to label per synset: 10,000
• # of people needed to verify: 2‐5
• Speed of human labeling: 2 images/sec (one fixation: ~200msec)
Moral of the story: no graduate students would want to do this project!
000,40 000,10 3 2/ sec000,000,600 years19

In summer 2008, we discovered crowdsourcing


• # of synsets: 40,000 (subject to: imageability analysis)
• # of candidate images to label per synset: 10,000
• # of people needed to verify: 2‐5
• Speed of human labeling: 2 images/sec (one fixation: ~200msec)
• Massive parallelism (N ~ 10^2‐3)
000,40 000,10 3 2/ sec000,000,600 years19
N
Step 2: verifying the images by humans

Basic User InterfaceClick on the good images.

Basic User Interface

So are we exploiting chained prisoners?

Demography of AMT workers
Panos Ipeirotis, NYU, Feb, 2010

Typical StanfordGraduate student’s income
Demography of AMT workers
Panos Ipeirotis, NYU, Feb, 2010

Demography of AMT workers
Panos Ipeirotis, NYU, Feb, 2010

U.S. economy 2008 ‐ 2009
hired more than 25,000 AMT workers in this period of time!!

outline• Construction of ImageNet
– 2‐step process– Crowdsourcing: Amazon Mechanical Turk (AMT)– Properties of ImageNet
• Benchmarking: what does classifying 10k+ image categories tell us?– Computation matters– Size matters– Density matters– Hierarchy matters
• A “semanticvisual” hierarchy for personal albums– Building it from Flickr images and user tags– Using the hierarchy for visual recognition tasks

Datasets and computer vision
UIUC Cars (2004)S. Agarwal, A. Awan, D. Roth
3D Textures (2005)S. Lazebnik, C. Schmid, J. Ponce
CuRRET Textures (1999)K. Dana B. Van Ginneken S. Nayar J. Koenderink
CAVIAR Tracking (2005)R. Fisher, J. Santos‐Victor J. Crowley
FERET Faces (1998)P. Phillips, H. Wechsler, J. Huang, P. Raus
CMU/VASC Faces (1998)H. Rowley, S. Baluja, T. Kanade
MNIST digits (1998‐10)Y LeCun & C. Cortes
KTH human action (2004)I. Leptev & B. Caputo
Sign Language (2008)P. Buehler, M. Everingham, A. Zisserman
Segmentation (2001)D. Martin, C. Fowlkes, D. Tal, J. Malik.
Middlebury Stereo (2002)D. Scharstein R. Szeliski
COIL Objects (1996)S. Nene, S. Nayar, H. Murase

Motorbike
Things
Fergus, Perona, Zisserman, CVPR 2003
ObjectObjectRecognitionRecognition

Fergus, Perona, Zisserman, CVPR 2003
Motorbike Face
LeopardAirplane
Holub, et al. ICCV 2005; Sivic et al. ICCV 2005
ObjectObjectRecognitionRecognition
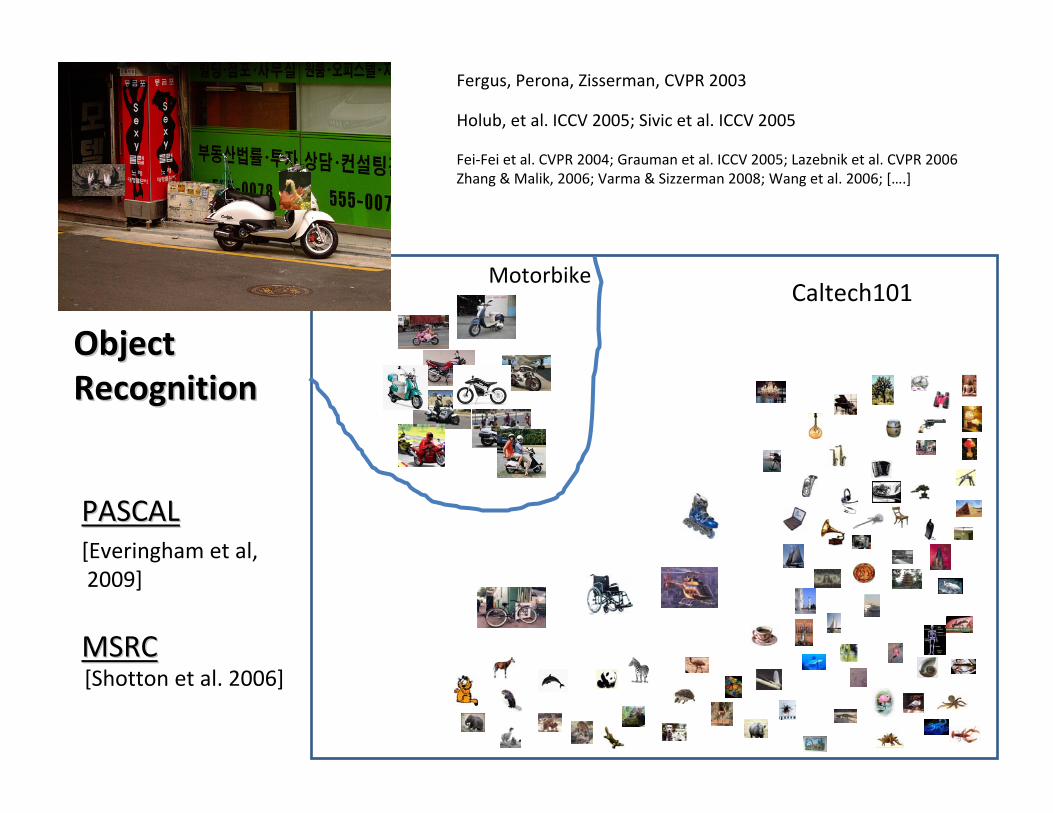
MotorbikeCaltech101
Fergus, Perona, Zisserman, CVPR 2003
Holub, et al. ICCV 2005; Sivic et al. ICCV 2005
ObjectObjectRecognitionRecognition
PASCALPASCAL[Everingham et al,2009]
MSRCMSRC[Shotton et al. 2006]
Fei‐Fei et al. CVPR 2004; Grauman et al. ICCV 2005; Lazebnik et al. CVPR 2006Zhang & Malik, 2006; Varma & Sizzerman 2008; Wang et al. 2006; [….]

Fei‐Fei et al. CVPR 2004; Grauman et al. ICCV 2005; Lazebnik et al. CVPR 2006Zhang & Malik, 2006; Varma & Sizzerman 2008; Wang et al. 2006; [….]
Fergus, Perona, Zisserman, CVPR 2003
Holub, et al. ICCV 2005; Sivic et al. ICCV 2005
Trail Bike
Motorbike
Moped
Go‐cart
HelicopterCar, auto
Bicycle
Backgrou
nd im
age courtesy: A
nton
io Torralba
Biederman 1987
ObjectObjectRecognitionRecognitionESPESP[Ahn et al, 2006]
LabelMeLabelMe[ Russell et al, 2005]
TinyImageTinyImageTorralba et al. 2007
Lotus HillLotus Hill[ Yao et al, 2007]

1 2 3 4 5
1
2
3
4
Caltech101/256MRSC
PASCAL1LabelMe
Tiny Images2
# of visual concept categories (log_10)
# of clean
images per category (lo
g_10
)
1. Excluding the Caltech101 datasets from PASCAL2. No image in this dataset is human annotated. The # of clean images per category is a rough estimation
Comparison among free datasets

Basic evaluation setup
•– 10,000 categories– 9 million images– 50%‐50% train test split
• Multi‐class classification in 1‐vs‐all framework– GIST+NN: filter banks; nearest neighbor (Oliva & Torralba, 2001)– BOW+NN: SIFT, 1000 codewords, BOW; nearest neighbor
– BOW+SVM: SIFT, 1000 codewords, BOW; linear SVM
– SPM+SVM: SIFT, 1000 codewords, Spatial Pyramid; intersection kernel SVM (Lazebnik et al. 2006)
Deng, Berg, Li, & Fei‐Fei, submitted

Computation issues first
Deng, Berg, Li, & Fei‐Fei, submitted
• BOW+SVM– Train one 1‐vs‐all with LIBLINEAR 1 CPU hour– 10,000 categories 1 CPU year
• SPM + SVM– Maji & Berg 2009, LIBLINEAR with piece‐wise linear encoding
– Memory bottleneck. Modification required.– 10,000 categories 6 CPU year
• Parallelized on a cluster– Weeks for a single run of experiments

Size matters
• 6.5% for 10K categories
• Better than we expected (instead of dropping at the rate of 10x; it’s roughly at about 2x)
• An ordering switch between SVM and NN methods when the # of categories becomes large
Deng, Berg, Li, & Fei‐Fei, submitted
Some unpublished results omitted.

• 6.5% for 10K categories
• Better than we expected (instead of dropping at the rate of 10x; it’s roughly at about 2x)
• An ordering switch between SVM and NN methods when the # of categories becomes large
• When dataset size varies, conclusion we can draw about differentcategories varies
Deng, Berg, Li, & Fei‐Fei, submitted
Size matters
Some unpublished results omitted.

• 6.5% for 10K categories
• Better than we expected (instead of dropping at the rate of 10x; it’s roughly at about 2x)
• An ordering switch between SVM and NN methods when the # of categories becomes large
• When dataset size varies, conclusion we can draw about differentcategories varies
• Purely semantic organization of concepts (by WordNet) exhibits meaningful visual structure (ordered by DFS)
Deng, Berg, Li, & Fei‐Fei, submitted
Size matters
Some unpublished results omitted.

Density matters
Deng, Berg, Li, & Fei‐Fei, submitted
• Datasets have very different “density” or “sparcity”

Density matters
• Datasets have very different “density” or “sparcity”
• there is a significant difference in difficulty between different datasets, independent of feature and classier choice.
Deng, Berg, Li, & Fei‐Fei, submitted
Some unpublished results omitted.

Hierarchy matters
• Classifying a “dog” as “cat” is probably not as bad as classifying it as “microwave”
• A simple way to incorporate classification cost
Deng, Berg, Li, & Fei‐Fei, submitted

Hierarchy matters
• Classifying a “dog” as “cat” is probably not as bad as classifying it as “microwave”
• A simple way to incorporate hierarchical classification cost
Deng, Berg, Li, & Fei‐Fei, submitted

is team work!
Other contributors
• Princeton graduate students– Wei Dong– Zhe Wang
• Stanford graduate students– John Le
– Pao Siangliulue
• AMT partner– Dolores Lab
WordNet friends
Christiane FellbaumPrinceton U.
Dan OshersonPrinceton U.
co‐PI
Kai LiPrinceton U.
Research collaborator;ImageNet Challenge boss
Alex BergColumbia U.
Graduate students
Jia DengPrinceton/Stanford
Hao SuStanford U.

outline• Construction of ImageNet
– 2‐step process– Crowdsourcing: Amazon Mechanical Turk (AMT)– Properties of ImageNet
• Benchmarking: what does classifying 10k+ image categories tell us?– Computation matters– Size matters– Density matters– Hierarchy matters
• A “semanticvisual” hierarchy for personal albums– Building it from Flickr images and user tags– Using the hierarchy for visual recognition tasks

Snow boarding Snow mountain
Geological formationSport event
Semantic hierarchy

Nested‐CRP, Blei et al. NIPS 2004
Sivic, Russell, Zisserman, Freeman, Efros, CVPR 2008 Bart, Porteous, Perona, Welling, CVPR 2008
(purely) visual hierarchy

more… more…
more… more… more…
My Pictures
… … …
……
A “semantivisual” hierarchy of images
vacationwork
Hawaii Paris Ski
Li, Wang, Lim, Blei & Fei‐Fei, CVPR, 2010

Class: PoloAthleteHorseGrassTreesSkySaddle
HorseHorseHorse
Horse
SkyTree
GrassHorse
Athlete
…
noisy images and tags
LearningLearning
RecognitionRecognition
GenerativeModel Sky
AthleteTree
MountainRock Class:
Rock climbing
AthleteMountainTreesRockSkyAscent
Sky
Athlete
Water
Tree sailboat
Class: SailingAthleteSailboatTreesWaterSkyWind
“Towards total scene understanding”
L.‐J. Li, R. Socher and L. Fei‐Fei, Towards Total Scene Understanding: Classification, annotation and segmentation in an Automatic Framework. IEEE CVPR, 2009. Oral.

R: Region AppearanceW: WordsN: Node in the treeT: Tree
Li, Wang, Lim, Blei & Fei‐Fei, CVPR, 2010
w1 = parrotw2 = beakw3 = zoo
p(N_ik|R _i, W_k)
p(R_i|R_rest,T)
p(W_k|W_rest,T,R_i)
p(N_ik|T, N_ik_rest)
A “semantivisual” hierarchy of images

R: Region AppearanceW: WordsN: Node in the treeT: Tree
Li, Wang, Lim, Blei & Fei‐Fei, CVPR, 2010
N* = argmax (N_{R})N_{R}: No. Regions assigned to the node
p(N_ik|R _i, W_k)
p(R_i|R_rest,T)
p(W_k|W_rest,T,R_i)
p(N_ik|T, N_ik_rest)
A “semantivisual” hierarchy of images

Li, Wang, Lim, Blei & Fei‐Fei, CVPR, 2010
A “semantivisual” hierarchy of images

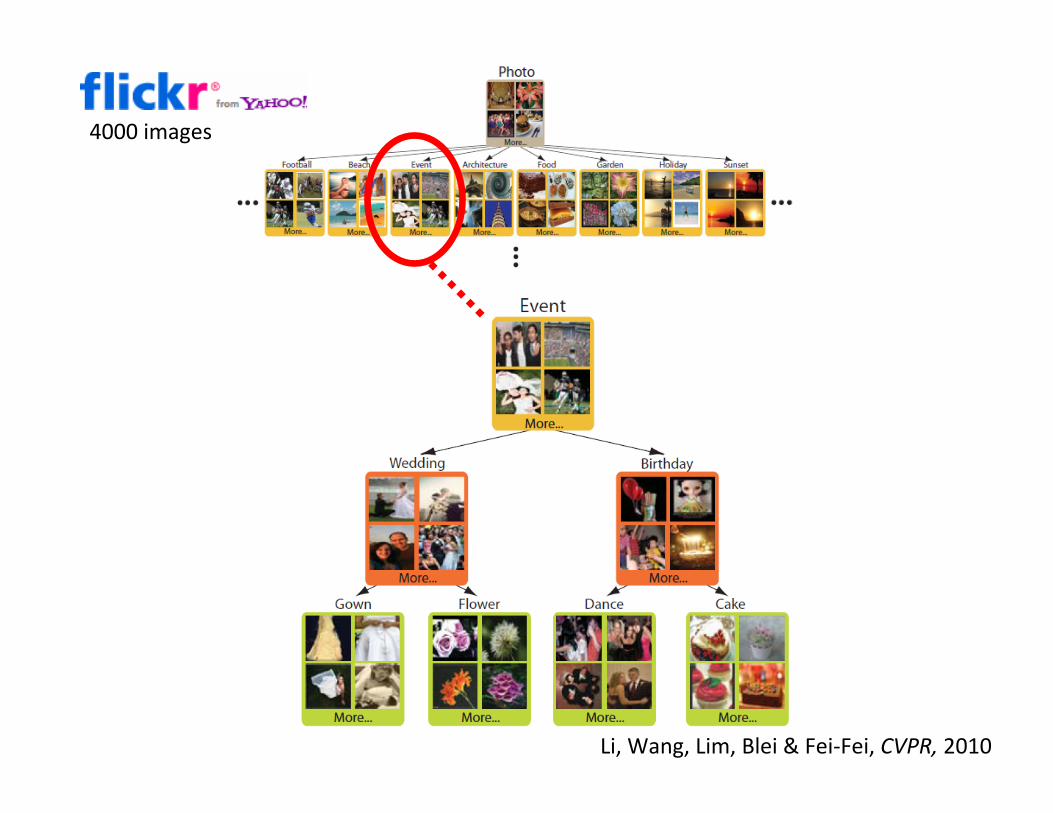
animal, bride, building, cake, child, christmas,church, city, clouds, dessert, dinner, flower, spring, friends, fruit, green, high‐school, calcio, italy, europe, london, love, nature, landscape, macro, paris, party, present, sea, sun, sky, seagull, soccer, reflection, sushi, vacation, trip, water, silhouette, and wife.
40 tags, 4000 images
Li, Wang, Lim, Blei & Fei‐Fei, CVPR, 2010
Li, Wang, Lim, Blei & Fei‐Fei, CVPR, 2010
4000 images

Li, Wang, Lim, Blei & Fei‐Fei, CVPR, 2010
4000 images

Li, Wang, Lim, Blei & Fei‐Fei, CVPR, 2010
4000 images

Li, W
ang, Lim
, Blei &
Fei‐Fei, CVP
R, 2010
4000 images

Evaluating and using the hierarchyEvaluate the quality of image concept clustering by path
Evaluate the quality of hierarchy given a path of the tree
Li, Wang, Lim, Blei & Fei‐Fei, CVPR, 2010

• Hierarchical annotation
Li, Wang, Lim, Blei & Fei‐Fei, CVPR, 2010
Evaluating and using the hierarchy

• Hierarchical annotation
• Image labeling (annotation)
Li, Wang, Lim, Blei & Fei‐Fei, CVPR, 2010
Evaluating and using the hierarchy

• Hierarchical annotation
• Image labeling (annotation)
• Image classification
Li, Wang, Lim, Blei & Fei‐Fei, CVPR, 2010
Evaluating and using the hierarchy

Li‐Jia Li4th year PhDStanford;
“Total scene understanding”;
“Semantivisual hierarchy”
ChrisBaldassano
Juan CarlosNiebles
BangpengYao
Thank you!
Jia Deng4th year PhD Princeton;
“ImageNet”
Hao Su1st year PhDStanford;
“ImageNet”