visual semantic complex network for web imagesvisual semantic complex network for web images shi qiu...
TRANSCRIPT

Visual Semantic Complex Network for Web Images
Shi Qiu1, Xiaogang Wang2,3, and Xiaoou Tang1,3
1Department of Information Engineering, 2Department of Electronic Engineering, The Chinese University of Hong Kong3Shenzhen Institute of Advanced Technology, Chinese Academy of Sciences
{qs010, xtang}@ie.cuhk.edu [email protected]
Abstract
This paper proposes modeling the complex web imagecollections with an automatically generated graph structurecalled visual semantic complex network (VSCN). The nodeson this complex network are clusters of images with bothvisual and semantic consistency, called semantic concepts.These nodes are connected based on the visual and seman-tic correlations. Our VSCN with 33, 240 concepts is gener-ated from a collection of 10 million web images. 1 A greatdeal of valuable information on the structures of the webimage collections can be revealed by exploring the VSCN,such as the small-world behavior, concept community, in-degree distribution, hubs, and isolated concepts. It not onlyhelps us better understand the web image collections at amacroscopic level, but also has many important practicalapplications. This paper presents two application exam-ples: content-based image retrieval and image browsing.Experimental results show that the VSCN leads to signifi-cant improvement on both the precision of image retrieval(over 200%) and user experience for image browsing.
1. Introduction
The enormous and ever-growing amount of images onthe web has inspired many important applications relatedto web image search, browsing, and clustering. Such ap-plications aim to provide users with easier access to webimages. An essential issue facing all these tasks is how tomodel the relevance of images on the web. This problem isparticularly challenging due to the large diversity and com-plex structures of web images. Most search engines rely ontextual information to index web images and measure theirrelevance. Such an approach has some well known draw-backs. Because of the ambiguous nature of textual descrip-tion, images indexed by the same keyword may come fromirrelevant concepts and exhibit large diversity on visual con-tent. More importantly, some relevant images under differ-
1Our VSCN data can be downloaded from http://mmlab.ie.cuhk.edu.hk/project_VSCN.html
apple iphone
……T:
V: 10101101….
……T:
V: 10101101….
palm pixiapple ipad
……T:
V: 10101101….
sun flower
……
T:
V: 10101101….
yellow tulip
……T:
V: 10101101….
Figure 1. Illustration of the VSCN. T and V are textual and visualdescriptors for a semantic concept.
ent keyword indices such as “palm pixi” and “apple iphone”fail to be connected by this approach. Another approachestimates image relevance by comparing visual features ex-tracted from image contents. Various approximate nearestneighbor (ANN) search algorithms (e.g. hashing) have beenused to improve the search efficiency. However, such visualfeatures and ANN algorithms are only effective for imageswith very similar visual content, i.e. near duplicate, and can-not find relevant images that have the same semantic mean-ing but moderate difference in visual content.
Both of the above approaches only allow users to inter-act with the huge web image collections at a microscopiclevel, i.e. exploring images within a very small local regioneither in the textual or visual feature space, which limits theeffective access of web images. We attribute this limita-tion to the lack of a top-down organization of web imagesthat models their underlying visual and semantic structures.Although efforts have been made to manually organize por-tions of web images such as ImageNet [6], it is derived froma human-defined ontology that has inherent discrepancieswith dynamic web images. It is also very expensive to scale.
The purpose of this work is to automatically discoverand model the visual and semantic structures of web imagecollections, study their properties at a macroscopic level,
1
and demonstrate the use of such structures and propertiesthrough concrete applications. To this end, we proposeto model web image collections using the Visual Seman-tic Complex Network (VSCN), an automatically generatedgraph structure (illustrated in Figure 1) on which imagesthat are relevant in both semantics and visual content arewell connected and organized. Our key observation is thatimages on the web are not distributed randomly, but do tendto form visually and semantically compact clusters. Theseimage clusters can be used as the elementary units for mod-eling the structures of web image collections. We automati-cally discover image clusters with both semantic and visualconsistency, and treat them as nodes on the graph. We referto the discovered image clusters as semantic concepts, andassociate them with visual and textual descriptors. Seman-tic concepts are connected with edges based on their visualand semantic correlations. The semantic concepts and theircorrelations bring structures to web images and allow moreaccurate modeling of image relevance. Our VSCN currentlycomprises 33, 240 semantic concepts and around 10 mil-lion web images. Each concept contains an average of 300exemplar images. Given more computation resources, thiscomplex network can be readily scaled by including moreconcepts and more images under each concept.
We can better understand web image collections at amacroscopic level by studying the structural properties ofthe VSCN from the perspective of complex network [1]. Weexplore a few of them in this work, including small-worldbehavior, concept community, hub structures, and isolatedconcepts, and reveal some interesting findings. Such prop-erties provide valuable information that opens doors formany important applications such as text or content-basedweb image retrieval, web image browsing, discovering pop-ular web image topics, and defining image similaritiesbased on structural information [22].
We devote particular attention to two applications:content-based image retrieval (CBIR) and image browsing.For web-scale CBIR, existing approaches typically matchimages with visual features and ANN search algorithms(e.g. hashing). These algorithms often lead only to a smallportion of images highly similar to the query (near dupli-cate). In this work, these detected images are connectedto other relevant images that form community structures onthe VSCN. Therefore, many more relevant images can befound by exploiting the structural information provided bythe VSCN. In the second application, a novel visualizationscheme is proposed for web image browsing. Users can ex-plore the web image collections by navigating the VSCNwithout being limited by query keywords. Our study showsthat the VSCN has small-world behaviour, like many othercomplex networks, which indicates that most semantic con-cepts can reach each other by taking a short path, whichenables efficient image browsing.
2. Related WorkModeling Structure of Web Images: ImageNet [6]
and Tiny Images [20] both provide large-scale hierar-chical structures of images, by associating web imageswith/without human selection to nodes in the WordNet on-tology. They both inherit the structure of WordNet, whichis pre-defined by human experts and does not well cap-ture the diverse and dynamic images on the web. In con-trast, our VSCN is automatically generated from the visualand textual contents on the web, making it well-suited fortasks related to web images. Visual Synset [21] and LCSS[14] learn a set of prototypical concepts from web images,but neither of them model the correlations among concepts.Their learned concepts are used independently for imageannotation tasks. ImageKB [26] obtains representative en-tities for web images and organizes these entities by divid-ing them into different categories according to an entity-category table. Our VSCN differs from ImageKB in that weorganize the semantic concepts using a complex network,which provides richer information about the structures ofweb images, as presented in Section 4.
Content-Based Image Retrieval: Content-based im-age retrieval (CBIR) has been studied for years, and al-though remarkable progress has been made in specific areas,such as particular object retrieval [16], duplicate image re-trieval [27], scalable indexing [10, 8], and image re-ranking[3, 4, 19, 24, 25, 17], the fundamental problem of findingsemantically similar images remains largely unsolved. Itis especially difficult for web-scale image collections. Inrecent years, vision researchers have tried to approach thisproblem from several directions, including leveraging high-level semantic attributes and signatures [5, 24, 25], fusingmultiple types of visual features [7], and learning semantic-preserving image similarity [2]. Such efforts have aimed toclose the semantic gap by learning more powerful featuresand similarities, but the large variation of visual contentsmake this problem extremely challenging. This challengeimplies the need for a better organization method that wellmodels the structures of web images to improve web-scaleCBIR.
Image Collection Browsing: An effective browsingscheme is critical for users to access their desired images[12]. A number of browsing schemes organize images ona plane based on visual similarities [13], such that imageswith higher visual similarities are placed closer. Thesemethods do not consider the underlying semantic structure,which is very important for understanding the overall con-tent of an image collection. IGroup [23] groups images us-ing surrounding texts and enables users to browse imagesby semantic clusters. However, it ignores the relationshipsamong semantic clusters. All of these approaches are moresuitable for browsing an image collection under one partic-ular query, but not the entire web image collection.
apple iphone
Images +Metadata
Top Queries:apple, avatar,
barcelona, paris, palm, …
(a)
…fatest iphone ever…
…purchase iphone online…
…apple Inc. iphone 3…
…apple fruit…
…healthy fruits…
…apple fruit salad… … macbook pro family…
…new macbookdesign…
… macbook retina…
. . . . . .
Query: appleQuery: palm
T:
V:
apple fruit T:
V:
apple macbookT:
V:
palm pixi T:
V:
…… ……
10101101….
01001001….
01110101….
10111101….…… ……
apple macbook
apple iphone
apple fruit
Palm pixi
apple macbook
apple iphone
apple fruit
Palm pixi
Image Search Engines
(b) (c) (e)(d)
Semantic correlation
Visual correlation
Query space
Local concept space
Image BrowsingImage Retrieval
…
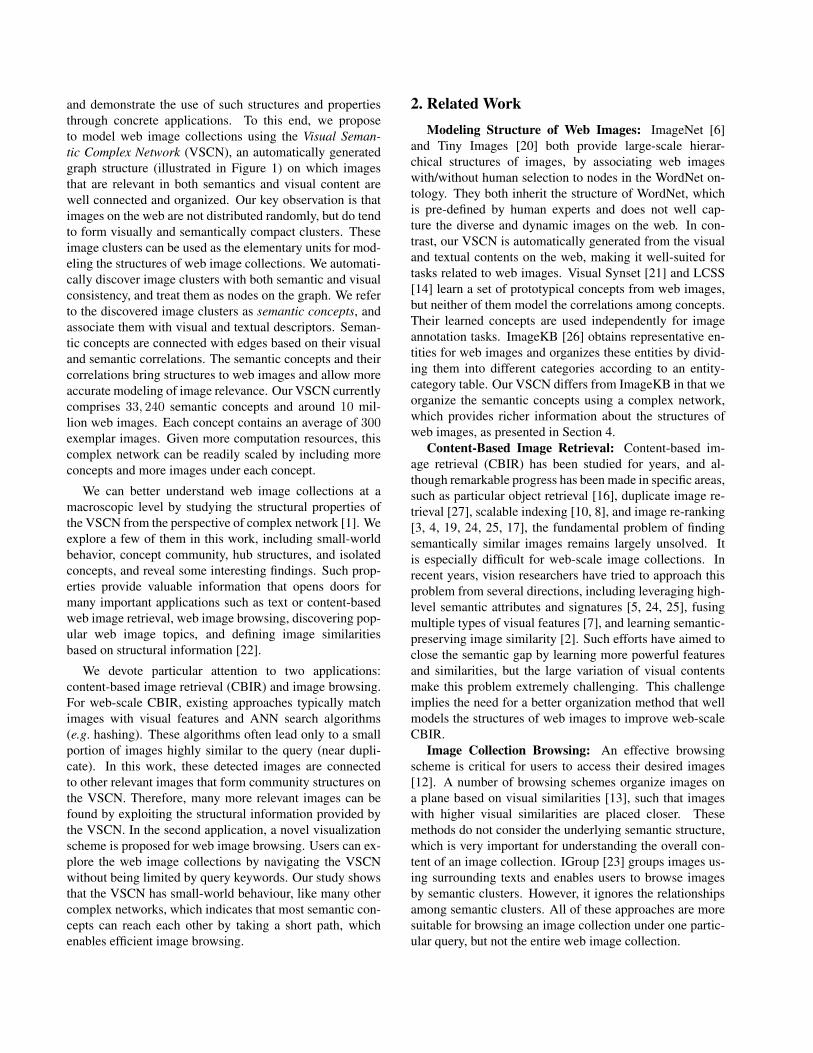
Figure 2. Flowchart of VSCN construction (best viewed in color).
3. VSCN Construction
3.1. Semantic Concept Discovery
The flowchart of constructing VSCN is shown in Figure2. Starting with 2, 000 top query keywords of Bing imagesearch engine, we automatically discover 33, 240 semanticconcepts that are compact image clusters with visual andsemantic consistency. Our method learns the semantic con-cepts by discovering keywords that occur frequently in vi-sually similar images. These discovered keywords corre-late well with the image content and therefore leads to de-scriptive concepts. We summarize the method of conceptdiscovery in Algorithm 1. For every query q, e.g. “apple”,we submit q to an image search engine. With the retrievedcollection of images Iq and surrounding texts Tq , their rel-evant semantic concepts, such as “apple fruit” and “appleiphone”, can be automatically discovered. Such conceptshave more specific semantic meanings and less visual di-versity, and can be viewed as elementary units of web im-age collections. The learned concepts under query keywordq are denoted as Cq = {ci}
Mq
i=1. The concepts learned fromdifferent queries form the nodes of the VSCN.
3.2. Inter-concept Correlations
We further explore correlations between semantic con-cepts. As the number of concepts is very large (33240 in thiswork, and potentially even larger if we expand the VSCN),we use two efficient methods to compute semantic and vi-sual correlations as described below.
Semantic correlation is computed using the GoogleKernel (GK) proposed by Sahami et al. [18]. We adopt thismethod because it has been shown to work robustly in mea-suring the similarity of two short texts (a short text containsa set of keywords) at the semantic level, and because of itsefficiency. For a short text x, a set of Google snippets S(x)is obtained from the Google web search. A Google snip-pet is a short text summary generated by Google for eachsearch result item with query c. We collect the snippets ofthe top N search result items, which provide rich semantic
Algorithm 1 Concept Discovery through Query ExpansionInput: Query q, image collection Iq , surrounding texts Tq .Output: Learned concept set Cq = {ci}Mq
i=1.1: Initialization: Cq := ∅, rI(w) := 0.2: for all images Ik ∈ Iq do3: Find the top K visual neighbors, denote asN (Ik)4: Let WIk = {wi
Ik}Ti=1 be the T most frequent words in the
surrounding texts ofN (Ik).5: for all words wi
Ik∈W (Ik) do
6: rI(wiIk) := rI(w
iIk) + (T − i).
7: end for8: end for9: Combine q and the Mq words with largest rI(w) to form Cq .
context for x. We then determine the similarity between twotexts x1 and x2 by computing the textual similarity betweenS(x1) and S(x2) using the term vector model and cosinesimilarity. For each concept ci ∈ C,
1. Use ci as a query input on the Google web search.2. Collect the top 50 Google snippets, denoted as S(ci).3. Compute the term frequency (TF) vector of S(ci) and
keep the top 100 terms with highest TFs.4. L2-normalize the truncated vector, and denote the re-
sult vector as ntf(ci).
The semantic correlation between ci and cj is:
S Cor = Cosine(ntf(ci), ntf(cj)). (1)
Visual correlation of two concepts is measured by thevisual similarity between their corresponding exemplar im-age sets. For each concept, its exemplar image set consistsof the top 300 images retrieved from the search engine byusing the concept as query keyword. This exemplar imageset is further represented as a binary code by sim-hashingalgorithm [15]. This sim-hashing code can be viewed as avisual signature of the original exemplar image set. The vi-sual similarity between any pair of exemplar image sets canthen be approximated by the negative of hamming distancebetween their sim-hashing codes. Concretely, for a conceptci ∈ C, we denote its exemplar image set by Ici.
10 20 30 40 500.6
0.7
0.8
0.9
1
Frac
tion
of la
rges
t con
nect
ed c
omp.
K (neighborhood size)10 20 30 40 50
5
10
15
L (a
vera
ge s
horte
st p
ath
leng
th)
100 101 102100
101
102
103
# of
nod
es
In-degree100 101 102 0
0.5
1
Cum
ulat
ive
frequ
ency
(20, 0.96)
(20, 6.4)
(100, 0.99)
(20, 0.74)
(a) (b)
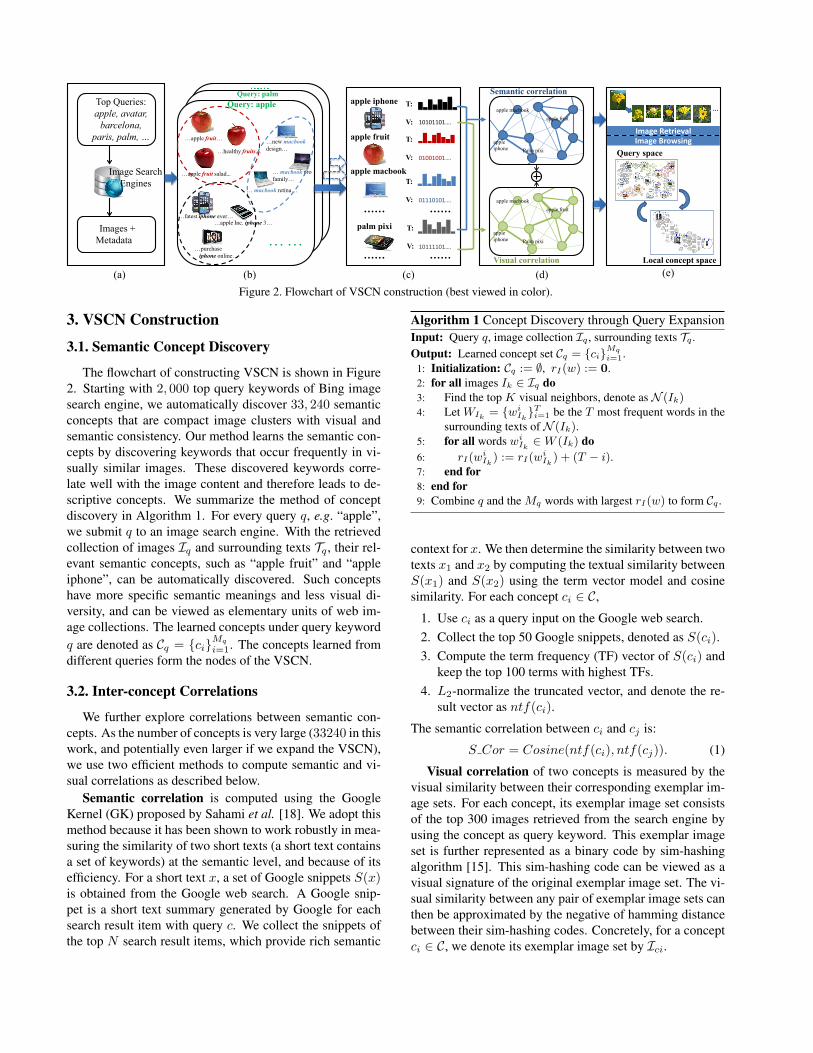
Figure 3. (a) Size and the average shortest path length of the largestconnected component on the VSCN. (b) In-degree distribution andcumulative frequency. See Section 4.1 and 4.2 for details.
apple laptopapple mouse
mighty mouse mickey disney disney logo
Figure 4. The path connecting two semantically irrelevant con-cepts “apple laptop” and “disney logo”. “mighty mouse” onthe path is a key step that contains two dominant components—computer mouse and cartoon character—from different domains.
1. Ik ∈ Ici is encoded in an M-dimensional binary vectorH(Ik) using an M-bit base hashing function H 2.
2. Accumulate the binary vectors as A =∑
H(Ik).
3. Quantize the accumulated vector back to binary vector,simhash(ci) = sign(A).
The visual correlation between ci and cj is,
V Cor = 1− 1
MHamDist(simhash(ci), simhash(cj)).
We fuse the semantic correlation and visual correlation byCor = S cor+V cor. Finally, we build the VSCN as aK-nearest-neighbor (K-NN) graph by connecting each node toits top K neighbors with the largest correlations.
3.3. ComplexityAfter downloading the images and metadata, our method
takes 70 seconds to learn semantic concepts from one query.Discovering all 33,240 concepts takes 40 CPU hours. Theinter-concept correlations requires the computation of co-sine similarity between sparse word histograms and ham-ming distance between binary vectors, both of which canbe done efficiently. Computing the two types of correlationstakes 3 and 11 CPU hours, respectively.
4. Exploring Structures of the VSCNComplex networks have many important properties [1],
some of which are explored with our VSCN in this section.The study of these properties not only yields a better under-standing of web image collections at a macroscopic level,but also provides valuable information that assists in impor-tant tasks including CBIR and image browsing, as presentedin Section 5 and 6.
2Here we represent each bit with ±1.
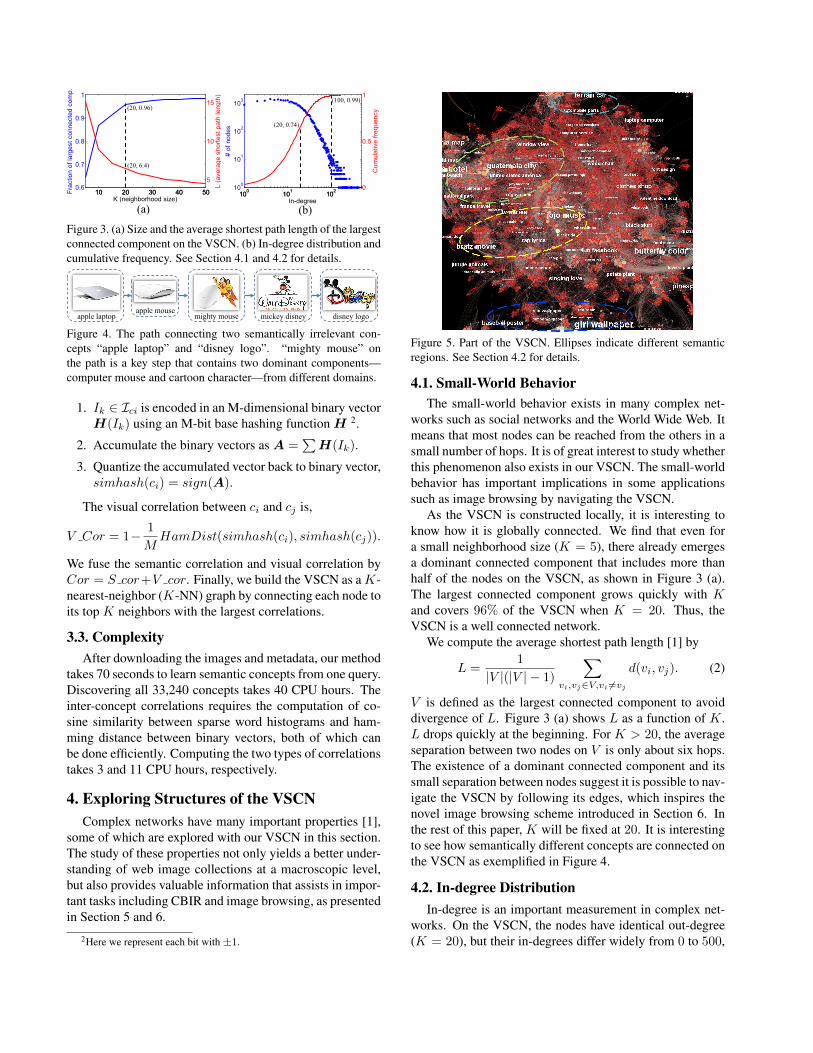
Figure 5. Part of the VSCN. Ellipses indicate different semanticregions. See Section 4.2 for details.
4.1. Small-World BehaviorThe small-world behavior exists in many complex net-
works such as social networks and the World Wide Web. Itmeans that most nodes can be reached from the others in asmall number of hops. It is of great interest to study whetherthis phenomenon also exists in our VSCN. The small-worldbehavior has important implications in some applicationssuch as image browsing by navigating the VSCN.
As the VSCN is constructed locally, it is interesting toknow how it is globally connected. We find that even fora small neighborhood size (K = 5), there already emergesa dominant connected component that includes more thanhalf of the nodes on the VSCN, as shown in Figure 3 (a).The largest connected component grows quickly with Kand covers 96% of the VSCN when K = 20. Thus, theVSCN is a well connected network.
We compute the average shortest path length [1] by
L =1
|V |(|V | − 1)
∑vi,vj∈V,vi 6=vj
d(vi, vj). (2)
V is defined as the largest connected component to avoiddivergence of L. Figure 3 (a) shows L as a function of K.L drops quickly at the beginning. For K > 20, the averageseparation between two nodes on V is only about six hops.The existence of a dominant connected component and itssmall separation between nodes suggest it is possible to nav-igate the VSCN by following its edges, which inspires thenovel image browsing scheme introduced in Section 6. Inthe rest of this paper, K will be fixed at 20. It is interestingto see how semantically different concepts are connected onthe VSCN as exemplified in Figure 4.
4.2. In-degree DistributionIn-degree is an important measurement in complex net-
works. On the VSCN, the nodes have identical out-degree(K = 20), but their in-degrees differ widely from 0 to 500,
100 101 102100
101
102
103
# of
clu
ster
s
Cluster size0 1000 2000 3000 4000 5000
0
50
100
150
200
250
Clu
ster
siz
e
Rank
(a) (b)
(c) (d)
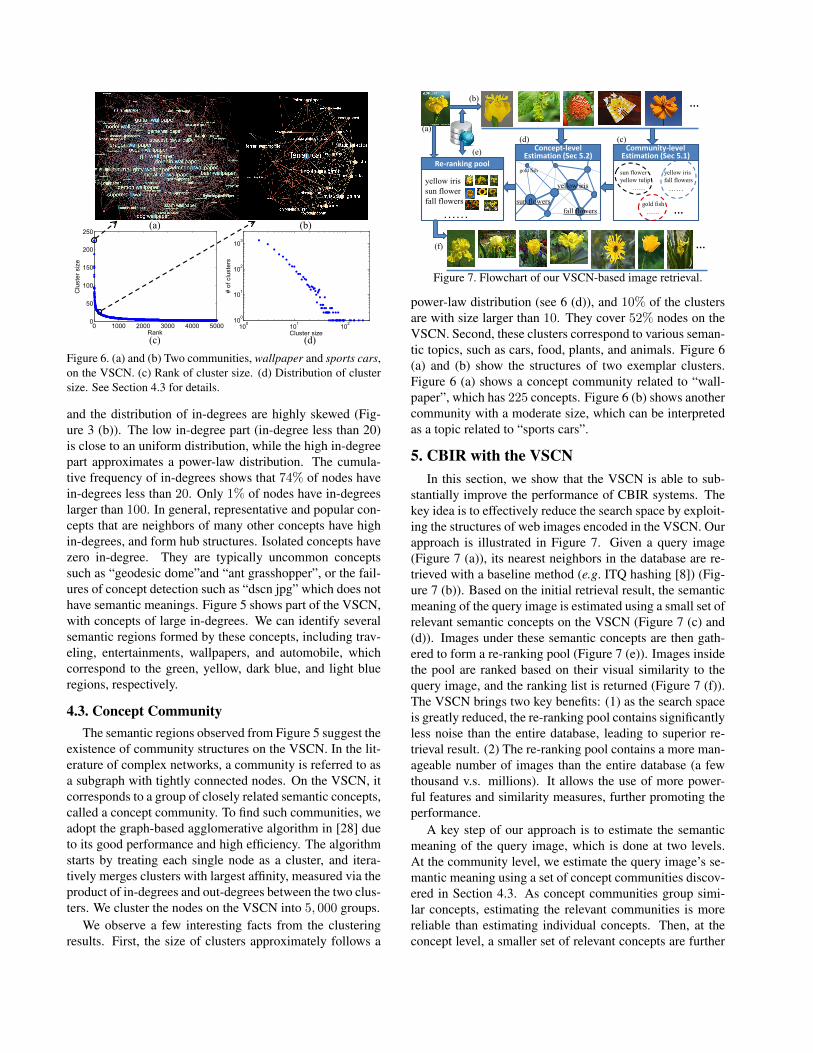
Figure 6. (a) and (b) Two communities, wallpaper and sports cars,on the VSCN. (c) Rank of cluster size. (d) Distribution of clustersize. See Section 4.3 for details.
and the distribution of in-degrees are highly skewed (Fig-ure 3 (b)). The low in-degree part (in-degree less than 20)is close to an uniform distribution, while the high in-degreepart approximates a power-law distribution. The cumula-tive frequency of in-degrees shows that 74% of nodes havein-degrees less than 20. Only 1% of nodes have in-degreeslarger than 100. In general, representative and popular con-cepts that are neighbors of many other concepts have highin-degrees, and form hub structures. Isolated concepts havezero in-degree. They are typically uncommon conceptssuch as “geodesic dome”and “ant grasshopper”, or the fail-ures of concept detection such as “dscn jpg” which does nothave semantic meanings. Figure 5 shows part of the VSCN,with concepts of large in-degrees. We can identify severalsemantic regions formed by these concepts, including trav-eling, entertainments, wallpapers, and automobile, whichcorrespond to the green, yellow, dark blue, and light blueregions, respectively.
4.3. Concept CommunityThe semantic regions observed from Figure 5 suggest the
existence of community structures on the VSCN. In the lit-erature of complex networks, a community is referred to asa subgraph with tightly connected nodes. On the VSCN, itcorresponds to a group of closely related semantic concepts,called a concept community. To find such communities, weadopt the graph-based agglomerative algorithm in [28] dueto its good performance and high efficiency. The algorithmstarts by treating each single node as a cluster, and itera-tively merges clusters with largest affinity, measured via theproduct of in-degrees and out-degrees between the two clus-ters. We cluster the nodes on the VSCN into 5, 000 groups.
We observe a few interesting facts from the clusteringresults. First, the size of clusters approximately follows a
sun flowers
yellow iris
fall flowers
…
yellow irissun flowerfall flowers
…… …
…
gold fish yellow irisfall flowers
……
sun floweryellow tulip
……
gold fish……
Community-level Estimation (Sec 5.1)
Re-ranking pool
(a)
(b)
(c)(d)(e)
(f)
Concept-level Estimation (Sec 5.2)
Figure 7. Flowchart of our VSCN-based image retrieval.
power-law distribution (see 6 (d)), and 10% of the clustersare with size larger than 10. They cover 52% nodes on theVSCN. Second, these clusters correspond to various seman-tic topics, such as cars, food, plants, and animals. Figure 6(a) and (b) show the structures of two exemplar clusters.Figure 6 (a) shows a concept community related to “wall-paper”, which has 225 concepts. Figure 6 (b) shows anothercommunity with a moderate size, which can be interpretedas a topic related to “sports cars”.
5. CBIR with the VSCNIn this section, we show that the VSCN is able to sub-
stantially improve the performance of CBIR systems. Thekey idea is to effectively reduce the search space by exploit-ing the structures of web images encoded in the VSCN. Ourapproach is illustrated in Figure 7. Given a query image(Figure 7 (a)), its nearest neighbors in the database are re-trieved with a baseline method (e.g. ITQ hashing [8]) (Fig-ure 7 (b)). Based on the initial retrieval result, the semanticmeaning of the query image is estimated using a small set ofrelevant semantic concepts on the VSCN (Figure 7 (c) and(d)). Images under these semantic concepts are then gath-ered to form a re-ranking pool (Figure 7 (e)). Images insidethe pool are ranked based on their visual similarity to thequery image, and the ranking list is returned (Figure 7 (f)).The VSCN brings two key benefits: (1) as the search spaceis greatly reduced, the re-ranking pool contains significantlyless noise than the entire database, leading to superior re-trieval result. (2) The re-ranking pool contains a more man-ageable number of images than the entire database (a fewthousand v.s. millions). It allows the use of more power-ful features and similarity measures, further promoting theperformance.
A key step of our approach is to estimate the semanticmeaning of the query image, which is done at two levels.At the community level, we estimate the query image’s se-mantic meaning using a set of concept communities discov-ered in Section 4.3. As concept communities group simi-lar concepts, estimating the relevant communities is morereliable than estimating individual concepts. Then, at theconcept level, a smaller set of relevant concepts are further
identified from the previously identified communities. Bothlevels fully exploit the structural information of the VSCN,which makes our approach more robust.
5.1. Community-level EstimationWe denote detected concept communities by {Ti}KT
i=1.Given a query image Iq , a list of top-ranked images andtheir distances to Iq are returned by an off-the-shelf retrievalalgorithm (e.g. ITQ hasing [8]). From the truncated list{(Ik, dk)}NI
k=1, we calculate a relevance score for each Tias:
s(Ti) =
NI∑k=1
exp(−dσ
) · χ[c(Ik), Ti]. (3)
c(Ik) is the concept to which the database image Ik be-longs. χ[c(Ik), Ti] is 1 if c(Ik) ∈ Ti and 0 otherwise.σ = 1
NI
∑Ni=1 di. After the relevance scores are calculated
for all the communities, the top NT with the largest rele-vance scores are kept. The union of concepts included inthese concept communities is denoted by C ′ = {c′i}
NCi=1.
5.2. Concept-level EstimationThe results of community-level estimation enable us to
focus on a small subset of concepts C ′. In order to bestidentify the most relevant concepts out of C ′, we jointlyleverage two sources of information. The first source is therelevance score derived from the ranking list returned by thebaseline algorithm. Similar to Section 5.1, we compute theinitial relevance score for each concept c′i ∈ C ′ as:
s(c′i) =
NI∑k=1
exp(−dσ
) · 1[c(Ik) = c′i], (4)
where 1[·] is the indicator function, and σ is the sameas that in Equation 3. As s(c′i) is not sufficiently re-liable, we introduce the second source of information—correlations between semantic concepts—to refine the noisyrelevance score. To this end, we further construct a graphG′(V ′, E′,W ′) by extracting a subgraph from the VSCN,where V ′ are nodes corresponding to C ′, E′ are edges withboth nodes in V ′, and W ′ are the weights associated withE′. To integrate the two information sources, we conduct aRandom Walk with Restart (RWR) on G′, characterized by
pn+1 = αPT pn + (1− α)π, (5)where pn is the walker’s probability distribution over V ′
at step n. P is the transition matrix derived from W ′ andπ(i) = s(c′i)/
∑i s(c
′i). The physical meaning of Equation
5 can be interpreted as, at each step, the random walkereither walks, with probability α, along the E′ according tothe transition matrix P or restarts, with probability 1 − α,from a fixed probability distribution π. Therefore, the twoinformation sources, incorporated into the two terms on ther.h.s. of Equation 5, respectively, are fused by RWR up tothe balance factor α. The equilibrium distribution p of theRWR is known as the personalized PageRank vector [11],which has the following analytical solution:
p = (1− α)(I− αPT )−1π, (6)where a larger probability in p indicates higher relevance ofthe corresponding node. We rank the semantic concepts ac-cording to their probability values in p, and reserve the topNC to represent the semantic meaning of the query image.
Images of the top NC concepts are gathered and form anre-ranking pool, which are matched with the query image.
5.3. Implementation DetailsMultiple visual features, including Color Signature,
Color Spatialet, Wavelet, EOH, HOG, and Gist, are con-catenated [19]. We apply ITQ hashing [8] to compress orig-inal features into 128-bit vectors. We use ITQ hashing as thebaseline as it has been shown to achieve state-of-the-art per-formance. At the re-ranking stage of our approach, originalimage features are used to generate the final ranking list.We set the parameters NI , NT , and NC to 200, 5, and 10,respectively, by a pilot experiment on a small set of queryimages. The balance factor α of RWR is fixed at 0.85 asrecommended in [11].
5.4. Experiments of CBIRDataset. We collect a set of query images to search
against images of the VSCN. Since the VSCN images aregathered from Bing, we collect query images from Google.We submit the names of semantic concepts to Google andobtain the top five images returned. They are combined toform a query dataset with 160K images. Images sampledfrom this dataset are queried against the VSCN images.
Evaluation. For each query image, the top 100 im-ages are retrieved and are manually labelled as being rel-evant/irrelevant to the query image. The performance isevaluated using average precision (AP@k). As the label-ing of retrieval results is labor-intensive, we sampled 10Kimages from the query dataset for quantitative evaluation.We compare our approach with ITQ hasing [8].
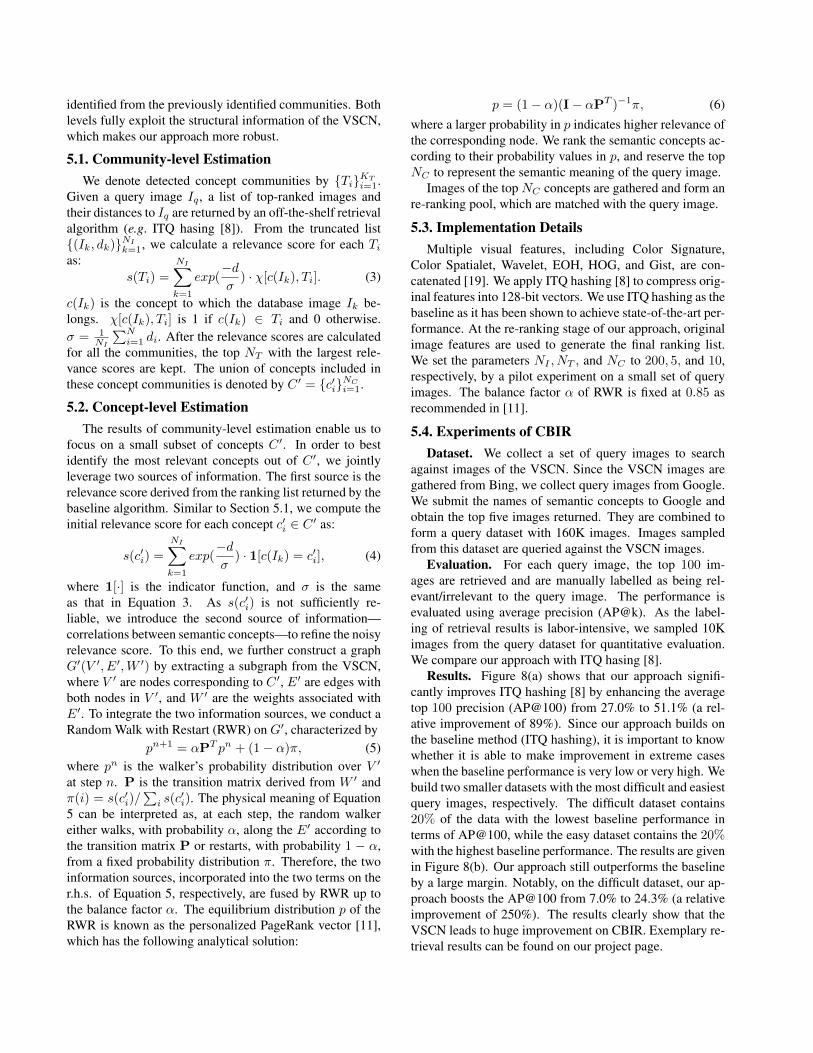
Results. Figure 8(a) shows that our approach signifi-cantly improves ITQ hashing [8] by enhancing the averagetop 100 precision (AP@100) from 27.0% to 51.1% (a rel-ative improvement of 89%). Since our approach builds onthe baseline method (ITQ hashing), it is important to knowwhether it is able to make improvement in extreme caseswhen the baseline performance is very low or very high. Webuild two smaller datasets with the most difficult and easiestquery images, respectively. The difficult dataset contains20% of the data with the lowest baseline performance interms of AP@100, while the easy dataset contains the 20%with the highest baseline performance. The results are givenin Figure 8(b). Our approach still outperforms the baselineby a large margin. Notably, on the difficult dataset, our ap-proach boosts the AP@100 from 7.0% to 24.3% (a relativeimprovement of 250%). The results clearly show that theVSCN leads to huge improvement on CBIR. Exemplary re-trieval results can be found on our project page.
25%
35%
45%
55%
65%
75%
Top10 Top30 Top50 Top70 Top90
Aver
age
Pre
cisi
onITQITQ + VSCN
0%
20%
40%
60%
80%
100%
Top10 Top30 Top50 Top70 Top90
Aver
age
Pre
cisi
on
ITQ DifficultITQ + VSCN DifficultITQ EasyITQ + VSCN Easy
Figure 8. Retrieval performance of our approach (ITQ hasing +VSCN) and the baseline method (ITQ hasing). (a) Average pre-cision on the 10K query dataset. (b) Average precision on thedifficult and easy datasets.
6. Image Browsing with the VSCNThis section presents a new browsing scheme that helps
users explore the VSCN and find images of interest. Theuser starts browsing by entering a query keyword to the sys-tem. Since the size of the VSCN is huge, we provide localviews. As shown in Figure 2(e), our scheme allows users tobrowse two spaces—the query space and the local conceptspace—each of which only presents a small subgraph of theentire VSCN. A query space visualizes semantic conceptsgenerated by the same query. For example, the query spaceof “apple” contains concepts such as “apple fruit”, “appleiphone”, “apple pie”, and their corresponding images. Alocal concept space visualizes a centric concept (e.g., “ap-ple iphone”) together with its neighbor concepts (e.g. “htcdiamond” and “palm pixi”), which may come from differ-ent query keywords. In this way, it bridges images of mostrelated concepts and helps users access more images of in-terest without being limited by their initial queries.
In the browsing process, users can freely switch betweenthe two spaces. A user who chooses a particular concept inthe query space enters into the local concept space and thechosen concept becomes the centric concept. The user canthen move to a new concept space by choosing a neighbor-ing concept. In this way, users can navigate over the VSCNand search for target images. Figure 11 illustrates an imagebrowsing process across the two spaces.
6.1. Visualizing the VSCNGood visualization is essential for enhancing users’ ex-
perience. Here, we provide an intuitive and informativemethod to visualize the two spaces. The subgraph in thecurrent space is first visualized as nodes and edges. Thisstep provides the concept-level visualization and defines theglobal layout of the visualization result. In image-level vi-sualization, we present images in a hexagon lattice. Ex-emplar images are assigned either to cells around nodes torepresent specific concepts, or to cells along edges to reflectvisual transitions between concepts. The final visualizationresult can effectively deliver the visual and semantic contentof the current space. The detailed algorithm of visualizingthe VSCN is omitted here due to space limitation. 3
3The algorithm details and a video demonstration of our browsingscheme can be found on our project page.
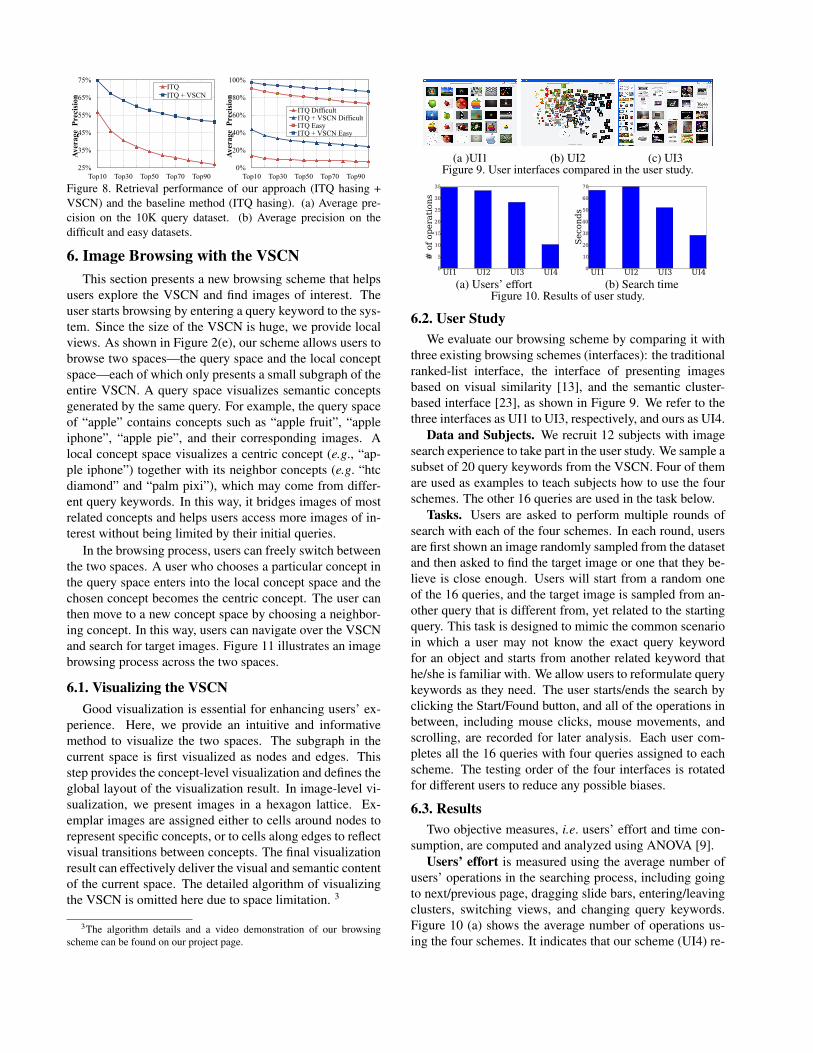
(a )UI1 (b) UI2 (c) UI3Figure 9. User interfaces compared in the user study.
UI1 UI2 UI3 UI40
5
10
15
20
25
30
35
# o
f op
era
tion
s
(a) Users’ effortUI1 UI2 UI3 UI4
0
10
20
30
40
50
60
70
Seco
nd
s
(b) Search timeFigure 10. Results of user study.
6.2. User StudyWe evaluate our browsing scheme by comparing it with
three existing browsing schemes (interfaces): the traditionalranked-list interface, the interface of presenting imagesbased on visual similarity [13], and the semantic cluster-based interface [23], as shown in Figure 9. We refer to thethree interfaces as UI1 to UI3, respectively, and ours as UI4.
Data and Subjects. We recruit 12 subjects with imagesearch experience to take part in the user study. We sample asubset of 20 query keywords from the VSCN. Four of themare used as examples to teach subjects how to use the fourschemes. The other 16 queries are used in the task below.
Tasks. Users are asked to perform multiple rounds ofsearch with each of the four schemes. In each round, usersare first shown an image randomly sampled from the datasetand then asked to find the target image or one that they be-lieve is close enough. Users will start from a random oneof the 16 queries, and the target image is sampled from an-other query that is different from, yet related to the startingquery. This task is designed to mimic the common scenarioin which a user may not know the exact query keywordfor an object and starts from another related keyword thathe/she is familiar with. We allow users to reformulate querykeywords as they need. The user starts/ends the search byclicking the Start/Found button, and all of the operations inbetween, including mouse clicks, mouse movements, andscrolling, are recorded for later analysis. Each user com-pletes all the 16 queries with four queries assigned to eachscheme. The testing order of the four interfaces is rotatedfor different users to reduce any possible biases.
6.3. ResultsTwo objective measures, i.e. users’ effort and time con-
sumption, are computed and analyzed using ANOVA [9].Users’ effort is measured using the average number of
users’ operations in the searching process, including goingto next/previous page, dragging slide bars, entering/leavingclusters, switching views, and changing query keywords.Figure 10 (a) shows the average number of operations us-ing the four schemes. It indicates that our scheme (UI4) re-

Query space of apple Query space of palm
Local concept space of apple iphone and apple tree
Figure 11. across query spaces and local concept spaces. Two browsing paths connecting the query spaces of apple and palm are highlighted. When usersclick apple iphone in the query space of apple, the local concept space is shown, with two more neighboring concepts, namely htc diamond and palm pixi.Exemplar images and visual transitions (indicated by red dashed lines) are also displayed. Users can further enter the query space of palm by clicking onthe concept of palm pixi. The case is similar if users click apple tree.
quires the least amout of users’ effort out of all the schemes.ANOVA test shows that the advantage of our scheme is sta-tistically significant, F (3, 212) = 15.9, p < 0.0014.
Average search time is a direct measure of the efficiencyof the four schemes. Figure 10 (b) shows that our schemetakes the least search time, F (3, 212) = 18.3, p < 0.001.
7. ConclusionsThis paper has proposed a novel visual semantic com-
plex network to model the complex structures of a webimage collection. We studied multiple fundamental struc-tures of complex networks, which reveal some interestingfacts about the VSCN. They not only help us understandthe huge web image collection at a macroscopic level, butare also valuable in practical applications. Two exemplarapplications show that exploiting structural information ofthe VSCN not only substantially improves the precisions ofCBIR, but also greatly enhances the user experience in webimage search and browsing. Many more applications of theVSCN are to be studied in future work.
AcknowledgementsThe authors would like to thank Deli Zhao for helpful
discussions and Wei Li for help with ANOVA. This work issupported by the General Research Fund sponsored by theResearch Grants Council of the Kong Kong SAR (ProjectNo. CUHK 416713) and Guangdong Innovative ResearchTeam Program (No.201001D0104648280).
References[1] S. Boccaletti, V. Latora, Y. Moreno, M. Chavez, and D.-U. Hwang. Complex
networks: Structure and dynamics. Physics Reports, (45), 2006.
[2] G. Chechik, V. Sharma, U. Shalit, and S. Bengio. An online algorithm for largescale image similarity learning. In Proc. NIPS, 2009.
[3] J. Cui, F. Wen, and X. Tang. Intentsearch: interactive on-line image searchre-ranking. In Proc. ACM MM, 2008.
4In ANOVA, a smaller p-value indicates larger statistical significance.Normally, p < 0.01 is considered significant.
[4] J. Cui, F. Wen, and X. Tang. Real time google and live image search re-ranking.In Proc. ACM MM, 2008.
[5] J. Deng, A. Berg, and L. Fei-Fei. Hierarchical semantic indexing for large scaleimage retrieval. In Proc. CVPR, 2011.
[6] J. Deng, W. Dong, R. Socher, L.-J. Li, K. Li, and L. Fei-Fei. Imagenet: Alarge-scale hierarchical image database. In Proc. CVPR, 2009.
[7] M. Douze, A. Ramisa, and C. Schmid. Combining attributes and fisher vectorsfor efficient image retrieval. In Proc. CVPR, 2011.
[8] Y. Gong and S. Lazebnik. Iterative quantization: A procrustean approach tolearning binary codes. In Proc. CVPR, 2011.
[9] D. Howell. Statistical methods for psychology. Wadsworth Pub Co, 2009.[10] H. Jegou, M. Douze, C. Schmid, and P. Perez. Aggregating local descriptors
into a compact image representation. In Proc. CVPR, 2010.[11] A. Langville and C. Meyer. Deeper inside pagerank. Internet Mathematics,
1:335–380, 2004.[12] D. Lewandowski. Search engine user behaviour: How can users be guided to
quality content? Information Sevices & Use, 2008(28), 2008.[13] H. Liu, X. Xie, X. Tang, Z.-W. Li, and W.-Y. Ma. Effective browsing of web
image search results. In Proc. ACM MIR, 2004.[14] Y. Lu, L. Zhang, J. Liu, and Q. Tian. Constructing concept lexica with small
semantic gaps. TMM, 2010.[15] G. Manku, A. Jain, and A. Das Sarma. Detecting near-duplicates for web crawl-
ing. In Proc. WWW, 2007.[16] D. Nister and H. Stewenius. Scalable recognition with a vocabulary tree. In
Proc. CVPR, 2006.[17] S. Qiu, X. Wang, and X. Tang. Anchor concept graph distance for web image
re-ranking. In Proc. ACM MM, 2013.[18] M. Sahami and T. D. Heilman. A web-based kernel function for measuring the
similarity of short text snippets. In Proc. WWW, 2006.[19] X. Tang, K. Liu, J. Cui, F. Wen, and X. Wang. Intentsearch: Capturing user
intention for one-click internet image search. TPAMI, 2012.[20] A. Torralba, R. Fergus, and W. T. Freeman. 80 million tiny images: A large
data set for nonparametric object and scene recognition. TPAMI, 2008.[21] D. Tsai, Y. Jing, Y. Liu, H. Rowley, S. Ioffe, and J. Rehg. Large-scale image
annotation using visual synset. In Proc. ICCV, 2011.[22] N. Verma, D. Mahajan, S. Sellamanickam, and V. Nair. Learning hierarchical
similarity metrics. In Proc. CVPR, 2012.[23] S. Wang, F. Jing, J. He, Q. Du, and L. Zhang. Igroup: presenting web image
search results in semantic clusters. In Proc. ACM SIGCHI, 2007.[24] X. Wang, K. Liu, and X. Tang. Query-specific visual semantic spaces for web
image re-ranking. In Proc. CVPR, 2011.[25] X. Wang, S. Qiu, K. Liu, and X. Tang. Web image re-ranking using query-
specific semantic signatures. TPAMI, 2013.[26] X.-J. Wang, Z. Xu, L. Zhang, C. Liu, and Y. Rui. Towards indexing represen-
tative images on the web. In Proc. ACM MM, 2012.[27] Z. Wu, Q. Ke, M. Isard, and J. Sun. Bundling features for large scale partial-
duplicate web image search. In Proc. CVPR, 2009.[28] W. Zhang, X. Wang, D. Zhao, and X. Tang. Graph degree linkage: Agglomer-
ative clustering on a directed graph. In Proc. ECCV, 2012.