visual withdata and storytelling information
TRANSCRIPT
VISUAL
WITH DATA AND
STORYTELLING
INFORMATIONBryan Connor &Heather Bradbury

Figures often beguile me, particularly when I have
the arranging of them myself. - Mark Twain

The greatest value of a picture is when it forces us to notice
what we never expected to see.
— John W. Tukey Exploratory Data Analysis, 1977

Storytelling* with data
*Non-fiction
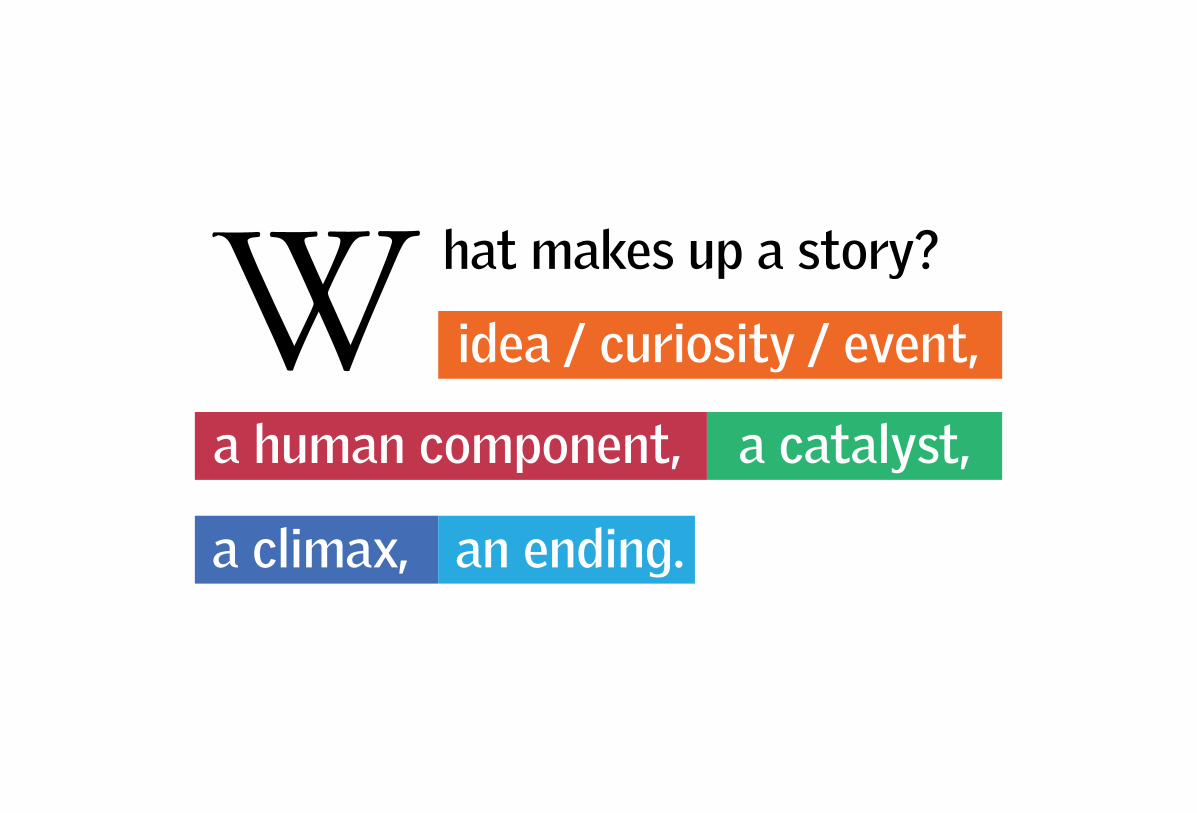
W hat makes up a story?
idea / curiosity / event,
a human component,
a climax, an ending.
a catalyst,

P arts of a good story:
powerful & compelling,
has a clear or pursuasive message,
has a call to action.

The Washington Post

Christian Science Monitor

Data Scientist: The Sexiest Job of the 21st Century
-Thomas H. Davenport and D.J. Patil
Harvard Business Review, October 2012

Good design is a lot like clear thinking made visual.
— Edward Tufte

DATA VISUALIZATION
20% 80%
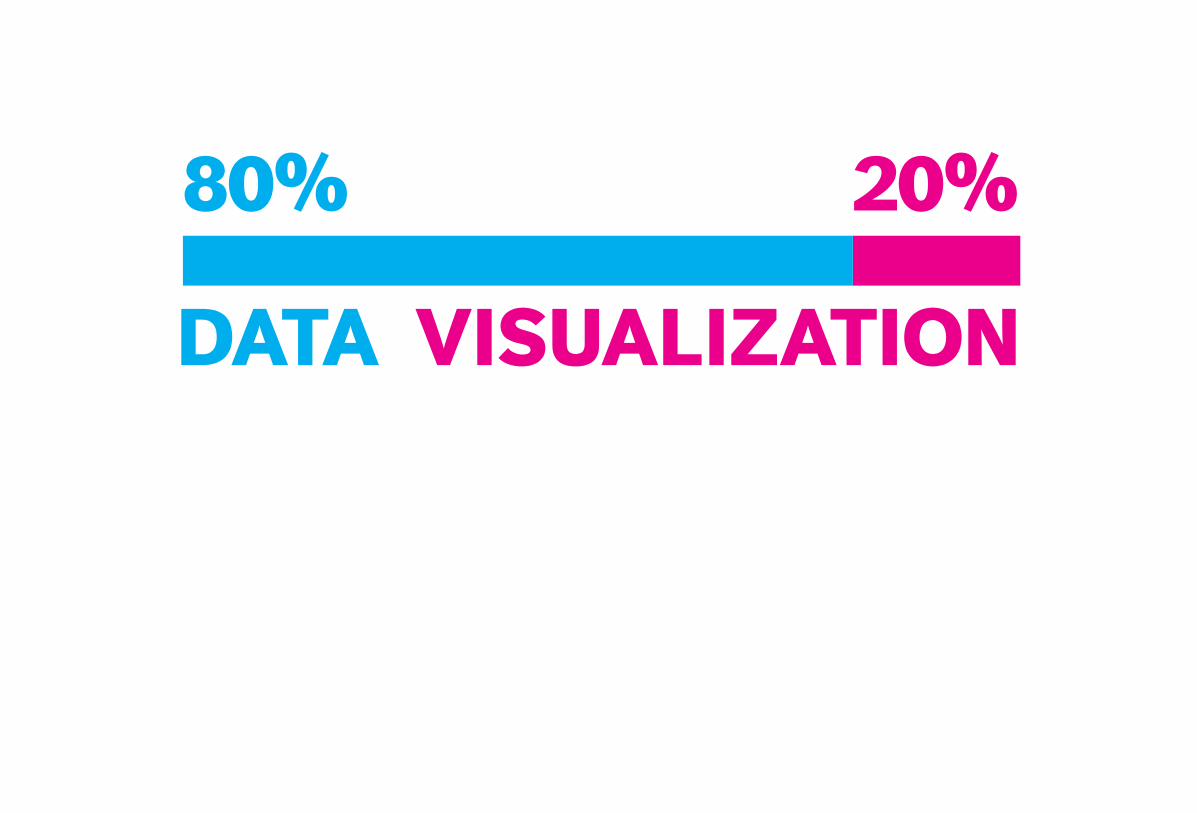
DATA VISUALIZATION
80% 20%

GATHER
QUESTION EXPLORE
PRESENT

GATHER
QUESTION EXPLORE
PRESENT

Scrape
Scrub
Supplement
Segment
Evaluate
GATHER

Q U E S T I O N
?

What are Baltimore City employees paid?
Who are the highest and lowest paid Baltimore City Employees?
How have the salaries of Baltimore city employees changed over time?
How does the change in Baltimore city employee salaries compare to tax rates over time?

http://datavisualization.ch/inside/


E X P LO R E


QUESTION EXPLORE

P R E S E N T

STORYDATA
FORM

AUDIENCE
CLIENT DESIGNER

+OR
PRINT / STATICVISUALIZATIONS
CONTEXTUALINFORMATION
SOCIAL CONTEXTFROM FRIENDS
VIDEO / AUDIOCONTEXT
FULL EXPERIENCEOR GAME
INTERACTIVEVISUALIZATIONS

Contact
Heather Bradbury
@MICA_MPS
Bryan Connor
@thewhyaxis
http://thewhyaxis.info