visualising electrochemical reaction layers: mediated vs
TRANSCRIPT

12422 | Phys. Chem. Chem. Phys., 2020, 22, 12422--12433 This journal is©the Owner Societies 2020
Cite this:Phys.Chem.Chem.Phys.,
2020, 22, 12422
Visualising electrochemical reaction layers:mediated vs. direct oxidation†
Junling Ma, Minjun Yang, Christopher Batchelor-McAuley andRichard G. Compton *
Electrochemical treatments are widely used for ‘clean up’ in which toxic metals and organic compounds
are removed using direct or mediated electrolysis. Herein we report novel studies offering proof of
concept that spectrofluorometric electrochemistry can provide important mechanistic detail into these
processes. A thin layer opto-electrochemical cell, with a carbon fibre (radius 3.5 mm) working electrode,
is used to visualise the optical responses of the oxidative destruction of a fluorophore either directly, on
an electrode, or via the indirect reaction of the analyte with an electrochemically formed species which
‘mediates’ the destruction. The optical responses of these two reaction mechanisms are first predicted
by numerical simulation followed by experimental validation of each using two fluorescent probes, a
redox inactive (in the electrochemical window) 1,3,6,8-pyrenetetrasulfonic acid and the redox-active
derivative 8-hydroxypyrene-1,3,6-trisulfonic acid. In the vicinity of a carbon electrode held at different
oxidative potentials, the contrast between indirect electro-destruction, chlorination, and direct oxidation
is very obvious. Excellent agreement is seen between the numerically predicted fluorescence intensity
profiles and experiment.
Introduction
In a voltammetric experiment, the current is measured as afunction of an applied electrode potential and is used to provideinsight and information into the operative electrochemicalmechanism. However, the measured current results from thesum of all the operative electrode processes; this can be proble-matic when a multiplicity of these processes occur in parallel.1
For example, at highly reductive or oxidative potentials outsideof the electrochemical window it is possible to electrochemicallyreduce or oxidise the solvent and/or the electrolyte in addition toany analyte.2,3 Both the solvent and electrolyte are often presentin a large excess as compared to the latter. Moreover, oxidationor reduction of the solvent and/or electrolyte can possibly lead tothe formation of products that are able to chemically reactfurther either in the solution phase or with the electrodeitself.4 However, under such solvent ‘breakdown’ conditions itis often not feasible to delineate the contribution to the currentfrom different electrochemical processes and hence any signifi-cant analytically useful information is often not directly attain-able from the magnitude of the measured current.
In chloride (saline) containing media and at high electrodepotentials the oxygen evolution reaction (OER) and chlorineevolution reaction (CER) are both thermodynamically andkinetically favourable.5,6 Under acidic conditions the oxidationof the solvent (water), if it goes to completion, is a four-electronprocess:7,8
2H2O " O2 + 4H+ + 4e�
and the oxidation of chloride is given by:
2Cl� " Cl2 + 2e�
For the oxygen evolution reaction (OER) if the process doesnot proceed to completion it is possible for other reactiveoxygen species to be formed.9 Similarly, for chlorine formationat higher pH the reaction to form hypochlorite becomescompetitive.10,11 Overall, which process (OER vs. CER) is domi-nant is highly sensitive to the experimental conditions, notablythe electrode material used, the applied potential, the solutionpH and the chloride concentration among other factors.12,13
Both of these reactions are of major industrial value; the OER isat the heart of (photo)electrochemical water splitting14–16 whereasthe electrolysis of brines to form chlorine and hydroxide is basisof the chlor-alkali process underpinning the ‘heavy’ chemicalindustry.17,18 The formation of active chlorine species also hasapplication in electrochemical waste water treatment.19,20 Theelectrochemical reactor cells used in these industrial processes
Department of Chemistry, Physical and Theoretical Chemistry Laboratory,
University of Oxford, South Parks Road, Oxford OX1 3QZ, UK.
E-mail: [email protected]; Tel: +44(0)1865 275957
† Electronic supplementary information (ESI) available. See DOI: 10.1039/d0cp01904f
Received 8th April 2020,Accepted 22nd May 2020
DOI: 10.1039/d0cp01904f
rsc.li/pccp
PCCP
PAPER
Ope
n A
cces
s A
rtic
le. P
ublis
hed
on 2
2 M
ay 2
020.
Dow
nloa
ded
on 3
/24/
2022
3:2
5:03
PM
. T
his
artic
le is
lice
nsed
und
er a
Cre
ativ
e C
omm
ons
Attr
ibut
ion-
Non
Com
mer
cial
3.0
Unp
orte
d L
icen
ce.
View Article OnlineView Journal | View Issue

This journal is©the Owner Societies 2020 Phys. Chem. Chem. Phys., 2020, 22, 12422--12433 | 12423
typically contain stacks of 10–100 cylindrical electrodes tomaximise efficiency.20
Due to both the OER and CER reactions occurring inparallel, analytical methods for determining which processis dominant have been developed, including the use ofmass spectrometry to analytically assess the concentration ofchlorine or oxygen in the vicinity of the electrode. Althoughsuccessful, the coupling of mass-spectrometry with electro-chemistry is not without its complications and often has poortemporal resolution. This recently led Koper et al. to apply theclassical rotating ring disc method of Frumkin, Levich et al.21,22
to enable the local chlorine concentration to be analysed,23,24
and so to delineate the conditions under which the OER isfavourable over the CER on carbon based electrodes. Similarlyscanning electrochemical microscopy (SECM) in samplegeneration-tip collection (SG-TC) or the redox competition(RC) modes can be used for the visualization of the catalyticactivity of materials for chlorine evolution.25
Over recent years there has been renewed interest in the useof optical microscopy techniques26 for studying interfacialelectrochemical processes. This work has encompassed, inpart, the use of plasmonic imaging, confocal microscopy27
and fluorescence microscopy.28–34 One potential advantage offluorescence based techniques is that a host of differentfluorophores are available and have been developed for use indiverse biological contexts to report on a variety of physical andchemical factors.35–37 Furthermore, molecular fluorophoresoften comprise large extended aromatic systems and hencetend to be redox active themselves.38 Moreover, recent work byMolina et al. has focused on the theoretical study of electro-chemically driven solution phase reactions.39,40
In this paper we provide new physical insights to the twoheavily industrialised generic electrochemical mechanisms –direct and mediated oxidation via proof-of-concept for mecha-nistic visualization using spectrofluorometric electrochemistryto probe the contrasting spatial distributions associated withthe two mechanisms. We first report simulation results con-sidering a thin-layer cell consisting of a cylindrical electrode, ascommonly deployed experimentally. The simulation resultshows distinctively and qualitatively different concentrationprofiles for the two oxidative mechanisms in operation. Theresults are validated experimentally using fluorescent dyes toprovide in situ optical visualisation for the different electro-chemical processes – with excellent agreement with the simula-tion results. Herein, the simulation results are generalised andmay find applications to a wide range of industrial ‘clean-up’including applications such as wastewater treatments, electro-chlorination and removal of toxic metals.
Experimental sectionChemicals
All chemicals used were purchased from Sigma-Aldrich and usedwithout any further purification. Aqueous solutions were madeusing deionised water (Millipore, resistivity 18.2 MO cm at 25 1C).
pH 7 phosphate buffer solutions contained 58 mM Na2HPO4
and 42 mM NaH2PO4. Nitrogen gas (99.998%, BOC Gases plc,Guildford, U.K.) was used to deoxygenate the analyte forca. 15 minutes until the redox signal arising from dissolvedoxygen became negligible, prior to the electrochemical measure-ments being made.
Electrochemical equipment
A glassy carbon (GC) working electrode (radius = 1.5 mm, CHInstruments, TX) and a saturated calomel reference electrode(SCE, +0.242 V vs. SHE, ALS Co. Ltd, Tokyo, Japan) were used formacro-electrode experiments using a computer controlledAutolab potentiostat 30 (Metrohm Auotlab B.V., Utecht, TheNetherlands) using the General Purpose ElectrochemicalSystem (GPES). A graphite counter electrode was used to completethe three-electrode cell configuration. Prior to experiments, theGC working electrode was polished using alumina of decreasingorder of size (1.0, 0.3, 0.05 mm, Buehler, IL, U.K.), washed withultrapure water and dried with nitrogen.
The structure of the thin-layer (ca. 60 mm) cell used for theopto-electrical measurements is shown in the ESI† (Section S1).The thin-layer cell consists of a three-electrode configuration;both working and counter electrodes were carbon fibre wires(radius = 3.5 mm, the length of the carbon fibre working electrodewas 0.7 cm, Goodfellow Cambridge Ltd). Another carbon fibrecoated with a thin-layer of silver epoxy (RS Components Ltd,U.K.) was used as a pseudo reference electrode. The working andreference electrodes reside in a separate compartment to thecounter electrode (see ESI,† Fig. S1) to minimise convectioncaused by bubble formation at the counter electrode as wasfound to occur at high electrode potentials. An in-house builtpotentiostat, described in detail elsewhere, was used to controlthe electrochemical system and provide synchronization withthe microscope camera.41
Microscope and imaging analysis
Fluorescence excitation light source was provided by an ELSeries Ultraviolet Hand Lamp with wavelength of 365 nm(UVLS-24, Ultra-Violet Products Ltd, Upland, C.A., U.S.A.). Theexcitation light source was turned on for (at least) 20 secondsprior to electrochemical experimentation, no photobleachingwas observed over the course of this initial illumination orsubsequently during the electrochemical experiment. Opticalmeasurements were made on a Zeiss Axio Examiner, A1Epifluorescence microscope (Carl Zeiss Ltd, Cambridge, U.K.)using a 20� air objective (NA = 0.5, EC Plan Neofluar). Theemission filters used were products MF445-45 and MF530-43(Thorlabs, Ely, U.K.) for PYTS and HPTS experiments respec-tively. Image acquisition was achieved using a HamamatsuORCA-Flash 4.0 digital CMOS camera (Hamamatsu, Japan),providing 16-bit images with 4-megapixel resolution. Imageswere acquired with an exposure time of 80.00 ms and at10 frames per second. Zen 2 pro was used for image processingand intensity extraction. See ESI,† Sections S1 and S2 for theschematics of the experimental opto-electrochemical cell andthe microscope setup.
Paper PCCP
Ope
n A
cces
s A
rtic
le. P
ublis
hed
on 2
2 M
ay 2
020.
Dow
nloa
ded
on 3
/24/
2022
3:2
5:03
PM
. T
his
artic
le is
lice
nsed
und
er a
Cre
ativ
e C
omm
ons
Attr
ibut
ion-
Non
Com
mer
cial
3.0
Unp
orte
d L
icen
ce.
View Article Online
12424 | Phys. Chem. Chem. Phys., 2020, 22, 12422--12433 This journal is©the Owner Societies 2020
Simulation
The diffusion equations with coupled homogenous kineticswere solved for the cell geometry using a 2D implicit finitedifference method. The simulation program was written inPython and the sparse matrix solver package UMFPACK (asprovided as part of SuiteSparse) was used to solve the requiredequation set.42 Due to the inclusion of second order homo-geneous reaction kinetics the problem is weakly non-linear,and the simulation script used a simple iterative Newton–Raphson method43 to solve the numerical problem. The con-vergence limit of the Newton–Raphson iterations was set asbeing when the average absolute dimensionless concentrationchanged by a value of less than 1 � 10�8 from the previousiteration. This Python script was used for modelling the directand indirect oxidative mechanisms. The simulated opticalresponses were visualised using the Matplotlib library. Fullsimulation times were between 3–5 minutes.
Theory
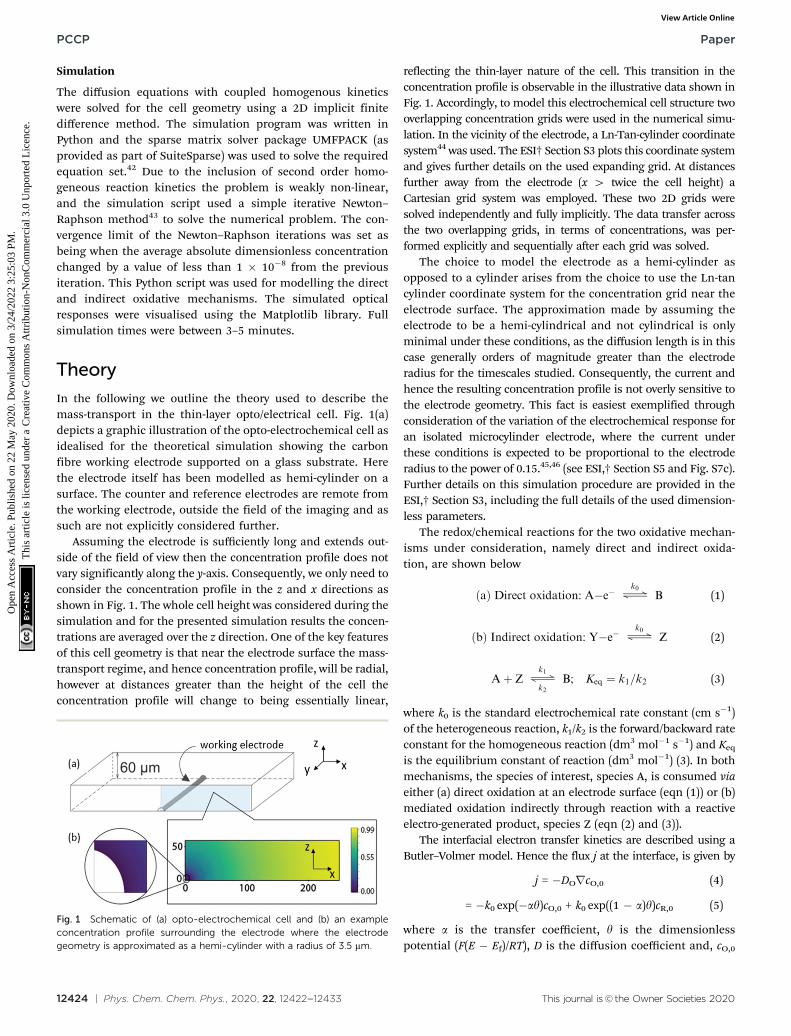
In the following we outline the theory used to describe themass-transport in the thin-layer opto/electrical cell. Fig. 1(a)depicts a graphic illustration of the opto-electrochemical cell asidealised for the theoretical simulation showing the carbonfibre working electrode supported on a glass substrate. Herethe electrode itself has been modelled as hemi-cylinder on asurface. The counter and reference electrodes are remote fromthe working electrode, outside the field of the imaging and assuch are not explicitly considered further.
Assuming the electrode is sufficiently long and extends out-side of the field of view then the concentration profile does notvary significantly along the y-axis. Consequently, we only need toconsider the concentration profile in the z and x directions asshown in Fig. 1. The whole cell height was considered during thesimulation and for the presented simulation results the concen-trations are averaged over the z direction. One of the key featuresof this cell geometry is that near the electrode surface the mass-transport regime, and hence concentration profile, will be radial,however at distances greater than the height of the cell theconcentration profile will change to being essentially linear,
reflecting the thin-layer nature of the cell. This transition in theconcentration profile is observable in the illustrative data shown inFig. 1. Accordingly, to model this electrochemical cell structure twooverlapping concentration grids were used in the numerical simu-lation. In the vicinity of the electrode, a Ln-Tan-cylinder coordinatesystem44 was used. The ESI† Section S3 plots this coordinate systemand gives further details on the used expanding grid. At distancesfurther away from the electrode (x 4 twice the cell height) aCartesian grid system was employed. These two 2D grids weresolved independently and fully implicitly. The data transfer acrossthe two overlapping grids, in terms of concentrations, was per-formed explicitly and sequentially after each grid was solved.
The choice to model the electrode as a hemi-cylinder asopposed to a cylinder arises from the choice to use the Ln-tancylinder coordinate system for the concentration grid near theelectrode surface. The approximation made by assuming theelectrode to be a hemi-cylindrical and not cylindrical is onlyminimal under these conditions, as the diffusion length is in thiscase generally orders of magnitude greater than the electroderadius for the timescales studied. Consequently, the current andhence the resulting concentration profile is not overly sensitive tothe electrode geometry. This fact is easiest exemplified throughconsideration of the variation of the electrochemical response foran isolated microcylinder electrode, where the current underthese conditions is expected to be proportional to the electroderadius to the power of 0.15.45,46 (see ESI,† Section S5 and Fig. S7c).Further details on this simulation procedure are provided in theESI,† Section S3, including the full details of the used dimension-less parameters.
The redox/chemical reactions for the two oxidative mechan-isms under consideration, namely direct and indirect oxida-tion, are shown below
ðaÞ Direct oxidation: A�e� Ðk0
B (1)
ðbÞ Indirect oxidation: Y�e� Ðk0
Z (2)
Aþ ZÐk1
k2B; Keq ¼ k1=k2 (3)
where k0 is the standard electrochemical rate constant (cm s�1)of the heterogeneous reaction, k1/k2 is the forward/backward rateconstant for the homogeneous reaction (dm3 mol�1 s�1) and Keq
is the equilibrium constant of reaction (dm3 mol�1) (3). In bothmechanisms, the species of interest, species A, is consumed viaeither (a) direct oxidation at an electrode surface (eqn (1)) or (b)mediated oxidation indirectly through reaction with a reactiveelectro-generated product, species Z (eqn (2) and (3)).
The interfacial electron transfer kinetics are described using aButler–Volmer model. Hence the flux j at the interface, is given by
j = �DOrcO,0 (4)
= �k0 exp(�ay)cO,0 + k0 exp((1 � a)y)cR,0 (5)
where a is the transfer coefficient, y is the dimensionlesspotential (F(E � Ef)/RT), D is the diffusion coefficient and, cO,0
Fig. 1 Schematic of (a) opto-electrochemical cell and (b) an exampleconcentration profile surrounding the electrode where the electrodegeometry is approximated as a hemi-cylinder with a radius of 3.5 mm.
PCCP Paper
Ope
n A
cces
s A
rtic
le. P
ublis
hed
on 2
2 M
ay 2
020.
Dow
nloa
ded
on 3
/24/
2022
3:2
5:03
PM
. T
his
artic
le is
lice
nsed
und
er a
Cre
ativ
e C
omm
ons
Attr
ibut
ion-
Non
Com
mer
cial
3.0
Unp
orte
d L
icen
ce.
View Article Online

This journal is©the Owner Societies 2020 Phys. Chem. Chem. Phys., 2020, 22, 12422--12433 | 12425
and cR,0 are the concentrations of the oxidised (B or Z) andreduced (A or Y) electroactive species at the electrode surfacerespectively. At all other simulation boundaries, a no fluxcondition was imposed, such that
rc = 0 (6)
Note however that since two fully implicit simulation gridsare employed in this model that the positions where the gridsoverlap a Dirichlet boundary condition was employed. At theseboundaries, internal to the simulation model, the concentra-tions were provided by the other grid. This simulation modelwas used to compare how the concentration profiles of thespecies differ when the analyte is either oxidised directly at theelectrode surface or indirectly by virtue of a product formed byan electrochemical reaction.
Results and discussion
In this section, the simulation results are first discusseddemonstrating a distinctive difference in the concentrationprofiles of a fluorophore (species A in the two reaction mechan-isms provided in the previous section) surrounding the elec-trode depending on which of the two mechanism is operativeand so providing insights into how the mechanisms, direct andindirect, may be optically differentiated. Second, experimentalmechanistic distinction is validated using two structurallysimilar fluorophores but of contrasting reactivity. These twofluorophores differ in their reactivity towards chlorine andhence can been used to evidence the presence of this electrodeproduct. Good agreement is seen with the simulation results,thus validating the advantages of the general approach.
Simulation results
Most commonly in the electrochemical field the experimentallymeasured current is used to infer information regarding thethermodynamics and kinetics of the interfacial reaction. How-ever, first, when other interfacial processes occur in parallel,such as is the case during solvent breakdown, it is not neces-sarily feasible to delineate the current of interest from the othersources. Second, even in the situation where the process ofinterest is solely occurring at the interface, when a chemicalreaction occurs after the electrochemical rate determining stepthen the measured current will not be sensitive to the occur-rence or kinetics of any follow up chemistry. Consequently, it isnot uncommon that the experimentalist is essentially ‘blind’to the chemical processes occurring in the diffusion layersurrounding the electrode. Nevertheless, as will be shown,mechanistic insights can be obtained by studying the concen-tration profiles of the species. Such concentration profiles areexperimentally readily accessible when one or more of thespecies involved are fluorescent.
The aim of this section is first to discriminate between thecases where the species of interest, A, is either oxidised directlyat the electrode or indirectly in the solution phase, where theprocess is mediated and occurs via reaction with a product
formed at the electrochemical interface. In the following weassume that species A is fluorescent and can be imaged whereasits oxidation product B is assumed to be not fluorescently active.Dimensionless simulation results are depicted in Section S3(ESI†); however, in the following to aid comparison to theexperiments reported later the data are presented with dimen-sional values and correspond to the cell used experimentally.
Direct oxidative destruction of fluorophore
We first consider the one electron transfer direct oxidativereaction (eqn (1)), where species A is the fluorescent fluoro-phore initially present in solution and B is the non-fluorescentoxidative product. This oxidation process is assumed to onlyoccur directly at the electrode surface. At the start of thesimulation, the bulk concentration of species A and B are setto 1 mM and zero respectively (DA = 3.85 � 10�6 cm2 s�1 andDB = 1 � 10�5 cm2 s�1). The standard electrochemical rateconstant, k0, is set to be 104 cm s�1 to ensure electrochemicalreversibility; when t 4 0, an over-potential (Z = 0.5 V) is appliedsuch that the oxidative reaction is mass-transport limited. Anexample simulated concentration profile of the fluorophore A,as a function of the position in the cell is shown in Fig. 2(a),where a colour map is used to indicate the species concen-tration as a function of position in the z, x plane. Near theelectrode the species A is depleted and moving further awayfrom the electrochemical interface its concentration increasesto its bulk value of 1 mM. From this 2D concentration profile,the average concentration of the fluorophore in the z-directionis calculated. Here a value of unity indicates the fluorophoreconcentration is unaltered from that in the bulk and a value ofzero indicates that all of the fluorescently active species hasbeen consumed in the z-axis. The data is presented as thesenormalised concentration profiles so as to be comparable tothe fluorescence intensity profiles, as will be experimentallyreported in the second part of the article. The accuracy of thismodel, averaging the concentration profiles across z directionversus the depth of field of the objective in practice, is discussedin ESI,† Section S4. Full quantitative fitting of the optical datato that of the simulated results would require the microscope’slimited depth of field to be accounted for, in the present workthe simulation results primarily evidence the marked differencein the concentration profiles arising from the two differentchemical mechanisms.
As shown in Fig. 2(a) for this direct oxidation process,initially at time equals zero the concentration in the cell isuniform. Upon application of a high over-potential the speciesA becomes depleted at the electrode surface resulting in adecrease in the simulated fluorescence intensity near theelectrode surface. As time increases the depth of the minimumin the fluorescence profile increases; however, even after10 seconds the intensity only decreases to 60% of its originalintensity at the position of the electrode (x = 0). The inlay ofFig. 2(a) depicts the concentration profile mapped onto the cellgeometry at t = 10 s showing that this non-zero intensity at x = 0mm reflects the fact that species A is only consumed at theelectrode surface. The electrode radius (3.5 mm) is significantly
Paper PCCP
Ope
n A
cces
s A
rtic
le. P
ublis
hed
on 2
2 M
ay 2
020.
Dow
nloa
ded
on 3
/24/
2022
3:2
5:03
PM
. T
his
artic
le is
lice
nsed
und
er a
Cre
ativ
e C
omm
ons
Attr
ibut
ion-
Non
Com
mer
cial
3.0
Unp
orte
d L
icen
ce.
View Article Online

12426 | Phys. Chem. Chem. Phys., 2020, 22, 12422--12433 This journal is©the Owner Societies 2020
smaller than the thickness of the cell (60 mm) hence thedepletion of the reagent A only occurs in the near vicinity ofthe electrode and above the electrode (in the z-direction) thefluorophore concentration is higher.
The distance over which the fluorophore is consumed issensitive to the diffusion coefficient of the fluorophore.Fig. 2(b) depicts the variation of the simulated concentrationprofiles as a function of the diffusion coefficients of thefluorophore A in the range of 2.00–3.85 � 10�6 cm2 s�1. Alsopresented in the inlay of Fig. 2(b) is a plot of the full-width halfminimum (FWHM) of the minimum in concentration aroundthe electrode as a function of time, giving a measure of thedistance over which the material has been consumed.47
It is evident that when the fluorophore is only consumed bya direct electrode redox process, even with the use of a thin-layer cell due to the relative magnitude of the micro-sized wire
to the height of the cell, the concentration minima peaksaround the centre of the electrode does not reach zero intensityover a very long period of time (even after 10 minutes chron-oamperometry the minima is still not predicted to reach zero).This situation arises as a fluorescence intensity of zero wouldrequire the complete depletion of fluorophore above the elec-trode (height of the cell = 60 mm) which is being prevented bythe mass transport from the semi-infinite bulk solution in thex axis. Furthermore, the shape of this profile is independent ofthe concentration of the used fluorophore (see ESI,† Fig. S7a).In addition to the diffusion coefficient as seen in Fig. 2(b), extrafactors that affects the concentration of species A (cell thick-ness, concentration and diameter of electrode) are discussed inESI,† Section S5.
Mediated destruction of the fluorophore
We next consider the indirect oxidative destruction of thefluorophore A as shown in eqn (2) and (3). In this case, Y andZ are redox active but non-fluorescent; only species Y and Aare initially present before the onset of the electrochemicalcurrent. Similar to the direct oxidation mechanism, the stan-dard electrochemical rate constant (k0) for the eqn (2) is set to104 cm s�1 to ensure electrochemical reversibility; similarly,when t 4 0, an over-potential (Z = 0.5 V) is applied for theoxidative process of (Y–e� - Z) ensuring the process is fullydriven and diffusion controlled.
The electro-generated product Z can react irreversibly withthe fluorescent probe species A in solution to form the non-fluorescent species B. The chemical irreversibility for thehomogeneous reaction is ensured by using a very large valueof Keq (1010 M�1 was used in the simulation reported below).Fig. 3(a) depicts the variation of the predicted fluorescenceprofile where the initial concentration of Y is equal to 1.0 mMand the initial concentration of A is varied in the range of0.25 mM–2.5 mM. As the initial concentration of the electro-chemical reagent A is decreased, the ratio of the concentrationsof species Y and A, [Y] : [A], is increased. Comparing withspecies A, the concentration profile of the electrochemicalproduct Z extends further into solution, consequently shiftingthe reaction front; hence, the fluorescence response arising fromthe destruction of fluorophore A is significantly altered from thatexpected for the direct electrochemical reaction, as shown inFig. 3(a) in effect the species Z ‘titrates’ and fully depletes speciesA from the electrode vicinity. Notably the depth and width of thefluorescence intensity minimum increases. This occurs as thefluorophore A is consumed not at the electrode surface butrather over a larger volume that extends into the solution awayfrom the electrode. The formation of the redox active reagentZ creates an ‘‘exclusion zone’’ (aka ‘reaction layer’) in the vicinityof the electrode where the occurrence of the homogeneousreaction leads to the concentration of A becoming essentiallyzero over a large volume in the vicinity of the electrode.
The homogeneous reaction between the electrochemicalproduct Z and the fluorophore A leads to the depletion inthe simulated fluorescent signal adjacent to the electrode.Consequently, other than the concentration of the reagents,
Fig. 2 Simulated optical response for the direct oxidation mechanismwith an applied over-potential (Z = 0.5 V) from t = 0. Variation of thenormalized concentration of 1 mM species A as a function of distanceperpendicular to the electrode. (a) Plot of the variation in the profile as afunction of time t = 0 (red), 0.1 (blue), 1 (yellow), 3 (green), 5 (purple) s.Other parameters: DA = 3.85 � 10�6 cm2 s�1, DB = 1 � 10�5 cm2 s�1. Inlaydepicts the simulated concentration profile of species A at t = 10 s. (b) Thenormalized concentration profile at 10 s as a function of the fluorophorediffusion coefficient DA = 3.85 � 10�6 cm2 s�1 (red), 3.1 � 10�6 cm2 s�1
(blue), 2.8 � 10�6 cm2 s�1 (yellow) and 2.0 � 10�6 cm2 s�1 (green); inlay,plot of full-width half minimum of the concentration profile at t = 0 to 10 s.
PCCP Paper
Ope
n A
cces
s A
rtic
le. P
ublis
hed
on 2
2 M
ay 2
020.
Dow
nloa
ded
on 3
/24/
2022
3:2
5:03
PM
. T
his
artic
le is
lice
nsed
und
er a
Cre
ativ
e C
omm
ons
Attr
ibut
ion-
Non
Com
mer
cial
3.0
Unp
orte
d L
icen
ce.
View Article Online

This journal is©the Owner Societies 2020 Phys. Chem. Chem. Phys., 2020, 22, 12422--12433 | 12427
as discussed above, and their mass-transport properties, therate constant of the reaction between A and Z also influencesthe shape of the concentration profile. Fig. 3(b) depicts theinfluence of the homogeneous bimolecular rate constant, kf, onthe resulting concentration profile. The dominant effect is thatas the homogeneous rate constant is decreased, the consump-tion of fluorophore A is reduced leading to the magnitude ofthe minimum in the concentration profile to be smaller. Due tothe simulated cell geometry being that of a thin-layer cell, thesimulated fluorescence intensity reaches zero in the proximity ofthe wire electrode providing kf is bigger than B250 L mol�1 s�1,reflecting the extent of the reaction layer exclusion zonementioned above. However, although the depth of the mini-mum is decreased, the distance over which the reaction occursis less sensitive to the kf parameter. As can be seen fromFig. 3(b) when the reaction rate constant is greater thanapproximately 100 M�1 s�1 the depletion of the fluorophoreoccurs over a distance of �200 mm of the electrode wire within5 seconds in a cell with cell height equals 60 mm. To a firstapproximation the depth of the minimum is controlled bythe homogeneous rate constant. However, the distance overwhich the reaction occurs – the reaction front – predominantlyreflects the mass-transport of the reagents and their relativeconcentrations.
For comparison to the direct process, Fig. 3(c) depicts aseries of the simulated concentration profiles as a function ofthe diffusion coefficients of the fluorophore A in the range of3.85 � 10�6–2 � 10�5 cm2 s�1. Although a slower depletion wasobserved when lower the diffusion coefficient of A, the mediatedoxidation is not as sensitive to the diffusion coefficient of thefluorophore as the direct oxidation case. When the concen-tration of Y is much greater than the concentration of A, speciesZ generated is in excess which can then quickly diffuse awayfrom the electrode surface and form an ‘‘exclusion zone’’.Species A can then react with Z directly in this ‘‘exclusion zone’’instead of diffusing to the electrode interface.
From the above results it can be seen that the two differentelectrochemical reaction mechanisms, (i) direct and (ii)mediated, lead to distinctly different concentration profilesand are hence expected to have markedly different fluorescenceresponses. The sensitivity of the fluorescence response towardsthe relative and absolute concentration of the fluorophore andthe electrochemical product Z (as in these examples reflectedin the change in the initial concentration of the startingreagent Y) and the observation of an extended exclusion zonesurrounding the electrode is indicative of a mediated reactionmechanism being operative.
Opto-electrochemical experiments: fluorescent dyes
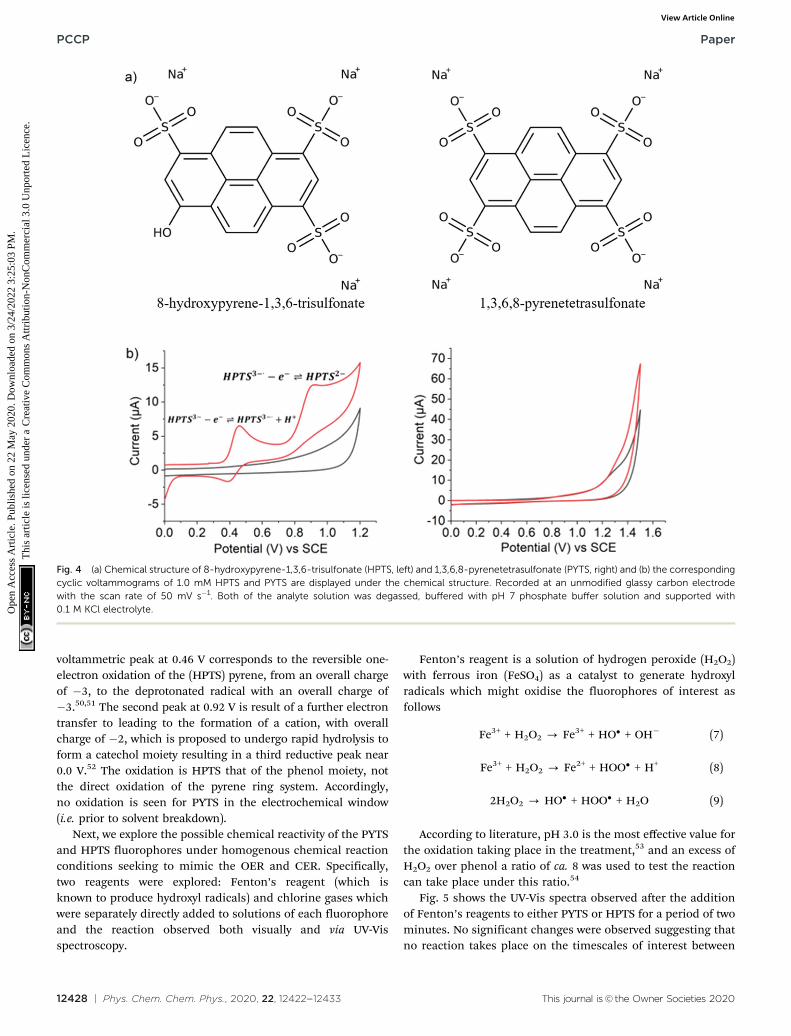
The above simulation investigated how the concentration andhence fluorescence profile is expected to behave in the con-trasting situations where the fluorophore is either directly orindirectly consumed by the occurrence of the electrochemicalreaction. This article now turns to experimentally validated thecontrast and focuses on the study of two structurally relatedfluorophores shown in Fig. 4(a); 8-hydroxypyrene-1,3,6-trisulfonate (HPTS) and 1,3,6,8-pyrenetetrasulfonate (PYTS).The primary difference between these two molecules is thepresence of the hydroxyl group (pKa = 7.2) on the pyrenestructure of the HPTS. This hydroxyl group alters both theelectrochemical and optical properties of the fluorophore. Bothof these molecules are strongly fluorescent; however, the emis-sion wavelengths of the HPTS in water (pH 7.0) are shifted to512 nm48 as compared to 404 nm49 for the PYTS. Section S6(ESI) presents the absorbance and fluorescence spectra for thesetwo fluorescent probes. A more marked difference between thesetwo molecules is reflected in their voltammetric behaviour.Fig. 4(b) depicts the voltammetric response of HPTS and PYTSin a pH 7 buffer containing 0.1 M KCl. PYTS is not electro-chemically active within the electrochemical window (as shownin Fig. 4b right hand side); in comparison HPTS exhibits twoclear voltammetric peaks at 0.46 V and 0.92 V (vs. SCE). The first
Fig. 3 Simulated optical responses for the mediated oxidation mechanism (EC2). Variation of the normalized concentration of species A as a function ofdistance perpendicular to the electrode. (a) Plot of the variation in the profile at t = 5 s with initial concentration of A, [A]bulk, equals to 0.25 mM (red),0.13 mM (blue), 25 mM (yellow) and 2.5 mM (green); [Y]bulk = 1 mM, DA = 1� 10�5 cm2 s�1 and kf = 1� 104 L mol�1 s�1; Inlay, plot of full-width half minimum ofthe concentration profile at t = 0 to 10 s. (b) Plot of the variation in the profile at t = 5 s with formation rate constant, kf, varies from 1 to 1 � 104 L mol�1 s�1.[Y]bulk = 1 mM, [A]bulk = 25 mM and DA = 1 � 10�5 cm2 s�1; inlay, plot of full-width half minimum of the concentration profile at t = 0 to 10 s. (c) Plot of thevariation in the profile at t = 5 s with diffusion coefficient of A, DA, equals to 2 � 10�5 cm2 s�1 (red), 1 � 10�5 cm2 s�1 (blue), 6 � 10�6 cm2 s�1 (yellow) and3.85 � 10�6 cm2 s�1 (green); [Y]bulk = 1 mM, [A]bulk = 25 mM and kf = 1 � 104 L mol�1 s�1; inlay, plot of full-width half minimum of the concentration profileat t = 0 to 10 s. Other parameters: DY = DZ = DB = 1 � 10�5 cm2 s�1, Keq = 1 � 1010 M�1, k0 = 1 � 104 cm s�1.
Paper PCCP
Ope
n A
cces
s A
rtic
le. P
ublis
hed
on 2
2 M
ay 2
020.
Dow
nloa
ded
on 3
/24/
2022
3:2
5:03
PM
. T
his
artic
le is
lice
nsed
und
er a
Cre
ativ
e C
omm
ons
Attr
ibut
ion-
Non
Com
mer
cial
3.0
Unp
orte
d L
icen
ce.
View Article Online
12428 | Phys. Chem. Chem. Phys., 2020, 22, 12422--12433 This journal is©the Owner Societies 2020
voltammetric peak at 0.46 V corresponds to the reversible one-electron oxidation of the (HPTS) pyrene, from an overall chargeof �3, to the deprotonated radical with an overall charge of�3.50,51 The second peak at 0.92 V is result of a further electrontransfer to leading to the formation of a cation, with overallcharge of �2, which is proposed to undergo rapid hydrolysis toform a catechol moiety resulting in a third reductive peak near0.0 V.52 The oxidation is HPTS that of the phenol moiety, notthe direct oxidation of the pyrene ring system. Accordingly,no oxidation is seen for PYTS in the electrochemical window(i.e. prior to solvent breakdown).
Next, we explore the possible chemical reactivity of the PYTSand HPTS fluorophores under homogenous chemical reactionconditions seeking to mimic the OER and CER. Specifically,two reagents were explored: Fenton’s reagent (which isknown to produce hydroxyl radicals) and chlorine gases whichwere separately directly added to solutions of each fluorophoreand the reaction observed both visually and via UV-Visspectroscopy.
Fenton’s reagent is a solution of hydrogen peroxide (H2O2)with ferrous iron (FeSO4) as a catalyst to generate hydroxylradicals which might oxidise the fluorophores of interest asfollows
Fe3+ + H2O2 - Fe3+ + HO� + OH� (7)
Fe3+ + H2O2 - Fe2+ + HOO� + H+ (8)
2H2O2 - HO� + HOO� + H2O (9)
According to literature, pH 3.0 is the most effective value forthe oxidation taking place in the treatment,53 and an excess ofH2O2 over phenol a ratio of ca. 8 was used to test the reactioncan take place under this ratio.54
Fig. 5 shows the UV-Vis spectra observed after the additionof Fenton’s reagents to either PYTS or HPTS for a period of twominutes. No significant changes were observed suggesting thatno reaction takes place on the timescales of interest between
Fig. 4 (a) Chemical structure of 8-hydroxypyrene-1,3,6-trisulfonate (HPTS, left) and 1,3,6,8-pyrenetetrasulfonate (PYTS, right) and (b) the correspondingcyclic voltammograms of 1.0 mM HPTS and PYTS are displayed under the chemical structure. Recorded at an unmodified glassy carbon electrodewith the scan rate of 50 mV s�1. Both of the analyte solution was degassed, buffered with pH 7 phosphate buffer solution and supported with0.1 M KCl electrolyte.
PCCP Paper
Ope
n A
cces
s A
rtic
le. P
ublis
hed
on 2
2 M
ay 2
020.
Dow
nloa
ded
on 3
/24/
2022
3:2
5:03
PM
. T
his
artic
le is
lice
nsed
und
er a
Cre
ativ
e C
omm
ons
Attr
ibut
ion-
Non
Com
mer
cial
3.0
Unp
orte
d L
icen
ce.
View Article Online
This journal is©the Owner Societies 2020 Phys. Chem. Chem. Phys., 2020, 22, 12422--12433 | 12429
the selected fluorophores and the radicals (OH and OOH)produced by Fenton’s reagent.
Chlorine was prepared by dripping concentrated hydrochlo-ric acid on potassium permanganate crystals:55
2KMnO4 + 16HCl - 2MnCl2 + 2KCl + 8H2O + 5Cl2 (10)
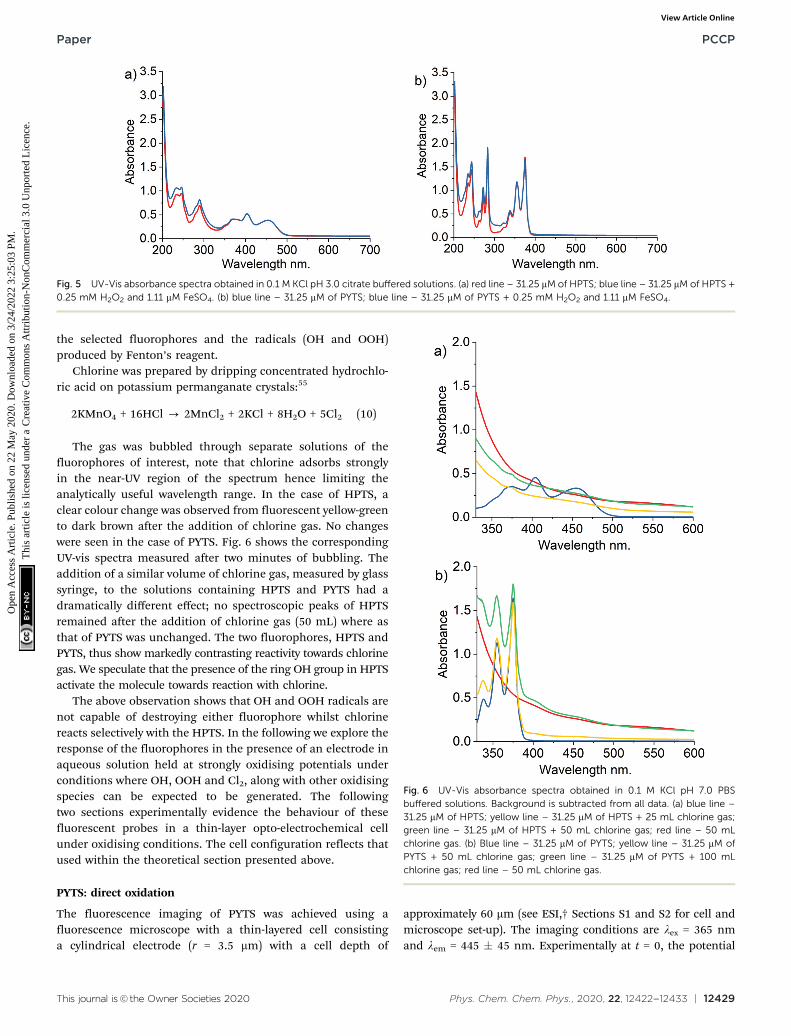
The gas was bubbled through separate solutions of thefluorophores of interest, note that chlorine adsorbs stronglyin the near-UV region of the spectrum hence limiting theanalytically useful wavelength range. In the case of HPTS, aclear colour change was observed from fluorescent yellow-greento dark brown after the addition of chlorine gas. No changeswere seen in the case of PYTS. Fig. 6 shows the correspondingUV-vis spectra measured after two minutes of bubbling. Theaddition of a similar volume of chlorine gas, measured by glasssyringe, to the solutions containing HPTS and PYTS had adramatically different effect; no spectroscopic peaks of HPTSremained after the addition of chlorine gas (50 mL) where asthat of PYTS was unchanged. The two fluorophores, HPTS andPYTS, thus show markedly contrasting reactivity towards chlorinegas. We speculate that the presence of the ring OH group in HPTSactivate the molecule towards reaction with chlorine.
The above observation shows that OH and OOH radicals arenot capable of destroying either fluorophore whilst chlorinereacts selectively with the HPTS. In the following we explore theresponse of the fluorophores in the presence of an electrode inaqueous solution held at strongly oxidising potentials underconditions where OH, OOH and Cl2, along with other oxidisingspecies can be expected to be generated. The followingtwo sections experimentally evidence the behaviour of thesefluorescent probes in a thin-layer opto-electrochemical cellunder oxidising conditions. The cell configuration reflects thatused within the theoretical section presented above.
PYTS: direct oxidation
The fluorescence imaging of PYTS was achieved using afluorescence microscope with a thin-layered cell consistinga cylindrical electrode (r = 3.5 mm) with a cell depth of
approximately 60 mm (see ESI,† Sections S1 and S2 for cell andmicroscope set-up). The imaging conditions are lex = 365 nmand lem = 445 � 45 nm. Experimentally at t = 0, the potential
Fig. 5 UV-Vis absorbance spectra obtained in 0.1 M KCl pH 3.0 citrate buffered solutions. (a) red line – 31.25 mM of HPTS; blue line – 31.25 mM of HPTS +0.25 mM H2O2 and 1.11 mM FeSO4. (b) blue line – 31.25 mM of PYTS; blue line – 31.25 mM of PYTS + 0.25 mM H2O2 and 1.11 mM FeSO4.
Fig. 6 UV-Vis absorbance spectra obtained in 0.1 M KCl pH 7.0 PBSbuffered solutions. Background is subtracted from all data. (a) blue line –31.25 mM of HPTS; yellow line – 31.25 mM of HPTS + 25 mL chlorine gas;green line – 31.25 mM of HPTS + 50 mL chlorine gas; red line – 50 mLchlorine gas. (b) Blue line – 31.25 mM of PYTS; yellow line – 31.25 mM ofPYTS + 50 mL chlorine gas; green line – 31.25 mM of PYTS + 100 mLchlorine gas; red line – 50 mL chlorine gas.
Paper PCCP
Ope
n A
cces
s A
rtic
le. P
ublis
hed
on 2
2 M
ay 2
020.
Dow
nloa
ded
on 3
/24/
2022
3:2
5:03
PM
. T
his
artic
le is
lice
nsed
und
er a
Cre
ativ
e C
omm
ons
Attr
ibut
ion-
Non
Com
mer
cial
3.0
Unp
orte
d L
icen
ce.
View Article Online

12430 | Phys. Chem. Chem. Phys., 2020, 22, 12422--12433 This journal is©the Owner Societies 2020
applied to the working carbon fibre electrode was stepped from0.0 V to +1.4 V for over a period of 5 seconds. In the secondexperiment, a higher oxidative potential of +2.3 V was applied toPYTS for 20 seconds. A series of images were taken. A quantita-tive assessment of the relative concentration profile can beobtained from the microscope image by the measurement ofthe fluorescence intensity profile across wire. In the presentwork, the normalized fluorescence intensity profile is used forcomparison. To calculate this normalised fluorescence intensity,the fluorescence intensity of the background was subtractedfrom the raw intensity and then divided by the initial intensitymeasured before the onset of the reaction. The initial fluores-cence intensity was also background corrected.
At +1.4 V, no alteration in the fluorescence intensity of thePYTS was optically observed, see Fig. S11 (ESI†), which agreeswith the lack of faradaic signal in the voltammetric experimentsshown in Fig. 4b even at the potentials near to solvent break-down (+1.5 V vs. SCE).
At a higher oxidative potential of +2.3 V, however, the PYTScan be seen to be electrochemically oxidised, as evidenced viathe changes in the fluorescence intensity shown in Fig. 7. Notethat the peak at x = 0 mm is due to the opaque carbon fibreelectrode. This oxidation process occurs outside of the solventvoltammetric window; consequently, it is not possible to usethe measured current (as would conventionally be done withexclusively voltammetric studies) to infer any informationregarding nature of the electrochemical reaction or fate of thefluorophore. In contrast the fluorescence profile is able todirectly evidence that, although other processes such as CERare likely occurring in parallel at the electrode surface, theoxidation of the PYTS occurs via a direct oxidation process. Thiscan be concluded on the basis of the fluorescence profile shapeand its essential insensitivity to the concentration profile of thefluorophore as shown in Fig. 7 on the basis of the simulationspresented above. It was observed that the electrochemical
consumption of PYTS only occurs at potentials more positivethan approximately +2.0 V. More plots of the variation of thefluorescence intensity profiles as a function of time and thefluorescence microscope images of PYTS are provided in ESI,†Section S7. Next, we conduct comparable experiments to inves-tigate the opto-electrochemical behaviour of the hydroxylatedpyrene derivative (HPTS) towards CER.
HPTS: direct versus mediated reactions
Despite HPTS being structurally similar to PYTS, the cyclicvoltammetry experiments shown in Fig. 4a demonstrates thatHPTS undergoes an overall two-electron direct oxidation at theelectrode with the first oxidative peak at +0.46 V and the secondat +0.92 V vs. SCE. Fluorescence imaging of HPTS was achievedas above in a microscope setup (lex = 365 nm and lem = 530 �43 nm). Experimentally, the potential applied to the workingcarbon fibre electrode was stepped from 0.0 to +1.2 V to fullydrive the direct 2-electron oxidation destruction of HPTS at theelectrode. Fig. 8 shows a series of images depicting the changein fluorescence intensity with time.
No new fluorescence signals were seen whilst the fluores-cence of the fluorophore decreased in the vicinity of theelectrode. The fluorescence intensity profiles measured at thislower potential (+1.2 V) as recorded across the wire are shownas dotted lines in Fig. 8. The fluorescence intensity profile inFig. 8 at t = 5.0 s is shown for three different concentrations:0.1 (black), 1.0 (red) and 10 mM (blue). Note the peak at x = 0 mmis a result of the finite sized opaque carbon fibre electrode.At +1.2 V the measured electrochemical current is of the orderof 1 � 10�6 A (for a 1 mM solution of the fluorophore), wherethe cylindrical electrode is approximately 1 cm in length. At thispotential the fluorescence profiles are essentially insensitive tothe used concentration of the fluorophore, with the smalldiscrepancies reflecting the reproducibility of the experiment.56
Also notable is the fact that the minimum in the fluorescence
Fig. 7 Relative intensity profile recorded at t = 5.0 s in a chronoampero-metric experiment with a step potential 2.3 V vs. pseudo Ag wire referenceelectrode, at different concentrations of 0.1 mM (black), 1 mM (red) and10 mM (blue) of PYTS with pH 7 phosphate buffer solution and 0.1 M KCl assupporting electrolyte.
Fig. 8 Relative intensity profile recorded at t = 5.0 s in a chronoampero-metric experiment with a step potential of 1.2 V (dotted) and 2.3 V (solidlines) vs. pseudo Ag wire reference electrode, at different concentrationsof 0.1 mM (black), 1 mM (red) and 10 mM (blue) of HPTS with pH 7phosphate buffer solution and 0.1 M KCl as supporting electrolyte.
PCCP Paper
Ope
n A
cces
s A
rtic
le. P
ublis
hed
on 2
2 M
ay 2
020.
Dow
nloa
ded
on 3
/24/
2022
3:2
5:03
PM
. T
his
artic
le is
lice
nsed
und
er a
Cre
ativ
e C
omm
ons
Attr
ibut
ion-
Non
Com
mer
cial
3.0
Unp
orte
d L
icen
ce.
View Article Online

This journal is©the Owner Societies 2020 Phys. Chem. Chem. Phys., 2020, 22, 12422--12433 | 12431
profile is between 20-40% less than the signal obtained prior to theonset of the oxidising potential. These results are fully consistentwith a direct oxidation process, where the electrochemical oxidationexclusively occurs at the electrode interface. At a higher oxidativepotential of +2.3 V, however, the fluorescent behaviour of HPTS ismarkedly different (solid lines Fig. 8), first the depth of the mini-mum is far greater and second the fluorescence profile is sensitive tothe concentration of the fluorophore. Fig. 8 (solid line) demonstrateshow decreasing the concentration of the fluorophore markedlyincreases the distance over which it is consumed. Plots of thevariation of the fluorescence intensity profiles as a function of timewith different concentrations and the related fluorescence micro-scope images are provided in the ESI,† Section S8 (Fig. S12 and S13for experiments at +1.2 V, Fig. S14 and S15 for those at +2.3 Vrespectively, ESI†). At such high potentials (+2.3 V) the currents atthe electrode are large (ca. 6 � 10�5 A for a 1 mM solution of thefluorophore) and correspond not only to the direct oxidation of thefluorophore but also the solvent and in this case the electrolyte –chloride. Thus, the dramatic change in the obtained fluorescenceprofiles between +1.2 V and +2.3 V directly evidence that, at the latterpotentials, the fluorophore is additionally oxidised indirectly by theproducts of the solvent break down; a mediated oxidation occurs.Although local H+ would be generated during the reaction, HPTS, isa ‘photoacid’ as such the protonated and deprotonated formsfluorescence at the same wavelength. Moreover, the protonated formhas a higher extinction coefficient at 365 nm (as used experimen-tally) as such if there was a significant change in pH during thecourse of the experiment one would anticipate and increase in thefluorescence intensity51 as opposed to the observed decrease. Con-sequently, the formation of H+ is not likely relevant in the presentsituation where the buffer is expected to be sufficient to control theinterfacial pH. In the above work the chemical reactivity of HPTStowards chlorine, Cl2, was noted. The experiments reported in Fig. 8were conducted in the presence of 0.1 M chloride. Accordingly,analogous experiments were repeated in the absence of chloride,and the data can be found in ESI,† Fig. S16. For the case in absenceof Cl�, an optical response corresponding to the direct oxidation atthe electrode was again observed even at a high oxidative potential(+2.3 V), strongly evidencing that chlorine is the operative speciescausing the oxidative destruction of the fluorophore at distancesaway from the electrode. We conclude that the electrochemicalprocess occurring at the electrode responsible for the mediatedoxidation of HPTS at +2.3 V is predominantly CER rather than OER.
To summarise, at high oxidative potentials the electro-chemical processes occurring at the electrode, OER vs. CER,are highly sensitive to the experimental conditions. We havedemonstrated that the in situ opto-electrochemical response ofHPTS can provide evidence for the operation of the CER despitethe voltammetric signatures being completely masked bysolvent decomposition.
Conclusions
The simulation model shows distinctly different concentrationprofiles and thus optical responses for the destruction of a
fluorophore by a direct oxidative at the electrode in comparisonwith a homogeneous reaction with an electrochemically generatedproduct, that is mediated oxidation. With the direct oxidation ofthe fluorophore the optical response near the vicinity of theelectrode does not deplete to zero within tens of seconds of theapplied potential; under the same time scale and in contrast,the formation of a highly reactive electrochemical product – viasolvent breakdown or electro-chlorination – is shown to ‘‘titrate’’all the fluorophore near the vicinity of the electrode.
The fluorescence response of two structurally similar fluor-escent probes, HPTS and PYTS, were investigated in a thin-layered opto-electrochemical cell. At a low oxidative potential of+1.2 V vs. pseudo Ag wire, the fluorescence response of HPTS isfully consistent with direct oxidation at the electrode as con-firmed by its voltammetric signal. However, at a higher oxidativepotential of +2.3 V, the fluorescence responses of HPTS is in-linewith the indirect destruction process (EC2) via reaction with areactive electrogenerated product arising from solvent break-down and/or electro-chlorination. The UV-Vis spectra evidencesthat reaction with chlorine is the likely dominant reaction withHPTS at higher oxidative potential. In contrast PYTS is onlyoxidised at a high potential of +2.3 V with the fluorescenceresponse in agreement with direct oxidation at the electrode.
We have shown that, in situ optical imaging synchronisedwith electrochemistry provides insights to the reaction mecha-nism when the current obtained electrochemically is dominatedand obscured by the solvent and/or breakdown of electrolyte.
Conflicts of interest
The authors declare no competing financial interests.
Acknowledgements
M. Y. acknowledges funding via an EPSRC Industrial CASEaward (EP/N509711/1).
References
1 R. G. Compton and C. E. Banks, Understanding Voltammetry,World Scientific, 2011.
2 F. M’Halla, J. Pinson and J. M. Saveant, The Solvent asHydrogen-Atom Donor in Organic Electrochemical Reactions.Reduction of Aromatic Halides, J. Am. Chem. Soc., 1980, 102,4120–4127.
3 J. Wu, H. Yu, L. Fan, G. Luo, J. Lin and M. Huang, A Simpleand High-Effective Electrolyte Mediated with P-Phenylene-diamine for Supercapacitor, J. Mater. Chem., 2012, 22,19025–19030.
4 I. M. Aldous and L. J. Hardwick, Solvent-Mediated Controlof the Electrochemical Discharge Products of Non-AqueousSodium–Oxygen Electrochemistry, Angew. Chem., Int. Ed.,2016, 55, 8254–8257.
5 H. K. Abdel-Aal, S. M. Sultan and I. A. Hussein, ParametricStudy for Saline Water Electrolysis: Part Ii—Chlorine
Paper PCCP
Ope
n A
cces
s A
rtic
le. P
ublis
hed
on 2
2 M
ay 2
020.
Dow
nloa
ded
on 3
/24/
2022
3:2
5:03
PM
. T
his
artic
le is
lice
nsed
und
er a
Cre
ativ
e C
omm
ons
Attr
ibut
ion-
Non
Com
mer
cial
3.0
Unp
orte
d L
icen
ce.
View Article Online

12432 | Phys. Chem. Chem. Phys., 2020, 22, 12422--12433 This journal is©the Owner Societies 2020
Evolution, Selectivity and Determination, Int. J. HydrogenEnergy, 1993, 18, 545–551.
6 S. Trasatti, Electrocatalysis in the Anodic Evolution of Oxygenand Chlorine, Electrochim. Acta, 1984, 29, 1503–1512.
7 X. Liu and F. Wang, Transition Metal Complexes ThatCatalyze Oxygen Formation from Water: 1979–2010, Coord.Chem. Rev., 2012, 256, 1115–1136.
8 G. Mattioli, P. Giannozzi, A. Amore Bonapasta and L. Guidoni,Reaction Pathways for Oxygen Evolution Promoted by CobaltCatalyst, J. Am. Chem. Soc., 2013, 135, 15353–15363.
9 S. H. Chang, J. G. Connell, N. Danilovic, R. Subbaraman,K.-C. Chang, V. R. Stamenkovic and N. M. Markovic, Activity–Stability Relationship in the Surface Electrochemistry ofthe Oxygen Evolution Reaction, Faraday Discuss., 2015, 176,125–133.
10 V. Consonni, S. Trasatti, F. Pollak and W. E. O’Grady,Mechanism of Chlorine Evolution on Oxide Anodes Studyof Ph Effects, J. Electroanal. Chem. Interfacial Electrochem.,1987, 228, 393–406.
11 C. H. Yang, C. C. Lee and T. C. Wen, Hypochlorite Generationon Ru–Pt Binary Oxide for Treatment of Dye Wastewater,J. Appl. Electrochem., 2000, 30, 1043–1051.
12 C. C. Hu, C. H. Lee and T. C. Wen, Oxygen Evolution andHypochlorite Production on Ru-Pt Binary Oxides, J. Appl.Electrochem., 1996, 26, 72–82.
13 V. Petrykin, K. Macounova, O. A. Shlyakhtin and P. Krtil,Tailoring the Selectivity for Electrocatalytic Oxygen Evolu-tion on Ruthenium Oxides by Zinc Substitution, Angew.Chem., Int. Ed., 2010, 49, 4813–4815.
14 M. G. Walter, E. L. Warren, J. R. McKone, S. W. Boettcher,Q. Mi, E. A. Santori and N. S. Lewis, Solar Water SplittingCells, Chem. Rev., 2010, 110, 6446–6473.
15 M. Shao, Q. Chang, J.-P. Dodelet and R. Chenitz, RecentAdvances in Electrocatalysts for Oxygen Reduction Reaction,Chem. Rev., 2016, 116, 3594–3657.
16 S. Anantharaj, S. R. Ede, K. Sakthikumar, K. Karthick,S. Mishra and S. Kundu, Recent Trends and Perspectivesin Electrochemical Water Splitting with an Emphasis onSulfide, Selenide, and Phosphide Catalysts of Fe, Co, and Ni:A Review, ACS Catal., 2016, 6, 8069–8097.
17 S. Trasatti, Progress in the Understanding of the Mecha-nism of Chlorine Evolution at Oxide Electrodes, Electrochim.Acta, 1987, 32, 369–382.
18 R. K. B. Karlsson and A. Cornell, Selectivity between Oxygenand Chlorine Evolution in the Chlor-Alkali and ChlorateProcesses, Chem. Rev., 2016, 116, 2982–3028.
19 C. A. Martinez-Huitle and S. Ferro, Electrochemical Oxida-tion of Organic Pollutants for the Wastewater Treatment:Direct and Indirect Processes, Chem. Soc. Rev., 2006, 35,1324–1340.
20 G. Chen, Electrochemical Technologies in WastewaterTreatment, Sep. Purif. Technol., 2004, 38, 11–41.
21 A. Frumkin, L. Nekrasov, B. Levich and J. Ivanov, DieAnwendung Der Rotierenden Scheibenelektrode Mit EinemRinge Zur Untersuchung Von Zwischenprodukten Elektro-chemischer Reaktionen, J. Electroanal. Chem., 1959, 1, 84–90.
22 A. N. Frumkin and L. N. Nekrasov, On the Ring-DiskElectrode, Dok. Akad. Nauk SSSR, 1959, 126, 115.
23 J. G. Vos and M. T. M. Koper, Measurement of Competitionbetween Oxygen Evolution and Chlorine Evolution UsingRotating Ring-Disk Electrode Voltammetry, J. Electroanal.Chem., 2018, 819, 260–268.
24 J. G. Vos, Z. Liu, F. D. Speck, N. Perini, W. Fu, S. Cherevkoand M. T. M. Koper, Selectivity Trends between OxygenEvolution and Chlorine Evolution on Iridium-Based DoublePerovskites in Acidic Media, ACS Catal., 2019, 9, 8561–8574.
25 T. C. Nagaiah, A. Maljusch, X. Chen, M. Bron andW. Schuhmann, Visualization of the Local Catalytic Activity ofElectrodeposited Pt–Ag Catalysts for Oxygen Reduction by Meansof Secm, ChemPhysChem, 2009, 10, 2711–2718.
26 W. Wang, Imaging the Chemical Activity of Single Nano-particles with Optical Microscopy, Chem. Soc. Rev., 2018, 47,2485–2508.
27 C. Amatore, F. Bonhomme, J.-L. Bruneel, L. Servant andL. Thouin, Mapping Concentration Profiles within the Diffu-sion Layer of an Electrode: Part I. Confocal Resonance RamanMicroscopy, Electrochem. Commun., 2000, 2, 235–239.
28 Y. Wang, X. Shan and N. Tao, Emerging Tools for StudyingSingle Entity Electrochemistry, Faraday Discuss., 2016, 193,9–39.
29 C. Amatore, A. Chovin, P. Garrigue, L. Servant, N. Sojic,S. Szunerits and L. Thouin, Remote Fluorescence Imagingof Dynamic Concentration Profiles with Micrometer Resolu-tion Using a Coherent Optical Fiber Bundle, Anal. Chem.,2004, 76, 7202–7210.
30 L. Guerret-Legras, J. F. Audibert, G. V. Dubacheva andF. Miomandre, Combined Scanning Electrochemical andFluorescence Microscopies Using a Tetrazine as a SingleRedox and Luminescent (Electrofluorochromic) Probe,Chem. Sci., 2018, 9, 5897–5905.
31 P. Audebert and F. Miomandre, Electrofluorochromism:From Molecular Systems to Set-up and Display, Chem. Sci.,2013, 4, 575–584.
32 L. Bouffier, T. Doneux, B. Goudeau and A. Kuhn, ImagingRedox Activity at Bipolar Electrodes by Indirect Fluores-cence Modulation, Anal. Chem., 2014, 86, 3708–3711.
33 T. Doneux, L. Bouffier, B. Goudeau and S. Arbault, CouplingElectrochemistry with Fluorescence Confocal Microscopy toInvestigate Electrochemical Reactivity: A Case Study withthe Resazurin-Resorufin Fluorogenic Couple, Anal. Chem.,2016, 88, 6292–6300.
34 C. Cannes, F. Kanoufi and A. J. Bard, Cyclic Voltammetryand Scanning Electrochemical Microscopy of Ferrocene-methanol at Monolayer and Bilayer-Modified Gold Electro-des, J. Electroanal. Chem., 2003, 547, 83–91.
35 C. Li, A. G. Tebo and A. Gautier, Fluorogenic Labeling Strate-gies for Biological Imaging, Int. J. Mol. Sci., 2017, 18, 1473.
36 L. Jullien and A. Gautier, Fluorogen-Based Reporters forFluorescence Imaging: A Review, Methods Appl. Fluoresc.,2015, 3, 042007.
37 M. Schaferling, The Art of Fluorescence Imaging with ChemicalSensors, Angew. Chem., Int. Ed., 2012, 51, 3532–3554.
PCCP Paper
Ope
n A
cces
s A
rtic
le. P
ublis
hed
on 2
2 M
ay 2
020.
Dow
nloa
ded
on 3
/24/
2022
3:2
5:03
PM
. T
his
artic
le is
lice
nsed
und
er a
Cre
ativ
e C
omm
ons
Attr
ibut
ion-
Non
Com
mer
cial
3.0
Unp
orte
d L
icen
ce.
View Article Online

This journal is©the Owner Societies 2020 Phys. Chem. Chem. Phys., 2020, 22, 12422--12433 | 12433
38 R. T. Williams and J. W. Bridges, Fluorescence of Solutions:A Review, J. Clin. Pathol., 1964, 17, 371.
39 A. Molina, E. Laborda, J. M. Gomez-Gil, F. Martınez-Ortizand R. G. Compton, Analytical Solutions for the Study ofHomogeneous First-Order Chemical Kinetics Via Uv–VisSpectroelectrochemistry, J. Electroanal. Chem., 2018, 819,202–213.
40 E. Laborda, J. M. Gomez-Gil, A. Molina and R. G. Compton,Spectroscopy Takes Electrochemistry Beyond the Interface:A Compact Analytical Solution for the Reversible First-OrderCatalytic Mechanism, Electrochim. Acta, 2018, 284, 721–732.
41 C. Batchelor-McAuley, C. A. Little, S. V. Sokolov, E. Katelhon,G. Zampardi and R. G. Compton, Fluorescence MonitoredVoltammetry of Single Attoliter Droplets, Anal. Chem., 2016,88, 11213–11221.
42 T. A. Davis, Algorithm 832: Umfpack V4.3—an Unsymmetric-Pattern Multifrontal Method, ACM Trans. Math. Softw, 2004,30, 196–199.
43 R. G. Compton, E. Laborda and K. R. Ward, UnderstandingVoltammetry: Simulation of Electrode Processes, World Scientific,2014.
44 P. Moon and D. E. Spencer, Field Theory Handbook: IncludingCoordinate Systems, Differential Equations and Their Solu-tions, Springer, 2012.
45 K. Aoki, K. Honda, K. Tokuda and H. Matsuda, Voltammetry atMicrocylinder Electrodes: Part I. Linear Sweep Voltammetry,J. Electroanal. Chem. Interfacial Electrochem., 1985, 182, 267–279.
46 D. Li, C. Batchelor-McAuley, L. Chen and R. G. Compton,Band Electrodes in Sensing Applications: Response Char-acteristics and Band Fabrication Methods, ACS Sens., 2019,4, 2250–2266.
47 P. Xia, P. M. Bungay, C. C. Gibson, O. N. Kovbasnjuk andK. R. Spring, Diffusion Coefficients in the Lateral Intercel-lular Spaces of Madin-Darby Canine Kidney Cell Epithelium
Determined with Caged Compounds, Biophys. J., 1998, 74,3302–3312.
48 S. Liu, C. Hu, J. Huang and Y. Yan, Fluorescent PolyionComplex for the Detection of Sodium Dodecylbenzenesul-fonate, Polymers, 2018, 10, 657.
49 T. Y. Sergeeva, R. K. Mukhitova, I. R. Nizameev, M. K.Kadirov, P. D. Klypina, A. Y. Ziganshina and A. I. Konovalov,Closed Polymer Containers Based on PhenylboronicEsters of Resorcinarenes, Beilstein J. Nanotechnol., 2018, 9,1594–1601.
50 C. Aliaga, A. Arenas, A. Aspee, C. Lopez-Alarcon andE. A. Lissi, Generation, Spectroscopic Characterization byEpr, and Decay of a Pyranine-Derived Radical, Helv. Chim.Acta, 2007, 90, 2009–2016.
51 M. Yang, C. Batchelor-McAuley, E. Katelhon andR. G. Compton, Reaction Layer Imaging Using FluorescenceElectrochemical Microscopy, Anal. Chem., 2017, 89,6870–6877.
52 T. A. Enache and A. M. Oliveira-Brett, Phenol and Para-Substituted Phenols Electrochemical Oxidation Pathways,J. Electroanal. Chem., 2011, 655, 9–16.
53 Y. S. Jung, W. T. Lim, J. Y. Park and Y. H. Kim, Effect of Phon Fenton and Fenton-Like Oxidation, Environ. Technol.,2009, 30, 183–190.
54 F. Mijangos, F. Varona and N. Villota, Changes in SolutionColor During Phenol Oxidation by Fenton Reagent, Environ.Sci. Technol., 2006, 40, 5538–5543.
55 F. P. Venable and D. H. Jackson, The Reaction betweenHydrochloric Acid and Potassium Permanganate, J. Am.Chem. Soc., 1920, 42, 237–239.
56 D. Rajkumar, J. Guk Kim and K. Palanivelu, IndirectElectrochemical Oxidation of Phenol in the Presence ofChloride for Wastewater Treatment, Chem. Eng. Technol.,2005, 28, 98–105.
Paper PCCP
Ope
n A
cces
s A
rtic
le. P
ublis
hed
on 2
2 M
ay 2
020.
Dow
nloa
ded
on 3
/24/
2022
3:2
5:03
PM
. T
his
artic
le is
lice
nsed
und
er a
Cre
ativ
e C
omm
ons
Attr
ibut
ion-
Non
Com
mer
cial
3.0
Unp
orte
d L
icen
ce.
View Article Online