visualization in astrophysics
TRANSCRIPT

EUROVIS 2021N. Smit, K. Vrotsou, and B. Wang(Guest Editors)
Volume 40 (2021), Number 3STAR – State of The Art Report
Visualization in Astrophysics: Developing New Methods,Discovering Our Universe, and Educating the Earth
Fangfei Lan1 , Michael Young1 , Lauren Anderson2 , Anders Ynnerman3 Alexander Bock1,3 , Michelle A. Borkin4 ,Angus G. Forbes5 , Juna A. Kollmeier2 , Bei Wang1
1Scientific Computing and Imaging Institute, University of Utah, USA2Carnegie Institution for Science, USA
3Linköping University, Sweden4Northeastern University, USA
5University of California, Santa Cruz, USA
AbstractWe present a state-of-the-art report on visualization in astrophysics. We survey representative papers from both astrophysicsand visualization and provide a taxonomy of existing approaches based on data analysis tasks. The approaches are classifiedbased on five categories: data wrangling, data exploration, feature identification, object reconstruction, as well as educationand outreach. Our unique contribution is to combine the diverse viewpoints from both astronomers and visualization experts toidentify challenges and opportunities for visualization in astrophysics. The main goal is to provide a reference point to bringmodern data analysis and visualization techniques to the rich datasets in astrophysics.
1. Introduction
Modern astronomers are recording an increasing amount of infor-mation for a larger number of astronomical objects and makingmore complex predictions about the nature of these objects andtheir evolution over cosmic time. Both successes are being drivenby advances in experimental and computational infrastructure. Asa result, the next generation of computations and surveys will putastronomers face to face with a “digital tsunami” of both simulatedand observed data. These data present opportunities to make enor-mous strides in discovering more about our universe and state-of-the-art visualization methodologies.
This state-of-the-art report serves as a starting point to bridge theknowledge gap between the astronomy and visualization communi-ties and catalyze research opportunities. Astronomy has a long andrich history as a visual science. Images of the cosmos have beenused to build theories of physical phenomena for millennia. Thishistory makes astronomy a natural area for fruitful collaborationsbetween visualization and astronomy. A substantial fraction of pre-vious work at this scientific intersection has therefore focused onimage reconstruction – generating the most precise representationfrom a series of images of a patch of the sky – typically using op-timizations and signal processing techniques. Advances in imagereconstruction have enabled great breakthroughs in astronomy, in-cluding the recent imaging of a black hole [EAA∗19]. However, inthis report, we focus on modern visualization techniques, which in-clude 3D rendering, interaction, uncertainty visualization, and newdisplay platforms. This report, authored by experts in both astron-
omy and visualization, will help visualization experts better under-stand the needs and opportunities of astronomical visualization, andprovide a mechanism for astronomers to learn more about cutting-edge methods and research in visualization as applied to astronomy.
Comparison with related surveys. Several studies have fo-cused on surveying visualization of astronomical data. Hassanet al. [HF11] surveyed scientific visualization in astronomy from1990 to 2010. They studied visualization approaches for N-bodyparticle simulation data and spectral data cubes – two areas theyidentified as the most active fields. They classified research papersin these areas based on how astronomical data are stored (i.e., aspoints, splats, isosurfaces, or volumes) and which visualizationtechniques are used. They also discussed visualization workflowsand public outreach, and reviewed existing softwares for astronom-ical visualization.
Lipsa et al. [LLC∗12], on the other hand, took a broader view insurveying visualization for the physical sciences, which includedastronomy and physics. For astronomy, the papers are classifiedbased on the visualization challenges they tackle: multi-field visu-alization, feature detection, modeling and simulation, scalability,error/uncertainty visualization, and global/local visualization.
Hassan et al. excelled at classifying papers based on data typesand considering how different types of data could be visualized.Lipsa et al. focused more on visualization techniques. A data-centered classification is useful for researchers to explore diverseways to visualize their data, whereas a technique-centered classi-fication can be useful for researchers who want to explore their
© 2021 The Author(s)Computer Graphics Forum © 2021 The Eurographics Association and JohnWiley & Sons Ltd. Published by John Wiley & Sons Ltd.
DOI: 10.1111/cgf.14332
https://diglib.eg.orghttps://www.eg.org

Lan et al. / Visualization in Astrophysics
data using a particular visualization technique. Our survey aims tostrike a balance between these two classification schemes and clas-sifies the papers primarily based on data tasks and secondarily onvisualization techniques, thus allowing researchers to explore howthey can best visualize the data at hand based on the analysis tasksthey have in mind. We also utilize tertiary categories in topical ar-eas in astronomy for cross-references for the astronomy audience.Namely, we classify papers based on extragalactic, galactic, plan-etary, and solar astronomy. We further label each paper as dealingwith simulated or observational astronomical data.
To the best of our knowledge, no comprehensive survey of visu-alization in astronomy has been conducted since 2012. Advancesin both astronomical data and visualization in the past decadepresent a need for an updated state-of-the-art report. In 2011, Has-san et al. identified six grand challenges for scientific visualiza-tion in astronomy in the era of peta-scale data. Our survey dis-cusses how the community has responded to these challenges inthe past decade. The unique contribution of this survey is thecross-discipline discussion between visualization experts and as-tronomers via two workshops (a mini-workshop in April 2020 andan IEEE VIS workshop in October 2020), where researchers fromboth fields worked together in identifying progress, challenges, andopportunities in astronomical visualization. This survey aims tobecome a reference point for building connections and collabora-tions between two communities: data-rich, but technique-hungry,astronomers and data-hungry, but technique-rich, visualization ex-perts. We further discuss datasets in astronomy in need of new ap-proaches and methodologies, visualization techniques that have notbeen applied to astronomical datasets, and visualization techniquesthat can enhance the educational value of astronomical datasets.
In Sect. 2 we define our primary, secondary, and tertiary cat-egories of approaches based on data analysis task, visualizationtechnique, and topical area in astronomy, respectively. In Sect. 3,4, 5, 6, and 7 we discuss and group papers based on the primarycategories of data wrangling, data exploration, feature identifica-tion, object reconstruction, education and outreach, respectively. InSect. 8 we identify challenges and opportunities for astronomy vi-sualization. We provide a navigation tool of the surveyed papers inSect. 9, and we summarize our conclusions in Sect. 10.
To make the survey results more accessible and actionable tothe research community, all papers surveyed, including associatedmetadata, can be explored online with a visual literature browser(https://tdavislab.github.io/astrovis-survis) devel-oped with the SurVis [BKW16] framework.
2. Literature Research Procedure and Classification
We reviewed representative papers over the past 10 years (between2010 and 2020) in the fields of astronomy and visualization thatcontain strong visualization components for astronomical data. Theannotation of each paper was guided primarily by a set of data anal-ysis tasks; secondarily by a set of visualization techniques; and fi-nally by a set of topical areas in astronomy. We view these threecategories as being on equal footing and not necessarily hierarchi-cal. Instead, they are considered as orthogonal dimensions and pro-vide complementary viewpoints. We organize the literature accord-
2D/3D plots 2D images 3D rendering Interactive vis. Dim. reduction Uncertainty vis. New display
Technique-Driven Categories
Datawrangling
Dataexploration
FeatureIdentification
Objectreconstruction
Education & outreach
Task-Driven Categories
Topic-Driven Categories
Extragalactic astronomy
Galactic astronomy
Planetary astronomy
Solar astronomy& astrophysics
Tag
Simulations Observations
Figure 1: A typology of task-driven (primary), technique-driven(secondary), and topic-driven (tertiary) categories used in this sur-vey paper.
ing to these three categories to provide a means of navigation fromtask-driven, technique-driven, and topic-driven perspectives.
The literature surveyed spans venues in visualization such asIEEE Transactions on Visualization and Computer Graphics, Com-puter Graphics Forum, and IEEE Computer Graphics and Applica-tions; and astronomy such as Astrophysical Journal and Astrophys-ical Journal Letters, Monthly Notices of the Royal AstronomicalSociety, Astronomy and Computing, .Astronomy (Dot Astronomy),ADASS Conference Series, PASP (Publications of the AstronomicalSociety of the Pacific), Research Notes of the AAS. We also discussdata types that include simulation data and observation data, withthe latter encompassing both image data and tabular data. Fig. 1shows a typology of primary, secondary, and tertiary categoriesused in this survey.
2.1. Task-Driven Categories: Data Analysis Tasks
Our literature review allowed us to identify five primary categoriesof approaches based on data analysis tasks:
• Data wrangling, which transforms astronomy data into for-mats that are appropriate for general purpose visualization tools;
• Data exploration, where users explore a dataset in an un-structured way to discover patterns of interest;
• Feature identification, which visually guides the identifica-tion and extraction of features of interest;
• Object reconstruction, which provides an informative vi-sual representation of an astronomical object;
• Education and outreach, where astronomical data or dataproducts are made accessible to the general public.
In an on-going paradigm shift in scientific outreach, technolog-ical advances are enabling data-driven and interactive explorationof astronomical data in museums and science centers. Hence, weinclude “education and outreach” as a data analysis category. Theword “feature” generally means a measurable piece of data that canbe used for analysis, whereas the word “object” may be considered
© 2021 The Author(s)Computer Graphics Forum © 2021 The Eurographics Association and John Wiley & Sons Ltd.
636

Lan et al. / Visualization in Astrophysics
as a “feature” with sharp and/or discontinuous contrast in a dimen-sion of scientific interest. Whether a specific aspect of a datasetis considered an “object” or a “feature” depends on the scientificquestion at hand. We separate object reconstruction from featureidentification to be compatible with the literature, but we envisiona future in which these entities are recognized as a continuum.
2.2. Technique-Driven Categories: Visualization Techniques
Our secondary categories of approaches are based on visualizationtechniques employed for astronomical data:
• 2D/3D plots that encompass classic 2D/3D plots such as his-tograms, scatter plots, pie chars, pie, bar, and line plots;
• 2D images that utilize image processing techniques to gen-erate images of astronomy data;
• 3D rendering that generates representations of 3D volumet-ric data of interest;
• Interactive visualization that includes techniques such aslinked views, detail on demand, visual filtering, and querying;
• Dimensionality reduction that transforms data from a high-dimensional into a property-preserving low-dimensional spaceas part of the visualization pipeline;
• Uncertainty visualization that improves our ability to rea-son about the data by communicating their certainties that arisedue to randomness in data acquisition and processing;
• New display platforms that communicate data via tech-niques such as data physicalization and virtual reality.
Although dimensionality reduction can be used as a purely dataanalysis strategy for noise reduction, clustering, or downstreamanalysis, it also serves as an integrated part of the visualizationpipeline to facilitate data exploration and understanding. In this sur-vey, we focus on the use of dimensionally reduction in the contextof visualization. Dimensionality reduction and clustering may beboth considered as data preprocessing techniques, but we chooseto exclude clustering as a category as it is a generic class of tech-niques implicitly implemented within many toolboxes and does nottypically represent a main innovation of the surveyed research.
We highlight the new display platforms as a category based onour experiences and workshops held among a growing “visualiza-tion in astrophysics” community. We believe there is a strong mo-tivation for this research direction as the community as a whole isready for the next stage of scientific discovery and science commu-nications enabled by new displays.
We also acknowledge that there are additional ways to thinkabout categories based on visualization techniques. For instance,scalable, multi-field, comparative, and time-dependent visualiza-tion are all categories mentioned in the 2012 survey of Lipsa et al.However, as technology has evolved over the past decade, certainvisualization techniques (e.g., scalable and comparative visualiza-tion) have become commonplace and thus lack specificity. Time-dependent visualization (Sect. 8.5), in particular, the interplay be-tween spatial and temporal dimensions, will be crucial as more timeseries astronomy data become available in the near future. In thissurvey, we choose specific visualization techniques that capture thestate of the art and lead to informative categorization.
2.3. Topic-Driven Categories: Topical Areas in Astronomy
Our tertiary categories are based upon the list of topics fromthe National Science Foundation (NSF) Astronomy & Astro-physics directorate. These categories are used as a cross-referencefor an astrophysics audience. We also investigated a curated listof research topics in astronomy and astrophysics provided bythe American Astronomical Society (AAS) (https://aas.org/meetings/aas237/abstracts). We decided to work with thecoarser classification from NSF since the AAS list is overly re-fined and specialized for the purposes of this survey. Our tertiarycategories are:
• Extragalactic astronomy• Galactic astronomy• Planetary astronomy• Solar astronomy and astrophysics
In addition, we have labeled each paper with two tags:
• Simulated astronomical data• Observational astronomical data
For readers unfamiliar with certain terminology in astronomy orastrophysics, we recommend the astrophysics glossaries from theNational Aeronautics and Space Administration (NASA) (https://science.nasa.gov/glossary/) or the LEVEL5 KnowledgeBase on Extragalactic Astronomy and Cosmology (https://ned.ipac.caltech.edu/level5/). Meanwhile, we try our best todescribe relevant terms the first time they are introduced in the sur-vey. We would like to point out that even though certain terminol-ogy may appear to be rather straightforward, in some cases, defini-tions vary within the field, and thus some attention must be given tothe precise work in question. For example, the term halo typicallyrefers to overdensities in the dark matter but the exact boundary ofa halo in a specific calculation may vary (e.g., [KPH13]).
Overview. One of the main contributions of this paper is theclassification of existing works, which are summarized in Sect. 3to Sect. 7. The methods of classification reflect the authors’ expe-rience that comes from several meetings with experts in the astro-nomical visualization community. For each surveyed paper, we useour best judgment to infer its primary and secondary categories, al-though such classification may not be perfect; many papers spanmultiple categories. The best way to explore our classification isto use the table for each section (from Table 1 to Table 5) as aroadmap.
We acknowledge that many effective tools were actively usedin astronomy research published prior to 2010. We emphasize thatthis paper is not a comprehensive catalog of all tools used in as-tronomy, nor does it include pre-2010 works. Rather, this papersurveys active areas of visualization research in astronomy as iden-tified in publications in the last decade (2010–2021). We also notethat whereas “astronomy” has previously meant the cataloging ofthe positions and motions of objects in the sky, and “astrophysics”the physical understanding of those objects, in this survey, we con-sider “astronomy” and “astrophysics” to be synonymous since fewastronomers make the above distinction. In fact, by “visualizationin astrophysics”, we consider the intersection of visualization withastronomy, astrophysics, and space exploration.
© 2021 The Author(s)Computer Graphics Forum © 2021 The Eurographics Association and John Wiley & Sons Ltd.
637

Lan et al. / Visualization in Astrophysics
Datawrangling
2D/3D plots
2D images
3D rendering
Interactive vis.
Dim. reduction
Uncertaintyvis.
New display
Extragalac. astronomy
Galactic astronomy
Planetary astronomy
Solarastronomy
Simulation Observation
[Ken13] • • • • •[Tay15]
[Tay17b]• • • • • •
[Gár17] • • • • •[Ken17] • • • • • •[Nai16] • • • • • •
[NBC17] • • • • • •[BNL19] • • • • • •
[WHA∗11] • • • • •[BG17] • • • • •
[VOVMB16][VSDR17]
• • • • •
[CPST20] • • • • •[ERG19][OC20]
• • • • • •
[VW12] • • • • •[VE21] • • • • •
Table 1: Classifying papers under data wrangling based on secondary and tertiary categories. Top row, from left to right: (primary cate-gory) Data wrangling; (secondary categories) 2D/3D plots, 2D images, 3D rendering, interactive visualization, dimensionality reduction,uncertainty visualization, and new display platforms; (tertiary categories) extragalactic, galactic, planetary, and solar astronomy; (tags)simulated, and observational data.
3. Data Wrangling
Data wrangling is the process of transforming raw data into formsthat more effectively support downstream analysis [KHP∗11]. Thisprocess is an important step for astronomy visualization becauseraw simulation or observational data require significant wranglinginto a suitable form for visualization tasks. In this section, we cat-egorize papers that present novel work in data wrangling for as-tronomy visualization. Many established tools are available for datawrangling across specific areas of astronomy, but a full survey ofsuch tools is not within the scope of this survey. High-dimensionaldata abstractions such as data cubes are commonly used in astro-physical sciences and are often stored in the FITS format. Manyof the papers placed in this category focus on transforming rawastrophysical data cubes into suitable data formats that can be in-gested into open-source visualization tools, such as Blender andHoudini. Others introduce new formats that can be used to supportvarious tools for data representation and data analysis. Authors ofdata wrangling papers have often made significant efforts to intro-duce astronomers to the visualization pipelines using these tools.We further classify these papers using our secondary categoriza-tion on visualization techniques (Sect. 2.2). Table 1 presents anoverview of our categorization of data wrangling papers.
Using Blender to visualize astrophysics data. Blender [Ble02] isan open-source 3D graphics and visualization tool that supports awide range of modeling, animation, and rendering functionality. Arange of papers have discussed its usefulness for presenting astron-omy data, and described pipelines for transforming raw data intoscientific visualizations. Kent [Ken13] demonstrated how Blendercan be used to visualize galaxy catalogs, astronomical data cubes,and particle simulations. Taylor [Tay15] introduced FRELLED, aPython-based FITS viewer for exploring 3D spectral line data us-ing Blender that visualizes 3D volumetric data with arbitrary (non-Cartesian) coordinates [Tay17b] and is designed for real time and
interactive content. Using this viewer, astronomers are able to speedup visual cataloging by as much as 50×. Gárate [Gár17] describedthe process of importing simulation outputs from astrophysical hy-drodynamic experiments into Blender using the voxel data format.In order to facilitate immersive data exploration, Kent [Ken17] pre-sented a technique for creating 360° spherical panoramas usingBlender and Google Spatial Media module. The method supportsstatic spherical panoramas, single pass fly-throughs, and orbit fly-overs on browsers or mobile operating systems.
AstroBlend [Nai12,Nai16] extends Blender, making it possible toimport and display various types of astronomical data interactively,see Fig. 2. AstroBlend is an open-source Python library that utilizesyt – an open-source software for analyzing and visualizing volumet-ric data – for 3D data visualization (yt is discussed in Sect. 4). As-troBlend effectively bridges the gap between “exploratory” and “ex-planatory” visualization, as discussed by Goodman et al. [GBR18]and Ynnerman et al. [YLT18].
Using Houdini to visualize astrophysics data. In another exampleof adapting existing 3D graphics software, Naimen et al. [NBC17]explored how the 3D procedural animation software Houdini canbe used for astronomy visualization, producing high-quality vol-ume renderings for a variety of data types. They utilized yt totransform astronomical data into graphics data formats for Houdini,which bridges the astronomical and graphics community. Houdiniis a compelling alternative to other rendering software (e.g., Mayaand Blender) for astronomy because it produces high-quality vol-ume renderings and supports a variety of data types.
Borkiewicz et al. [BNL19] presented a method for creating cin-ematic visualizations and time-evolving representations of astron-omy data that are both educational and aesthetically pleasing. Thepaper also provided a detailed workflow of importing nested, multi-resolution adaptive mesh refinement data into Houdini.
© 2021 The Author(s)Computer Graphics Forum © 2021 The Eurographics Association and John Wiley & Sons Ltd.
638

Lan et al. / Visualization in Astrophysics
Using ParaView to visualize astrophysics data. ParaView is anopen-source, general-purpose, multi-platform analysis and visu-alization tool for scientific datasets. It supports scripting (withPython), web-based visualization, and in situ analysis (using Cat-alyst). Woodring et al. [WHA∗11] used ParaView to analyze andvisualize large N-body cosmological simulations. N-body cosmo-logical simulations are simulations of large-scale structures thatcontain particles that interact only via gravity, in contrast to in-cluding gas, which also requires hydrodynamics. ParaView pro-vides particle readers (supporting “cosmo” and “GADGET” for-mats) and efficient halo finders, where a halo is a gravitationallybound structure on galactic scales. Together with existing visual-ization features, ParaView enables efficient and interactive visual-ization of large-scale cosmological simulations. Recent work fromthe IEEE VIS 2019 SciVis content [NNPD19] used ParaView tovisualize HACC (Hardware/Hybrid Accelerated Cosmology Code)cosmological simulations [HPF∗16].
Data wrangling to support visualization. Beyond the integrationof visualization techniques into popular 3D software platforms, arange of projects have explored the transformation of astrophysi-cal data into formats suitable for different forms of presentation,immersion, and analysis. Data wrangling is a perennial concern,and as new display formats are introduced or made more widelyaccessible, researchers investigate how best to target them. For ex-ample, predating our survey, Barnes et al. [BFBP06] introducedS2PLOT, a 3D plotting library for astronomy that supports dynamicgeometry and time-varying datasets. S2PLOT has been used to con-struct models of planetary systems and create outputs for viewingon stereoscopic displays and in digital domes [FBO06]. Barnes andFlute [BF08] described a technique to embed interactive figurescreated with S2PLOT into Adobe PDF files to augment astronomyresearch papers, including 3D renderings of cosmological simula-tions and 3D models of astronomy instrumentation.
Some earlier approaches to data wrangling continue to be use-ful for more contemporary projects. The Montage Image MosaicEngine [Arc05] enables users to stitch a “mosaic” together fromsets of individual FITS images, and supports a range of imagemanipulation functionality, such as pixel sampling, image projec-
Figure 2: A screenshot from a visualization session in AstroBlend,a Blender-based 3D rendering and analysis tool. Image reproducedfrom Naiman et al. [Nai16].
tion/rotation, background rectification, and animation. Montage canbe used to create sky coverage maps and animations of data cubes,and its data wrangling capabilities have been integrated into othervisualization tools. For example, mViewer, which can be scriptedusing Python, creates multi-color JPEG and PNG representationsof FITS images and provides a wide range of functionality to sup-port various types of image overlays, such as coordinate displays,labels, and observation footprints [BG17].
Vogt et al. [VOVMB16] introduced the X3D pathway for im-proving access to data visualization by promoting the use of inter-active 3D astrophysics diagrams based on the X3D format, whichcan be shared online or incorporated into online publications. Vogtet al. [VSDR17] demonstrated the potential of this “pathway” byinteractively visualizing integral field spectrographs observed in ayoung supernova remnant in the Small Magellanic Cloud. First,they created an interactive diagram of a reconstructed 3D map ofthe O-rich ejecta and exported it to the X3D file format. Second,they utilized (and extended) the visualization tools provided byX3D to make the diagram interactive, such as the ability to toggleviews, “peel” intensity layers to focus on particular ranges of data,and modify clip planes to slice the 3D model at certain locations orangles.
Although the most common format for distributing astronomyimages is FITS [WG79], Comrie et al. [CPST20] suggested that theHDF5 format [FHK∗11] is better suited for hierarchical data and forfacilitating efficient visualizations of large data cubes. They iden-tified various common visualization tasks, including the renderingof 2D slices; generating single-pixel profiles, region profiles, andstatistics; and interactive panning and zooming, and introduced aHDF5 hierarchical data schema to store precomputed data to facili-tate these tasks. After integrating the HDF5 schema with the imageviewer CARTA [OC20], they demonstrated that their schema wasable to obtain up to 103 speed-ups for certain tasks. For example,precomputing and storing a dataset of histograms for each chan-nel of a Stokes cube enables CARTA to display the histograms foran entire data cube with minimal delay. CARTA is part of CASA –the Common Astronomy Software Applications package – a pri-mary data processing software for radio telescopes, including theAtacama Large Millimeter/submillimeter Array (ALMA) and theKarl G. Jansky Very Large Array (VLA). CASA [Jae08] supportsdata formats from ALMA and VLA, and is equipped with func-tionalities such as automatic flagging of bad data, data calibration,and image manipulation. It has also been used to simulate observa-tions. It comes with a graphic user interfaces with viewer, plotter,logger, and table browser [Jae08]. CASA has some recent develop-ments that enhance user experience [ERG19], including increasedflexibility in Python and data visualization with CARTA.
Vogt and Wagner advocated for the use of stereoscopy visualiza-tion, or “stereo pairs”, to enhance the perception of depth in multi-dimensional astrophysics data [VW12]. Their technique involvessending distinct images to each eye, and supports both parallel andcross-eyed viewing techniques. They described a straightforwardmethod to construct stereo pairs from data cubes using Python, andused various examples of both observational and theoretical data todemonstrate the potential of stereoscopy for visualizing astrophys-ical datasets.
© 2021 The Author(s)Computer Graphics Forum © 2021 The Eurographics Association and John Wiley & Sons Ltd.
639

Lan et al. / Visualization in Astrophysics
Verbraeck and Eisemann [VE21] presented a technique for inter-actively rendering black holes (see Fig. 3), illustrating how a blackhole creates spacetime distortions in its environment due to gravi-tational lensing and redshift. The rendering algorithm first createsan adaptive grid that maps a uniform 360-view surrounding a vir-tual observer to the distorted view created by the black hole. Thismapping is then used to optimize ray tracing through curved space-time. The rendering solution also includes an interpolation tech-nique that simulates the movement of the observer around the blackhole, enabling interactive transitions between multiple sets of adap-tive grids.
Figure 3: The projection of the distorted celestial sky caused bya Kerr black hole. Image reproduced from Verbraeck and Eise-mann [VE21].
Data wrangling will continue to be an important component ofastrophysics research as new sensors, telescopes, and other spaceinstruments are built that generate datasets at higher resolutions andconsisting of new data types. New data transformation methods ormodifications of existing methods will be required to interoperatewith existing visualization tools and to expand the accessibility ofthe data, making the data available in forms suitable for presenta-tion, collaboration, interactive analysis, and public outreach.
4. Data Exploration
In this section, we summarize research efforts that use visualizationto focus on exploratory data analysis [Tuk77]. Broadly speaking,the defining attribute of data exploration papers is a focus on facili-tating the unstructured investigation of a dataset in order to discoverpatterns of interest and formulate hypotheses. Our interpretation ofdata exploration follows Goodman’s perspective on studying high-dimensional data in astronomy, where “interactive exploratory datavisualization can give far more insight than an approach where dataprocessing and statistical analysis are followed, rather than accom-panied, by visualization.” [Goo12]. We distinguish between “het-erogeneous” and “hierarchical” data exploration to highlight thedifferent methodologies employed, where heterogeneous refers todrawing together disparate datasets and hierarchical refers to a deepexploration of fundamentally similar datasets (perhaps at differentresolutions). Table 2 presents an overview of our categorization ofdata exploration papers.
4.1. Heterogeneous Data Exploration
A number of astrophysics visualization software frameworks andtools have emphasized the value of exploring multiple datasets si-multaneously in order to generate new insight, often requiring (orfacilitating) data transformation pre-processing steps.
yt [TSO∗10] is an open-source, flexible, and multi-code dataanalysis and visualization tool for astrophysics. Earlier versionsof yt focused on making it possible to examine slices and pro-jected regions within deeply nested adaptive mesh refinement sim-ulations [BNO∗14]. Although still widely used for its data wran-gling capabilities, yt now also includes a range of data explorationand feature identification functionalities, providing off-screen ren-dering, interactive plotting capabilities, and scripting interfaces.It efficiently processes large and diverse astrophysics data, cre-ates 2D visualization with an adaptive projection process and vol-ume rendering by a direct ray casting method. Its cross-code sup-port enables analysis for heterogeneous data types, and facilitatescross-platform collaborations between different astrophysics com-munities. In order to reduce processing time, yt adopts parallelismand is able to run multiple independent processing units on a sin-gle dataset in parallel. Apart from being easily customizable, ytpresents a number of pre-defined analysis modules for halo find-ing, halo analysis, merger tree creation, and time series analysis,among others, and a recent project makes it possible to use yt forinteractive data exploration within Jupyter notebooks [MT20]. yt isalso notable for its large, active community of users and developers.
Filtergraph [BSP∗13] is a web application that generates a rangeof 2D and 3D figures. It is designed to reduce the “activation en-ergy” of the visualization process to flexibly and rapidly visualizelarge and complex astronomy datasets. It accepts numerous file for-mats without meta-data specifications, from text files to FITS im-ages to Numpy files. The interface enables users to plot their dataas high-dimensional scatter plots, histograms, and tables. Users canextensively explore the datasets and switch between different repre-sentations without cognitive interruption. Users can also customizethe visualization through various interactive capabilities, such aspanning, zooming, data querying, and filtering. Filtergraph also fa-cilitates the sharing and collaboration of visualizations.
Luciani et al. [LCO∗14] introduced a web-based computing in-frastructure that supports the visual integration and efficient miningof large-scale astronomy observations. The infrastructure overlaysimage data from three complementary sky surveys (SDSS, FIRST,and simulated LSST results) and provides real-time interactive ca-pabilities to navigate the integrated datasets, analyze the spatialdistribution of objects, and cross-correlate image fields. Addition-ally, Luciani et al. described interactive trend images, which arepixel-based, compact visual representations that help users identifytrends and outliers among large collections of spatial objects.
ESASky [BGR∗16], developed by the ESA Center Science DataCenter, is a web application designed for three use cases: the explo-ration of multi-wavelength skies, the search and retrieval of data forsingle or multiple targets, and the visualization of sky coverage forall ESA missions. The end result is a “Google Earth for space”, ef-fectively combining the vast collection of data hosted by the ESAand providing an annotated map of the Universe that facilitates dataquerying and exploration across multiple data sources.
© 2021 The Author(s)Computer Graphics Forum © 2021 The Eurographics Association and John Wiley & Sons Ltd.
640

Lan et al. / Visualization in Astrophysics
Dataexploration
2D/3D plots
2D images
3D rendering
Interactive vis.
Dim. reduction
Uncertaintyvis.
New display
Extragalac. astronomy
Galactic astronomy
Planetary astronomy
Solarastronomy
Simulation Observation
[TSO∗10] • • • • • • •[BSP∗13] • • • •[LCO∗14] • • • • • •[BGR∗16] • • • • • •[AFPR∗17] • • • • •[PCHT17] • • • • •[ACS∗17][KHE∗10]
[FH07]• • • • •
[BAC∗20][BAB∗18][CBE∗21]
• • • • • • • • •
[SJMS19] • • • • • • •[VBF∗16] • • • • •[Mun17] • • • • •[Tay05][Tay14][Tay17a]
• • • • • • •
[SBD∗17][MSRMH09]
• • • • •
[HWMB15][AF15]
[HPU∗15]• • • • •
[ZST11] • • • •[BV18] • • • • • • • •
[YEII12][YEII16]
• • • • • • • •
[FRG19][HSS∗19][NNPD19][SMG∗19]
• • • • • •
Table 2: Classifying papers under data exploration based on secondary and tertiary categories. Top row, from left to right: (primary cate-gory) Data exploration; (secondary categories) 2D/3D plots, 2D images, 3D rendering, interactive visualization, dimensionality reduction,uncertainty visualization, and new display platforms; (tertiary categories) extragalactic, galactic, planetary, and solar astronomy; (tags)simulated, and observational data.
LSSGalPy [AFPR∗17] emphasizes the exploration of the large-scale structures surrounding galaxies and visualizes isolated galax-ies, isolated pairs, and isolated triplets in relation to other galaxieswithin their large-scale structures. The paper describes one use casethat investigates the effect of local and large-scale environments onnuclear activity and star formation, and another use case that vi-sualizes galaxies with kinematically decoupled stellar and gaseouscomponents, including an estimation of the tidal strength that af-fects each galaxy.
The Cosmicflows project aims to reconstruct and map the struc-ture of the local universe, providing a series of catalogs that mea-sure galaxy distances and velocities [TCD∗13]. Supporting thisproject, Pomarede et al. [PCHT17] provided four “cosmography”use cases for the SDvision visualization software, focusing on thecreation of animations and interactive 2D and 3D visualizations ofscalar and vector fields found in catalogs of galaxies, mapping cos-mic flows, representing basins of attraction, and viewing the Cos-mic V-web [PHCT17]. Pomarede et al. also explored the use ofSketchfab, a web-based interface that enables the uploading andsharing of 3D models that can be viewed in virtual reality.
The vast scales present in astronomical datasets can be diffi-cult to render and present simultaneously. Klashed et al. [KHE∗10]introduced the “ScaleGraph” concept to deal with imprecision in
rendering in the Uniview software. Hansen et al. [FH07] utilizedpower-scaled coordinates to cover the distance ranges. More re-cently, Axelsson et al. [ACS∗17] presented a way to enable fastand accurate scaling, positioning, and navigation without a signif-icant loss of precision, which they call the dynamic scene graph.At the core of this technique is the dynamic reassignment of thecamera to focus on the object of interest, which then becomes theorigin of the new coordinate system, ensuring the highest possibleprecision. Axelsson et al. applied this technique in the open-sourcesoftware OpenSpace.
OpenSpace [BAC∗20] is a software system that enables the in-teractive exploration of a multitude of available astronomy datasets(Fig. 4). It is designed to be robust enough to support educationaland outreach activities as well as adaptable enough to allow for theincorporation of new data or analysis tools to support scientific re-search. For the first task, Openspace has already demonstrated suc-cess in science communication at museums and in planetariums.For the second task, OpenSpace’s ability to interface with toolssuch as Glue [GBR18] or Aladin exemplifies a growing paradigmin astronomy visualization: the combination of multiple availabletools to complete a task rather than building a bespoke systemfrom the ground up. OpenSpace exhibits several novel features, in-cluding multi-resolution globe browsing [BAB∗18], which enables
© 2021 The Author(s)Computer Graphics Forum © 2021 The Eurographics Association and John Wiley & Sons Ltd.
641

Lan et al. / Visualization in Astrophysics
dynamic loading of high-resolution planetary surface textures andphysically based rendering of planetary atmospheres [CBE∗21].
Figure 4: OpenSpace: time-varying corona mass ejection simula-tion with 3D rendering and field lines. Image reproduced from Bocket al. [BAC∗20].
Gaia Sky [SJMS19] is an open-source, 3D universe explorer thatenables users to navigate the stars of our galaxy from the Gaia Cat-alog (Gaia data release 2). It also aids in the production of outreachmaterial. The system embeds stars in a multi-scale octree structure,where, at different levels, stars with various absolute brightness val-ues are present. The system contains a floating camera for spacetraversal, integrated visualization of relativistic effects, real-timestar movement, and simulates the visual effects of gravitationalwaves. The main strength of Gaia Sky is its capability to providereal-time interactive exploration for hundreds of millions of stars.Its efficient handling of the data allows it to manage a large rangeof scales with sufficient numerical precision.
Vohl et al. [VBF∗16] presented Encube to accelerate the visualdiscovery and analysis process of large data cubes in medical imag-ing and astronomy (Fig. 5). Encube can be used on a single desktopas well as the CAVE2 immersive virtual reality display environ-ment. In the CAVE2 environment, Encube enables users to controland interact with a visualization of over 100 data cubes across 80screens. The design focuses on comparative visualization and re-lated user interactions, such as swapping screens and requestingquantitative information from the selected screens. It uses a dis-tributed model to seamlessly process and render visualization andanalysis tasks on multiple data cubes simultaneously. Additionally,Encube serializes the workflow and stores the data in the JSON for-mat, so that the discovery process can be reviewed and re-examinedlater. A desktop version of Encube supports many of the same func-tionalities as it does in the CAVE2 environment. Combined with therecording of the discovery process, researchers can continue withtheir workflow when they return to their desktops.
Recognizing that FITS images were inherently complex, and thatexisting FITS viewers were not built with an optimal user expe-rience in mind, Muna [Mun17] introduced Nightlight, an “easy touse, general purpose, high-quality” viewer. Nightlight uses detail-on-demand to provide a high-level view of the file structure uponloading, and allows quick exploration of the data. Instead of reduc-ing the dynamic range of astronomical data while visualizing FITS
images, Nightlight leverages its approach on the fact that the inputimage is likely astronomical data. It provides two modes for theastronomers — hyperbolic sine function scaling for bright features(e.g. stars), and linear scaling for faint features (e.g., nebulae). ForFITS tables, Nightlight provides two views. The first is a grid of“cards”, where each card represents the metadata of a single col-umn in the table. The “cards” view is complemented by a secondview in which the user can find the details of the full table.
Since its introduction, TOPCAT [Tay05] has been widely used toview, analyze, and edit tabular data in the astronomy community.In additional to the generic tasks such as sorting rows, computingstatistics of columns, and cross-matching between tables, TOPCATalso provides astronomy specific functionalities including the ac-cess to Virtual Observatory data, handling of various coordinatesystems, and joining tables based on sky positions [Tay17a]. Overthe past decade, the developers of TOPCAT have continued to im-prove its capabilities. Taylor [Tay14] described a rewrite of the plot-ting library added to TOPCAT v4, which is designed to improve re-sponsiveness and performance of the visualization of large datasets.One important new feature is the hybrid scatter plot/density map,see Fig. 6, that enables users to navigate interactively between thehigh- and low-density regions without changing plot types.
Taylor [Tay17a] described the exploratory visualization capabil-ities of TOPCAT, which include high-dimensional plotting, high-density plotting, subset selection, row highlighting, linked views,and responsive visual feedback. Apart from the GUI application,users can also access TOPCAT from a set of command-line tools.
4.2. Hierarchical Data Exploration
Scherzinger et al. [SBD∗17] proposed a unified visualization toolbased on Voreen [MSRMH09] that supports the interactive explo-ration of multiple data layers contained within dark matter simula-tions. These simulations contain only dark matter particles, in con-trast to also including gas and stars. Scherzinger’s visualization en-
Figure 5: Comparative visualization of 20 galaxy morphologieswith Encube [VBF∗16]. Image reproduced from “Large-scale com-parative visualization of sets of multidimensonal data”, writtenby Dany Vohl, David G. Barnes, Christopher J. Fluke, GovindaPoudel, Nellie Georgiou-Karistianis, Amr H. Hassan, Yuri Benovit-ski, Tsz Ho Wong, Owen L. Kaluza, Toan D. Nguyen, and C. PaulBonnington, published in the PeerJ Computer Science journal. Linkto article: https://peerj.com/articles/cs-88/.
© 2021 The Author(s)Computer Graphics Forum © 2021 The Eurographics Association and John Wiley & Sons Ltd.
642

Lan et al. / Visualization in Astrophysics
ables users to view the global structure of the data through 2D and3D volume rendering and particle rendering, and the time-varyingproperties of the data through a merger tree visualization. Localstructures are explored further through local particles visualizationand the integration with Galacticus, an open-source semi-analyticmodel that computes information about galaxy formation based onmerger tree hierarchies of dark matter halos [Ben12]. An importantaspect of their approach is scalable volume rendering, where thedistribution of dark matter is visualized at interactive frame ratesbased on a pre-processing conversion. During such a conversion,attributes of large-scale particle data are distributed over a voxelgrid, and maximum intensity projection in the 3D view is computedto highlight high-density regions of the data for volume rendering.
Other tools also focus on exploring the evolution of galaxy haloswithin simulation datasets. Hazarika et al. [HWMB15] presented aseries of visualizations to provide insight into halos, including a 3Dvolume rendering of simulation data and a particle rendering thatidentifies halo sub-structures. Almryde and Forbes [AF15] intro-duced an interactive web application to created animated “traces”of dark matter halos as they move in relation to each other overtime, and Hanula et al. [HPU∗15] presented the Cavern Halosproject that enables the exploration of halos in virtual reality usingthe CAVE2 immersive collaboration space (this project was laterextended and renamed DarkSky Halos [HPAM19]). See also thediscussion of work by Preston et al. [PGX∗16] in Sect. 5.
In order to better investigate the nature of solar wind ion data(SWID), which is typically visualized using 1D and 2D methods,Zhang et al. [ZST11] developed a 3D visualization method forSWID based on the Selenocentric Solar Ecliptic coordinate system,and integrated this method into an interactive tool called vtSWIDs.
Figure 6: TOPCAT: Hybrid scatter plot/density map [Tay17a].Image reproduced from “TOPCAT: Desktop Exploration of Tab-ular Data for Astronomy and Beyond”, written by Mark Taylor,and published in the Informatics journal. Link to article: https://doi.org/10.3390/informatics4030018.
vtSWIDs enables researchers to browse through numerous recordsand provides statistical analysis capabilities.
Breddels et al. [BV18] introduced Vaex, a Python library thathandles large tabular datasets such as the Gaia catalogue. Manypackages in Vaex are developed with specific visualization chal-lenges in mind, and they overcome the scalability issues with meth-ods such as efficient binning of the data, lazy expressions, and just-in-time compilation. For example, vaex-core provides visualizationusing the matplotlib library, with 1D histograms and 2D densityplots; vaex-jupyter embeds the visualization tools in a web browser,which offers more user interactions such as zooming, panning, andon-plot selection. It also enables 3D volume and iso-surface ren-dering using ipyvolume and connecting to a remote server usingWebGL. A standalone interface is provided by the vaex-ui package,which supports interactive visualization and analysis. The vaex-astro package is specifically designed for astronomical data, sup-porting the FITS format and the most common coordinate transfor-mations needed for analysis in astronomical data.
To enhance the study of astronomical particle data, the work byYu et al. [YEII12] was motivated by the need for an enhanced spa-tial selection mechanism using direct-touch input for particle datasuch as numerical simulations of the gravitational processes of starsor galaxies. They introduced two new techniques, TeddySelectionand CloudLasso, to support efficient, interactive spatial selection inlarge particle 3D datasets. Their selection techniques automaticallyidentify bounding selection surfaces surrounding the selected par-ticles based on the density. They applied their techniques to par-ticle datasets from a galaxy collision simulation (http://www.galaxydynamics.org) and an N-body mass simulation from theAquarius Project [SWV∗08], thus reducing the need for complexBoolean operations that are part of traditional multi-step selectionprocesses. In a follow-up work [YEII16], Yu et al. further enhancedtheir 3D selection techniques to aid the exploratory analysis of as-tronomical data. They proposed a collection of context-aware se-lection techniques (CAST) that improve the usability and speed ofspatial selection, and applied their methods to a cosmological N-Body simulation and Millennium-II dataset [SWJ∗05].
The 2019 SciVis contest proposed a visual analysis challengeto explore the structure formation in the cosmic evolution. Thedataset was from a CRK-HACC (HACC: Hardware/Hybrid Ac-celerated Cosmology Code) cosmological simulation containingdark matter plus baryon particles in a cubic box, where the par-ticles contain multiple fields such as position, velocity, and tem-perature. The simulations were used to study the impact that thefeedback from AGN (Active Galactic Nuclei) has on their sur-rounding matter distribution. The entries from the contest (e.g.,[FRG19, HSS∗19, NNPD19, SMG∗19]) represented a diverse col-lection of visualizations, made possible by these new forms of sim-ulation datasets.
5. Feature Identification
Research efforts in this category visually guide the identificationand extraction of features of interest. The term “feature" is broadand can be used in a number of different astrophysical contexts.The detection of features in an astrophysical datastream is of crit-ical importance since many interesting phenomena are diffuse or
© 2021 The Author(s)Computer Graphics Forum © 2021 The Eurographics Association and John Wiley & Sons Ltd.
643

Lan et al. / Visualization in Astrophysics
FeatureIdentifi.
2D/3D plots
2D images
3D rendering
Interactive vis.
Dim. reduction
Uncertaintyvis.
New display
Extragalac. astronomy
Galactic astronomy
Planetary astronomy
Solarastronomy
Simulation Observation
[KHA12] • • • •[RAW∗20] • • • • •[SXL∗14] • • • • •[PGX∗16] • • • • •[PSD17] • • • • •
[BAO∗19] • • • • •[XNW∗16][SUB∗20]
• • • •
[LvdWM17] • • • •[Sou11]
[SPK11]• • • • • •
[SPN∗16] • • • •[TSH21] • • • • •
[RSM∗19] • • •[CKA12] • • • • • •
[CCM∗20] • • • •[AC19] • • • •
[KHW∗19] • • •[NZE∗19] • • •
Table 3: Classifying papers under feature identification based on secondary and tertiary categories. Top row, from left to right: (primarycategory) feature identification; (secondary categories) 2D/3D plots, 2D images, 3D rendering, interactive visualization, dimensionalityreduction, uncertainty visualization, and new display platforms; (tertiary categories) extragalactic, galactic, planetary, and solar astronomy;(tags) simulated, and observational data.
observed with a low signal-to-noise ratio. For example, physicalphenomena may be subtle to detect (or may be detected for the firsttime), and distinguishing between what is signal and what is noiseis critical. Teasing out a tiny signal is so common in astronomythat feature detection is a generically important element of astro-physical progress. Furthermore, astrophysicists are often lookingfor diffuse physical contrasts in multiple dimensions (e.g. spatial,chemical, magnetic, density). For these phenomena, methods thatestablish robust criteria in multiple dimensions for identificationand subsequent analysis are crucial. The majority of these papersfocus on dark matter simulations and the cosmic web, in particularvoids, filaments, and dark matter halos, as summarized in Table 3.The cosmic web refers to the large-scale structure of matter, dis-tributed in filaments, the gravitationally collapsed structures thattend to connect galaxy halos, and voids, the low-density areas ofthe Universe.
Visualizing dark matter simulations and cosmic web. Papers inthis subsection employ various visualization techniques to visualizedark matter simulations and cosmic web, including GPU-assistedrendering with a tailored tessellation mesh [KHA12], tomographicmap [RAW∗20], and interactive visual exploration of cosmic ob-jects [PGX∗16, SXL∗14].
Dark matter generates small-scale density fluctuations and playsa key role in the formation of structures in the Universe. Kaehleret al. [KHA12] visualized N-body particle dark matter simulationdata using GPU-assisted rendering approaches. Their method lever-ages the phase-space information of an ensemble of dark mattertracer particles to build a tetrahedral decomposition of the compu-tational domain that allows a physically accurate estimation of themass density between the particles [KHA12]. During the simula-tion, vertices of a tessellation mesh are defined by the dark matter
particles in an N-body simulation, whereas tetrahedral cells containequal amounts of mass. The connectivity within the mesh is gener-ated once and is kept constant over the simulation as the cells warpand overlap. The density of a given location in the simulation isobtained by considering the density contribution from overlappingcells in the region of interest. Their new approaches are shown to beeffective in revealing the structure of the cosmic web, in particular,voids, filaments, and dark matter halos.
The Lyα forest, which is a series of individual over-densities ofneutral hydrogen within the intergalactic medium (IGM, the spacebetween galaxies), provides a 1D measurement of information inthe IGM, which is largely correlated with the distribution of mat-ter in the Universe. Ravoux et al. [RAW∗20] used a tomographicreconstruction algorithm called the Wiener filtering to create a 3Dtomographic map with the eBoss Strip p82 Lyα forest datasets. Themap is used as a representation of the associated matter fluctuationto identify over- and under-densities in the cosmic web. Extendedover-densities can be detected with the tomographic map by search-ing for the large deficit in the Lyα forest flux contrast. The authorsadopt a simple-spherical algorithm to identify large voids. In orderto further investigate the regions of interest, the paper provides 3Drepresentations of the tomographic map over the entire strip. Userscan interactively explore the map through rotating, panning, andzooming.
Gravity causes dark matter particles to collapse into larger struc-tures over time. The individual groups of particles formed dur-ing this process are called halos, one of the most common ele-ments in the dark matter simulation [PGX∗16]. Their evolutionprocess and behaviors are often the focus of astronomical discov-eries. Two recent tools facilitate the visual exploration of halos.Shan et al. [SXL∗14] built an interactive visual analysis system
© 2021 The Author(s)Computer Graphics Forum © 2021 The Eurographics Association and John Wiley & Sons Ltd.
644

Lan et al. / Visualization in Astrophysics
that focuses on exploring the evolutionary histories of halos. Theinterface allows the user to manually select regions of interest in3D space. It then uses the marching cubes algorithm to performiso-surface extraction and cluster separation based on the region’sdensity distribution. To prevent overlaps in the 3D space, the sys-tem employs multi-dimensional scaling (MDS) to project the halosinto 2D space. Multiple linked views are generated to support theexploration through time. In addition to a merger tree view thatis commonly used to visualize evolution of objects over time, Shanet al. proposed a unique particle trace path graph (see Fig. 7), whichencodes the evolution history of selected particles.
Preston et al. [PGX∗16], on the other hand, aimed to increasethe efficiency and interactions in studying the evolution of halos,described by merger trees. Their integrated visualization systemconsists of a merger tree view, a 3D rendering view, and a quan-titative analysis view. Their merger tree view is an enhancementfrom [SXL∗14] with more interactive capabilities. The system al-lows users to select specific halos through the merger tree and or-ganize the tree based on other physical variables such as velocityand mass. The 3D rendering view displays the particles’ physicalbehaviors over a number of time steps, providing additional con-textual information for the merger tree. A remote parallel rendereris employed to improve the scalability of the rendering process. Fi-nally, the quantitative analysis view extends the other two viewsby providing quantitative information of selected particles that re-veals additional insights into the behavior of the halo. For instance,a chronological plot visualizes the anomalous events automaticallydetected in the history of a halo. An important feature of the sys-tem is that it enables simultaneous exploration of heterogeneouscosmology data; see Sect. 4 for further discussions.
The IllustrisTNG project (https://www.tng-project.org/)contains collections of large, cosmological magnetohydrodynami-cal simulations of galaxy formation. It is designed to “illuminatethe physical processes that drive galaxy formation". The tool pro-vides a number of volume rendering capabilities to visually demon-
Figure 7: An example of a particle trace path. Image reproducedfrom Shan et al. [SXL∗14].
strate the multi-scale, multi-physics nature of the simulations, aswell as to perform qualitative inspections [PSD17].
Moving from clusters of galaxies to the spaces between them, theIGM is composed of gas complexes in the spaces between galax-ies. Although it has research values on its own, investigating IGMalong with quasar sightlines helps put IGM in context. A quasar isa supermassive blackhole at the center of a galaxy that is accretinggas at a high rate and is therefore very bright. It enables scientiststo associate certain absorption features with galactic environment,such as the circumgalactic medium (CGM), which is the gaseousenvelope surrounding a galaxy. IGM-Vis [BAO∗19] is a visualiza-tion software specifically designed to investigate IGM/CGM data.It supports a number of identification, analysis, and presentationtasks with four linked views. The Universe panel provides a 3Dinteractive plot of galaxies in circles and quasar sightlines in cylin-drical “skewers”. The user can select a galaxy of interest to furtherexamine it in the galaxy panel, which contains a list of attributesand corresponding data from SDSS. Additionally, quasar sightlinescan be explored in the spectrum panel where multiple spectral plotscan be displayed and stored. The final equivalent width plot panelfacilitates dynamic correlation analysis and helps users discover ab-sorption patterns in the regions of interest. The four views comple-ment each other to streamline the discovery processes, includingthe identification of foreground and sightline features, the measureof absorption properties, and the detection of absorption patterns.
Blazars – similar to quasars, an active galactic nuclei with rela-tivistic jets ejecting toward the Earth – are one of the most attrac-tive objects for astronomers to observe. The TimeTubes visualiza-tion [XNW∗16] transforms time-varying blazar data and polariza-tion parameters into a series of ellipses arranged along a time line,forming a volumetric tube in 3D space. The most recent iterationof the project, TimeTubesX [SUB∗20], includes feature identifica-tion techniques to detect recurring time variation patterns in blazardatasets. It includes an automatic feature extraction functionality toidentify time intervals that correspond to well-known blazar behav-iors, as well as dynamic visual query-by-example and query-by-sketch functionality. Such a functionality enables users to searchlong-term observations that are similar to a selected time intervalof interest, or match a sketch of temporal pattern. The techniqueaims to enhance the reliability of blazar observations, and to iden-tify flares, rotations, and other recurring blazar patterns in order tovalidate hypotheses about observable, photometric, and polarimet-ric behaviors.
To study the agreements and disparities of feature identifica-tion methods created for classifying the cosmic web, Libeskindet al. [LvdWM17] collected 12 representative methods and appliedthem to the same GADGET-2 dark matter simulation. They clas-sified the dark matter density field of the cosmic web into knots,filaments, walls, and voids. They used comparative visualizationaccompanied with a variety of 2D plots to provide intuitive repre-sentations of the different structures identified by these methods.We introduce one of the topology-based methods with a strong vi-sualization component in the next subsection.
Topology-based feature extraction. There are several examples ofusing topological techniques to extract cosmological features fromsimulations, in particular, galaxy filaments, voids, and halos. Topo-
© 2021 The Author(s)Computer Graphics Forum © 2021 The Eurographics Association and John Wiley & Sons Ltd.
645

Lan et al. / Visualization in Astrophysics
logical methods have also been applied to observational data cubes.We believe that the integration of topological techniques in astro-nomical feature extraction and visualization will be a growing areaof interest (see Sect. 8).
Sousbie [Sou11] presented DisPerSE, a topology-based formal-ism that is designed to analyze the cosmic web and its filamen-tary structure. It leverages discrete Morse theory and computes aMorse-Smale complex (MSC) on a density field. The MSC is thensimplified using the theory of persistent homology by canceling thetopological features with low persistence values (i.e., those that arelikely generated by noise). The relationship between the topologi-cal and geometrical features is easily detectable in the MSC, wherethe ascending 3-manifolds correspond to the voids, ascending 2-manifolds to the walls, and ascending 1-manifolds to the filaments.The technique is scale-free, parameter-free, and robust to noise.Sousbie et al. then demonstrated the effectiveness of DisPerSE attracing cosmological features in 2D and 3D datasets [SPK11].
Following a similar path, Shivashankar et al. [SPN∗16] proposedFelix, another topology-based framework that identifies cosmolog-ical features (see Fig. 8). Felix focuses on extracting the filamen-tary structures and incorporates a visual exploration component. Italso computes a MSC over a density field and simplifies it by it-eratively canceling pairs of simplices, which generates a hierarchyof MSCs. Realizing that it is nearly impossible to find a versionof the MSC within the hierarchy that best separates noise and fea-tures for cosmology datasets, Felix allows users to query for specificdensity ranges across all generated MSCs. This process increasesuser engagement in the parameter selection process and helps pre-serve filament structures within void-like or cluster-like regions.Felix also utilizes 3D volume rendering to interactively guide theselection of parameters for the query and visualizes the extractedfilaments along with the density field. Interactive visual explorationof these intricate features remains a challenging and largely unex-plored problem.
Recently, a new method has been proposed by Tricocheet al. [TSH21] to extract the topology of the Poincaré map inthe circular restricted three-body problem (CR3BP). They createdan interactive visualization of the topological skeleton to supportspacecraft trajectory designers in their search for energy-efficientpaths through the interconnected web of periodic orbits betweencelestial bodies. The new method extends the existing approach bySchlei et al. [SHTG14], and significantly improves the results offixed point extraction and separatrices construction. In order to re-duce the high computational cost, Tricoche et al. pre-screened forimpractical spaceflight structures, and leveraged previous knowl-edge on the accuracy limitations of sensors and engines to imposerestrictions on certain parameters. These adjustments reduce thecomputational workload of the method and enable the interactivevisualization of the topology. The visualization displays the fixedpoints identified by the system and each individual selected orbitas a closed curve. The visualization also enables a manifold arc se-lection mechanism to help the trajectory designer to determine theprecise path a spacecraft would need to follow from any arbitrarylocation.
From an observational perspective, current radio and millime-ter telescopes, particularly ALMA, are producing data cubes with
significantly increased sensitivity, resolution, and spectral band-width. However, these advances often lead to the detection ofstructure with increased spatial and spectral complexity. Rosenet al. [RSM∗19] performed a feasibility study for applying topolog-ical technique – in particular, contour trees – to extract and simplifythe complex signals from noisy ALMA data cubes. They demon-strated the topological de-noising capabilities on a NGC 404 datacube (also known as Mirach’s Ghost) and a CMZ (Central Molec-ular Zone) data cube. Using topological techniques, Rosen et al.sought to improve upon existing analysis and visualization work-flows of ALMA data cubes, in terms of accuracy and speed in fea-ture extraction.
Feature extraction from astronomy data cubes. In addition to thework by Rosen et al. [RSM∗19], other visualizations of integralfield spectrometer (IFS) data cubes have been proposed. Camp-bell et al. [CKA12] presented a 3D interactive visualization toolspecifically designed to render IFS data cubes. A typical displaytool reduces a 3D IFS datacube to 2D images of either the spatialor the wavelength dimension. Campbell et al. proposed to use vol-ume rendering instead to highlight features and characteristics ofastronomical objects that are difficult to detect in lower dimensionprojections. The tool, known as OsrsVol, allows users to easily ma-nipulate the visualized data cube by interactions such as zooming,rotating, and aspect ratio adjustment.
Ciulo et al. [CCM∗20] used OsrsVol to identify four objectsorbiting the supermassive black hole at the center of our galaxySagittarius A*. Two unusual objects have been recently discoveredaround Sagittarius A*, referred to as the G sources, and their pos-sible tidal interactions with the black hole have generated consid-erable attention. Ciulo et al. selected 24 relevant data cubes andprocessed them through the OSIRIS pipelines. They analyzed the
Figure 8: Felix: Extracting filamentary structures (orange) from aVoronoi evolution time-series dataset. Image reproduced from Shiv-ashankar et al. [SPN∗16].
© 2021 The Author(s)Computer Graphics Forum © 2021 The Eurographics Association and John Wiley & Sons Ltd.
646

Lan et al. / Visualization in Astrophysics
data cubes with OsrsVol, as well as several conventional 1D/2Dvisualization tools. OsrsVol helps to disentangle the various dimen-sions of data cubes and allows more flexible explorations amongcrowded regions. Using OsrsVol, Ciulo et al. also characterized thebest-fit orbits of the four new objects, and determined that they ex-hibited many traits in common with the previously discovered Gsources.
Feature identification with deep learning. We end this sectionby giving a couple of examples of using neural network modelsas feature extractors for unsupervised clustering of galaxies. Theseworks demonstrate the potential of using deep learning in featureidentification tasks, for which both astronomers and visualizationexperts are cautiously excited.
Aragon-Calvo was the first to apply a deep convolutional neu-ral network to the task of semantic segmentation of the cosmicweb [AC19]. He proposed a network with a U-net architecture andtrained the model using a state-of-the-art manually guided segmen-tation method. Two types of training datasets were generated us-ing the standard Voronoid model and an N-body simulation. Theirmethod provides exciting results as it efficiently identifies filamentsand walls with high accuracy for well-structured data such as theVoronoid model. For more complex datasets such as the N-bodysimulation, the U-net achieves higher quality segmentation than thestate-of-the-art methods.
Khan et al. [KHW∗19] constructed galaxy catalogs using trans-fer learning. They employed a neural-network-based image clas-sifier Xception, pre-trained on ImageNet data, to classify galaxiesthat overlap both Sloan Digital Sky Survey (SDSS) and Dark En-ergy Survey (DES) surveys, achieving state-of-the-art accuracy of99.6%. Khan et al. then used their neural network classifier to la-bel and characterize over 10,000 unlabelled DES galaxies, whichdo not overlap previous surveys. They further extracted abstractfeatures from one of the last layers of their neural network andclustered them using t-SNE, a dimensionality reduction technique.Their clustering results revealed two distinct galaxy classes amongthe unlabelled DES images based on their morphology. The anal-ysis of Khan et al. provides a path forward in creating large-scaleDES galaxy catalog by using these newly labelled DES galaxies asdata for recursive training.
Galaxy clusters are gravitationally bound systems that containhundreds or thousands of galaxies in dark matter halos [NZE∗19],with typical masses ranging from 1014 to 1015 solar masses. Ntam-paka et al. applied deep learning to estimate galaxy cluster massesfrom Chandra mock – simulated, low-resolution, single-color X-ray images [NZE∗19]. They used a relatively simple convolutionalneural network (CNN) with only three convolutional and poolinglayers followed by three fully connected layers. Despite the simpleframework, the resulting estimates exhibit only small biases com-pared to the true masses. The main innovation of the paper is thevisual interpretation of the CNN, using an approach inspired byGoogle’s DeepDream, which uses gradient ascent to produce im-ages that maximally activate a given neuron in a network. Ntam-paka et al. used gradient ascent to discover which changes in theinput cause the model to predict increased masses. They found thatthe trained model is more sensitive to photons in the outskirts of theclusters, and not in the inner regions; and their observations aligned
with other statistical analyses performed on galaxy clusters. Theirwork illustrates the utility of interpreting machine learning “blackboxes” with visualization since it provides physical reasoning topredicted features.
6. Object Reconstruction
Research works in this category provide informative visual repre-sentation of astronomical objects; see Table 4 for their fine-grainedclassifications under secondary and tertiary categories, where thereis a strong focus on observational data. Object reconstruction uti-lizes and is also constrained by imagery and other observationaldata obtainable via our vantage point – the Earth and the solar sys-tem. The works surveyed here cover 3D object reconstructions us-ing 2D images [SKW∗11, WAG∗12, WLM13, HA20], distances ofyoung stellar objects [GAM∗18], spectroscopic data [VD11], andextrapolation from sparse datasets such as SDSS [EBPF21], wherevisualization helps produce plausible reconstructions that providestructural insights for analysis and modeling. Important challengesinclude scalable computation, trade-off between automatic recon-struction and expert knowledge, and in particular, physically accu-rate structural inference with limited observations.
As mentioned previously, we recognize that “objects” are, infact, “features” with sharp and/or discontinuous contrast in a di-mension of scientific interest. Whether a specific aspect of a datasetis considered an “object” or a “feature” depends on the scien-tific question posed. We separate object reconstruction from featureidentification to be compatible with the literature, but we envisiona future where these entities are recognized as a continuum. An ex-ample of such a continuum is Polyphorm [EBPF21], where the fil-ament reconstruction and interactive visualization are intertwinedvia a fitting session, where structural or visual parameters are ad-justed interactively to produce satisfactory reconstruction results.
Object reconstruction employs both images and other observa-tional data, and thus is closely related to image reconstruction inastronomy. As discussed in Sect. 1, we do not consider state-of-the-art image reconstruction methods in astronomy based on optimiza-tions or signal processing techniques, but rather, we will focus onreconstruction with modern visualization techniques, such as 3Dobject reconstruction, 3D rendering, and interactive visualization.There is existing literature on the “historic account” of astronomi-cal image reconstruction [Dai85,PGY05], recent surveys about thisfield [TA16], and machine learning approaches [Fla17].
3D object reconstruction from 2D images. Steffenet al. [SKW∗11] presented Shape, one of the first publiclyavailable tools using interactive graphics to model astronomicalobjects. Shape allows astrophysicists to interactively define 3Dstructural elements using their prior knowledge about the object,such as spatial emissivity and velocity field. Shape provides aunified modeling and visualization flow, where physical knowledgefrom the user is used to construct and iteratively refine the model,and model parameters are automatically optimized to minimizethe difference between the model and the observational data. Theinteractive feedback loop helps introduce expert knowledge intothe object reconstruction pipeline and has proven to be incrediblyuseful for many applications, such as rendering hydrodynamical
© 2021 The Author(s)Computer Graphics Forum © 2021 The Eurographics Association and John Wiley & Sons Ltd.
647

Lan et al. / Visualization in Astrophysics
Objectreconstruct.
2D/3D plots
2D images
3D rendering
Interactive vis.
Dim. reduction
Uncertaintyvis.
New display
Extragalac. astronomy
Galactic astronomy
Planetary astronomy
Solarastronomy
Simulation Observation
[SKW∗11] • • • • • • •[WAG∗12][WLM13]
• • • • •
[HA20] • • • •[GAM∗18] • • • •[SSM∗19] • • •
[VD11] • • • •[EBPF21] • • • • •[BPM∗15] • • • • • • •[OWN∗20] • • • • •
Table 4: Classifying papers under object reconstruction based on secondary and tertiary categories. Top row, from left to right: (primarycategory) Object reconstruction; (secondary categories) 2D/3D plots, 2D images, 3D rendering, interactive visualization, dimensionalityreduction, uncertainty visualization, and new display platforms; (tertiary categories) extragalactic, galactic, planetary, and solar astronomy;(tags) simulated, and observational data.
simulations, reconstructing Saturn Nebula, modeling the structureand expansion of nova RS Ophiuchi [SKW∗11]. Shape also comeswith educational potential in digital planetariums.
Wenger et al. [WAG∗12] developed an automatic 3D visualiza-tion of astronomical nebulae from a single image using a tomo-graphic approach. Their 3D reconstruction exploits the fact thatmany astronomical nebulae, interstellar clouds of gas and dust, ex-hibit approximate spherical or axial symmetry [MKDH04]. Thissymmetry allows for object reconstruction by replicating multiplevirtual viewpoints based on the view from Earth. This assemblageof different views results in a tomographic reconstruction problem,which can be solved with an iterative compressed sensing algo-rithm. The reconstruction algorithm relies on a constrained opti-mization and computes a volumetric model of the nebula for in-teractive volume rendering. Wenger et al. demonstrated that theirmethod preserves a much higher amount of detail and visual varietythan previous approaches. However, they also noted that the qualityof their reconstruction is limited by the fact that “the algorithm hasno knowledge about the physical processes underlying the objectsbeing reconstructed”, and suggested restricting the search space tosolutions compatible with a physical model [WAG∗12].
In a follow-up work, Wenger et al. [WLM13] presented an al-gorithm based on group sparsity that dramatically improves thecomputational performance of the previous approach [WAG∗12](see Fig. 9). Their method computes a single projection instead ofmultiple projections and thus reduces memory consumption andcomputation time. It is again inspired by compressed sensing: an`∞ group sparsity regularizer is used to suppress noise, and an `2data term is used to ensure that the output is consistent with the ob-servational data [WLM13]. This method enables astronomers andend users in planetariums or educational facilities to reconstructstellar objects without the need for specialized hardware.
Hasenberger et al. [HA20] added to the hallowed pantheon of au-tomatic object reconstruction algorithms with AVIATOR: a Viennainverse-Abel-transform-based object reconstruction algorithm. Ex-isting reconstruction techniques (e.g., [WAG∗12,WLM13]) containpotentially problematic requirements such as symmetry in the planeof projection. AVIATOR’s reconstruction algorithm assumes that,
for the object of interest, its morphology “along the line of sightis similar to its morphology in the plane of the projection and thatit is mirror symmetric with respect to this plane” [HA20]. Hasen-berger et al. applied AVIATOR to dense molecular cloud cores andfound that their models agreed well with profiles reported in theliterature.
3D object reconstruction using stellar object distances. TheGaia data release 2 (Gaia DR2) contains a wealth of informationabout the night sky. Großschedl et al. [GAM∗18] used the distancesof 700 stellar objects from this dataset to infer a model of Orion Athat describes its 3D shape and orientation. This 3D model leads tomany insights, among them that the nebulae is longer than previ-ously thought and that it has a cometary shape pointing toward theGalactic plane, where the majority of the Milky Way’s disk masslies. The authors pointed out that Gaia is bringing the critical third
Figure 9: A fast reconstruction algorithm that creates 3D modelsof nebulae based on their approximate axial symmetry. Image re-produced from Wenger et al. [WLM13].
© 2021 The Author(s)Computer Graphics Forum © 2021 The Eurographics Association and John Wiley & Sons Ltd.
648

Lan et al. / Visualization in Astrophysics
spatial dimension to infer cloud structures and to study start-forminterstellar medium.
In a similar manner, Skowron et al. [SSM∗19] constructed a 3Dmap of the Milky Way galaxy, using the positions and distancesof thousands of classical Cepheid variable stars, which in turn areobtained through observations and accounting of the stars’ pulsat-ing periods coupled with luminosity. Cepheid variable are regularlypulsating stars, where their regular pulsations allow us to calculatetheir distances precisely. Skowron et al. used 2341 such stars tosketch the Milky Way galaxy and observe the warped shape of thegalactic disk, and they were able to define the characteristics of thiswarping with some precision. They visualized and performed addi-tional analysis on this 3D map using a combination of static 2D/3Dplots.
3D object reconstruction using spectroscopic data. Vogtet al. [VD11] aimed to characterize the 3D shape of a youngoxygen-rich supernova remnant (N132D) in the Large MagellenicCloud, a satellite dwarf galaxy of the Milky Way. Using spectro-scopic data from the Wide Field Spectrograph along with sophisti-cated data reduction techniques, they produced a data cube, whichthey used to construct a 3D map of the oxygen-rich ejecta of thesupernova remnant of interest. They provided several different 2Dand 3D plots showing unique views of this 3D map. Their visualanalysis has led to insights about the structure of this supernovaremnant beyond what was previously known.
Dark matter filament reconstruction. Polyphorm [EBPF21] isan interactive visualization and filament reconstruction tool thatenables the investigation of cosmological datasets (see Fig. 10).Through a fast computational simulation method inspired by theforaging behavior of Physarum polycephalum, astrophysicists areable to extrapolate from sparse datasets, such as galaxy mapsarchived in the SDSS, and then use these extrapolations to informanalyses of a wide range of other data, such as spectroscopic obser-vations captured by the Hubble Space Telescope. Researchers canupdate the simulation at interactive rates by a wide range of adjust-ing model parameters. Polyphorm has been used to reconstruct thecosmic web from galaxy observations [BET∗20] and to infer theionized intergalactic medium contribution to the dispersion mea-sure of a fast radio burst [SBP∗20].
Visual verification of simulations. Currently, predictions of theSun’s Coronal mass ejections (CMEs) rely on simulations gener-ated from observed satellite data. CMEs are powerful eruptionsfrom the surface of the sun. These simulations possess inherit un-certainty because that the input parameters are entered manually,and the observed satellite data may contain measurement inaccu-racies. These simulations treat CMEs as singular objects with dis-crete boundaries that are well defined and thus enable their treat-ment as entire objects. In order to mitigate this uncertainty, Bocket al. [BPM∗15] proposed a multi-view visualization system thatgenerates an ensemble of simulations by perturbing the CME inputparameters, and enables comparisons between these simulationsand ground truth measurements. The system has many capabilitiesuseful to domain experts, including integration of 3D rendering ofsimulations with satellite imagery, comparison of simulation pre-dictions with observed data, and time-dependent analysis.
3D visualization of planetary surfaces. Ortner et al. [OWN∗20]performed 3D reconstruction visualization for planetary geology.Their geological analysis of 3D Digital Outcrop Models is usedto reconstruct ancient habitable environments, which serves as animportant aspect of the upcoming ESA ExoMars 2022 RosalindFranklin Rover and the NASA 2020 Rover Perseverance missionson Mars. They conducted a design study to create InCorr (Inter-active data-driven Correlations), which includes a 3D geologicallogging tool and an interactive data-driven correlation panel thatevolves with the stratigraphic analysis. See [Ger14, Section 2.2.2]for more references on Mars geology and geodesy data and tools.Bladin et al. [BAB∗18] integrated multiple data sources and pro-cessing and visualization methods to interactively contextualizegeospatial surface data of celestial bodies for use in science com-munication.
7. Education and Outreach
Currently, an on-going paradigm shift is occurring in scientific out-reach. Technological advances are enabling data-driven and inter-active exploration to be possible in public environments such asmuseums and science centers, increasing their availability to thegeneral public. These advances are shortening the distance betweenresearch and outreach material, and enriching the scientific explo-ration process with new perspectives. Ynnerman et al. [YLT18] andGoodman et al. [GHWY19] introduced the Exploranation concept,a euphemism encapsulating this confluence of explanation and ex-ploration.
Scientific storytelling of astrophysical findings using visualiza-tion has a deep history. Ma et al. [MLF∗12] described how vi-sualization can aid scientific storytelling using the NASA Scien-tific Visualization Studio. Borkiewicz et al. described storytellingbased on data-driven cinematic visualization in a SIGGRAPH
Figure 10: Polyphorm: reconstruction of dark matter filaments inthe simulated BolshoiPlanck dataset where Polyphorm yields a con-sistent 3D structure, enabling its calibration to cosmic over densityvalues. Thin slices of the filament map are shown on the right. Im-age reproduced from Elek et al. [EBPF21].
© 2021 The Author(s)Computer Graphics Forum © 2021 The Eurographics Association and John Wiley & Sons Ltd.
649

Lan et al. / Visualization in Astrophysics
Education & outreach
2D/3D plots
2D images
3D rendering
Interactive vis.
Dim. reduction
Uncertaintyvis.
New display
Extragalac. astronomy
Galactic astronomy
Planetary astronomy
Solarastronomy
Simulation Observation
[BHY18] • • • • • •[FSW∗19] • • • • • • • •[RFG∗18] • • • • • • • • • •[USTY18] • • • • •[OPB∗19] • • • • • • •[AJP∗18] • • • • •[VS13] • • • •
[Mad17] • • • • •[DF17] • • • •
[DHG∗18] • • • • •
Table 5: Classifying papers under education and outreach based on secondary and tertiary categories. Top row, from left to right: (primarycategory) Education and outreach; (secondary categories) 2D/3D plots, 2D images, 3D rendering, interactive visualization, dimensionalityreduction, uncertainty visualization, and new display platforms; (tertiary categories) extragalactic, galactic, planetary, and solar astronomy;(tags) simulated, and observational data.
course [BCK∗19]. More recently, and with a greater focus on in-teractive methods where the user becomes part of the exploration,Bock et al. [BHY18] described the challenge of presenting the de-tails of NASA space missions to the public.
Research efforts in this category (as summarized in Table 5) arerelated w.r.t. important aspects of education outreach and/or pub-lic accessibility. In addition, several are concerned with large-scaleimmersive visualization in planetariums and also with personal vir-tual reality (VR) and augmented reality (AR) experiences. Absentfrom the current literature, to the best of our knowledge, is a com-prehensive analysis of the effect of VR for scientific exploration inastronomy.
Planetarium and other large-scale immersive environments.Immersive visualization in planetarium dome theaters (see Fig. 11)has been the primary outreach mechanism for astronomy fromtheir initial conception. The immersive nature of the display sys-tem plays an important role in the contextualization of the avail-able data, which is one of the unique challenges of astronomicaldatasets. The birth of the usage of interactive visualization softwarein planetarium can be traced to the Uniview software [KHE∗10],which pioneered many of the interaction paradigms that are stillin use today. To a large extent, these live presentations based oninteractive visualization are enabled by software provided by theplanetarium vendors, which are, in general, commercial solutionsand thus fall outside the scope of this survey. Our focus here is in-stead on the large number of open-source initiatives, which are eas-ily accessible to the academic community, targeting planetariumsand other large-scale immersive environments. Although aimed atthe use in immersive environments, these initiatives also constitutea bridge between outreach and research-driven data exploration, asdescribed by Faherty et al. [FSW∗19], which is increasingly gain-ing momentum.
Among the most widely used software packages tailored to as-trophysical data in immersive environments is WorldWide Tele-scope [RFG∗18], which is a virtual observatory for the public toshare and view data from major observatories and telescopes. Thesoftware provides the capability to visualize the solar system andstars, and show observational material in context; however it fo-
cuses on the data as displayed from the Earth’s viewpoint. Celes-tia is an open-source initiative that shows the objects of the solarsystem and the greater universe in a 3D environment. It provideshigh-resolution imagery and accurate positioning of the planetarybodies of the solar system and the ability to show other datasets intheir context outside the solar system. OpenSpace, Gaia Sky, andESASky, as described in Sect. 4, also provide contextualization ofastronomical data, but with a stronger emphasis on the ability fordomain experts to import their data into an immersive environmentfor public presentations. The Stellarium software can be used by thegeneral public to look at a virtual nights sky from the surface of anyplanet. The data contained in the software include a star catalog,known deep space objects, satellite positions, and other datasetsthat can be added dynamically by the user. NASA Eyes is a suiteof web-based visualization tools that enable the user to learn aboutthe Earth, Solar System, Exoplanets, and ongoing NASA missions.While providing a rich experience for the end user, the avenuesfor extension are limited. The Mitaka software [USTY18] enablesusers to explore the observable universe and makes it easy for themto create custom presentations that can be shown on a large varietyof immersive display environments.
Personal virtual and augmented reality. In stark contrast to theimmersive display environments described thus far, a large amount
Figure 11: An example of an interaction presentation in a large-scale immersive environment to the general public, in this case oftopographical features on the surface of Mars present at the Bril-liant Minds conference.
© 2021 The Author(s)Computer Graphics Forum © 2021 The Eurographics Association and John Wiley & Sons Ltd.
650

Lan et al. / Visualization in Astrophysics
of work has been presented in the realm of virtual reality (VR) andaugmented reality (AR). VR in this context refers to a personalexperience, rather than one that is shared with other participants.These two fields overlap in some areas, but they present distinctresearch challenges.
With 3DMAP-VR, Orlando et al. [OPB∗19] sought to unite theexcessively data-rich world of astronomy with VR with the hopesof facilitating productive engagement with traditionally inaccessi-ble data. Specifically, they visualized 3D magnetohydrodynamic(MHD) models of astronomical simulations, which include the ef-fects of gravity and hydrodynamics as well as magnetic fields.Their workflow consisted of two steps: obtaining accurate simu-lations and then converting these simulations to navigable 3D VRenvironments using available data analysis and visualization soft-ware. In additional to providing a method to explore these densedata cubes in VR, they allowed these VR environments to be ex-plored by anyone with a VR rig by uploading them to Sketchfab,a popular open platform for sharing VR content. Orlando et al. ex-celled at meeting two emerging goals in astronomical visualization:first, using existing software to achieve their goals rather than creat-ing something from scratch; and second, making the visualizationswidely accessible.
Arcand et al. [AJP∗18] developed a 3D VR and AR pro-gram to visualize the Cassiopeia A (i.e., Cas A) supernova rem-nant, the resulting structure from an exploded star. They aimed tomake the best use of the high-resolution, multi-wavelength, multi-dimensional astronomical data and give users the experience ofwalking inside the remains of a stellar explosion. They first per-formed 3D reconstruction of Cas A and then employed volume andsurface rendering to display the model in the VR system YURT (i.e.,Yurt Ultimate Reality Theatre). The user can select a specific partof the supernova model and access the annotations. These interac-tive features not only help non-experts engage in the story of thestar, but also assist researchers observe changes in its properties.
Vogt et al. [VS13] explored the potential of AR in astrophysicsresearch/education by introducing Augmented Posters and Aug-mented Articles. The authors included Augmented Posters at theAstronomical Society of Australia Annual General meeting in2012. Incorporating AR into posters allowed attendees to use theirsmartphones to engage with the posters in a virtual space and eas-ily save and share the poster information if they found it interest-ing. Through tracking of engagement and feedback, they discov-ered that the majority of conference attendees found the technologyto “have some potential.” As mentioned, the authors also experi-mented with Augmented Articles. They showed how results froman earlier work (the 3D structure of super nova remnants) can beviewed in 3D interactively within the article using a smartphone.Vogt et al. concluded by speculating on the future of AR in astro-physics. They were optimistic about the potential for AR to be aneffective supplementary technology, but cited long-term stabilityand backwards compatibility in terms of AR apps and technologyas a major limitation to AR moving forward. They suggested that adedicated service for AR used in scientific publishing and outreachmay be an effective way to handle this limitation.
Novel interfaces. Madura [Mad17] presented a case study using3D printing to visualize the η Car Homunculus nebula, see Fig. 12.
Extending the traditional monochromatic 3D prints, Madura pro-posed to use full-color sandstone prints to generate more infor-mative models. Although the sandstone material is not as sturdy,these printers produce noticeably higher quality prints that preservesmaller details. The colors of the prints can be based on physicalproperties, which provides additional information to visual learnersand helps distinguish different structures. The 3D models not onlyfacilitate research discoveries, but also help communicate scientificdiscoveries to non-astronomers, especially to the visually impaired.The New Mexico Museum of Space History and the New MexicoSchool jointly hosted the first week-long astronomy camp for thevisually impaired students across states in the summer of 2015. Thecamp received overwhelmingly positive feedback. Madura also dis-cussed the use of other methods, including audio, tactile sign lan-guage, and tactile fingerspelling, to further expand the 3D model in-teractive experience for tactile learners. Overall, 3D printing couldbe a useful and effective tool for astronomy outreach and education.
Figure 12: Dual-color 3D print of the η Car Homunculus nebula.Image reproduced from Madura [Mad17].
In a work as artistic as it is scientific, Diemer et al. [DF17]modeled the cosmic web through dark matter simulations and rep-resented it artistically through 3D sculptures and woven textiles.The dark matter simulation is run using the publicly available codeGADGET2 and the halos and subhalos (i.e., the halos within ha-los), are identified using ROCKSTAR. To identify the structural el-ements of the cosmic web (walls and filaments), they used DIS-PERSE, which is publicly available code that leverages discreteMorse theory to identify salient topological features (see Sect. 5).Converting from the simulation data to their artistic representation,Diemer et al. stated that “we believe that art, as much as science,seeks to say something true about the nature of existence, and thatend is best served by artistic representation that grapples with realdata and not only with allegorical concepts.” They accomplishedthis stated ideal through a structured simplification of the model toa form where it can be represented using 3D woven textiles. Thetechniques used in their paper are not novel, but the combinationof them is, and the end result is a powerful installation that instillswonder in those who move through it. This work is able to take sci-entifically rigorous simulation data and represent it in an accessibleform without losing the deep beauty of the underlying science.
This elegant translation of numbers to forms, of thoughts to feel-
© 2021 The Author(s)Computer Graphics Forum © 2021 The Eurographics Association and John Wiley & Sons Ltd.
651

Lan et al. / Visualization in Astrophysics
ings, lies at the heart of science communication and outreach. Theimportance of this translation is especially crucial for astronomy,where the physical embodiment of the things we are studying canreally only ever live in our minds and as the modern equivalent ofpaint on the walls of our caves.
Virtual observatories. Virtual observatories (VOs) are web-basedrepositories of astronomical data from multiple sources with thegoal of improving access to astronomical data for scientists not di-rectly involved in data collection. Many advanced VO applicationsaid in the mining and exploration of observational data through theuse of state-of-the-art visualization techniques, but comparativelyfew that perform similar functions for theoretical data. In the inter-active 3D visualization for theoretical VOs, Dykes et al. [DHG∗18]examined the current capabilities of VOs containing theoreticaldata, and additionally presented a tool based on SPLOTCH, whichis designed to aid in addressing some of the shortcomings theyidentified with current methods. SPLOTCH is a visualization tooldesigned for high-performance computing environments that is ca-pable of quickly rendering large particle datasets, which makes itideal for interactive visualization of 3D particle data. Dykes et al.combined their tool with a VO and demonstrated the effectivenessof interactively filtering and quantitatively visualizing the data foridentifying features of interest in large particle simulations. Futuresteps involve comparative visualization, which would consist ofmethods to generate mock 2D observational images from the 3Dsimulation data to compare with actual observations.
Broad dissemination through mobile applications. Furthermore,recent progress has been made on mobile and commercial appli-cations that provide visualizations of astronomical data. Althoughthese applications are not focused on research questions, they serveto broadly disseminate astrophysics visualizations, many of whichalso have strong educational value for the general public.
For instance, SkySafari (https://skysafariastronomy.com/), StarMap (http://www.star-map.fr/), NightSky(https://icandiapps.com/), or SkyView (on Apple App Store)bring stargazing to everyone’s mobile phones, offer AR featuresthat guide the layperson towards interested targets, and can alsobe used to control amateur telescopes and aid in astrophotography.Many JavaScript libraries and tools are available for astronomicalvisualization, such as Asterank (https://www.asterank.com/),based on spacekit.js (https://typpo.github.io/spacekit/),which enables the user to visually explore a database containingover 600,000 asteroids, including estimated costs and rewards ofmining asteroids.
Web applications that introduce scientific knowledge of astron-omy are also easily accessible. For example, NASA JPL’s Eyes onthe Solar System (https://eyes.nasa.gov/) has the ability toshow the dynamics of our solar system, but can also be used toshow the evolution of space missions, and the discovery of exo-planets. Another example is an adaptation of the Uniview softwareto be used in schools on mobile platforms targeting grades 4-6 inthe NTA Digital project.
There are also a number of popular applications for VR head-sets, such as Star Chart (http://www.escapistgames.com/)and Our Solar System on Oculus, which provide immersive
experiences for users seeking knowledge about the Universe.Merge Cube (https://mergeedu.com/cube) accompanied withAR/VR apps such as MERGE Explorer has been used to enable anew way of interactive learning for astronomy and beyond. It al-lows users to hold digital 3D objects and explore stars and galaxiesin their palms.
8. Challenges and Opportunities
In addition to a taxonomy of existing approaches that utilize vi-sualization to study astronomical data from Sect. 3 to Sect. 7, ourcontribution includes a summary of the current challenges and op-portunities in visualization for astronomy. We ask the followingquestions: What are the missing tools in current visualization re-search that astronomers need to formulate and test hypotheses us-ing modern data? What visualization capabilities are expected tobecome available for astronomical data over the next decade?
In a Carnegie + SCI mini-workshop conducted in April 2020and a Visualization in Astrophysics workshop during IEEE VIS inOctober 2020, astrophysicists and visualization experts discussedrecent advances in visualization for astrophysics, as well as the cur-rent visualization needs in the astronomical community. As a resultof these workshops, we have identified the following list of chal-lenges and opportunities:
• Open-source tools: we need more open-source data visualizationsoftware that is suitable for astronomical data. These tools mustbe flexible, modular, and integrable within a broader ecosystemof workhorse tools;
• Intelligent data querying: we need to enable intelligent dataqueries for large data;
• Discovery: we need ways to turn high-quality renderings of data(observed and simulated) into quantitative information for dis-covery;
• Scalable feature extraction: we need to extract and visualize fea-tures from large and physically complex data cubes;
• In situ analysis and visualization: we need to interact with sim-ulation data in real time, by utilizing visualization for parametertuning and simulation steering;
• Uncertainty visualization: we need to develop more techniquesto mitigate and communicate the effects of data uncertainty onvisualization and astronomy;
• Benchmarks: we need to develop clear, widely adopted bench-marks or mock data catalogs for comparison with observed data;
• Time and space efficiency: we need to improve upon memoryand/or space intensive data analysis tasks.
8.1. Challenges Identified from Previous Surveys
We first review the challenges identified from previous surveys[HF11, LLC∗12] and describe how the community has respondedto these challenges in the past decade.
Hassan et al. [HF11] identified six grand challenges in their 2011survey for the peta-scale astronomy era:
• Support quantitative visualization;• Effectively handle large data sizes;• Promote discoveries in low signal-to-noise data;
© 2021 The Author(s)Computer Graphics Forum © 2021 The Eurographics Association and John Wiley & Sons Ltd.
652
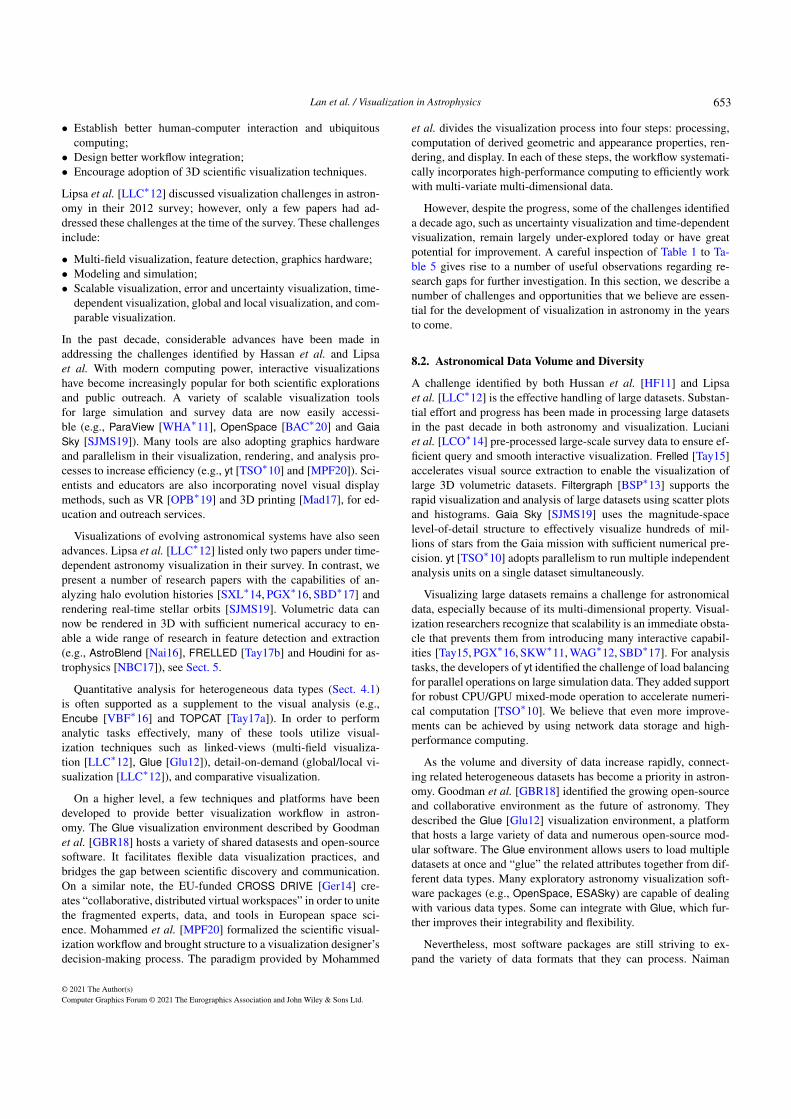
Lan et al. / Visualization in Astrophysics
• Establish better human-computer interaction and ubiquitouscomputing;
• Design better workflow integration;• Encourage adoption of 3D scientific visualization techniques.
Lipsa et al. [LLC∗12] discussed visualization challenges in astron-omy in their 2012 survey; however, only a few papers had ad-dressed these challenges at the time of the survey. These challengesinclude:
• Multi-field visualization, feature detection, graphics hardware;• Modeling and simulation;• Scalable visualization, error and uncertainty visualization, time-
dependent visualization, global and local visualization, and com-parable visualization.
In the past decade, considerable advances have been made inaddressing the challenges identified by Hassan et al. and Lipsaet al. With modern computing power, interactive visualizationshave become increasingly popular for both scientific explorationsand public outreach. A variety of scalable visualization toolsfor large simulation and survey data are now easily accessi-ble (e.g., ParaView [WHA∗11], OpenSpace [BAC∗20] and GaiaSky [SJMS19]). Many tools are also adopting graphics hardwareand parallelism in their visualization, rendering, and analysis pro-cesses to increase efficiency (e.g., yt [TSO∗10] and [MPF20]). Sci-entists and educators are also incorporating novel visual displaymethods, such as VR [OPB∗19] and 3D printing [Mad17], for ed-ucation and outreach services.
Visualizations of evolving astronomical systems have also seenadvances. Lipsa et al. [LLC∗12] listed only two papers under time-dependent astronomy visualization in their survey. In contrast, wepresent a number of research papers with the capabilities of an-alyzing halo evolution histories [SXL∗14, PGX∗16, SBD∗17] andrendering real-time stellar orbits [SJMS19]. Volumetric data cannow be rendered in 3D with sufficient numerical accuracy to en-able a wide range of research in feature detection and extraction(e.g., AstroBlend [Nai16], FRELLED [Tay17b] and Houdini for as-trophysics [NBC17]), see Sect. 5.
Quantitative analysis for heterogeneous data types (Sect. 4.1)is often supported as a supplement to the visual analysis (e.g.,Encube [VBF∗16] and TOPCAT [Tay17a]). In order to performanalytic tasks effectively, many of these tools utilize visual-ization techniques such as linked-views (multi-field visualiza-tion [LLC∗12], Glue [Glu12]), detail-on-demand (global/local vi-sualization [LLC∗12]), and comparative visualization.
On a higher level, a few techniques and platforms have beendeveloped to provide better visualization workflow in astron-omy. The Glue visualization environment described by Goodmanet al. [GBR18] hosts a variety of shared datasests and open-sourcesoftware. It facilitates flexible data visualization practices, andbridges the gap between scientific discovery and communication.On a similar note, the EU-funded CROSS DRIVE [Ger14] cre-ates “collaborative, distributed virtual workspaces” in order to unitethe fragmented experts, data, and tools in European space sci-ence. Mohammed et al. [MPF20] formalized the scientific visual-ization workflow and brought structure to a visualization designer’sdecision-making process. The paradigm provided by Mohammed
et al. divides the visualization process into four steps: processing,computation of derived geometric and appearance properties, ren-dering, and display. In each of these steps, the workflow systemati-cally incorporates high-performance computing to efficiently workwith multi-variate multi-dimensional data.
However, despite the progress, some of the challenges identifieda decade ago, such as uncertainty visualization and time-dependentvisualization, remain largely under-explored today or have greatpotential for improvement. A careful inspection of Table 1 to Ta-ble 5 gives rise to a number of useful observations regarding re-search gaps for further investigation. In this section, we describe anumber of challenges and opportunities that we believe are essen-tial for the development of visualization in astronomy in the yearsto come.
8.2. Astronomical Data Volume and Diversity
A challenge identified by both Hussan et al. [HF11] and Lipsaet al. [LLC∗12] is the effective handling of large datasets. Substan-tial effort and progress has been made in processing large datasetsin the past decade in both astronomy and visualization. Lucianiet al. [LCO∗14] pre-processed large-scale survey data to ensure ef-ficient query and smooth interactive visualization. Frelled [Tay15]accelerates visual source extraction to enable the visualization oflarge 3D volumetric datasets. Filtergraph [BSP∗13] supports therapid visualization and analysis of large datasets using scatter plotsand histograms. Gaia Sky [SJMS19] uses the magnitude-spacelevel-of-detail structure to effectively visualize hundreds of mil-lions of stars from the Gaia mission with sufficient numerical pre-cision. yt [TSO∗10] adopts parallelism to run multiple independentanalysis units on a single dataset simultaneously.
Visualizing large datasets remains a challenge for astronomicaldata, especially because of its multi-dimensional property. Visual-ization researchers recognize that scalability is an immediate obsta-cle that prevents them from introducing many interactive capabil-ities [Tay15, PGX∗16, SKW∗11, WAG∗12, SBD∗17]. For analysistasks, the developers of yt identified the challenge of load balancingfor parallel operations on large simulation data. They added supportfor robust CPU/GPU mixed-mode operation to accelerate numeri-cal computation [TSO∗10]. We believe that even more improve-ments can be achieved by using network data storage and high-performance computing.
As the volume and diversity of data increase rapidly, connect-ing related heterogeneous datasets has become a priority in astron-omy. Goodman et al. [GBR18] identified the growing open-sourceand collaborative environment as the future of astronomy. Theydescribed the Glue [Glu12] visualization environment, a platformthat hosts a large variety of data and numerous open-source mod-ular software. The Glue environment allows users to load multipledatasets at once and “glue” the related attributes together from dif-ferent data types. Many exploratory astronomy visualization soft-ware packages (e.g., OpenSpace, ESASky) are capable of dealingwith various data types. Some can integrate with Glue, which fur-ther improves their integrability and flexibility.
Nevertheless, most software packages are still striving to ex-pand the variety of data formats that they can process. Naiman
© 2021 The Author(s)Computer Graphics Forum © 2021 The Eurographics Association and John Wiley & Sons Ltd.
653

Lan et al. / Visualization in Astrophysics
et al. [NBC17] aimed to use Houdini to render data with non-uniform voxel sizes. Baines et al. [BGR∗16] retrieved spectro-scopic data and aimed to link it to more of the mission catalogsfor the next release of ESASky. Burchett et al. [BAO∗19] incor-porated data pre-processing as part of the IGM-Vis application toallow more data formats as inputs. Vogt et al. [VSDR17] provideda unique perspective for simplifying the access to 3D data visu-alization by promoting the X3D pathway, as the X3D file formatlies in the center of various visualization solutions, such as inter-active HTML, 3D printing and high-end animations. However, theconversion into X3D file format remains the largest obstacle.
8.3. Interactive Visualization and Intelligent Querying
Hassan et al. identified “better human-computer-interaction” as oneof the six grand challenges [HF11], and visualization experts andastronomers have joined forces to explore the potential of using in-teractive visualization in astronomy research and public outreach.We see the overwhelming popularity of interactive visualization inthe realm of astronomy research. Barnes and Fluke [BF08] demon-strated the convenience of embedding interactive visualizations inastronomy publications, via 3D PDF and its extension S2PLOTprogramming library. Frelled and AstroBlend leverage the 3D ca-pability of Blender to improve the process of analyzing and visu-alizing volumetric data [Tay17b, Nai16]. Naiman et al. [NBC17]explored the potential use of the graphics tool Houdini in as-tronomy research. ESASky, LSSGalpy, SDvision, OpenSpace, andGaia Sky [BGR∗16,AFPR∗17,PCHT17,BAC∗20,SJMS19] all pro-vide visual exploratory capabilities to large-scale astronomy surveydata, each with their own scientific focuses and distinguishing fea-tures.
Many of these interactive software tools are expanding their im-pact in public outreach. A video produced with the visualizationsfrom SDvision – titled “Laniakea: Our home supercluster” – gainedmillions of views on YouTube [PCHT17]. The authors are also pur-suing the software’s integration with VR technology to further con-tribute to education and public outreach services. OpenSpace hasalready demonstrated its success in museums, planetariums, anda growing library of publicly accessible video material. The soft-ware is built to be easily accessible to the general public via a sim-ple installation onto any computer. AR, VR, and 3D printing areemerging technologies that are used at a greater scale in educa-tional and public outreach services [AJW∗19, Mad17]. In order toreach a more artistic audience, Diemer et al. [DF17] have also ex-plored integrating art and the physical visualization of astronomicalobjects.
However, many researchers also recognize the limitations ofcurrent interactive visualizations and intelligent querying of vol-umetric data. Barnes and Fluke [BF08] proposed the capturing ofmouse clicks on individual elements of a scene to enable 3D selec-tion and queries. Goodman advocated for the need of 3D selectionin astronomy visualization and analysis [Goo12]. Blender allowsonly one side of a transparent spherical mesh to be displayed at atime [Tay17b]. The selection of pixels in regions of interest couldalso be a potential problem [Tay17b]. Yu et al. [YEII16] proposedseveral context-aware selections in 3D particle clouds, which helpto alleviate the issues associated with 3D selection and query. Fe-
lix tackles the challenge of querying by simultaneously satisfyingtwo density ranges, but Shivashankar et al. [SPN∗16] identified in-teractive visualization of intricate 3D networks as a “largely unex-plored problem of major significance”. WYSIWYG creates a march-ing cube of a 2D selection and finds the cluster with the largestprojection area as the cluster of interest [SXL∗14]. The techniquelacks flexibility as it depends heavily on the assumption that thelargest cluster is always of interest.
8.4. Uncertainty Visualization
Uncertainty visualization in astronomy remains largely unexplored,even though errors and uncertainties are introduced due to data ac-quisition, transformation, and visualization. Li et al. [LFLH07] no-ticed that uncertainty visualization is seldom available in astronom-ical simulations and developed techniques that enhance perceptionand comprehension of uncertainty across a wide range of scales.Since then, a few studies have considered errors created during thesimulation pipeline. Großschedl et al. [GAM∗18] used uncertaintyplots to effectively present the distribution of the data and demon-strated the confidence in their reconstruction results. With the di-rect intention of incorporating uncertainty in the discovery process,Bock et al. [BPM∗15] displayed the uncertainty of space weathersimulation by visualizing an ensemble of simulation results withdifferent input parameters (Fig. 13). Combined with a timeline viewand a volumetric rendering of each ensemble member, scientists areable to compare each simulation with measured data, gain an un-derstanding of the parameter sensitivities, and detect correlationsbetween the parameters.
Applying uncertainty visualization to 3D astronomy data is chal-lenging because we lack the techniques to deal with sparse/far awaysamples and their large error cones. However, the potential exists todisplay uncertainty in a localized object or regions of interest, andthat potential must be developed further.
Figure 13: Ensemble selection view that captures the uncertaintyof all ensemble runs by displaying the full 4D parameter space.Image reproduced from Bock et al. [BPM∗15].
© 2021 The Author(s)Computer Graphics Forum © 2021 The Eurographics Association and John Wiley & Sons Ltd.
654

Lan et al. / Visualization in Astrophysics
8.5. Time Series Data Visualization and Analysis
Most of the current time series data visualizations are built to dis-play halo evolution. One common technique is to use a merger treeto visualize the development of halos over time [SXL∗14, AF15,PGX∗16,SBD∗17]. Other techniques are often used along with themerger tree to enhance the effectiveness of the visualization. Shanet al. [SXL∗14] visualized the changes of selected particles as aparticle trace path image (see Fig. 14). Preston et al. [PGX∗16]added interactivity into their software and facilitated more efficientanalysis for large, heterogeneous data. Scherzinger et al. [SBD∗17]extended their framework by adding particle visualization and anal-ysis for individual halos.
In general, time series data visualization can also be helpfulwhen tracking star movements. However, little effort has been ex-pended in this regard, with Gaia Sky being the only example, to thebest of our knowledge. Given the instantaneous proper motion vec-tor of stars and simulation time, Gaia Sky [SJMS19] computes arepresentation of proper motions. The software is able to visualizereal-time star movements with sufficient numerical accuracy.
Figure 14: Interactive linked views of halo evolutionary history.Top left shows the evolution path of a selected halo and top rightis the halo projected onto a 2D screen. Bottom is the merger treevisualization of the halo evolution. Image reproduced from Shan etal. [SXL∗14].
8.6. Machine Learning
During our recent astrophysics workshops, many astronomersvoiced their desires as well as concerns about using machine learn-ing techniques (ML), and in particular, deep learning in the astro-physics discovery processes, mostly surrounding the interpretabil-ity of “black box" ML models. Active discussions have concernedthe maturity of ML in astronomy, and a number of surveys havebeen created to assess this maturity [BB10, FJ20, NAB∗19].
Combine visualization with machine learning. Although the con-cerns regarding the interpretability of ML models in astronomy arevalid in some cases, we believe that combining visualization withML models has the potential to make the results more accessible to
classical theoretical interpretation. Indeed, some of the most suc-cessful applications of ML in astrophysics involve cases where theinterpretation is straightforward.
The use of deep learning techniques in astrophysics has mostlybeen limited to convolutional neural networks (CNNs). Khanet al. [KHW∗19] used a combination of deep learning and dimen-sionality reduction techniques to help construct galaxy catalogs.They extracted the features from one of the last layers of their pre-trained CNN and clustered the features using t-SNE. Their methodnot only leads to promising classification results, but also points outerrors in the galaxy zoo dataset with the misclassified examples.Ntampaka et al. [NZE∗19] presented a CNN that estimated galaxycluster masses from the Chandra mock images. They used visual-ization to interpret the results of learning and to provide physicalreasoning. Kim and Brunner [KB16] performed star-galaxy clas-sification using CNNs. They studied images of activation maps,which help to explain how the model is performing classificationtasks. Apart from deep learning, Reis et al. [RPB∗18] used randomforests to generate distances between pairs of stars, and then vi-sualize such a distance matrix using t-SNE. Their techniques havebeen shown to be useful to identify outliers and to learn complexstructures with large spectroscopic surveys.
Many efforts in recent years have focused on interpreting MLmodels [Mol20]. We believe a good starting point to obtain inter-pretability is to combine visualization with models that are inher-ently interpretable [Rud19] (e.g., linear regression, decision tree,decision rules, and naive Bayes) in studying astronomical data. Al-ternatively, we may train an interpretable model as a surrogate toapproximate the predictions of a black box model (such as a CNN)and integrate such a surrogate in our visualization.
Topological data analysis. Furthermore, topological data analysis(TDA) is an emerging field that promotes topology-based unsuper-vised learning techniques. TDA infers insights from the shape ofthe data, and topology has a reasonably long history in its applica-tions in scientific visualization [HLH∗16]. A few researchers haveapplied TDA to astrophysics. Novikov et al. [NCD06] were thefirst to propose the method of extracting the skeleton of the cosmicweb using discrete Morse theory [For02]. Both Sousbie [Sou11]and Shivashankar et al. [SPN∗16] used discrete Morse theory to de-velop geometrically intuitive methods that extract features from thecosmic web (e.g., filaments, walls, or voids). They demonstratedthe efficiency and effectiveness of topological techniques in astro-nomical tasks. Xua et al. [XCKGN19] used TDA techniques toidentify cosmic voids and loops of filaments and assign their sta-tistical significance. Not many applications of topology have beenproposed in de-noising astronomy data, other than the work ofRosen et al. [RSM∗19], which uses contour trees in the de-noisingand visualization of radio astronomy (ALMA) data cubes.
8.7. Further Advancements in Education and Outreach
A general ambition in science communication is to shorten the dis-tance between research and outreach and make current research re-sults and data available at science centers, museums, and in on-linerepositories. This ambition applies to both shortening the time be-tween discovery and dissemination and creating increased public
© 2021 The Author(s)Computer Graphics Forum © 2021 The Eurographics Association and John Wiley & Sons Ltd.
655

Lan et al. / Visualization in Astrophysics
access to research data. Even real-time public participation in sci-entific endeavors has been shown to be of public interest [BHY18].This science communication trend is supported by rapid develop-ment of commodity computing platforms capable of handling largedatasets, availability of open research data, and improved data anal-ysis and visualization tools. These trends now enable visitors topublic venues and home users to become “explorers” of scientificdata. Astrophysics is one of the prime examples of a domain oflarge public interest and with vast amounts of publicly availabledata.
Figure 15: Usage of a touch interface in a museum installationguiding the user using cues built directly into the data exploration.
The trend described above poses several challenges. In a pub-lic setting, an interactive exploration has to be curated and guidedin such a way that learning and communication goals are reachedwhile not interfering with “freedom” of interaction [YRA∗16].Fig. 15 shows an example of this approach on a touch-capable ta-ble used in museum environments for a self-guided learning expe-rience, exemplified on a CT scan of a meteoroid originating fromMars. Ynnerman et al. [YLT18] coined the term Exploranation todescribe the introduction of data exploration in traditional explana-tory contexts, and Goodman et al. [GBR18] described the need forinteraction in explanation. This endeavor calls for a new generationof authoring and production tools targeting production of interac-tive non-linear storytelling [WH07], with interfaces that interop-erate with research tools and repositories. We also see that inter-active installations will need to feature several different modes ofoperation. A first scenario would be a "walk-up-and-use" situationin which the content and the interaction are intuitive. The secondscenario is a guided experience with a trained facilitator who canunlock advanced features of the installation and also bring in moredata sources for an in-depth science communication session.
Interaction plays a central role in science communication, andpublic settings put demands on robust, engaging, intuitive, and in-teractive visualization interfaces. Sundén et al. [SBJ∗14] discussedaspects of demand and the potential use of multi-modal interfaces.Yu et al. [YEII12, YEII16] addressed challenges posed by the in-teractive selections of data using touch surfaces.
In live presentation situations based on interactive software,more advanced tools are needed that support the presenter (and thepilot). Apart from the authoring tools discussed above, research onfeatures such as automatic camera moves during presentations is
also needed. An interesting challenge in view of advances in ma-chine learning and natural language processing is the use of voiceand gesture based interaction during presentations. Support for theembedding of multi-media data sources and other on-line servicesis also needed.
In outreach, the key role of visual representations cannot beunderestimated, which calls for systems and tools that generateboth visually appealing and still scientifically correct represen-tations. The challenge here is a trade-off between artistic andscientific considerations. From an artistic point of view, Rectoret al. [RLF∗17] aimed to strike a balance between the scientific andaesthetic quality of an astronomical image. They pointed out thatpeople have different expectations and misconceptions of colored-image-based factors such as cultural variation and expertise. There-fore, scientists need to carefully consider the choices they makein order to create astronomical images. An example of how thischallenge is met is the work on cinematic data visualization byCox et al. [CPL∗19, BCWW20]. Another example is the interac-tive blackhole visualization [VE21] described in Sect. 3.
The on-going rapid development of computer hardware createsopportunities and challenges as the users expect visual quality onthe same level as the state-of-the-art games. At the same time, newlevels of widespread public use are made possible. The challengeis to work with visual quality and performance as well as to createawareness of limited computer capabilities, data size and complex-ity. Another challenge for outreach is the use of social media andconnected services, which entails not only development of toolsand availability of data, but also engagement of a large number ofdomain experts with a science communication mission.
9. Navigation Tool
Together with the classification and descriptions of the papers in-cluded in this survey, we complement our survey with a visual lit-erature browser available at https://tdavislab.github.io/astrovis-survis. The visual browser follows the same classi-fication scheme used in this report, where the users can use key-word searches to identify potential aspects in the field that are un-derserved. Additionally, we provide an alternative navigation toolwithin the visual browser (also illustrated in Fig. 16), where thesurveyed papers are distributed along two axes. This tool providesa different viewpoint for the state-of-the-art survey.
The first x-axis – single task vs. general purpose – specifieswhether a specific paper addresses a singular challenge of visual-ization in astronomy (single task), or whether it describes a moregeneral purpose system that can be applied to a wide array of po-tential applications (general purpose). A general purpose systemalso includes software systems that combine datasets of multiplemodalities in a shared contextualization. The second y-axis – tech-nique vs. application – specifies whether a paper develops a spe-cific visualization or analysis technique, or whether it combinesmany different techniques to address a specific application. Theprimary category – data analysis tasks – is double-encoded withcolors and marker shapes. The "other" category represents relevantpapers mentioned in the survey but that do not belong to any of thedata analysis tasks. The coordinates of the papers in the navigation
© 2021 The Author(s)Computer Graphics Forum © 2021 The Eurographics Association and John Wiley & Sons Ltd.
656
Lan et al. / Visualization in Astrophysics
tool are based on our best estimation. We lay out the papers in theirgeneral areas in the figure to avoid overlap of labels.
10. Conclusions
In this report, we provide an overview of the state of the art in as-trophysics visualization. We have surveyed the literature and foundthat visualization in astrophysics can be categorized broadly intofive categories based upon the primary user objectives: data wran-gling, data exploration, feature identification, object reconstruction,and education and outreach.
A major finding of this work is that there remains a significantgap between cutting-edge visualization techniques and astrophys-ical datasets. Among the 80+ papers surveyed, around 20 papersare from visualization venues. Given the scope of current and fu-ture datasets in astrophysics, as well as the advanced methodologiesand capabilities in visualization research, the potential opportunityis great for scientific discovery in bridging this gap. However, thisbridge will not build itself.
We therefore take this opportunity to issue a “call to action” forboth the visualization and astrophysics communities to considermore robust and intentional ways of bridging the gap between vi-sualization methods and astronomy data. We make the specific rec-ommendations below as concrete suggestions for improving thisgoal over the next decade.
We suggest the construction of a comprehensive AstroVisRoadmap for bringing these disparate communities and stakehold-ers together at both the grassroots and institutional levels. In orderto build community, we suggest regular annual joint meetings thatwill explicitly target this gap and bring together visualization andastrophysics domain expertise; the 2019 Dagstuhl Seminar on thetopic of “Astrographics: Interactive Data-Driven Journeys throughSpace” is a good example [GHWY19]. We specifically suggestyearly companion meetings to be held alternately at the WinterAAS or annual IAU meetings and the IEEE Visualization confer-ences. Having explicit joint sponsorship of the professional societyis an important step in growing this joint community.
We recognize and appreciate the “grassroots” efforts thatbring together the visualization and astrophysics communities.Indeed, this contribution is the direct result of a Carnegie-SCIworkshop as well as the IEEE Vis2020 workshop “Visualiza-tion in Astrophysics” (http://www.sci.utah.edu/~beiwang/visastro2020/). Other efforts include the RHytHM (ResearcHusing yt Highlights Meeting) at the Flatiron Institute in 2020,the application spotlight event (https://sites.google.com/view/viscomsospotlight/) at IEEE VIS 2020 discussing op-portunities and challenges in cosmology visualization, and theannual glue-con hackathon (https://www.gluesolutions.io/glue-con) that integrate astronomical software projects includingglue, yt, OpenSpace, WorldWide Telescope into a centralized sys-tem. These meetings are critical, in addition to the larger meetingswe suggest above.
To assist in the access to information and literature, we suggestthat an “astrovis” keyword be added to papers – published in ei-ther astrophysics journals or visualization publications – to make
interrogation of papers easy for the communities. Our visual litera-ture browser that enables exploration of “astrovis” papers is a stepin this direction.
We further suggest starting visualization/data challengeswithin the large publicly available astrophysics data surveys.The “solutions” to these challenges should be made publiclyavailable and thus applicable to other datasets. A few scien-tific visualization (SciVis) challenges have involved astronomydatasets at IEEE VIS conferences, notably the SciVis 2015Contest using the Dark Sky Simulations (https://darksky.slac.stanford.edu/) and the SciVis 2019 Contest using theHACC cosmological simulation (https://wordpress.cels.anl.gov/2019-scivis-contest/). A recent example is thedata challenge held at the IEEE VIS 2020 VisAstro workshop,where a visualization tool under development called CosmoVis wasused by Burchett et al. [BAEF20] to interactively analyze cosmo-logical simulations generated by IllustrisTNG. In terms of pedagogy,we recommend summer schools, hackathons, and workshops thathelp onboard members of each community engage in this joint ef-fort. The data challenges may serve as the seeding point for suchworkshops. Science not communicated is science not done. Look-ing toward science education and public outreach, we highlight theimportant role played by museums and planetariums in transition-ing scientific discovery to public education. We suggest that thesestakeholders be included organically in the discovery process andemphasize their key role in the scientific process.
We are encouraged by the progress that has been made in the lastdecade, and we look forward to the next decade of development,discovery, and education.
Acknowledgements
The authors would like to thank the constructive suggestions bythe reviewers and the generous funding by the following enti-ties: Carnegie Institution for Science Venture Grant no. BPO-700082; The Canadian Institute for Advanced Research Fellow-ship program; The Ahmanson Foundation; NASA under grantno. NNX16AB93A; the Swedish e-Science Research Centre; theKnut and Alice Wallenberg Foundation; and the Swedish ResearchCouncil DNR:2015-05462. The authors would also like to thank thespeakers and participants of following two workshops, who helpedus identify challenges and opportunities via great discussions: theCarnegie + SCI mini-workshop (April 2020), and the Visualizationin Astrophysics workshop during IEEE VIS (October 2020), in par-ticular, Chuck Hansen, Chris R. Johnson, Alyssa Goodman, JackieFaherty, Matthew J. Turk, Ryan Wyatt, and Joseph N. Burchett.
References[AC19] ARAGON-CALVO M. A.: Classifying the large-scale structure of
the universe with deep neural networks. Monthly Notices of the RoyalAstronomical Society 484, 4 (2019), 5771–5784. 10, 13
[ACS∗17] AXELSSON E., COSTA J., SILVA C., EMMART C., BOCK A.,YNNERMAN A.: Dynamic scene graph: enabling scaling, positioning,and navigation in the universe. Computer Graphics Forum 36, 3 (2017),459–468. 7
[AF15] ALMRYDE K. R., FORBES A. G.: Halos in a dark sky: interac-tively exploring the structure of dark matter halo merger trees. In 2015
© 2021 The Author(s)Computer Graphics Forum © 2021 The Eurographics Association and John Wiley & Sons Ltd.
657

Lan et al. / Visualization in Astrophysics
Figure 16: An alternative navigation tool that highlights the surveyed papers along two axes: single task vs. general purpose and techniquevs application.
IEEE Scientific Visualization Conference (SciVis) (2015), pp. 73–77. 7,9, 21
[AFPR∗17] ARGUDO-FERNÁNDEZ M., PUERTAS S. D., RUIZ J. E.,SABATER J., VERLEY S., BERGOND G.: LSSGalPy: interactive vi-sualization of the large-scale environment around galaxies. Publicationsof the Astronomical Society of the Pacific 129, 975 (2017). 7, 20
[AJP∗18] ARCAND K. K., JIANG E., PRICE S., WATZKE M., SGOUROST., EDMONDS P.: Walking through an exploded star: rendering super-nova remnant cassiopeia a into virtual reality. Communicating Astron-omy with the Public Journal 24 (2018), 17–24. 16, 17
[AJW∗19] ARCAND K. K., JUBETT A., WATZKE M., PRICE S.,WILLIAMSON K., EDMONDS P.: Touching the stars: improving NASA3D printed data sets with blind and visually impaired audiences. Journalof Science Communication 18, 4 (2019). 20
[Arc05] ARCHIVE N. I. S.: Montage: an astronomical image mosaicengine. http://montage.ipac.caltech.edu/, 2005. 5
[BAB∗18] BLADIN K., AXELSSON E., BROBERG E., EMMART C.,LJUNG P., BOCK A., YNNERMAN A.: Globe browsing: contextual-ized spatio-temporal planetary surface visualization. IEEE Transactionson Visualization and Computer Graphics 24, 1 (2018), 802–811. 7, 15
[BAC∗20] BOCK A., AXELSSON E., COSTA J., PAYNE G., ACINA-PURA M., TRAKINSKI V., EMMART C., SILVA C., HANSEN C., YN-NERMAN A.: Openspace: a system for astrographics. IEEE Transactionson Visualization and Computer Graphics 26, 1 (2020), 633–642. 7, 8, 19,20
[BAEF20] BURCHETT J. N., ABRAMOV D., ELEK O., FORBES A. G.:Volumetric reconstruction for interactive analysis of the cosmic web.Data Challenge Winner at IEEE VIS VisAstro Workshop 2020 (2020).23
© 2021 The Author(s)Computer Graphics Forum © 2021 The Eurographics Association and John Wiley & Sons Ltd.
658

Lan et al. / Visualization in Astrophysics
[BAO∗19] BURCHETT J. N., ABRAMOV D., OTTO J., ARTANEGARAC., PROCHASKA J. X., FORBES A. G.: IGM-Vis: analyzing intergalac-tic and circumgalactic medium absorption using quasar sightlines in acosmic web context. Computer Graphics Forum 38, 3 (2019), 491–504.10, 11, 20
[BB10] BALL N. M., BRUNNER R. J.: Data mining and machine learn-ing in astronomy. International Journal of Modern Physics D 19, 07(2010), 1049–1106. 21
[BCK∗19] BORKIEWICZ K., CHRISTENSEN A., KOSTIS H.-N., SHI-RAH G., WYATT R.: Cinematic scientific visualization: the art of com-municating science. In ACM SIGGRAPH 2019 Courses (2019), Associ-ation for Computing Machinery, pp. 1–273. 16
[BCWW20] BORKIEWICZ K., CHRISTENSEN A., WYATT R., WRIGHTE. T.: Introduction to cinematic scientific visualization. In ACM SIG-GRAPH 2020 Courses (2020), Association for Computing Machinery,pp. 1–267. 22
[Ben12] BENSON A. J.: Galacticus: a semi-analytic model of galaxyformation. New Astronomy 17, 2 (2012), 175–197. 9
[BET∗20] BURCHETT J. N., ELEK O., TEJOS N., PROCHASKA J. X.,TRIPP T. M., BORDOLOI R., FORBES A. G.: Revealing the dark threadsof the cosmic web. The Astrophysical Journal 891, 2 (2020). 15
[BF08] BARNES D. G., FLUKE C. J.: Incorporating interactive three-dimensional graphics in astronomy research papers. New Astronomy 13,8 (2008), 599–605. 5, 20
[BFBP06] BARNES D. G., FLUKE C. J., BOURKE P. D., PARRY O. T.:An advanced, three-dimensional plotting library for astronomy. Publica-tions of the Astronomical Society of Australia 23, 2 (2006), 82–93. 5
[BG17] BERRIMAN G. B., GOOD J. C.: The application of the montageimage mosaic engine to the visualization of astronomical images. Pub-lications of the Astronomical Society of the Pacific 129, 975 (2017). 4,5
[BGR∗16] BAINES D., GIORDANO F., RACERO E., SALGADO J.,MARTÍ B., MERÍN B., ET AL.: Visualization of multi-mission astro-nomical data with ESASky. Publications of the Astronomical Society ofthe Pacific 129, 972 (2016). 6, 7, 20
[BHY18] BOCK A., HANSEN C., YNNERMAN A.: Openspace: bringingnasa missions to the public. IEEE Computer Graphics and Applications38, 5 (2018), 112–118. 16, 22
[BKW16] BECK F., KOCH S., WEISKOPF D.: Visual analysis and dis-semination of scientific literature collections with Survis. IEEE Trans-actions on Visualization and Computer Graphics 22, 1 (2016), 180–189.2
[Ble02] BLENDER ONLINE COMMUNITY: Blender.https://www.blender.org/, 2002. 4
[BNL19] BORKIEWICZ K., NAIMAN J. P., LAI H.: Cinematic visual-ization of multiresolution data: Ytini for adaptive mesh refinement inhoudini. The Astronomical Journal 158, 1 (2019). 4
[BNO∗14] BRYAN G. L., NORMAN M. L., O’SHEA B. W., ABEL T.,WISE J. H., TURK M. J., ET AL.: Enzo: an adaptive mesh refinementcode for astrophysics. The Astrophysical Journal Supplement Series 211,2 (2014). 6
[BPM∗15] BOCK A., PEMBROKE A., MAYS M. L., RASTAETTER L.,ROPINSKI T., YNNERMAN A.: Visual verification of space weather en-semble simulations. In 2015 IEEE Scientific Visualization Conference(SciVis) (2015), pp. 17–24. 14, 15, 20
[BSP∗13] BURGER D., STASSUN K. G., PEPPER J., SIVERD R. J.,PAEGERT M., LEE N. M. D., ROBINSON W. H.: Filtergraph: an interac-tive web application for visualization of astronomy datasets. Astronomyand Computing 2 (2013), 40–45. 6, 7, 19
[BV18] BREDDELS M. A., VELJANOSKI J.: Vaex: big data explorationin the era of gaia. Astronomy & Astrophysics 618, A13 (2018). 7, 9
[CBE∗21] COSTA J., BOCK A., EMMART C., HANSEN C., YNNERMAN
A., SILVA C.: Interactive visualization of atmospheric effects for celes-tial bodies. IEEE Transactions on Visualization and Computer Graphics27, 2 (2021), 785–795. 7, 8
[CCM∗20] CIURLO A., CAMPBELL R. D., MORRIS M. R., DO T.,GHEZ A. M., HEES A., ET AL.: A population of dust-enshrouded ob-jects orbiting the galactic black hole. Nature 577, 7790 (2020), 337–340.10, 12
[CKA12] CAMPBELL R., KJÆR K., AMICO P.: 3D visualisation of in-tegral vield spectrometer data. The Messenger 148 (2012), 28–31. 10,12
[CPL∗19] COX D., PATTERSON R., LEVY S., CHRISTENSEN A.,BORKIEWICZ K., CARPENTER J., ET AL.: "birth of planet earth" full-dome excerpt: photosynthesis in a chromatophore. In ACM SIGGRAPH2019 Computer Animation Festival (2019), Association for ComputingMachinery. 22
[CPST20] COMRIE A., PINSKA A., SIMMONDS R., TAYLOR A.: Devel-opment and application of an HDF5 schema for SKA-scale image cubevisualization. Astronomy and Computing 32 (2020). 4, 5
[Dai85] DAINTY J. C.: Progress in object reconstruction in astronomy.In 1984 European Conf on Optics, Optical Systems, and Applications(1985), vol. 0492, SPIE, pp. 234–241. 13
[DF17] DIEMER B., FACIO I.: The fabric of the universe: exploring thecosmic web in 3D prints and woven textiles. Publications of the Astro-nomical Society of the Pacific 129, 975 (2017). 16, 17, 20
[DHG∗18] DYKES T., HASSAN A., GHELLER C., CROTON D.,KROKOS M.: Interactive 3D visualization for theoretical virtual observa-tories. Monthly Notices of the Royal Astronomical Society 477, 2 (2018),1495–1507. 16, 18
[EAA∗19] EVENT HORIZON TELESCOPE COLLABORATION,AKIYAMA K., ALBERDI A., ALEF W., ASADA K., AZULY R.,ET AL.: First m87 event horizon telescope results. I. the shadow ofthe supermassive black hole. The Astrophysical Journal Letters 875, 1(2019). 1
[EBPF21] ELEK O., BURCHETT J. N., PROCHASKA J. X., FORBESA. G.: Polyphorm: structural analysis of cosmological datasets via in-teractive Physarum polycephalum visualization. IEEE Transactions onVisualization and Computer Graphics 27, 2 (2021), 806–816. 13, 14, 15
[ERG19] EMONTS B., RABA R., G. MOELLENBROCK ET. AL.: TheCASA software for radio astronomy: status update from ADASS 2019.In 29th annual international Astronomical Data Analysis Software &Systems (ADASS) conference (2019). 4, 5
[FBO06] FLUKE C. J., BOURKE P. D., O’DONOVAN D.: Future di-rections in astronomy visualization. Publications of the AstronomicalSociety of Australia 23, 1 (2006), 12–24. 5
[FH07] FU C., HANSON A. J.: A transparently scalable visualization ar-chitecture for exploring the universe. IEEE Transactions on Visualizationand Computer Graphics 13, 1 (2007), 108–121. 7
[FHK∗11] FOLK M., HEBER G., KOZIOL Q., POURMAL E., ROBIN-SON D.: An overview of the HDF5 technology suite and its applications.In Proceedings of the EDBT/ICDT 2011 Workshop on Array Databases(2011), Association for Computing Machinery, pp. 36–47. 5
[FJ20] FLUKE C. J., JACOBS C.: Surveying the reach and maturity ofmachine learning and artificial intelligence in astronomy. WIREs DataMining and Knowledge Discovery 10, 2 (2020), e1349. 21
[Fla17] FLAMARY R.: Astronomical image reconstruction with convolu-tional neural networks. In 2017 25th European Signal Processing Con-ference (EUSIPCO) (2017), pp. 2468–2472. 13
[For02] FORMAN R.: A user’s guide to discrete morse theory. SéminaireLotharingien de Combinatoire 48 (12 2002). 21
[FRG19] FRITSCHI L., ROJO I. B., GÜNTHER T.: Visualizing the tem-poral evolution of the universe from cosmology simulations. In 2019IEEE Scientific Visualization Conference (SciVis) (2019), pp. 1–11. 7, 9
© 2021 The Author(s)Computer Graphics Forum © 2021 The Eurographics Association and John Wiley & Sons Ltd.
659

Lan et al. / Visualization in Astrophysics
[FSW∗19] FAHERTY J. K., SUBBARAO M., WYATT R., YNNERMANA., TYSON N. D., GELLER A., ET AL.: Ideas: immersive dome expe-riences for accelerating science. Bulletin of the American AstronomicalSociety 51, 7 (2019). 16
[GAM∗18] GROSSSCHEDL J. E., ALVES J., MEINGAST S., ACKERLC., ASCENSO J., BOUY H., ET AL.: 3D shape of Orion A from GaiaDR2. Astronomy & Astrophysics 619 (2018). 13, 14, 20
[Gár17] GÁRATE M.: Voxel datacubes for 3D visualization in blender.Publications of the Astronomical Society of the Pacific 129, 975 (2017).4
[GBR18] GOODMAN A. A., BORKIN M. A., ROBITAILLE T. P.: Newthinking on, and with, data visualization. arXiv: Instrumentation andMethods for Astrophysics (2018). 4, 7, 19, 22
[Ger14] GERNDT A.: Collaborative Rover Operations and Planetary Sci-ence Analysis System based on Distributed Remote and Interactive Vir-tual Environments. Final Publishable Summary Report, European UnionFramework Programme 7, 2014. 15, 19
[GHWY19] GOODMAN A. A., HANSEN C. D., WEISKOPF D., YNNER-MAN A.: Astrographics: interactive data-driven journeys through space(Dagstuhl Seminar 19262). Dagstuhl Reports 9, 6 (2019), 95–124. 15,23
[Glu12] GLUE DEVELOPERS: Glue: multi-dimensional linked-data ex-ploration. https://glueviz.org/, 2012. 19
[Goo12] GOODMAN A. A.: Principles of high-dimensional data visual-ization in astronomy. Astronomische Nachrichten 333, 5-6 (2012), 505–514. 6, 20
[HA20] HASENBERGER B., ALVES J.: AVIATOR: morphological objectreconstruction in 3D. Astronomy & Astrophysics 633 (Jan 2020). 13, 14
[HF11] HASSAN A., FLUKE C. J.: Scientific visualization in astronomy:towards the petascale astronomy era. Publications of the AstronomicalSociety of Australia 28, 2 (2011), 150–170. 1, 18, 19, 20
[HLH∗16] HEINE C., LEITTE H., HLAWITSCHKA M., IURICICH F.,FLORIANI L. D., SCHEUERMANN G., ET AL.: A survey of topology-based methods in visualization. Computer Graphics Forum 35, 3 (2016),643–667. 21
[HPAM19] HANULA P., PIEKUTOWSKI K., AGUILERA J., MARAIG. E.: Darksky halos: use-based exploration of dark matter formationdata in a hybrid immersive virtual environment. Frontiers in Roboticsand AI 6 (2019), 11. 9
[HPF∗16] HABIB S., POPE A., FINKEL H., FRONTIERE N., HEIT-MANN K., DANIEL D., ET AL.: HACC: simulating sky surveys on state-of-the-art supercomputing architectures. New Astronomy 42 (2016), 49–65. 5
[HPU∗15] HANULA P., PIEKUTOWSKI K., URIBE C., ALMRYDE K.,NISHIMOTO A., AGUILERA J., MARAI G. E.: Cavern halos: exploringspatial and nonspatial cosmological data in an immersive virtual envi-ronment. In Proceedings of the IEEE Scientific Visualization Conference(SciVis) (2015), pp. 87–99. 7, 9
[HSS∗19] HESSE-EDENFELD C., STEINKE M. J., SANTALIDIS N.,HUESMANN K., LEISTIKOW S., LINSEN L.: Interactive multi-level vi-sualization of combined particle and multi-field cosmology data. In 2019IEEE Scientific Visualization Conference (SciVis) (2019), pp. 12–30. 7,9
[HWMB15] HAZARIKA S., WEI T.-H., MUKHERJEE R., BARBUR A.:Visualizing the life and anatomy of dark matter. In 2015 IEEE ScientificVisualization Conference (SciVis) (2015), pp. 101–106. 7, 9
[Jae08] JAEGER S.: The common astronomy software application (casa).Astronomical Data Analysis Software and Systems XVII, ASP ConferenceSeries (2008). 5
[KB16] KIM E. J., BRUNNER R. J.: Star-galaxy classification using deepconvolutional neural networks. Monthly Notices of the Royal Astronom-ical Society 464, 4 (2016), 4463–4475. 21
[Ken13] KENT B. R.: Visualizing astronomical data with blender. Publi-cations of the Astronomical Society of the Pacific 125, 928 (2013), 731–748. 4
[Ken17] KENT B. R.: Spherical panoramas for astrophysical data visual-ization. Publications of the Astronomical Society of the Pacific 129, 975(2017). 4
[KHA12] KAEHLER R., HAHN O., ABEL T.: A novel approach to visu-alizing dark matter simulations. IEEE Transactions on Visualization andComputer Graphics 18, 12 (2012), 2078–2087. 10
[KHE∗10] KLASHED S., HEMINGSSON P., EMMART C., COOPER M.,YNNERMAN A.: Uniview - visualizing the universe. In Eurographics2010 - Areas Papers (2010), The Eurographics Association. 7, 16
[KHP∗11] KANDEL S., HEER J., PLAISANT C., KENNEDY J.,VAN HAM F., RICHE N. H., WEAVER C., LEE B., BRODBECK D.,BUONO P.: Research directions in data wrangling: Visualizations andtransformations for usable and credible data. Information Visualization10, 4 (2011), 271–288. 4
[KHW∗19] KHAN A., HUERTA E., WANG S., GRUENDL R., JENNINGSE., ZHENG H.: Deep learning at scale for the construction of galaxycatalogs in the dark energy survey. Physics Letters B 795 (2019), 248–258. 10, 13, 21
[KPH13] KNEBE A., PEARCE F. R., HANNI LUX ET. AL.: Structurefinding in cosmological simulations: the state of affairs. Monthly Noticesof the Royal Astronomical Society 435, 2 (2013), 1618–1658. 3
[LCO∗14] LUCIANI T. B., CHERINKA B., OLIPHANT D., MYER S.,WOOD-VASEY W. M., LABRINIDIS A., MARAI G. E.: Large-scaleoverlays and trends: visually mining, panning and zooming the observ-able universe. IEEE Transactions on Visualization and Computer Graph-ics 20, 7 (2014), 1048–1061. 6, 7, 19
[LFLH07] LI H., FU C.-W., LI Y., HANSON A.: Visualizing large-scaleuncertainty in astrophysical data. IEEE Transactions on Visualizationand Computer Graphics 13, 6 (2007), 1640–1647. 20
[LLC∗12] LIPSA D. R., LARAMEE R. S., COX S. J., ROBERTS J. C.,WALKER R., BORKIN M. A., PFISTER H.: Visualization for the physi-cal sciences. Computer Graphics Forum 31, 8 (2012), 2317–2347. 1, 18,19
[LvdWM17] LIBESKIND N. I., VAN DE WEYGAERT R., MARIUS CAU-TUN ET AL.: Tracing the cosmic web. Monthly Notices of the RoyalAstronomical Society 473, 1 (2017), 1195–1217. 10, 11
[Mad17] MADURA T. I.: A case study in astronomical 3D printing: themysterious Eta Carinae. Publications of the Astronomical Society of thePacific 129, 975 (2017), 058011. 16, 17, 19, 20
[MKDH04] MAGNOR M., KINDLMANN G., DURIC N., HANSEN C.:Constrained inverse volume rendering for planetary nebulae. In IEEEVisualization 2004 (2004), pp. 83–90. 14
[MLF∗12] MA K.-L., LIAO I., FRAZIER J., HAUSER H., KOSTIS H.-N.: Scientific storytelling using visualization. IEEE Computer Graphicsand Applications 32, 1 (2012), 12–19. 15
[Mol20] MOLNAR C.: Interpretable machine learn-ing: a guide for making black box models explainable.https://christophm.github.io/interpretable-ml-book/, 2020. 21
[MPF20] MOHAMMED A., POLYS N., FARRAH D.: Visualize this:lessons from the front-lines of high performance visualization. In Com-puter Science Technical Reports. Department of Computer Science, Vir-ginia Polytechnic Institute & State University, 2020. 19
[MSRMH09] MEYER-SPRADOW J., ROPINSKI T., MENSMANN J.,HINRICHS K.: Voreen: a rapid-prototyping environment for ray-casting-based volume visualizations. IEEE Computer Graphics and Applications29, 6 (2009), 6–13. 7, 8
[MT20] MUNK M., TURK M. J.: widgyts: custom jupyter widgets forinteractive data exploration with yt. Journal of Open Source Software 5,45 (2020), 1774. 6
© 2021 The Author(s)Computer Graphics Forum © 2021 The Eurographics Association and John Wiley & Sons Ltd.
660

Lan et al. / Visualization in Astrophysics
[Mun17] MUNA D.: Introducing nightlight: a new FITS viewer. Publica-tions of the Astronomical Society of the Pacific 129, 975 (2017), 058003.7, 8
[NAB∗19] NTAMPAKA M., AVESTRUZ C., BOADA S., ET AL.: Therole of machine learning in the next decade of cosmology. Bulletin of theAmerican Astronomical Society 51, 3 (2019). 21
[Nai12] NAIMAN J.: AstroBlend. www.astroblend.com, 2012. 4
[Nai16] NAIMAN J.: AstroBlend: an astrophysical visualization packagefor blender. Astronomy and Computing 15 (2016), 50–60. 4, 5, 19, 20
[NBC17] NAIMAN J. P., BORKIEWICZ K., CHRISTENSEN A. J.: Hou-dini for astrophysical visualization. Publications of the AstronomicalSociety of the Pacific 129, 975 (2017), 058008. 4, 19, 20
[NCD06] NOVIKOV D., COLOMBI S., DORE O.: Skeleton as a probe ofthe cosmic web: the two-dimensional case. Monthly Notices of the RoyalAstronomical Society 366, 4 (2006), 1201–1216. 21
[NNPD19] NGUYEN B. D., NGUYEN N. V. T., PHAM V., DANG T.:Visualization of data from HACC simulations by paraview. In 2019 IEEEScientific Visualization Conference (SciVis) (2019), pp. 31–32. 5, 7, 9
[NZE∗19] NTAMPAKA M., ZUHONE J., EISENSTEIN D., NAGAI D.,VIKHLININ A., HERNQUIST L., ET AL.: A deep learning approach togalaxy cluster x-ray masses. The Astrophysical Journal 876, 1 (2019),82. 10, 13, 21
[OC20] OTT J., CARTA TEAM: CARTA: cube analysis and renderingtool for astronomy. In American Astronomical Society Meeting Abstracts#235 (2020), vol. 235, p. 364.11. 4, 5
[OPB∗19] ORLANDO S., PILLITTERI I., BOCCHINO F., DARICELLOL., LEONARDI L.: 3DMAP-VR, a project to visualize three-dimensionalmodels of astrophysical phenomena in virtual reality. Research Notes ofthe American Astronomical Society 3, 11 (2019), 176. 16, 17, 19
[OWN∗20] ORTNER T., WALCH A., NOWAK R., BARNES R., HÖLLTT., GRÖLLER E.: Incorr: interactive data-driven correlation panels fordigital outcrop analysis. IEEE Transactions on Visualization and Com-puter Graphics 27, 2 (2020), 755–764. 14, 15
[PCHT17] POMARÈDE D., COURTOIS H. M., HOFFMAN Y., TULLYR. B.: Cosmography and data visualization. Publications of the As-tronomical Society of the Pacific 129, 975 (2017), 058002. 7, 20
[PGX∗16] PRESTON A., GHODS R., XIE J., SAUER F., LEAF N., MAK.-L., ET AL.: An integrated visualization system for interactive analy-sis of large, heterogeneous cosmology data. In 2016 IEEE Pacific Visu-alization Symposium (PacificVis) (2016), pp. 48–55. 9, 10, 11, 19, 21
[PGY05] PUETTER R., GOSNELL T., YAHIL A.: Digital image recon-struction: deblurring and denoising. Annual Review of Astronomy andAstrophysics 43 (2005), 139–194. 13
[PHCT17] POMAREDE D., HOFFMAN Y., COURTOIS H. M., TULLYR. B.: The cosmic v-web. The Astrophysical Journal 845, 1 (2017),55. 7
[PSD17] PILLEPICH A., SPRINGEL V., DYLAN NELSON ET AL.: Sim-ulating galaxy formation with the IllustrisTNG model. Monthly Noticesof the Royal Astronomical Society 473, 3 (2017), 4077–4106. 10, 11
[RAW∗20] RAVOUX C., ARMENGAUD E., WALTHER M., ETOURNEAUT., POMARÈDE D., PALANQUE-DELABROUILLE N., ET AL.: A tomo-graphic map of the large-scale matter distribution using the eBOSS—Stripe 82 Lyα forest. Journal of Cosmology and Astroparticle Physics2020, 07 (2020), 010–010. 10
[RFG∗18] ROSENFIELD P., FAY J., GILCHRIST R. K., CUI C., WEIGELA. D., ROBITAILLE T., OTOR O. J., GOODMAN A.: AAS WorldWidetelescope: a seamless, cross-platform data visualization engine for as-tronomy research, education, and democratizing data. The AstrophysicalJournal Supplement Series 236, 1 (2018), 22. 16
[RLF∗17] RECTOR T. A., LEVAY Z. G., FRATTARE L. M., ARCANDK. K., WATZKE M.: The aesthetics of astrophysics: how to make ap-pealing color-composite images that convey the science. Publications ofthe Astronomical Society of the Pacific 129, 975 (2017), 058007. 22
[RPB∗18] REIS I., POZNANSKI D., BARON D., ZASOWSKI G., SHA-HAF S.: Detecting outliers and learning complex structures with largespectroscopic surveys - a case study with APOGEE stars. Monthly No-tices of the Royal Astronomical Society 476, 2 (2018), 2117–2136. 21
[RSM∗19] ROSEN P., SETH A., MILLS B., GINSBURG A., KAMENET-ZKY J., KERN J., JOHNSON C. R., WANG B.: Using contour trees in theanalysis and visualization of radio astronomy data cubes. arXiv e-prints(2019), arXiv:1704.04561. 10, 12, 21
[Rud19] RUDIN C.: Stop explaining black box machine learning modelsfor high stakes decisions and use interpretable models instead. NatureMachine Intellignece 1 (2019), 206–215. 21
[SBD∗17] SCHERZINGER A., BRIX T., DREES D., VOLKER A., RAD-KOV K., SANTALIDIS N., FIEGUTH A., HINRICHS K.: Interactive ex-ploration of cosmological dark-matter simulation data. IEEE ComputerGraphics and Applications 37, 2 (2017), 80–89. 7, 8, 19, 21
[SBJ∗14] SUNDÉN E., BOCK A., JÖNSSON D., YNNERMAN A.,ROPINSKI T.: Interaction techniques as a communication channel whenpresenting 3D visualizations. In 2014 IEEE VIS International Workshopon 3DVis (3DVis) (2014), pp. 61–65. 22
[SBP∗20] SIMHA S., BURCHETT J. N., PROCHASKA J. X., CHITTIDIJ., ELEK O., TEJOS N., ET AL.: Disentangling the cosmic web towardsFRB 190608. The Astrophysical Journal 901, 2 (2020), 134. 15
[SHTG14] SCHLEI W., HOWELL K., TRICOCHE X., GARTH C.: En-hanced visualization and autonomous extraction of poincaré map topol-ogy. The Journal of the Astronautical Sciences 61 (2014), 170–197. 12
[SJMS19] SAGRISTÀ A., JORDAN S., MÜLLER T., SADLO F.: Gaiasky: navigating the gaia catalog. IEEE Transactions on Visualizationand Computer Graphics 25, 1 (2019), 1070–1079. 7, 8, 19, 20, 21
[SKW∗11] STEFFEN W., KONING N., WENGER S., MORISSET C.,MAGNOR M.: Shape: a 3D modeling tool for astrophysics. IEEE Trans-actions on Visualization and Computer Graphics 17, 4 (2011), 454–465.13, 14, 19
[SMG∗19] SCHATZ K., MÜLLER C., GRALKA P., HEINEMANN M.,STRAUB A., SCHULZ C., ET AL.: Visual analysis of structure formationin cosmic evolution. In 2019 IEEE Scientific Visualization Conference(SciVis) (2019), pp. 33–41. 7, 9
[Sou11] SOUSBIE T.: The persistent cosmic web and its filamentarystructure - i. theory and implementation. Monthly Notices of the RoyalAstronomical Society 414, 1 (2011), 350–383. 10, 12, 21
[SPK11] SOUSBIE T., PICHON C., KAWAHARA H.: The persistent cos-mic web and its filamentary structure — ii. illustrations. Monthly Noticesof the Royal Astronomical Society 414, 1 (2011), 384–403. 10, 12
[SPN∗16] SHIVASHANKAR N., PRANAV P., NATARAJAN V., V. D.WEYGAERT R., BOS E. G. P., RIEDER S.: Felix: a topology basedframework for visual exploration of cosmic filaments. IEEE Transac-tions on Visualization and Computer Graphics 22, 6 (2016), 1745–1759.10, 12, 20, 21
[SSM∗19] SKOWRON D. M., SKOWRON J., MRÓZ P., UDALSKI A.,PIETRUKOWICZ P., SOSZYNSKI I., ET AL.: A three-dimensional mapof the milky way using classical cepheid variable stars. Science 365,6452 (2019), 478–482. 14, 15
[SUB∗20] SAWADA N., UEMURA M., BEYER J., PFISTER H., FU-JISHIRO I.: TimeTubesX: a query-driven visual exploration of observ-able, photometric, and polarimetric behaviors of blazars. IEEE Trans-actions on Visualization and Computer Graphics Early Access (2020),1–12. 10, 11
[SWJ∗05] SPRINGEL V., WHITE S. D. M., JENKINS A., FRENK C. S.,YOSHIDA N., GAO L., ET AL.: Simulations of the formation, evolutionand clustering of galaxies and quasars. Nature 435 (2005), 629–636. 9
[SWV∗08] SPRINGEL V., WANG J., VOGELSBERGER M., LUDLOW A.,JENKINS A., HELMI A., ET AL.: The aquarius project: the subhalos ofgalactic halos. Monthly Notices of the Royal Astronomical Society 391,4 (2008), 1685–1711. 9
© 2021 The Author(s)Computer Graphics Forum © 2021 The Eurographics Association and John Wiley & Sons Ltd.
661

Lan et al. / Visualization in Astrophysics
[SXL∗14] SHAN G., XIE M., LI F., GAO Y., CHI X.: Interactive visualexploration of halos in large-scale cosmology simulation. Journal ofVisualization 17, 3 (2014), 145–156. 10, 11, 19, 20, 21
[TA16] THEYS C., AIME C.: Reconstructing images in astrophysics,an inverse problem point of view. In Cartography of the Sun and theStars. Lecture Notes in Physics, Rozelot J.-P., Neiner C., (Eds.), vol. 914.Springer, Cham, 2016, pp. 1–23. 13
[Tay05] TAYLOR M. B.: TOPCAT & STIL: Starlink table/votable pro-cessing software. In Astronomical Data Analysis Software and SystemsXIV (2005), vol. 347 of Astronomical Society of the Pacific ConferenceSeries, p. 29. 7, 8
[Tay14] TAYLOR M.: Visualising large datasets in TOPCAT v4. In Astro-nomical Data Analysis Software and Systems XXIII (2014), Astronomi-cal Society of the Pacific Conference Series, p. 257. 7, 8
[Tay15] TAYLOR R.: FRELLED: a realtime volumetric data viewer forastronomers. Astronomy and Computing 13 (2015), 67–79. 4, 19
[Tay17a] TAYLOR M.: TOPCAT: desktop exploration of tabular data forastronomy and beyond. Informatics 4, 3 (2017). 7, 8, 9, 19
[Tay17b] TAYLOR R.: Visualizing three-dimensional volumetric datawith an arbitrary coordinate system. Publications of the AstronomicalSociety of the Pacific 129, 972 (2017), 028002. 4, 19, 20
[TCD∗13] TULLY R. B., COURTOIS H. M., DOLPHIN A. E., FISHERJ. R., HÉRAUDEAU P., JACOBS B. A., ET AL.: Cosmicflows-2: the data.The Astronomical Journal 146, 4 (2013), 86. 7
[TSH21] TRICOCHE X. M., SCHLEI W. R., HOWELL K. C.: Extractionand visualization of Poincaré map topology for spacecraft trajectory de-sign. IEEE Transactions on Visualization and Computer Graphics 27, 2(2021), 765–774. 10, 12
[TSO∗10] TURK M. J., SMITH B. D., OISHI J. S., SKORY S., SKILL-MAN S. W., ABEL T., NORMAN M. L.: yt: a multi-code analysis toolkitfor astrophysical simulation data. The Astrophysical Journal SupplementSeries 192, 1 (2010), 9. 6, 7, 19
[Tuk77] TUKEY J. W.: Exploratory data analysis. Pearson, 1977. 6
[USTY18] USUDA-SATO K., TSUZUKI H., YAMAOKA H.: Making“real astronomy” visible to the public. Nature Astronomy 2, 9 (2018),692–694. 16
[VBF∗16] VOHL D., BARNES D. G., FLUKE C. J., POUDEL G.,GEORGIOU-KARISTIANIS N., HASSAN A. H., ET AL.: Large-scalecomparative visualisation of sets of multidimensional data. PeerJ Com-puter Science (2016). 7, 8, 19
[VD11] VOGT F., DOPITA M.: The 3D structure of N132D in the LMC:a late-stage young supernova remnant. Astrophysics and Space Science331, 2 (2011), 521–535. 13, 14, 15
[VE21] VERBRAECK A., EISEMANN E.: Interactive black-hole visual-ization. IEEE Transactions on Visualization and Computer Graphics 27,2 (2021), 796–805. 4, 6, 22
[VOVMB16] VOGT F. P. A., OWEN C. I., VERDES-MONTENEGRO L.,BORTHAKUR S.: Advanced data visualization in astrophysics: the X3Dpathway. The Astrophysical Journal 818, 2 (2016), 115. 4, 5
[VS13] VOGT F. P. A., SHINGLES L. J.: Augmented reality in astro-physics. Astrophysics and Space Science 347, 1 (2013), 47–60. 16, 17
[VSDR17] VOGT F., SEITENZAHL I., DOPITA M., RUITER A.: Linkingthe X3D pathway to integral field spectrographs: YSNR 1E0102.2-7219in the SMC as a case study. Publications of the Astronomical Society ofthe Pacific 129, 975 (2017), 058012. 4, 5, 20
[VW12] VOGT F., WAGNER A.: Stereo pairs in astrophysics. Astro-physics and Space Science 337 (2012), 79–92. 4, 5
[WAG∗12] WENGER S., AMENT M., GUTHE S., LORENZ D., TILL-MANN A., WEISKOPF D., MAGNOR M.: Visualization of astronom-ical nebulae via distributed multi-GPU compressed sensing tomogra-phy. IEEE Transactions on Visualization and Computer Graphics 18,12 (2012), 2188–2197. 13, 14, 19
[WG79] WELLS D. C., GREISEN E. W.: FITS - a flexible image trans-port system. In Image Processing in Astronomy (1979), p. 445. 5
[WH07] WOHLFART M., HAUSER H.: Story telling for presentation involume visualization. In Proceedings of the 9th Joint Eurographics/IEEEVGTC conference on Visualization (2007), Eurographics Association,pp. 91–98. 22
[WHA∗11] WOODRING J., HEITMANN K., AHRENS J., FASEL P., HSUC.-H., HABIB S., POPE A.: Analyzing and visualizing cosmologicalsimulations with ParaView. The Astrophysical Journal Supplement Se-ries 195, 1 (2011), 11. 4, 5, 19
[WLM13] WENGER S., LORENZ D., MAGNOR M.: Fast image-basedmodeling of astronomical nebulae. Computer Graphics Forum 32, 7(2013), 93–100. 13, 14
[XCKGN19] XUA X., CISEWSKI-KEHE J., GREEN S. B., NAGAI D.:Finding cosmic voids and filament loops using topological data analysis.Astronomy and Computing 27 (2019), 34–52. 21
[XNW∗16] XU L., NAKAYAMA M., WU H.-Y., WATANABE K., TAKA-HASHI S., UEMURA M., FUJISHIRO I.: Timetubes: design of a visual-ization tool for time-dependent, multivariate blazar datasets. In 2016Nicograph International (NicoInt) (2016), pp. 15–20. 10, 11
[YEII12] YU L., EFSTATHIOU K., ISENBERG P., ISENBERG T.: Effi-cient structure-aware selection techniques for 3D point cloud visualiza-tions with 2DOF input. IEEE Transactions on Visualization and Com-puter Graphics 18, 12 (2012), 2245–2254. 7, 9, 22
[YEII16] YU L., EFSTATHIOU K., ISENBERG P., ISENBERG T.: CAST:effective and efficient user interaction for context-aware selection in3D particle clouds. IEEE Transactions on Visualization and ComputerGraphics 22, 1 (2016), 886–895. 7, 9, 20, 22
[YLT18] YNNERMAN A., LÖWGREN J., TIBELL L.: Exploranation: anew science communication paradigm. IEEE Computer Graphics andApplications 38, 3 (2018), 13–20. 4, 15, 22
[YRA∗16] YNNERMAN A., RYDELL T., ANTOINE D., HUGHES D.,PERSSON A., LJUNG P.: Interactive visualization of 3d scanned mum-mies at public venues. Communications of the ACM 59, 12 (2016), 72–81. 22
[ZST11] ZHANG T., SUN Y., TANG Z.: 3D visualization of solar windion data from the Chang’E-1 exploration. Computers & Geosciences 37,10 (2011), 1711–1718. 7, 9
Short Biographies
Fangfei Lan is a Ph.D. student in the Scientific Computingand Imaging (SCI) Institute, University of Utah. She is inter-ested in topological data analysis and visualization. She worksat the intersection between theories in topological data analysisand their practical applications in science and engineering. Email:[email protected].
Michael Young is a Master’s student in the Scientific Comput-ing and Imaging (SCI) Institute, University of Utah. His researchfocuses on building interactive visualization systems and explor-ing visualization methods for astronomy datasets. Email: [email protected].
Lauren Anderson is a Carnegie Postdoctoral Fellow at theCarnegie Observatories. She obtained her Ph.D. in Astronomy fromUniversity of Washington. She works on applying computationaldata analysis techniques to interesting astronomy problems. Cur-rently she is building a dust map of the Milky Way galaxy, and is inneed of novel visualization techniques for this large, rich data set.Email: [email protected].
© 2021 The Author(s)Computer Graphics Forum © 2021 The Eurographics Association and John Wiley & Sons Ltd.
662

Lan et al. / Visualization in Astrophysics
Anders Ynnerman is a Professor of Visualization at LinköpingUniversity and the director of the Norrköping Visualization Center.He also heading the Media and Information Technology divisionat Linköping University. His research in visualization focuses onlarge scale data visualization in a range of application domains,and visualization for science communication is a central applica-tion theme. He is the founder of the OpenSpace project and a pro-ducer of planetarium shows. In 2018 he received the IEEE VGTCTechnical Achievement Award. Email: [email protected].
Alexander Bock is an Assistant Professor at Linköping Univer-sity, Research Fellow at the University of Utah, and the Develop-ment Lead for the astrovisualization software OpenSpace. He usesvisualization techniques to create applications that can make dif-ficult data, for example CT/MRI scans or astronomical datasets,easier to understand for a specific target audience, such as domainexperts or the general public. Email: [email protected].
Michelle A. Borkin is an Assistant Professor in the Khoury Col-lege of Computer Sciences, Northeastern University. Her researchinterests include data visualization, human-computer interaction,and application work across domains including astronomy, physics,and medical imaging. She received a Ph.D. in 2014 and an M.S.in 2011, both in Applied Physics, and a B.A. in Astronomy andAstrophysics & Physics from Harvard University. She is the vi-sualization lead and original project member of the glue multi-dimensional linked-data exploration software, originally devel-oped for astronomy and designed to facilitate data analysis andvisualization for NASA’s James Webb Space Telescope. Email:[email protected].
Angus G. Forbes is an Associate Professor in the Departmentof Computational Media at University of California, Santa Cruz,where he directs the UCSC Creative Coding Lab. He received hisPh.D. and M.S. degrees from University of California, Santa Bar-bara. His visualization research investigates novel techniques forrepresenting and interacting with complex scientific information.Email: [email protected].
Juna A. Kollmeier is a staff member at the Carnegie Observato-ries where she is the Founding Director of the Carnegie TheoreticalAstrophysics Center. She is also the director of the fifth phase of theSloan Digital Sky Survey (SDSS; which started in October 2020).SDSS has been one of the foundational datasets in astrophysics butalso in data science more generally. SDSS pioneered the open-datamodel for large survey databases and is a major motivator of ad-vanced visualization techniques in astrophysics. Her research in-terests are in theoretical astrophysics concerning the growth of cos-mic structure on all scales. She works on cosmological hydrody-namics simulations as well as massively multiplexed spectroscopicdatasets. Email: [email protected].
Bei Wang is an assistant professor at the SCI Institute, Schoolof Computing, University of Utah. She works on topological dataanalysis and visualization. She received her Ph.D. in Computer Sci-ence from Duke University. She is interested in the analysis andvisualization of large and complex data. Her research interests in-clude topological data analysis, data visualization, computational
topology, computational geometry, machine learning and data min-ing. She is working on connecting data visualization with astron-omy data, in particular, using topological techniques to separatesignals from noise. Email: [email protected].
© 2021 The Author(s)Computer Graphics Forum © 2021 The Eurographics Association and John Wiley & Sons Ltd.
663