visualization of diseases at risk in the covid-19 literature
TRANSCRIPT

Visualization of Diseases at Riskin the COVID-19 Literature
Francis Wolinski
Yotta Conseil, France{forename.surname}@yotta-conseil.fr
This paper presents a project, named VIDAR-19, able to extract automatically dis-eases from the CORD-19 dataset, and also diseases which might be considered as riskfactors. The project relies on the ICD-11 classification of diseases maintained by theWHO. This nomenclature is used as a data source of the extraction mechanism, andalso as the repository for the results. Developed for the COVID-19, the project has theability to extract diseases at risk and to calculate relevant indicators. The outcome ofthe project is presented in a dashboard which enables the user to explore graphicallydiseases at risk which are put back in the classification hierarchy. Beyond the COVID-19, VIDAR has much broader applications and might be directly used for any corpusdealing with other pathologies.
1 Introduction
With the spread of the novel coronavirus, named SARS-CoV-2, and the corresponding diseaseCOVID-19 – which contaminated more than 3.4 million people and killed more than 240 thousandspeople as of 2 May 2020 [1] – many initiatives have been launched for powering research to controlthe epidemic.
One of the cross-cutting research priorities of the World Health Organization research roadmapdeals with vulnerable population subgroups. They include “those suffering with stigmatization, theelderly, those with co-morbidities and the immunocompromised” [2].
The fact is that reports on risk factors and comorbidities are spread in many publications anddo not provide an analytic view with actionable information[3]. Being able to collect automaticallysuch risk factors from literature and to provide a visualization of their importance is at stake.
We developed the project VIDAR-19 (VIsualization of Diseases At Risk in CORD-19) to copewith this problem. It is able to extract automatically from the CORD-19 dataset [4] all diseasesreferenced in the International Classification of Diseases (ICD-11) maintained by the WHO [5], aswell as the diseases which might be considered as risk factors.
Along with the extractions, the process calculates several indicators which are made available atdifferent levels of the ICD-11 classification. The results are showcased in a dashboard. It enablesthe user to explore and to visualize graphically in an intuitive and convenient way the diseases atrisk which are put back in the classification hierarchy.
1
arX
iv:2
005.
0084
8v1
[cs
.IR
] 2
May
202
0

2 Materials and Methods
In this project, the data sources are:
• the COVID-19 Open Research Dataset (CORD-19) including scientific papers from 5 differentsources [4];
• the International Classification of Diseases ICD-11 available on the WHO web site [5].
The overall project is performed in 3 steps:
• The first step loads and prepares the ICD-11 dataset and produces a repository able to storethe classification as well as the results of the extraction step. See details in subsection 2.1.
• The second step implements a mechanism for extracting from texts disease names of ICD-11,risk factors, and additional filters as well. See details in subsection 2.2.
• The third step calculates several indicators and provides meaningful visualizations on thediseases that have been found in the corpus and those which might be considered as riskfactors. See details in subsection 3.2.
This work has been implemented using the Python language and a few libraries of its DataScience and Natural Language Processing ecosystem.
2.1 Loading and preparation of ICD-11 classification
The ICD-11 classification is available in a spreadsheet collected from the WHO web site [5]. Thediseases in ICD-11 are organized in a classification hierarchy. For instance, the disease Pneumoniais classified as this:
Diseases of the respiratory system >Lung infections >Pneumonia
2.1.1 Loading of ICD-11
Two columns of this dataset are of interest in this project. The column Code stands for a uniquedisease identifier, and the column Title stands for the name of diseases. An extract of the rawdataset for the disease Pneumonia and its branch is shown below 1.
Code Title
6856 NaN Diseases of the respiratory system7002 NaN - Lung infections7003 CA40 - - Pneumonia
Figure 1: Extract of the raw ICD-11 (Pneumonia branch)
We can notice that in this dataset, the depth of the classification hierarchy is represented with atabulation prefix in the Title column of the spreadsheet, and materialized by a sequence of dashes.We can also notice that upper level branches of the classification do not hold any code (NaN values).
2

2.1.2 Preparation of ICD-11
To achieve our goal, we need to enhance this basic information into a higher level representation ofthe classification. The resulting dataframe object is organized with a column for each level in theclassification hierarchy, so that any disease is along with its full path from the root to itself.
If Harry Potter holds a wand, the Data Scientist has pandas [6]. In that case, there is no needfor latinized spells, but a clear and powerful API, which verbs that are obviously magic.
Code Title Level 0 1 2 3 4 5 6 7 8
6856 NaN Diseases of the respiratory system 0 Diseases of the respiratory system7002 NaN Lung infections 1 Diseases of the respiratory system Lung infections7003 CA40 Pneumonia 2 Diseases of the respiratory system Lung infections Pneumonia
Figure 2: Extract of the prepared ICD-11 (Pneumonia branch)
With this representation, any piece of information attached to a disease with a code – in columnsadded by a further process – will be also accessible from its upper levels in the classificationhierarchy.
2.2 Extraction of ICD-11 diseases and risk factors in COVID-19 literature
2.2.1 Preparation of the extraction
For this purpose, the flashtext [7] library is suitable to deal with complex disease names suchas those contained in the ICD-11. This library implements a powerful regular expression engine,named keyword processor able to search for phrasal keywords in any text and in a single pass.
In this project, 3 keyword processor instances are built:
• A first instance is initialized from ICD-11 disease names with a code (15,286 diseases inour case, since we do not consider entries after the branch External causes of morbidity ormortality of the classification, and we discard a few single-word entries which are sources ofambiguities). However some disease names need to be preprocessed prior entering them intothe keyword processor:
– Some names are often compound of 2 parts separated by a coma. For instance, thedisease: Coronavirus infection, unspecified site. In such cases, the rightmost part is anadditional information. It is discarded prior to feed the keyword processor in order tobetter match the literature which seldom mentions the full disease name.
– Some names are often not expressed in literature by using the official title used in theICD-11. For instance, the common noun cancer is more likely used than the official termcarcinoma. Here again, in order to better match the literature, those disease names areautomatically preprocessed to feed the keyword processor with synonyms. For instance,carcinoma of breast, specialised type is firstly transformed into carcinoma of breast (seeabove), and then completed automatically with the additional expression breast cancer.
– In addition, synonyms of diseases have also been used. They are accessible from the ICDAPI made available by the WHO [8].
• A second instance is initialized from a list of expressions representing risk factors or comor-bidities, such as: risk factor, high-risk factor, morbidity factor, comorbidity factor, etc. Alist of 40 expressions, including plural forms, dealing with risk factors has been establishedby using a bigram finder from the nltk library along with the Word2Vec algorithm from the
3

gensim library, to extend semi-manually the list with synonyms. This task is not detailed inthe present paper.
• A third instance is initialized from a list of expressions representing additional filters ofdocuments. In this project, we defined a single filter to tag the documents dealing explicitlywith the COVID-19 (disease or virus) by using alternatives expressions such as: SARS-CoV-2, COVID-2019, 2019-nCoV, etc. When activated, this filter selects 6,760 documents fromthe whole corpus.
In all cases, the idea is to build a comprehensive list of triggering expressions so as to maximizethe recall of the extracting/filtering process.
2.2.2 Processing of the COVID-19 corpus
The COVID-19 Open Research Dataset (CORD-19) is a growing resource of scientific papers onCOVID-19 and related historical coronavirus research [4].
In this project, for each document 5 pieces of information are directly collected: the data sourceit belongs to, the document id, and also the title, abstract and body text. The processing of adocument extracts 3 additional information thanks to the 3 keyword processor instances definedabove:
• unique ICD-11 codes of diseases which are mentioned in the whole document;
• unique ICD-11 codes of diseases which are mentioned along with risk factors or comorbiditiesin the document1;
• a boolean whether or not the document deals with the COVID-19 (disease or virus).
These information are organized by data source and by document, so as to produce later thevisualizations for the whole document repository, or for a selection of data sources, or again forthe documents selected by activating the additional filter. Moreover, this representation enables tomake incremental updates of the repository by adding continuously upcoming documents.
As of 2 May 2020, 48,410 documents have been processed (46,106 documents with a disease and5,153 documents with risk factors) with 15,286 diseases from ICD-11 (3,370 diseases found in thecorpus and 1,423 diseases with risk factors).
3 Results
3.1 Calculation of indicators
For the visualization, several indicators are calculated on 3 sets of diseases along with the classifi-cation hierarchy: diseases with a code in ICD-11 (S0); diseases found in the corpus (S1); diseasesat risk (S2). The calculations can be performed for the whole ICD-11 classification hierarchy, orfor a branch, and also for the whole corpus, or again for a subset of documents.
Let C be a considered set of documents from the corpus, S be a set of diseases, B a branch (ora sub-branch) of diseases, d a disease and n(d) the number of documents including the disease.
We define:
1The granularity is a paragraph: either the title, or abstract paragraphs, or again body text paragraphs.
4

• Share of a branch: |B||S| (applied to: S0, S1, S2), see 3.2.1;
• Occurrences of diseases in a branch:∑
d∈B n(d) (applied to: S1, S2), see 3.2.2;
• Document frequency of a disease: n(d)|C| (applied to: S1, S2), see 3.2.3.
3.2 Visualizations
The visualizations are produced with a few graphical libraries: matplolib [9] for stacked bar charts,its extension seaborn for bar charts, and also plotly [10] for treemap graphics (and also funnelgraphics not presented in this paper).
For the share and occurrences of branches, the user has the ability to select a specific branch toexplore, in order to figure out the over- or under-representation of some diseases.
3.2.1 Shares of branches
A stacked bar chart shows the shares of branches for the 3 sets of diseases defined above. Inthe figure below, the chart is produced for the whole ICD-11 classification 3. We notice an over-representation of the shares for several branches: e.g., Certain infectious or parasitic diseases (green,left), Diseases of the immune system (gray, left), Endocrine, nutritional or metabolic diseases (cyan,left), Diseases of the circulatory system (pink, middle), Diseases of the respiratory system (blue,middle), Symptoms, signs or clinical findings, not elsewhere classified (red, right).
This chart can also be produced for a specific branch, below Endocrine, nutritional or metabolicdiseases 4. We notice an over-representation of the shares for: Endocrine diseases (blue) andNutritional disorders (blue).
3.2.2 Occurrences of diseases by branch
The following 2 treemap graphics are based on the occurrences of the 2 sets of diseases definedabove (in the corpus vs. at risk) by branch. These graphics provide some fisheye views on theICD-11 classification hierarchy, with high level of detail in the focus areas [11], which is in our caserelated to the number of occurrences.
These graphics can be produced for the whole ICD-11 classification 5 6. We notice in thesecond treemap graphics an over-representation of several branches: e.g., Diseases of the respiratorysystem (blue), Endocrine, nutritional or metabolic diseases (cyan), Diseases of the circulatorysystem (pink).
These treemap graphics can also be produced for a specific branch, here Endocrine, nutritionalor metabolic diseases 4. We notice an over-representation for: Obesity (blue) and Diabetes (green).
3.2.3 Document frequency of diseases
Beyond these meaningful graphics, it is possible to compare the document frequency of the diseaseswhich have the highest gap between the 2 sets of diseases defined above (at risk vs. in the corpus).Below, we present the chart obtained when activating the additional filter for documents dealingexplicitly with the COVID-19 (disease or virus) 9.
We compare in a later section the list of diseases mentioned in this chart with the lists of diseasesat risk that have been already published for the COVID-19, see 4.1.
5
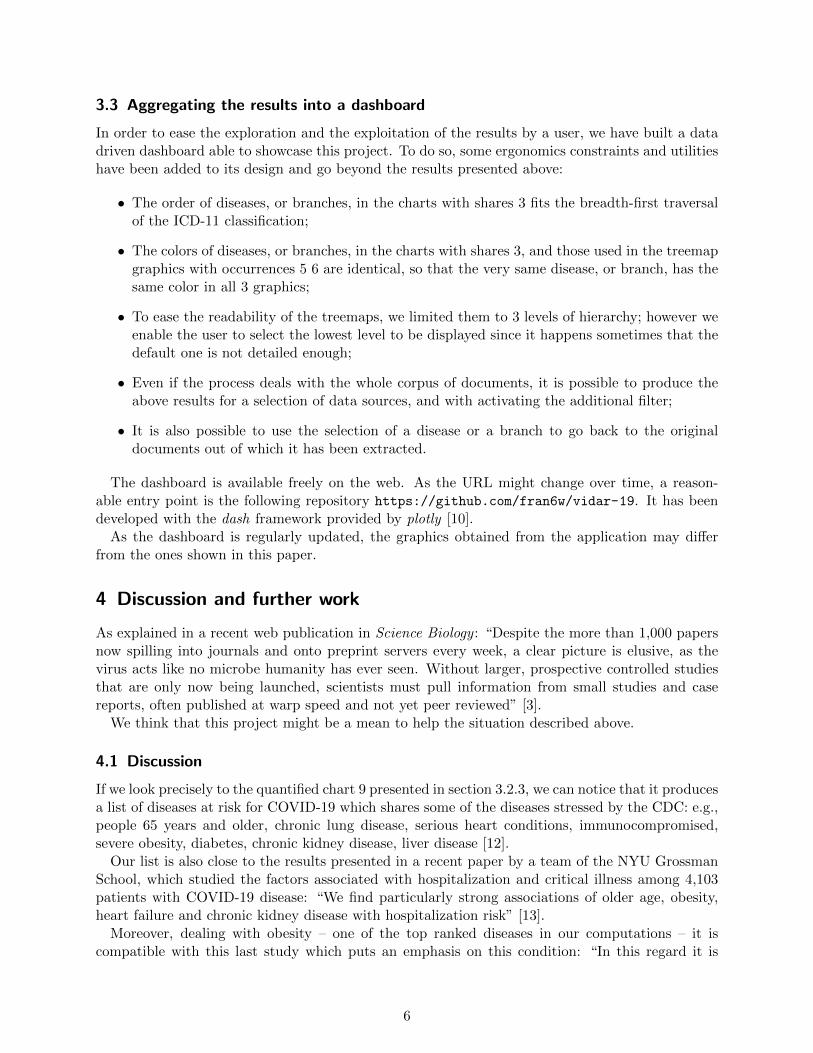
3.3 Aggregating the results into a dashboard
In order to ease the exploration and the exploitation of the results by a user, we have built a datadriven dashboard able to showcase this project. To do so, some ergonomics constraints and utilitieshave been added to its design and go beyond the results presented above:
• The order of diseases, or branches, in the charts with shares 3 fits the breadth-first traversalof the ICD-11 classification;
• The colors of diseases, or branches, in the charts with shares 3, and those used in the treemapgraphics with occurrences 5 6 are identical, so that the very same disease, or branch, has thesame color in all 3 graphics;
• To ease the readability of the treemaps, we limited them to 3 levels of hierarchy; however weenable the user to select the lowest level to be displayed since it happens sometimes that thedefault one is not detailed enough;
• Even if the process deals with the whole corpus of documents, it is possible to produce theabove results for a selection of data sources, and with activating the additional filter;
• It is also possible to use the selection of a disease or a branch to go back to the originaldocuments out of which it has been extracted.
The dashboard is available freely on the web. As the URL might change over time, a reason-able entry point is the following repository https://github.com/fran6w/vidar-19. It has beendeveloped with the dash framework provided by plotly [10].
As the dashboard is regularly updated, the graphics obtained from the application may differfrom the ones shown in this paper.
4 Discussion and further work
As explained in a recent web publication in Science Biology : “Despite the more than 1,000 papersnow spilling into journals and onto preprint servers every week, a clear picture is elusive, as thevirus acts like no microbe humanity has ever seen. Without larger, prospective controlled studiesthat are only now being launched, scientists must pull information from small studies and casereports, often published at warp speed and not yet peer reviewed” [3].
We think that this project might be a mean to help the situation described above.
4.1 Discussion
If we look precisely to the quantified chart 9 presented in section 3.2.3, we can notice that it producesa list of diseases at risk for COVID-19 which shares some of the diseases stressed by the CDC: e.g.,people 65 years and older, chronic lung disease, serious heart conditions, immunocompromised,severe obesity, diabetes, chronic kidney disease, liver disease [12].
Our list is also close to the results presented in a recent paper by a team of the NYU GrossmanSchool, which studied the factors associated with hospitalization and critical illness among 4,103patients with COVID-19 disease: “We find particularly strong associations of older age, obesity,heart failure and chronic kidney disease with hospitalization risk” [13].
Moreover, dealing with obesity – one of the top ranked diseases in our computations – it iscompatible with this last study which puts an emphasis on this condition: “In this regard it is
6

notable that the chronic condition with the strongest association with critical illness was obesity,with a substantially higher odds ratio than any cardiovascular or pulmonary disease”.
We think that theses early findings validate our approach.A point is that the system does not take into account the number of cases reported in the articles,
and this might introduce a bias into the results. Our position is that this number is implicitlycontained within the number of articles, since a high-risk factor will likely be more frequentlyreported than a low-risk one.
4.2 Further work
In this paper, we have presented, VIDAR-19, a piece of software able to extract automaticallydiseases at risk in a corpus of documents, which has been specifically applied to the COVID-19 literature. Beyond the coronavirus disease, we think that this project has a much broaderapplications:
• Processing any corpus of scholarly articles dealing with other pathologies in order to visualizeand to explore the diseases at risk related to this pathology.
• Processing any corpus but looking for disease contexts other than risk factors, e.g. geneticvariations, molecules therapy.
• Processing other corpus and extending to other classification hierarchies: e.g., geographictaxonomies, phylogenetic nomenclatures.
Beyond its dramatic aftermath, we think that the COVID-19 is an opportunity to develop meth-ods and tools that might be useful in other cases.
Acknowledgments
We would like to thank Prof. Jean-Franois Perrot and Frantz Vichot for their useful commentson this project.
References
[1] Worldometer, “Covid-19 coronavirus pandemic.” https://www.worldometers.info/
coronavirus/, last accessed: 2020-04-30, 2020.
[2] World Health Organization, “A coordinated global research roadmap: 2019 novelcoronavirus.” https://www.who.int/blueprint/priority-diseases/key-action/Global_
Research_Forum_FINAL_VERSION_for_web_14_feb_2020.pdf, last accessed: 2020-04-07,2020.
[3] M. Wadman, J. Couzin-Frankel, J. Kaiser, and C. Matacic, “How does coronavirus kill? clini-cians trace a ferocious rampage through the body, from brain to toes,” Science Biology, 2020.
[4] L. L. Wang, K. Lo, Y. Chandrasekhar, R. Reas, J. Yang, D. Eide, K. Funk, R. Kinney, Z. Liu,W. Merrill, P. Mooney, D. A. Murdick, D. Rishi, J. Sheehan, Z. Shen, B. Stilson, A. D. Wade,K. Wang, C. Wilhelm, B. Xie, D. M. Raymond, D. S. Weld, O. Etzioni and S. Kohlmeier,“CORD-19: The COVID-19 Open Research Dataset,” ArXiv e-prints, 2020, 2004.10706v2[cs.DL].
7

[5] World Health Organization, “International classification of diseases for mortality and morbiditystatistics (11th revision).” https://icd.who.int/browse11/l-m/en, last accessed: 2020-03-27, 2018.
[6] W. McKinney, “Data structures for statistical computing in python,” Proceedings of the 9th
Python in Science Conference, 2010.
[7] V. Singh, “Replace or retrieve keywords in documents at scale,” ArXiv e-prints, 2017,1711.00046v2 [cs.DS].
[8] World Health Organization, “ICD API.” https://icdapihome.azurewebsites.net/
icdapi/, last accessed: 2020-04-30, 2019.
[9] J. D. Hunter, “Matplotlib: A 2d graphics environment,” Computing in Science & Engineering,2007.
[10] Plotly Technologies Inc., “Collaborative data science.” https://plot.ly, 2015.
[11] J. Abello, S. G. Kobourov, and R. Yusufov, “Visualizing large graphs with compound-fisheyeviews and treemaps,” Lecture Notes in Computer Science, 2004.
[12] Centers for Disease Control and Prevention, “Groups at higher risk for severe ill-ness.” https://www.cdc.gov/coronavirus/2019-ncov/need-extra-precautions/
groups-at-higher-risk.html, last accessed: 2020-04-10, 2020.
[13] C. M. Petrilli, S. A. Jones, J. Yang, H. Rajagopalan, L. F. O’Donnell, Y. Chernyak, K. Tobin,R. J. Cerfolio, F. Francois, and L. I. Horwitz, “Factors associated with hospitalization andcritical illness among 4,103 patients with covid-19 disease in new york city,” medRxiv, 2020,https://www.medrxiv.org/content/early/2020/04/11/2020.04.08.20057794.full.pdf.
8

Figure 3: Comparison of the shares of branches for the whole ICD-11 classification
Figure 4: Comparison of the shares of diseases for the Endocrine, nutritional or metabolic diseasesbranch
9

Figure 5: Occurrences of diseases in the corpus (all branches)
Figure 6: Occurrences of diseases at risk (all branches)
10

Figure 7: Occurrences of diseases in the corpus (Endocrine, nutritional or metabolic diseasesbranch)
Figure 8: Occurrences of diseases at risk (Endocrine, nutritional or metabolic diseases branch)
11
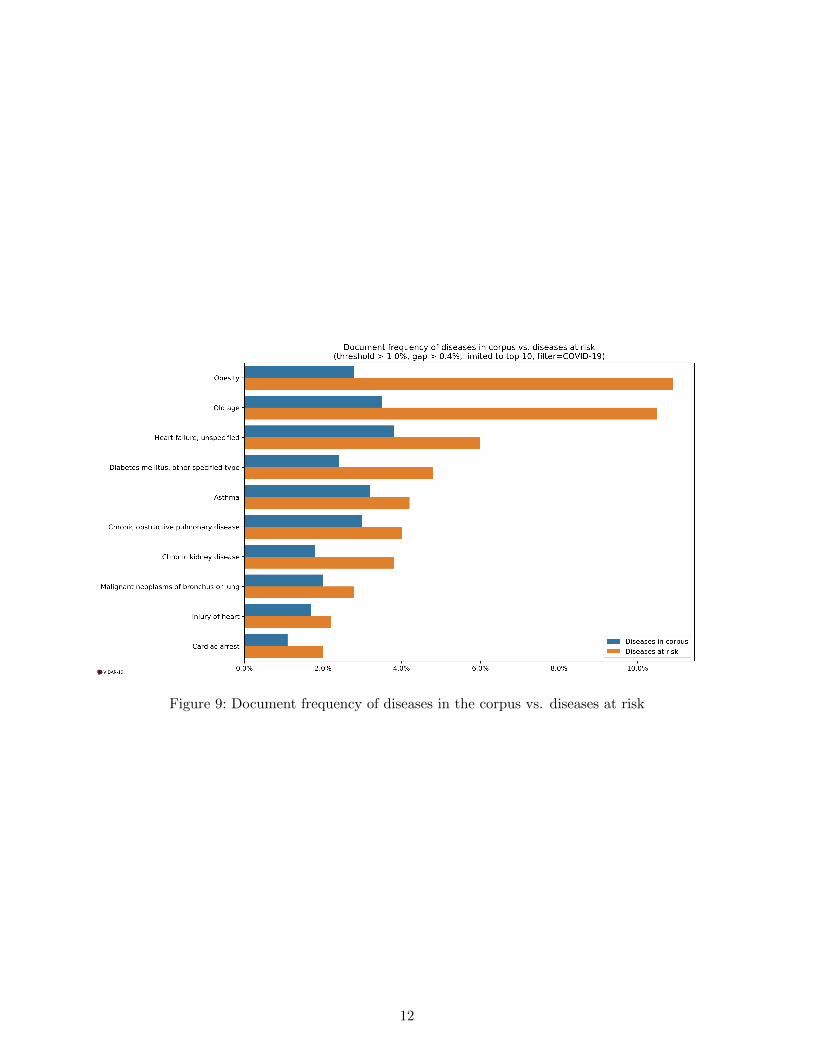
Figure 9: Document frequency of diseases in the corpus vs. diseases at risk
12