visualization of distribution system planning for...
TRANSCRIPT

Turk J Elec Eng & Comp Sci
(2017) 25: 2871 – 2884
c⃝ TUBITAK
doi:10.3906/elk-1602-178
Turkish Journal of Electrical Engineering & Computer Sciences
http :// journa l s . tub i tak .gov . t r/e lektr ik/
Research Article
Visualization of distribution system planning for engineers and decision-makers
Tomislav CAPUDER, Hrvoje PANDZIC∗, Igor KUZLEFaculty of Electrical Engineering and Computing, University of Zagreb, Croatia
Received: 12.02.2016 • Accepted/Published Online: 11.11.2016 • Final Version: 30.07.2017
Abstract: Planning of an electric distribution network is a complex task, requiring a comprehensive approach that
includes collecting and analyzing large amounts of technical and nontechnical data. In addition, the outcome of the
planning procedure needs to be supported by economic analysis that provides pathways for future investments. In order
to present the planning results to various groups of people, such as technical staff, managers, and politicians, different
visualization techniques are used. Data visualization, as a branch of descriptive statistics, is important to understand and
present information in an effective manner. The basic idea of visualization is to present data in a visual form, allowing
a person to get a quick insight into the data, draw conclusions, and directly interact with the data. Some traditional
methods, such as graphs, histograms, 2D column and line charts, single line diagrams, and 3D surfaces with contours,
are mandatory for visualizing power data. However, in the electric power system business there is a growing need for
geographically referenced visualization. While there is a lot of research being done on visualizing data in transmission
power systems, the number of studies on display methods in distribution power systems is limited. The focus of this
paper is the visualization of data used during the distribution network planning process.
Key words: Data visualization, distribution network planning, geographical referencing
1. Introduction
Distribution network planning is an ongoing task that needs to be conducted systematically in order to
support the long-term goals. The main challenge is to strive towards long-term goals in an effective manner,
simultaneously solving all current and short-term problems appearing in the network.
The initial and the most important step in distribution system planning is gathering all the data relevant
for both short- and long-term planning. This includes technical data (load curves and information on all
the distribution system elements) and population data, as well as foreseen investments in both demand and
generation facilities. The next step is the identification of current problems and issues that need to be fixed in
the shortest time frame. However, these solutions need to be compatible with the long-term goals, as otherwise
they represent an unnecessary investment. Although there is no perfect distribution system planning solution,
good distribution system planning studies are able to reach long-term goals while seamlessly incorporating
solutions to current and short-term problems.
There is a fair amount of both scientific and technical literature available on the topic of distribution
system planning. Most of the older work was focused on increasing reliability, e.g., [1–3]. Although reliability is
still an important issue in distribution system planning [4–6], the focus has recently moved towards an effective
integration of distributed generation [7–10] and demand response [11]. An elaborate review of distribution power
∗Correspondence: [email protected]
2871
CAPUDER et al./Turk J Elec Eng & Comp Sci
system planning methods is presented in [12]. However, all of these papers present mathematical formulations
accompanied by theoretical case studies. Although planning studies are technically very demanding, practical
experience has shown that the representation and interpretation of results to the technical staff and especially
to the decision makers is of vital importance for the proposed plan to be accepted and followed. This paper
presents various visualization techniques in distribution network planning developed over the years based on
feedback from the Croatian national distribution system operator (DSO) and ideas extracted from the available
literature [13]. While some of them are suitable for strictly engineering purposes, others are intended to be
used in executive summary reports prepared for decision makers. The visualization techniques presented in the
following sections bring some relevant contributions to the field of distribution system planning:
- Comprehensive and systematic way of summarizing input data. While the available literature offers
theoretical background on methodologies for distribution network planning, practical experience shows
that up to 50% of the data needed are not systematically collected and available for planning studies. In
this sense, this paper analyzes different data sources and formats that can be used as inputs into a planning
procedure. In the absence of detailed measurements (usually very few measurements in distribution
networks are available beyond secondary substations), different sources can be used to create a more
detailed representation of the current, and consequently future, state of a distribution network.
- Visualization of planning results suitable for engineers. This paper recognizes the need to visualize the
planning results to the planning personnel, the maintenance personnel, and other engineering personnel as
each of them perceives distribution grid problems from a different perspective. This means that the current
distribution network states and layouts, but more importantly future distribution network plans, need to
be visualized in both geospatial and schematic representations. These visualizations should indicate areas
close to the borders of technical constraints, indicating critical points for maintaining reliability of supply
for the final consumers.
- Visualization of planning results to financial decision makers. The paper proposes several solutions
to bridge the gap often present between the engineering and financial sectors. While the engineering
implementation is the essential part of planning, without a clear visualization of the required investments
the planning process is almost futile. Without a clear financial background supporting planning decisions,
the needed investments are often reduced if not cut back entirely. The planning proposals are thus
presented in a clear manner giving insight to decision makers on the pros and cons of making a specific
investment decision. In this context, the proposed visualization relies on existing indicators, intuitive to
the DSO, for planning and monitoring of quality of electricity supply, such as system average interruption
duration index (SAIDI) and system average interruption frequency index (SAIFI).
The rest of the paper is divided into five sections as follows: Section 2 elaborates the distribution system
planning procedure, proposing a concept shown in Figure 1 and explaining in detail the benefits of creating a
unified framework for input data and their visualization. Section 3 provides an insight into distribution system
planning issues and different methods for visualization of the results to utility engineers. In Section 4 we propose
several solutions for visualizing results and the need for investments to the decision-makers. Finally, Section 5
provides the relevant conclusions.
The overview of the visualization methods presented in this paper is the result of the authors’ experience
in conducting a number of distribution system planning studies in Croatia. The distribution network of Croatia
is divided into 21 distribution control areas (DCAs), each with its specifics in terms of size, spatial load density,
2872

CAPUDER et al./Turk J Elec Eng & Comp Sci
Figure 1. Multilayer concept of different stages of distribution network planning.
consumption profiles, age of the equipment, and unique operating issues. The Croatian DSO is constantly
conducting distribution network planning studies, recognizing each the specifics of each DCA, but insisting on
a universal approach when it comes to technical and economic analyses.
2. Visualization concepts for planning a distribution grid
In a deregulated and competitive environment the key parameter in planning distribution networks is the
investment costs. One of the main goals is to reduce losses and operational costs while maintaining the quality of
service keeping the investments as low as possible. Therefore, economic parameters, such as costs of undelivered
energy and cost/benefit analysis, are gaining more attention in the planning process and becoming a dominant
factor when making decisions.
In general, the technical component of the planning process can be broken down to these tasks, as shown
in Figure 2:
- Acquisition of all the parameters of the distribution grid;
- Data preparation and adjustment;
- Development and validation of the initial model of the grid;
- Analysis of the demographic data;
- Load and consumption forecasts;
- Detailed network analyses including but not limited to power-flow calculation, voltage profiles calculation,
reliability analysis, short circuit analysis, losses calculation;
- Definition of the optimal network configuration;
- Contingency analysis;
- Analysis of transitions to desired voltage levels.
2873

CAPUDER et al./Turk J Elec Eng & Comp Sci
Figure 2. Flow diagram of the technical aspects of the distribution system planning process.
The planning process begins with collection and processing of a large amount of data available for a
distribution area. The quality and quantity of these data vary depending on the planning area and, although
the DSO makes a preliminary quality check of the data, it is difficult to argue there is a universal starting point
when it comes to the input information.
2.1. Geographical referencing of all distribution grid elements
The available literature indicates that the geographical information system (GIS) is a prerequisite for distribution
system planning [14–17]. A presentation of the NREL’s GIS-based real-time state estimation model is available
in [18]. The authors of [18] confirm that, although this seems quite straightforward and logical, even these days
there is surprisingly little digital information that enables GIS. Unfortunately, in reality very few distribution
areas have their network elements georeferenced. Even if georeferenced data exist, they are usually not
2874

CAPUDER et al./Turk J Elec Eng & Comp Sci
integrated with the data warehouse containing equipment characteristics, age, or any other relevant planning
and maintenance data. In Figure 1 this is called GIS 1.0: a simplified version of georeferenced lines and dots
without any additional information. The initial step in the planning process is creating a useful GIS system.
To increase the quality of the planning results, in particular the visual presentation of the results, additional
tools have been developed. Even though these tools are primarily developed as planning and calculation tools,
additional benefits can be recognized in creating a unified method for data collection and processing particularly
valuable for future planning needs.
The initial step is to create a connection between the existing, if any, geographical information system
(GIS 1.0 in Figure 1) and the belonging database of the grid elements (TIS database). This creates the so-called
GIS 2.0. There are several methods of visualization of the distribution grid among which the most commonly
used is Google Earth base with added distribution network units locations, as shown in Figure 3. A connection
with the network analysis software is needed in order to provide valuable information on demand trends in
various parts of the network. Usually, GIS applications contain a spatial analysis tool and feature statistics
and geo-processing tools enabling a statistical analysis and breakdown structure of geo-referenced elements by
their type, age, capacity etc. giving further insights into which locations require investments [19]. Creating a
GIS platform should also be considered one of the most important steps in integrating alternative options to
“more copper” in both distribution network operation and planning. The importance of GIS lays not only in
visualization of the parts of the network operating close to their technical limits, but also as a central tool and
a unified database for multiple advanced modules to assist in operation and planning.
Figure 3. Geographical representation of 110 and 35 kV network of a Croatian DCA (green – 110 kV lines; blue – 35
kV lines; red – 35 kV cables).
Optimization software, CADDiN, has been developed at the Faculty of Electrical Engineering and
Computing, University of Zagreb, to determine the optimal grid layout for ”green” and ”brown” field problems
[20]. This software visualizes the results in the GIS 2.0 environment.
Each planning process begins with the input data collection and processing. Although visualization is
2875

CAPUDER et al./Turk J Elec Eng & Comp Sci
not of vital importance at this level, the concepts presented in this section can be regarded as a framework
for future planning. A good planning process requires repeated review of the planning results, usually every 5
years, and adjustments in accordance with the realization of the previous plans. Having a unified input data
collection methodology increases the quality of the planning process.
3. Visual presentation of the planning results to the utility engineers
Power system analyses, which involve handling of large data, inevitably imply using effective visualization
methods to facilitate analysis and assist the user in obtaining a clear understanding of the present state of the
system. Using analytical and nonanalytical methods for modeling the range of input data for present and future
years can help determine the most probable and the worst case development scenarios. While this is a common
technical problem when it comes to modeling and power flow simulations, power/energy losses, voltage drops,
and other network analyses, the visualization and presentation of results must be done in a unified and easily
understandable way.
The process of visualization for engineers is tightly correlated with the technical analyses conducted and
it is impossible to elaborate on visualization techniques without discussing the analytical process that precedes
them. The rest of this section discusses basic analyses in the planning process, but focuses on the methodology
for presenting the results.
3.1. Load and consumption representation
Available data on load and consumption largely depend on the number of advanced meters installed in a specific
DCA [21]. Although the idea of installing advance meter reading (AMR) infrastructure in every household is
emerging, in reality these are installed in industrial facilities, small and medium enterprises, and only a portion
of households. Consequently, exact consumer profiles for households are usually not available when planning a
distribution system. On the other hand, consumption profiles from the interface with the transmission network
are available, which helps approximate the missing household loads. As a starting point, consumer types are
defined, as shown in Figure 4. Load modeling of small consumers is performed using replacement curves of
standardized consumer types depending on their location and behavior. We created seven replacement curves
for urban and rural areas, residential and commercial objects, public lighting, households with electric and
district heating, weekend houses, and small industry, approximating their consumption for the work day and
for each day of the weekend. The share of each of these seven types is then defined for each 10(20)/0.4 kV
substation. The sum of all load profiles results in the overall load, which is balanced to the total consumption
profile collected at the interface point with the transmission system. Smaller adjustments are made to fit the
results with an acceptable level of error. While bar and pie charts are one of traditional techniques to visualize
static or dynamic data, a 3D surface with contour visualization of load profiles at the interface with transmission
is shown in Figure 5.
Load and consumption forecasting methods can roughly be divided into two main groups:
• Independent methods are based on the actual consumption data from the past and are defined only as
a function of time. Each of the methods for load and consumption forecasting is fitted to the available
historical data; the one having the smallest deviation in correlating to the data in the past is selected for
future load and consumption forecast.
• In dependent methods, load and consumption in the future are determined as a function of various factors,
which are characteristic for the area of interest. While these methods tend to give a better insight into
2876

CAPUDER et al./Turk J Elec Eng & Comp Sci
Figure 4. Bar chart of the number and the installed capacity of the 10(20)/0.4 kV transformers.
Figure 5. Load diagram of all DCAs in Croatia in 2012.
trends of the observed area (economical, population growth, land usage), they require a larger set of
input data. Although the availability of these data is increasing as the centers for statistics include more
data and higher resolutions into their questionnaires, in practice these methods have been inapplicable,
especially when making load and consumption forecasts for smaller areas.
Regardless of the selected method, the shorter the forecast horizon is, the more accurate the forecast will
be. Long-term planning studies are conducted for a period of at least 20 years in the future and the planners
need to take into account the uncertainties of the load and consumption estimates they make today. The entire
complex process of forecasting as accurately as possible is usually of little interest to the utility engineers. Figure
6 provides an example of a forecasting method, including the historical consumption data points.
3.2. Network analyses visualization
Starting from the initial reference scenario, which should present the current state of the grid as accurately as
possible, these analyses are conducted for each planning horizon, usually in 5-year increments. Results obtained
by these analyses serve as the initial indicator of problems in the grid, but also as a confirmation that the
investments suggested to correct these are appropriate. These results need to be clear and useful to a number of
specialty engineers ranging from maintenance to field engineers at the utility company. While maintenance
engineers will prefer visualization of different supply directions to the final consumer in a geographically
referenced network model, on-field personnel prefer a traditional “unbundled” block scheme of the network
2877

CAPUDER et al./Turk J Elec Eng & Comp Sci
Figure 6. Presentation of the forecasting results with best fitting method.
highlighting potential problems. The reasons for these preferences are mostly historical as distribution grid
planning predates computer technology. In addition, the ”unbundled” or single line schemes were the backbone
of the old supervisory control and data acquisition (SCADA) systems and on-field engineers base their education
on these concepts and understanding of the grid.
A compressive approach is achieved by combining a single line diagram coupled with a geographically
referenced map, as shown in Figure 7.
Figure 7. An example of geo-referenced map and single line scheme of 110–30 kV distribution level.
In practice, it is difficult to present the results of a network analyses with a large number of network
elements and summarizing results of each element in a table is not useful. In Figure 8, two different concepts
are shown: the first one shows the values for each line, node, and substation while the second one presents
contour visualization of the same results [22,23]. Contour visualization is a method of connecting points of
2878

CAPUDER et al./Turk J Elec Eng & Comp Sci
equal elevation and although it needs to be supported with tables containing element results, it is an excellent
way of indicating initial problems in the distribution grid [24]. Presenting results in such a way is particularly
useful when presenting contingency, or N − 1, analyses showing an alternative way of supplying the demand
when grid values are near the values of violating security constraints. Dynamic pie charts are an alternative
solution to visualize the magnitude of line loading [22]. The idea is to have a pie chart appear on the line if it
is overloaded or is close to overload. This will draw the operator’s attention to the problem. When comparing
two methods of visualization in Figure 8, it becomes rather clear that the contour presentation in combination
with pie chart presentation gives a clearer insight into current or planned distribution network status.
Figure 8. Different visualization concepts of distribution network analysis results.
An interesting way to present voltage profile through the network is the radar chart shown in Figure 9.
In a clear and straightforward way extreme voltage values over all buses are summarized in a single figure.
Figure 9. Voltage rose visualizing node voltages during peak and off-peak conditions in a distribution network.
2879

CAPUDER et al./Turk J Elec Eng & Comp Sci
4. Visualization of planning results for strategic decision-makers
Regardless of the quality of the planning procedure and the results visualization for engineers, visualization of the
suggested future investments is the one that provides a framework to the management and financial structures for
the required short- and long-term investments into the grid. For this reason, a structural graphical representation
is developed showing planning costs and investment distribution for each planning phase presenting the results in
a transparent way. Alongside time distribution, the proposed structure descriptively elaborates the investments
by voltage levels, pieces of equipment, and technology.
4.1. Strategic planning decisions
One of the key strategic goals of the Croatian DSO is to replace the current three-level distribution voltage
system, namely 110 kV, 35 kV and 10 kV, with a two level system, namely 110 kV and 20 kV, which will result
in lower maintenance cost, improved voltage levels, lower losses, and other benefits. However, it is not possible
to simply eliminate a voltage level, as this is a process lasting for decades. While some locations of the present
110/35 kV substations will simply be substituted by 110/20 kV substations, most will require a technically more
demanding analysis. The decisions are supported by the proposed analytic hierarchy process (AHP) method.
The benefits of transition to the two-voltage level system have been calculated and are shown on the left-hand
side of Figure 10. The benefits are scaled to the maximum value 1.0 and are calculated based on 5 indicators:
Figure 10. Breakdown structure on 20 kV distribution systems planning and investment priority visualization.
- Readiness of the network for the transition to the two-voltage level system – represents the portion of
equipment already prepared to run at 20 kV;
- Utilization of the current network and trend of the consumption – represents the need for upgrades of the
network with respect to the current and expected loadings;
- Voltage quality – quantifies the parts of the network with too low or too high voltage;
- Reliability of supply – represents reliability indicators explained in the following subsection;
- Secondary indicators – show if the surrounding networks are already operating at 20 kV and if there
are investors willing to contribute to 20 kV equipment, e.g., investors in distributed energy sources or in
industry facilities.
2880
CAPUDER et al./Turk J Elec Eng & Comp Sci
Comparing investment cost needed to achieve these benefits results in visualization as on the right-hand
side of Figure 10.
4.2. Reliability indictors
The quality of costumer supply is best described using reliability indicators providing the information on the
system average interruption duration (SAIDI), system average interruption frequency (SAIFI), and customer
average interruption duration (CAIDI).
These factors are used to calculate energy not supplied (ENS) for a specific area. Equations for calculating
these indices are given in (1) to (4):
SAIDI =
NSSN∑i=1
UVi ·Ni
NSSN∑i=1
Ni
(1)
SAIFI =
NSSN∑i=1
λFi ·Ni
NSSN∑i=1
Ni
(2)
CAIDI =
NSSN∑i=1
UVi ·Ni
NSSN∑i=1
λFi ·Ni
(3)
ENS =
NSSN∑i=1
UVi · Psri, (4)
where
T total period used for calculations (usually one year = 8760 h),
Ni total number of consumers at node i ,
UV i unavailability of supply at node i expressed in hours,
λFi frequency of interruptions at node i (faults/year),
NK total number of customers with at least one interruption over a period of one year,
NSSN total number of nodes in the analyzed part of the distribution grid,
Psri average load at node i .
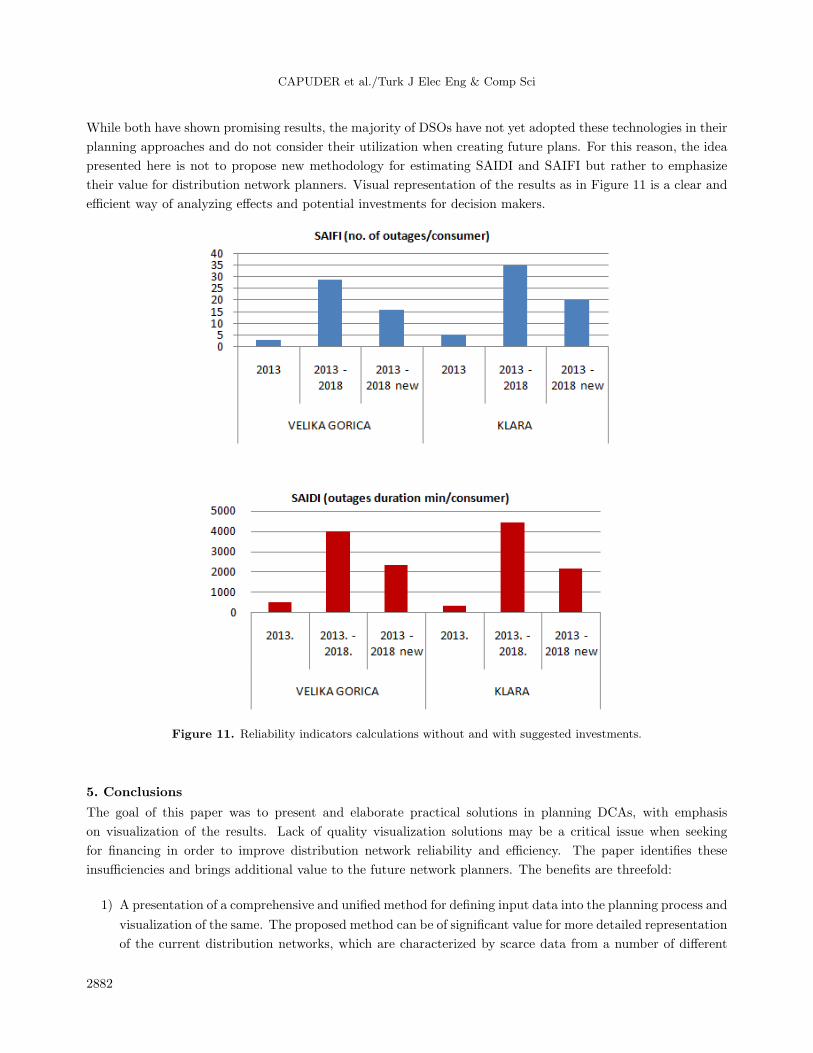
The reliability indicators are calculated for the current network state and for the following 5-year period.
An example of these values is shown in Figure 11. Values for the planned period, years 2013 to 2018, are
shown as twofold: first for the ”business as usual” case and second with the proposed investments and increased
reliability. These investments are usually focused on remote switchgear and finding alternative supply points,
closing as many feeders as possible in the so-called loop layouts. Increasing the reliability and quality of supply
indices is in fact of major concern for the DSO. Insufficient SAIDI and SAIFI values are considered key indicators
for further investments. Recent research is focused on increasing the reliability of supply and enhancing the
quality of electricity through novel technologies such as storage or services such as demand response [25,26].
2881
CAPUDER et al./Turk J Elec Eng & Comp Sci
While both have shown promising results, the majority of DSOs have not yet adopted these technologies in their
planning approaches and do not consider their utilization when creating future plans. For this reason, the idea
presented here is not to propose new methodology for estimating SAIDI and SAIFI but rather to emphasize
their value for distribution network planners. Visual representation of the results as in Figure 11 is a clear and
efficient way of analyzing effects and potential investments for decision makers.
Figure 11. Reliability indicators calculations without and with suggested investments.
5. Conclusions
The goal of this paper was to present and elaborate practical solutions in planning DCAs, with emphasis
on visualization of the results. Lack of quality visualization solutions may be a critical issue when seeking
for financing in order to improve distribution network reliability and efficiency. The paper identifies these
insufficiencies and brings additional value to the future network planners. The benefits are threefold:
1) A presentation of a comprehensive and unified method for defining input data into the planning process and
visualization of the same. The proposed method can be of significant value for more detailed representation
of the current distribution networks, which are characterized by scarce data from a number of different
2882
CAPUDER et al./Turk J Elec Eng & Comp Sci
format sources. In addition, the proposed methodology focuses on creating visual representation through
GIS as a central point for developing advanced modules that should be of high relevance in planning future
low carbon distribution networks.
2) The proposition of a framework for unified visualization techniques for utility engineers, taking into account
their field of expertise. Again, this contribution emphasizes the aspect of developing advance GIS platforms
but also focuses on traditional ways of network layout representations.
3) Development of the concept of visually presenting results in a simple to understand way to the decision
makers, elaborating the need for investments into future distribution system development. This aspect is
usually the most neglected one, often preventing realization of good distribution plans due to insufficient
funds. The paper demonstrates a simple way of visualizing the effectiveness of investments for the proposed
distribution network plan to the decision makers in utility companies.
References
[1] Kjolle G, Rolfseng L, Dahl E. The economic aspect of reliability in distribution system planning. IEEE T Power
Deliver 1990; 5: 1153-1157.
[2] Goel L, Billinton R. Determination of reliability worth for distribution system planning. IEEE T Power Deliver
1994; 9: 1577-1583.
[3] Tang Y. Power distribution system planning with reliability modeling and optimization. IEEE T Power Syst 1996;
11: 181-189.
[4] Lotero R, Contreras J. Distribution system planning with reliability. IEEE T Power Deliver 2011; 26: 2552-2562.
[5] Ziari I, Ledwich G, Ghosh A, Platt G. Integrated distribution systems planning to improve reliability under load
growth. IEEE T Power Deliver 2012; 27: 757-765.
[6] Lakervi E, Holmes EJ. Electricity Distribution Network Design. 2nd ed. London, UK: The Institution of Engineering
and Technology, 2003.
[7] El-KhattamW, Hegazy YG, Salama MMA. An integrated distributed generation optimization model for distribution
system planning. IEEE T Power Syst 2005; 20: 1158-1165.
[8] Zou K, Prakash A, Muttaqi K, Perera S. Distribution system planning with incorporating DG reactive capability
and system uncertainties. IEEE T Sust Ener 2012; 3: 112-123.
[9] Naderi E, Seifi H, Sepasian MS. A dynamic approach for distribution system planning considering distributed
generation. IEEE T Power Deliver 2012; 27: 1313-1322.
[10] Al Kaabi SS, Zeineldin HH, Khadkikar V. Planning active distribution networks considering multi-DG configura-
tions. IEEE T Power Syst 2014; 29: 785-793.
[11] Arasteh H, Sepasian MS, Vahidinasab V. An aggregated model for coordinated planning and reconfiguration of
electric distribution networks. Energy 2016; 94: 786-698.
[12] Georgilakis PS, Hatziargyriou N. A review of power distribution planning in the modern power systems era: models,
methods and future research. Electr Pow Syst Res 2015; 121: 89-100.
[13] Nga DV, See OH, Quang DN, Xuen CY, Chee LL. Visualization techniques in smart grid. S G Renew Energ 2012;
3: 175-185.
[14] Cai YX, Chow MY. Exploratory analysis of massive data for distribution fault diagnosis in smart grids. In: IEEE
Power Eng Soc; 26–30 July 2009; Calgary, Canada. New York, NY, USA: IEEE; pp. 1-6.
[15] Overbye TJ. Wide-area power system visualization with geographical data views. In: IEEE Power Eng Soc; 20–24
July 2008; Pittsburgh, USA. New York, NY, USA: IEEE; pp. 1-3.
2883

CAPUDER et al./Turk J Elec Eng & Comp Sci
[16] Maguire DJ, Batty M, Goodchild MF. GIS, Spatial Analysis, and Modelling. Redlands, CA, USA: ESRI Press,
2005.
[17] Weber JD, Overbye TJ. Voltage contours for power system visualization. IEEE T Power Syst 2000; 1: 404-409.
[18] Lundstrom B, Gotseff P, Giraldez J, Coddington M. A high-speed, real-time visualization and state-estimation
platform for monitoring and control of electric distribution systems: implementation and field results. In: IEEE
Power Eng Soc; 26–30 July 2015; Denver, USA. New York, NY, USA: IEEE; pp. 1-5.
[19] de Oliveira MCF, Levkowitz H. From visual data exploration to visual data mining: a survey. IEEE T Vis Comput
Gr 2003; 3: 378-394.
[20] Capuder T, Zidar M, Skrlec D. Evolutionary algorithm with fuzzy numbers for planning active distribution network.
Electr Eng 2012; 3: 135-145.
[21] Pandzic H, Bosnjak D, Kuzle I, Boskovic M, Ilic D. The implementation of smart metering systems for electricity
consumption in Croatia. In: 17th IMEKO TC 4, 3rd IMEKO TC 19 and 15th IWADC Workshop; 1–5 September
2010; Kosice, Slovakia. Budapest, Hungary: IMEKO; pp. 1-5.
[22] Mahadev PM, Christie RD. Envisioning power system data: concepts and a prototype system state representation.
IEEE T Power Syst 1993; 3: 1084-1090.
[23] Overbye TJ, Weber J. Visualization of power system data. In: 33rd Annual Hawaii International Conference on
System Sciences; 4–7 January 2000; Maui, HA, USA. New York, NY, USA: IEEE; p. 7.
[24] Keim DA. Information visualization and visual data mining. IEEE T Vis Comput Gr 2002; 1: 1-8.
[25] Martinez Cesena EA, Mancarella P. Distribution network reinforcement planning considering demand response
support. In: Power Systems Computation Conference (PSCC); 18–22 August 2014; Wroclaw, Poland. New York,
NY, USA: IEEE; pp. 1-7.
[26] Al-Muhaini M, Heydt GT. A novel method for evaluating future power distribution system reliability. IEEE T
Power Syst 2013; 3: 3018-3027.
2884