visualization of trade statistics - unsd — welcome to … of trade statistics christian delachenal...
TRANSCRIPT

Visualization of trade statistics
Christian DELACHENALITC Senior Market AnalystRegional seminar on trade statisticsNew Delhi: 3-6 November 2014

The Malawi NSO web site
A new «Trade Statistics» linkwill beavailable on the NSO web site home page

When clicking on the «Trade Statistics» link, the table published by default is the list of product sectors at the HS 2-digit level exported by Malawi. This table includes many optional indicators (e.g. trade balance, growth rate, market share, world ranking). A different default page could be proposed.
Table 1: List of products at the 2-digit level exported by Malawi
Many selectioncriteria are available and the user can easilyswitch from exports to imports or fromyearly data to monthly data or from a list of products to a list of partner countries, etc.
Selection of product clusters at 6-digit level

Table 2: List of products at the 6-digit level exported by Malawi
All tables can easilybe exported to Excel
Selection of the product code 240120

Table 3: List of importing markets for tobacco exported by Malawi
Selection of the mapapproach
Optional indicator on tarifffaced by Malawi in partner countries

The user can easilyswitch from a table approach to a map or a graph approach
Map 1: List of importing markets for tobacco exported by Malawi

Graph 1: List of importing markets for tobacco exported by Malawi
It is possible to select a bar chart instead of a bubble graph

Bridge between the NSO web site and Trade Map
By clicking on «Switzerland», the user automaticallyopens Trade Map in a new web page.The information correspondingto the selectionmade on the NSO web page is directlyaccessible without enteringa username and password.
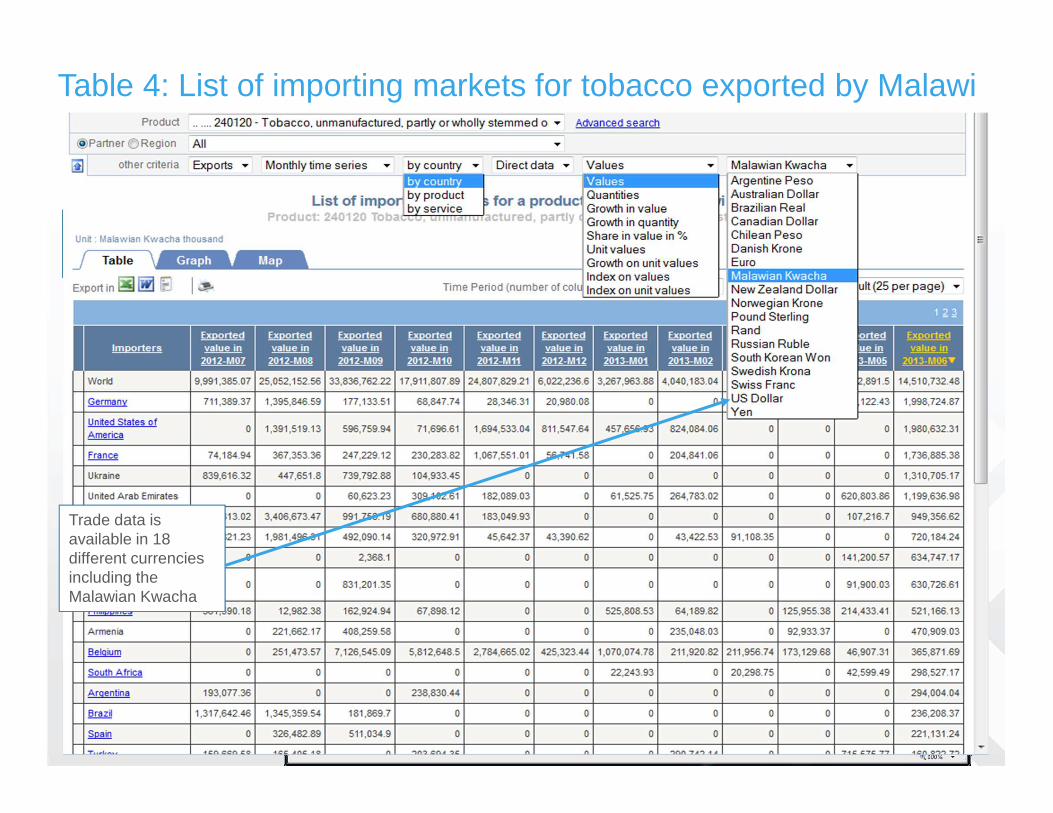
Table 4: List of importing markets for tobacco exported by Malawi
Trade data isavailable on a monthly basis
Selection of the product approach
Trade data isavailable in 18 different currenciesincluding the Malawian Kwacha

Enter a keyword to select a product
Enter the keyword «cotton»
Selection of the advanced search

Table 5: Bilateral trade of cotton between Malawi and South Africa
Select a partnercountry or a region

Table 6: COMESA countries importing cotton from Malawi

Conclusion
The Trade Map pages embedded on the Malawi NSO web site offer the following advantages:
� The user of the NSO web site can access all Malawi trade data available in Trade Map without entering a username and password.
� On the NSO web site, the user benefits from Trade Map navigation criteria.
� The user can also benefit from direct bridges between this new application available on the NSO web site and Trade Map, which facilitates trade analysis done by all Malawian institutions.
� Any update in the Trade Map database is automatically reflected on the web pages published on the NSO web site.
� The trade database is hosted on ITC servers - access to Malawi trade data will therefore have no impact on the performance of NSO servers.
� In the same way, the web pages embedded on the NSO web site are hosted on ITC servers - there is therefore no maintenance cost for NSO.