visualization the natural disasters simulations results based on
TRANSCRIPT
5
Visualization the Natural Disasters Simulations Results Based on Grid and Cloud Computing
E. Pajorova and Ladislav Hluchý Institute of Informatics, Slovak Academy of Sciences,
Slovak Republik
1. Introduction
Every year, forest fires, floods and landslides cause enormous damage of vegetation and fauna, environment and property and bind significant human resources. Particularly in national parks and natural reservations, unique areas of high degree of protection can be devastated by fire. For instance, during the destructive forest fire in the Slovak Paradise National Park (Slovakia) in 1976, very unique vegetation was destroyed in the Kyseľ Gorge, where the recovery into the former state will last 200 years .
Till now (thirty three years after the fire), this locality is closed for tourists because of the vast damages. Topic of a lot of projects is how to prevent such disasters. Our research in institute is oriented on GRID and Cloud computing. A lot of international projects oriented on natural disasters utilize the HPC (High Performance Computing), grid or cloud computing and within such solution raises requirement of visualization service for presentation of the intermediate or final research results. Our basic aim of our research resolved in projects is the creation Visual service for the Modelling and 3D Rendering of Natural Disasters, before Fire, floods and landslides. Changing input data of Fires spread using to generate new outputs very quickly. Grid and actually Cloud computing on a lot of Clusters and On-line 3Dvisualisation service can allow new scenes of Natural disasters spread. Outputs are using for far adjustment to liquidation the Natural Disasters. 3D_visualization service for animation Natural Disasters should integrate visualization requests of any kind of application solved in our institute and before solved in international projects oriented on environmental problems. The natural disasters like fires and floods or landslides become subject of science in research institutions more and more frequently Many applications from this area are using different kinds of simulation tools, which are producing output data for displaying the results of the computation. The purpose of the visualization service is to model and display results of various simulations of natural disasters like are fire spread in time, fire intensity, flood velocity, landslide activity etc Such service requires unified standards like integration of input data formats and especially creation of unified visualization tool. The purpose of 3D viz. service is to model and display intermediate or final results of various simulations of natural disasters like fire spread in time, its intensity and erosion or floods in time or landslides as well. The output of the service is various scenes of terrain by different simulation outputs. Output of the service can also be the files representing the virtual reality of natural disaster and also files, which are
www.intechopen.com

Emerging Informatics – Innovative Concepts and Applications 86
generated as input for VR-Systems. 3D service was tested with outputs from applications, which were solved in our institute and also by data from applications of the international natural disasasters projects (Astaloš, 2010) .
Natural disasters simulation is a very complicated, challenging problem sensitive to the input data required. Therefore, intense research and development of sophisticated software systems and tools is extremely important for Natural disasters fighting management purposes (Gruz, 2003). For example for Slovak forests, original methodology for forest vegetation classification and new fuel models have been developed and proper forest fire simulations related to the locality Krompla (National Park Slovak Paradise), where the large destructive fire appeared in 2000 and its reconstruction have been analyzed. These efforts induced the need of better auxiliary tools for 3D visualization of obtained simulation results and for animation of the forest fire spread. In this paper, new 3D visualization technique for real forest fire simulation and fire behavior and for flood and landslide modeling is described (Orland, 1994). The importance is increasingly expanded for environmental problems (Glasa, 2011).
2. On-line visualization as a sequence application in grid environment
Grid-based applications that generate visualization outputs on-the-fly require a unified application framework. With regards to the Grid computational environment, it is advantageous to divide the performation of Grid applications into three separate phases.
1. Fetching the data from a simulation application 2. Transforming the data into a displayable form and the creation of virtual scenes 3. Displaying the scenes
2.1 Fetching the data from simulations
The first, computational phase is submmision the application to the HP, Grid or Cloud environment. The whole application consists of a large number of consecutive series of jobs. The output from a given series becomes the input for the next series.
The user must prepare the data on the Storage Element and provide the configuration file before launching the job controller. Data can be added even while the application is running (providing the relevant rules are kept). During its run the user can observe the contents of directories with input and output data on the Storage Element. The simulation outputs are treated as input data by the visualization process. The job controller starts their processing by launching the visualization tool. This is the subject of visualization phase.
2.2 Transformation the data into a displayable form
The aim of this phase is the transformation of the data into a displayable form and the creation of virtual scenes according to the requirements of the client. This phase is carried out by a visualization tool, which is together with its controlling agents, is the crux of this article. Apparently, the best approach is to create a separate visualization tool for each type of simulation. Only closely related applications, for instance different simulations of environmental phenomena, enable an usage of a shared control script. The user is free to
www.intechopen.com

Visualization the Natural Disasters Simulations Results Based on Grid and Cloud Computing 87
decide in which phase of the computation the visualization tool is activated. Alternatively, the tool can be run after the whole computation is completed. While the computations are performed, the user can observe the contents of directories with input and output data on the Storage Element. A simulation output is in a certain phase considered to be the input for the visualization process. In the next cycle, the user prepares a new configuration file and runs the visualization tool as a new application.
2.3 Displaying the scenes
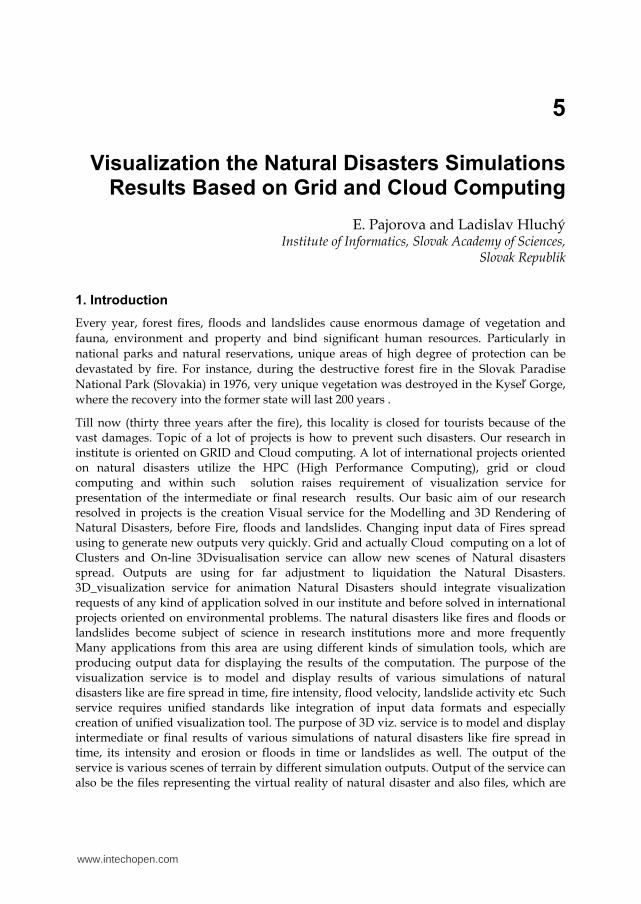
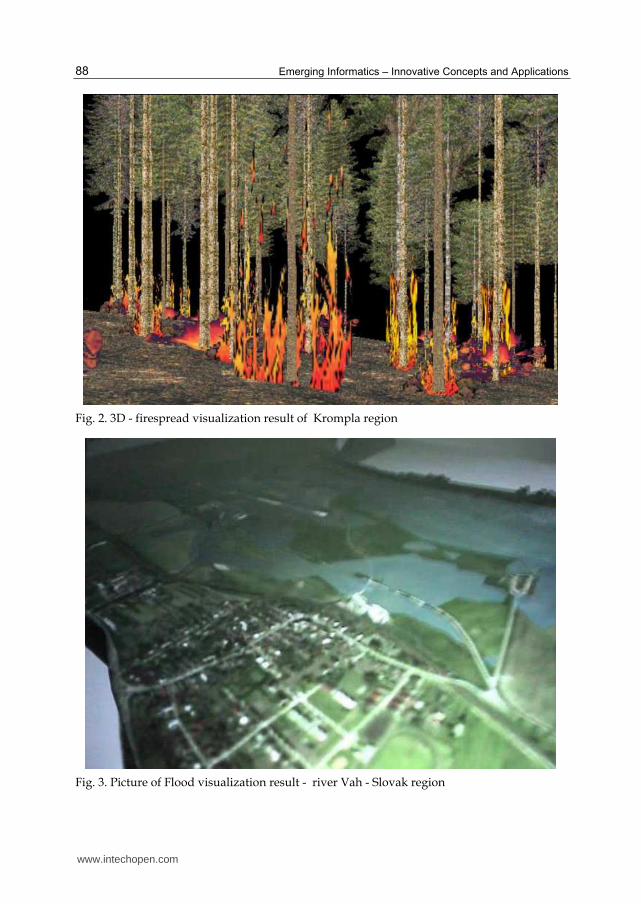
The purpose of this final phase is the display and analysis of output files from the second phase.This phase takes place on the client graphical device or in Grid to instal plugin. In new design for on-line visualisation tool is included also online approach for rendering . Examples from visualization scenas are shown on pictures.On Figure 1. and on Figure 2. - we can see pictures from big Fire in Krompla region - Slovak republik. Figure 3. and Figure 4. - pictures show visualization results from flood on river Vah.
Fig. 1. Large Fire in Krompla region - Slovak National Park "Slovensky raj'', firespread in time 6 days
www.intechopen.com
Emerging Informatics – Innovative Concepts and Applications 88
Fig. 2. 3D - firespread visualization result of Krompla region
Fig. 3. Picture of Flood visualization result - river Vah - Slovak region
www.intechopen.com

Visualization the Natural Disasters Simulations Results Based on Grid and Cloud Computing 89
Fig. 4. Picture of Flood visualization result - river Vah - Slovak region
3. Scientific gateway
Thanks to e-infrastructures, researchers can collaborate, communicate, share resources, access remote equipment or computers and produce results as effectively as if they and the resources they require were physically co-located. However, to properly achieve those results, community-oriented e-science environments are required. E-sciences ask for developing user-friendly interfaces, which sophisticated implementations are also known as science gateway. The science gateway is important component of many large-scale Earth, astronomical, environmental and natural disasters science projects. Developing the sciences portals and the science gateways is coverage of requirements of large scale sciences such as Natural Disasters, Earth science, Astronomy and all sciences which are using grid, cloud or cluster computing and high-performance computing infrastructure.
3.1 Visualization tool and its integration in a scientific gateway
Through user-friendly web interfaces such as e-Science gateway integrated into the same environment, researchers and scientists can securely and transparently access computational and data sources, services, tools, sensors, etc. Science gateway is a
www.intechopen.com

Emerging Informatics – Innovative Concepts and Applications 90
computational web portal that includes a community-developed set of tools, applications, and data customized to meet the needs of a targeted community. It can hide the complexity of accessing heterogeneous Grid computing resources from scientists and enable them to run scientific simulations, data analysis and visualization through their web browsers (Paulech, 2008). Scientific gateways are able to provide a community-centric view, workflow/dataflow services and a strong support in accessing to the cyber infrastructure including grid and cloud based resources. In each of science contexts, scientific gateways play a key role since they allow scientists to transparently access to distributed data repositories (across several domains and institutions) and metadata sources to carry out search & discovery activities, as well as visualization and analysis ones, etc. Finally, scientific gateways can play an important role in training students (at the academic level) in the different scientific disciplinas, attract new users and representing a relevant centralized knowledge repository in the sciences context. Our paper deals with the position of visualization as one of the main components of scientific gateway. The scientific web portal - gateway cumulate all types of visualization. Since 2004 numerous scientific gateways have been developed. Lot of scientific gateways were funded by the TeraGrid Science Gateways program (Wilkins, 2008). The gateway paradigm requires gateway developers to compile and install scientific applications on a variety of HPC clusters available from the resource providers in TeraGrid, to build service middleware for the management of the applications, and to develop web interfaces for delivering the applications to a user’s web browser. Consequently many web-service frameworks (Kandaswamy, 2006), (Krishnan, 2006) have been designed and applied in building domain-specific science gateways. Some of them enable workflow based on the web services [4], but they commonly don’t provide solutions to support web interface generation. Developers was usualy hindered. Usualy they need to spend a lot of time learning web programming, especially JavaScript and AJAX Technologies to implement a user-friendly and interactive web interface to these services. Developed visualization tools by us take acces on properties to include them to the Scientific gateway. For example our design propose a new web based application framework for astronomy and asttrophysics environment. We start from rich experimences in lot of grid and cloud based project in e-Sciences environment. We start with proposing new framework enables astronomy and astrophysic science gateway dewelopers based on last one web resources. Visualization tool is part of gateway and proposes a new based application framework for astronomy and astrophysics environment. The framework including the can import the astronomy specific workflow scripts easily can generate web appliance for running astronomical applicationworkflows and visualization the outputs results directly from workflow execution, online visualization through their web browsers.
4. Visual representation of datasets
Simulation and execution with a huge data usually spend long execution time. Good solution for execution is represented by grid and actually on cloud computing. In both infrastructures visualization has the main position as a way to control the execution process. Visual control has in all infrastructure very useful position. The modal parametric studies applications include, for example, astronomical simulations. The simulation was realized as a sequence of parameter studies, where each sub-simulation was submitted to the grid as a
www.intechopen.com

Visualization the Natural Disasters Simulations Results Based on Grid and Cloud Computing 91
separate parameter study. The job management was rather time consuming due to the analysis of failed jobs and to their re-submission. Visualization is included as a visual control process. Client asks for visualization is a “visualization client”. Output data on the storage element are the inputs data for visualization jobs. Visualization workers are to modify data to the formats, which can be visualized, but also to prepare the typical visualization scenes. Client can render such scenes on the browser, can make the visual control and modify executions. For example, to immediately understand the evolution of the investigated proto-planetary disc we have developed a Visualization Tool (VT). The VT is composed of several modules, which are responsible for creating scenes and converting data to, the “visualize”: format. The VT is designed as a plug-in module. The components generating rendering scenes are easy to exchange, according to the requirements of the given application. In case of our gridified application the output data of the simulation located on the SE can be used directly as the input for the VT. The final product of the VT includes a set of files containing data in the VRML (Virtual Reality Modeling Language) format. These output files can be rendered by many available VRML web-browsers. The whole visualization process is maintained through a visualization script, whose basic function is invoking the individual VT components in successive steps, transferring data, and handling error events. The script is written using the Bourne shell scripts and all VT modules are implemented in the C++ language. The VT can be embedded into the framework described above, or can be used separately as a stand-alone program. By using the on-line VT the client can stop the execution process, change the input parameters and restart the execution process again. In grid environment, such architecture can be used for all applications from different science spheres which have the character of a parametric study. Actually, the research community needs not only “traditional” batch computations of huge bunches of data but also the ability to perform complex data processing; this requires capabilities like on-line access to databases, interactivity, fine real-time job control, sophisticated visualization and data management tools (also in real time), remote control and monitoring. The user can completely control the job during execution and change the input parameters, while the execution is still running. Both tools, the tool for submission designed before and continued sequential visualization tool, provide complete solution of the specific main problem in Grid environment. The position of the visualization tool as a visual control process is shown in figure 1. Astrophysics scientists are able to run scientific simulations, data analysis, and visualization through web browsers. Through Earth and astronomical science gateway scientists are able to import they sophisticated scripts by which the VT can be activated as well, as the output from workflow executions without writing any web related code (Paulech, 2008).
4.1 VT as a new discovery for presenting academic research results
Advance in sciences and engineering results in high demand of tools for high-performance large-scale visual data exploration and analysis. For example, astronomical scientists can now study evolution of all Solar systems on numerous astronomical simulations. These simulations can generate large amount of data, possibly with high resolution (in three-dimensional space), and long time series. Single-system visualization software running on commodity machines cannot scale up to the large amount of data generated by these
www.intechopen.com

Emerging Informatics – Innovative Concepts and Applications 92
simulations. To address this problem, a lot of different grid-based visualization frameworks have been developed for time-critical, interactively controlled file-set transfer for visual browsing of spatially and temporally large datasets in a grid environment. To address the problem, many frameworks for grid and cloud based visualization are used. We can go through evolution of sophisticated grid-based visualization frameworks with actualized functionality, for example, Reality Grid, UniGrid and TerraGrid. All of the frameworks have been included in the visualization. Frameworks were created during grid-based projects and create new features for presentations of the academic research results in visualization. Visualization resources enabled by the astronomical science gateway the top of research experiences. Multiple visualizations generated from a common model will improve the process of creation, reviewing and understanding of requirements. Visual representations, when effective, provide cognitive support by highlighting the most relevant interactions and aspects of a specification for a particular use. The goal of scientific visualization is to help scientists view and better understand their data. This data can come from experiments or from numerical simulations. Often the size and complexity of the data makes them difficult to understand by direct inspection. Also, the data may be generated at several times during an experiment or simulation and understanding how the data varies with time may be difficult. Scientific visualization can help with these difficulties by representing the data so that it may be viewed in its entirety. In the case of time data varying in time, animations can be created that show this variation in a natural way. Using virtual reality techniques, the data can be viewed and handled naturally in a true three-dimensional environment (e.g. depth is explicitly perceived and not just implied). All these techniques can allow scientists to better understand their data. Viewing the data in this way can quickly draw the scientist's attention to interesting and/or anomalous portions of the data. Because of this, we encourage scientists to use scientific visualization from the beginning of their experiments and simulations and not just when they think they have everything operating correctly. This also allows scientists to develop a set of visualization tools and techniques that will help them understand their data as their research matures. For example, depending on of our astronomical example, in order to understand immediately the evolution of the investigated proto-planetary disc we have developed a Visualization Tool (VT) for astronomers. Educational visualization uses a simulation normally created on a computer to develop an image of something so it can be taught about. This is very useful when teaching a topic which is difficult to see otherwise, for example, proto-planetary disk, its evolution or evolution in Solar system. It can also be used to view past events, such as looking at the Solar system during its evolution stage, or look at things that are difficult. For astronomers, the VT has in education roles well.
5. Architecture of Visualization Tool (VT)
3D visualization service for animation of natural disasters applications, astrophysical applications and all complicated applications based on HPC (High Performance Computing), grid and Cloud computing should integrate visualization requests. Many applications from this area are using different kinds of simulation tools, which produce output data for displaying the computation results. The purpose of the visualization service is to model and display the results of various simulations. Such service requires unified
www.intechopen.com

Visualization the Natural Disasters Simulations Results Based on Grid and Cloud Computing 93
standards such as integration of input data formats and especially creation of unified visualization tools.
When running parametric simulation with a large number of jobs (such astrophysical simulations), the main problem was in the grid infrastructure reliability. The job management was rather time consuming due to the analysis of failed jobs and to their re-submission. Moreover, the jobs, waiting in a queue for a long time, were blocking the simulation. To overcome these problems, we developed an easy-to-use framework based on pilot jobs concept that uses only services and technologies available in EGEE (Enabling grids for E-science) infrastructure, grid middleware gLite and Bourne Shell scripting language. The framework consists of pilot jobs – workers, and of automatic job management script. Workers are running the application code in cycle with input datasets downloaded from a storage element using remote file access. The storage element contains the input, working and output areas (as subdirectories of the directory created by the user for each parameter study). The user prepares input datasets on user interface and transfers them into the input area before starting the simulation. The working area is used by workers to store static information about computing nodes (name of the computing element and computing node, CPU type and available memory), and to monitor information updated in regular intervals, datasets, that are currently processed, and statistics about processed datasets. Output data is stored into the output area, where the user can see the progress of simulation. To check the progress, the user only needs to list the contents of the output folder. The storage element is accessible also for grid FTP clients, therefore grid portals can also be used to watch the progress. To identify hanging jobs or jobs that perform too slowly, workers are periodically sending monitoring information to the storage element. To avoid termination of workers by the queuing system, workers are running only for a limited time. The main function of the job management script is to maintain the defined number of active workers with detection of failed submissions, finished and waiting workers. The script uses job collections to speed up the start up and automatic blacklisting of full and erroneous sites. In case of our application the output data of the simulation located on the storage element can be directly used as the input for the visualization tool. The whole process is shown on Figure 5. The architecture of the submission process is shown in Figure 6.. The architecture of the visualization process is shown in Figure 7..
As an example we present a visualization tool which has been used on parametric astrophysical simulations and natural disaster simulations. The first simulation project is a collaboration among Astronomical Institute (Slovakia), Catania Observatory (Italy) and Adam Mickiewicz University in Poznan (Poland). The second project performed natural disasters simulations computed at our institute. The applications were ported to EGEE grid infrastructure by the Institute of Informatics Slovak Academy of Sciences (Slovakia), (Astaloš, 2010).
Natural disasters simulation is a very complicated, challenging problem sensitive to the input data required. Therefore, intense research and development o sophisticated software systems and tools is extremely important for natural disasters fighting management purposes. For example for Slovak forests, original methodology for forest vegetation classification and new fuel models have been developed and proper forest fire simulations related to the locality Krompla (National Park Slovak Paradise), where the large destructive and its reconstruction have been analyzed. These efforts induced the need of better auxiliary
www.intechopen.com

Emerging Informatics – Innovative Concepts and Applications 94
Fig. 5. Schema of all process - process of submission and on-line visualization
Fig. 6. Schema of process of submission application to the grid.
www.intechopen.com

Visualization the Natural Disasters Simulations Results Based on Grid and Cloud Computing 95
Fig. 7. Schema of on-line visualization process.
tools for 3D visualization o obtained simulation results and for animation of the forest fire spread. The importance is increasingly expanded for environmental problems. VT tool for Earth Science provides pictures from simulations big Fire in Crompla region and from flood in river Vah. VT tool for astronomical applications provides pictures from simulation of the evolution of proto-planetary disc from 1Myr to 1000 Myr. An unsolved question of the Solar System cosmogony is the origin of comets and minor bodies with respect to the Solar System evolution. In the past, authors predicted the existence of reservoirs of the objects and tried an effort to explain the origin and subsequent evolution of these reservoirs. Several partial theories have been developed to clarify the problem. Recently, the researchers try to present a unified theory of the formation of small-body reservoirs in the Solar System (the Kuiper Belt, the Scattered Disc), situated beyond the orbit of Neptune. In our application we developed a new improved model for explaining the formation of the Oort Cloud. One has to assume dynamical evolution of a high number of particles under gravitational influence of the giant planets: Jupiter, Saturn, Uranus, Neptune, the Galactic Tide and nearby passing alien stars. Before our work, only two similar simulations have been performed by Duncan
www.intechopen.com

Emerging Informatics – Innovative Concepts and Applications 96
et al. in 1987 and by Dones et al. in 2005[8]. In our application we assumed 10038 test particles. It is several times more than in the previous simulations. Our extensive simulations required very large computing capacity. To complete our model on a single 2.8GHz CPU would last about 21 years. Using the grid infrastructure, the whole computation lasted 5 months; thus, it was more than 40 times faster. The result of our simulation is dynamical evolution of orbits of test particles during the first giga year of the Solar System lifetime. Detailed study of this first giga year evolution results in a general agreement with the results of previously mentioned models as well as in new facts and questions. Having used the mentioned visualization tool we obtain lot of visualization results, pisctures and video files, which absolute represent our research results. Specifically, Figure 8. shows the evolution of proto-planetary disc in the time of 1 Myr. We can see that during the 1000 Myr time that the particles were replaced from inside to outside of the spheres. Figures 9. and 10. show the result of dynamical evolution of Oort-cloud as a part of proto-planetary disk after its evolutionary stage which was the first Gyr (giga year) from different positions. Picture 11. shows expanded particles during the fly of imagine space ship.
Fig. 8. Visualization output from research results in Astrophysics science simulations.
www.intechopen.com

Visualization the Natural Disasters Simulations Results Based on Grid and Cloud Computing 97
Fig. 9. Visualization output from research results in Astrophysics science simulations - second position.
Fig. 10. Visualization outputs from research results in Astrophysics science simulations. Dynamical evolution of O-orth cloud - thirth position.
www.intechopen.com

Emerging Informatics – Innovative Concepts and Applications 98
Fig. 11. Visualization outputs - red poinds are expanded particles which we can see during the from fly of imagine space ship.
6. Cloud computing – Such a web portal for disasters management
For approaching of Natural disasters as is for example out of control wild fire, flood, landslides near your environs, people certainly need to have some disaster planning in place. However, with cloud computing, this disaster management and planning is not something you have to worry about when it comes to your computer. Disaster Management
or Recovery Plan - this is a plan for the unexpected (such as natural disasters, fires, planes falling out of the sky, etc.) To comes information technology and especially disaster management, cloud computing is the way to go. In fact, it basically serves AS your disaster management plan. When all of your valuable information is stored outside of your computer, then you no longer have to be concerned with the destruction of your files and valuable information, in the unfortunate instance that your computer network is destroyed. Disaster recovery traditionally involves the backup of all a company’s data on backup servers, which can be easily accessed. These backup servers can be on site or contracted out, but the ownership of the hardware or subcontracting of these services can be quite expensive and form a substantial part of an IT budget for an organization. A cloud disaster recovery service brings peace of mind to businesses that can't necessarily afford the hardware and capital costs involved with in-house disaster recovery provision. It completely eliminates
www.intechopen.com

Visualization the Natural Disasters Simulations Results Based on Grid and Cloud Computing 99
the need for expensive hardware, as data stored in the cloud is on the servers of service providers. Then those service providers, in turn, have their own system of remote backup servers at different locations which constantly back up any customer data that they receive. This way, you are able to access it at any time. If your data is saved in the cloud, it will have a number of backups which can assist in data recovery for any material stored in it. This creates a type of organizational back-up that any individual business may find very expensive to duplicate.
7. Conclusion
The goal of the article is to describe the VT architecture and to support the visualization as essential component in new portals - gateways technologies and to show some examples. For the future we want to extend the use of the VT for other scientific disciplines in addition to astronomy, but also for Earth Sciences with all visualization aspects. For the future we plan to participate in a project in which the main activity will be to create and operating a pan-European e-Science Support Centre as a global astronomical environment in which portals such as gateways with visualization included will be as part of essential requirements. In the future we want instead of grid infrastructure to use the cloud resources. Actually, the research community needs not only “traditional” batch computations of huge bunches of data but also the ability to perform complex data processing; this requires capabilities like on-line access to databases, interactivity, fine real-time job control, sophisticated visualization and data management tools (also in real time), remote control and monitoring. The user can completely control the job during execution and change the input parameters, while the execution is still running. The science gateway is important component of many large-scale Earth, environmental and natural disasters science projects. Developing the sciences portals and the science gateways is coverage of requirements of large scale sciences such as Earth or natural disasters and all sciences which are using grid, cloud or cluster computing and high-performance computing infrastructure. Visualization of research results have a main position in Science Gateway. Actually and for a future we are continued by this way, it means to integrate visualization of Natural disasters to different sciences gateway.
8. Acknowledgement
This work was supported by Slovak Research and Development Agency under the RPEU-0024-06 project, and by VEGA project No. 2/0211/09, as well as by EGEE III EU FP7 RI project: Enabling Grids for E-science III (2008-2010) FP7-222667 and also projects RECLER ITMS: 26240220029 and SMART II ITMS: 26240120029.
9. References
Wilkins-Diehr, N.,Gannon, D., Klimeck, G., Oster, S. Pamidighantam, S., 2008. TeraGrid Science Gateways and Their Impact on Science, IEEE Computer 41(11):32-41, Nov 2008.
Cruz, M.G., M.E. Alexander, and R.H. Wakimoto. 2003. 3D Nature, LLC. 2002. Using VNS (Manual). Arvada, CO: 3D Nature, LLC. Assessing canopy fuel stratum
www.intechopen.com

Emerging Informatics – Innovative Concepts and Applications 100
characteristics in crown fire from fuel types of North America. International Journal of Wildland Fire. 12: 39-50.
Orland, B. 1994. SmartForest: a 3-D interactive forest visualization and analysis system. In Proceedings, Decision Support 2001 - Resource Technology 94, 181-190. Bethesda, MD: American Society for Photogrammetry and Remote Sensing.
Glasa, Ján and all. Analysis of forest fire behaviour by advanced computer fire simulators. In Communications : Scientific Letters of the University of Žilina, 2011, vol. 2, p. 26-31. ISSN 1335-4205.
Astaloš, Ján and all. Slovak Participation In The World LHC Computing Grid. In 6th International Workshop On Grid Computing For Complex Problems, November 8 - 10, 2010, Bratislava: GCCP 2010 Proceedings. Eds. L. Hluchý, P. Kurdel, J. Sebestyénová. - Bratislava : Institute Of Informatics SAS, 2010, P. 21-27. ISBN 978-80-970145-3-7.
Wilkins, Diehr and all. TeraGrid Science Gateways and Their Impact on Science, IEEE Computer 41(11):32-41, Nov 2008.
Paulech, Tibor and all. Extended modeling of the Oort cloud formation from the initial protoplanetary disc. On 4th International Workshopon Grid Computing for Complex Problems. Oct. 27-29 2008 page 142-150.
Kandaswamy and all. 2006 Building Web Services for Scientific Grid Applications. IBM Journal of Research and Development 50(2-3), 2006.
Krishnan, L. and Stearn, B., et al. 2006 Opal: Simple Web Services Wrappers for Scientific Applications. IEEE International Conference on Web Services (ICWS 2006), Sep 18-22, Chicago.
www.intechopen.com

Emerging Informatics - Innovative Concepts and ApplicationsEdited by Prof. Shah Jahan Miah
ISBN 978-953-51-0514-5Hard cover, 274 pagesPublisher InTechPublished online 20, April, 2012Published in print edition April, 2012
InTech EuropeUniversity Campus STeP Ri Slavka Krautzeka 83/A 51000 Rijeka, Croatia Phone: +385 (51) 770 447 Fax: +385 (51) 686 166www.intechopen.com
InTech ChinaUnit 405, Office Block, Hotel Equatorial Shanghai No.65, Yan An Road (West), Shanghai, 200040, China
Phone: +86-21-62489820 Fax: +86-21-62489821
The book on emerging informatics brings together the new concepts and applications that will help define andoutline problem solving methods and features in designing business and human systems. It coversinternational aspects of information systems design in which many relevant technologies are introduced for thewelfare of human and business systems. This initiative can be viewed as an emergent area of informatics thathelps better conceptualise and design new world-class solutions. The book provides four flexible sections thataccommodate total of fourteen chapters. The section specifies learning contexts in emerging fields. Eachchapter presents a clear basis through the problem conception and its applicable technological solutions. Ihope this will help further exploration of knowledge in the informatics discipline.
How to referenceIn order to correctly reference this scholarly work, feel free to copy and paste the following:
E. Pajorova and Ladislav Hluchý (2012). Visualization the Natural Disasters Simulations Results Based on Gridand Cloud Computing, Emerging Informatics - Innovative Concepts and Applications, Prof. Shah Jahan Miah(Ed.), ISBN: 978-953-51-0514-5, InTech, Available from: http://www.intechopen.com/books/emerging-informatics-innovative-concepts-and-applications/visualization-of-natural-disasters-simulations-results-based-on-grid-and-cloud-computing

© 2012 The Author(s). Licensee IntechOpen. This is an open access articledistributed under the terms of the Creative Commons Attribution 3.0License, which permits unrestricted use, distribution, and reproduction inany medium, provided the original work is properly cited.