visualizing breathing motion of internal cavities in ...visualizing breathing motion of internal...
TRANSCRIPT
Visualizing breathing motion of internal cavities inconcert with ligand migration in myoglobinAyana Tomitaa,b, Tokushi Satoa,b, Kouhei Ichiyanagib, Shunsuke Nozawab, Hirohiko Ichikawab, Matthieu Cholleta,Fumihiro Kawaic, Sam-Yong Parkc, Takayuki Tsudukid, Takahisa Yamatod,e, Shin-ya Koshiharaa,b, and Shin-ichi Adachib,f,1
aDepartment of Materials Science, Tokyo Institute of Technology, Meguro, Tokyo 152-8551, Japan; bNon-equilibrium Dynamics Project, Exploratory Researchfor Advanced Technology/Japan Science and Technology Agency, Tsukuba, Ibaraki 305-0801, Japan; cProtein Design Laboratory, Yokohama City University,1-7-29 Suehiro, Tsurumi, Yokohama 230-0045, Japan; dGraduate School of Science, Nagoya University, Furo-cho, Chikusa-ku, Nagoya 464-8602, Japan; eCoreReserch for Evolutional Science and Technology, Japan Science and Technology Agency, 4-1-8, Hon-cho, Kawaguchi, Saitama 332-0012, Japan; and fPhotonFactory, High Energy Accelerator Research Organization, 1-1 Oho, Tsukuba, Ibaraki 305-0801, Japan
Edited by Gregory A. Petsko, Brandeis University, Waltham, MA, and approved December 31, 2008 (received for review August 7, 2008)
Proteins harbor a number of cavities of relatively small volume.Although these packing defects are associated with the thermo-dynamic instability of the proteins, the cavities also play specificroles in controlling protein functions, e.g., ligand migration andbinding. This issue has been extensively studied in a well-knownprotein, myoglobin (Mb). Mb reversibly binds gas ligands at theheme site buried in the protein matrix and possesses severalinternal cavities in which ligand molecules can reside. It is still anopen question as to how a ligand finds its migration pathwaysbetween the internal cavities. Here, we report on the dynamic andsequential structural deformation of internal cavities during theligand migration process in Mb. Our method, the continuousillumination of native carbonmonoxy Mb crystals with pulsed laserat cryogenic temperatures, has revealed that the migration of theCO molecule into each cavity induces structural changes of theamino acid residues around the cavity, which results in the expan-sion of the cavity with a breathing motion. The sequential motionof the ligand and the cavity suggests a self-opening mechanism ofthe ligand migration channel arising by induced fit, which is furthersupported by computational geometry analysis by the Delaunaytessellation method. This result suggests a crucial role of thebreathing motion of internal cavities as a general mechanism ofligand migration in a protein matrix.
hydrophobic cavity � molecular movie � protein dynamics �time-resolved crystallography
Localized electronic excitation by photons often induces large-scale structural modulations and novel physical properties in
condensed matter (1, 2). Myoglobin (Mb), often referred to asthe hydrogen atom of biology and a paradigm of complexity (3),has played a central role in research on the photo-inducedresponse of proteins and migration of gases, solvents, and ligandsin the protein matrix (3, 4). Despite the large number of detailsknown about Mb dynamics, it remains unclear how a ligandmolecule escapes from the protein matrix to the solvent and howthe protein matrix responds to the ligand migration at the atomiclevel. A number of time-resolved spectroscopic measurements ofMb photoproducts have revealed a complex ligand-bindingreaction with multiple kinetic intermediates (4–8). After disso-ciation from the heme iron atom, ligand gas molecules eitherrebind internally from the distal pocket (DP) (Fig. 1) or escapeinto the solvent. It has been deduced that the escape of theligand is assisted by the thermal f luctuations that transientlyopen exit channels. Lowering the temperature slows down thethermal f luctuations, and the internal binding process be-comes dominant (4, 5).
The multiple kinetic intermediates scheme of Mb has moti-vated researchers to characterize the structural features of thethe intermediates by using both time-resolved (9–14) and cryo-genic crystallographic measurements (15–22). A general pictureemerging from these experiments is that Mb has several internalcavities, identified as Xe-binding sites (23) (Fig. 1), which are
favorable locations for gas molecules, and that the cavities areinvolved in ligand migration dynamics. Cryogenic crystallogra-phy of native and mutant carbonmonoxy Mb (MbCO) photo-products revealed intermediate structures in which the photo-
Author contributions: A.T. and S.-i.A. designed research; A.T., T.S., K.I., S.N., H.I., M.C., F.K.,and S.-Y.P. performed research; A.T., F.K., S.-Y.P., T.T., and T.Y. analyzed data; and A.T.,S.-y.K., and S.-i.A. wrote the paper.
The authors declare no conflict of interest.
This article is a PNAS Direct Submission.
Freely available online through the PNAS open access option.
Data deposition: The atomic coordinates and structure factors have been deposited in theProtein Data Bank, www.pdb.org (PDB ID codes 3E4N, 3ECL, 3E55, 3ECX, 3EDA, 2ZSN, 2ZSO,2ZSZ, 2ZT0, 2ZT1, 3E5I, 3ECZ, 3EDB, 2ZSP, 2ZSR, 2ZT2, 2ZT3, 2ZT4, 3E5O, 3ED9, 2ZSQ, 2ZSS,2ZST, 2ZSX, and 2ZSY).
1To whom correspondence should be addressed. E-mail: [email protected].
This article contains supporting information online at www.pnas.org/cgi/content/full/0807774106/DCSupplemental.
© 2009 by The National Academy of Sciences of the USA
4 6 s i H
3 9 s i H
O C
u e L 2 9
e F
1 e X
2 e X
3 e X
4 e X P D
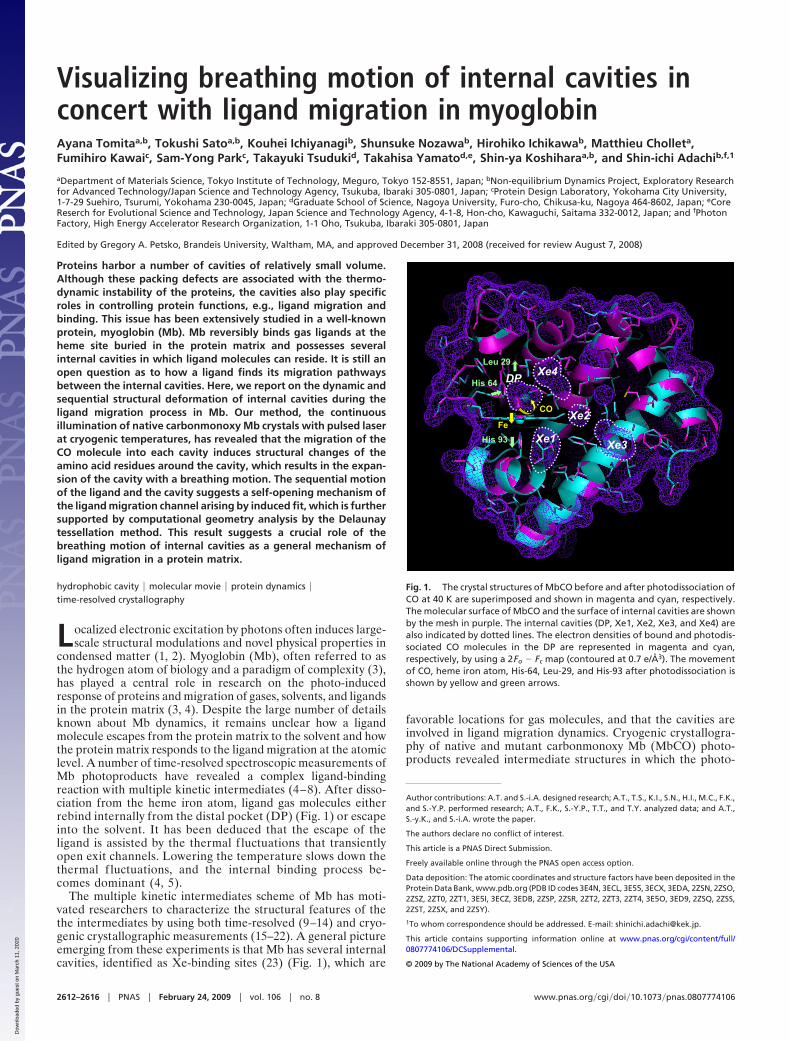
Fig. 1. The crystal structures of MbCO before and after photodissociation ofCO at 40 K are superimposed and shown in magenta and cyan, respectively.The molecular surface of MbCO and the surface of internal cavities are shownby the mesh in purple. The internal cavities (DP, Xe1, Xe2, Xe3, and Xe4) arealso indicated by dotted lines. The electron densities of bound and photodis-sociated CO molecules in the DP are represented in magenta and cyan,respectively, by using a 2Fo � Fc map (contoured at 0.7 e/Å3). The movementof CO, heme iron atom, His-64, Leu-29, and His-93 after photodissociation isshown by yellow and green arrows.
2612–2616 � PNAS � February 24, 2009 � vol. 106 � no. 8 www.pnas.org�cgi�doi�10.1073�pnas.0807774106
Dow
nloa
ded
by g
uest
on
Mar
ch 1
1, 2
020

dissociated CO molecule is trapped in the DP, Xe1, and Xe4cavities. When photolysis of MbCO was followed by thermalcycling above the Mb glass transition temperature, the COmolecule hopped between the cavities (20, 21). Furthermore,time-resolved crystallographic studies of native and mutantMbCO provided molecular movies showing that the photolyzedCO molecule migrates from the DP to the Xe4 and/or Xe1 sitesaccompanying the structural relaxation of the protein (9–14).Picosecond time-resolved crystallography of mutant L29FMbCO, where Leu-29 is replaced by phenylalanine, revealed ahighly strained intermediate structure at 100 ps after the pho-tolysis and enabled visualization of how the photolyzed COmolecule is quickly swept out from the primary docking site tothe Xe4 cavity by the correlated side-chain motions of His-64and Phe-29 (11). These time-resolved methods have revealedthe fast dynamics of the MbCO photoproduct on the picosec-ond time scale. However, migration of the CO molecule in theprotein matrix proceeds on a relatively longer time scale, andthe overall ligand migration process between the cavitiesremains unclear.
Theoretical analyses of Mb dynamics examine this issue, andconsiderable new ground has been covered recently (24–27).Long time-scale molecular dynamics simulations (�80 ns) of themigration of CO or NO inside Mb reproduced some of theprevious crystallographic results (26). More recently, the gasmigration pathways inside Mb were studied by an implicit ligandsampling method (27), which enabled the location of gas migra-tion pathways to be inferred on the basis of a free-energyperturbation approach and provided complete 3D maps of thepotential of the mean force. These theoretical studies stimulatedus to search for the overall ligand-binding pathways in Mb froman experimental perspective. We developed a cryogenic crys-tallographic method by using continuous illumination of crystalswith a pulsed laser, as described in Results and Discussion.
Results and DiscussionPhotodissociation of CO in Mb at 40 K. In our cryogenic crystallo-graphic experiments the cryogenic temperature was set at 40–140 K, and native MbCO crystals were continuously illuminatedby a nanosecond pulsed YAG laser with a 15-kHz repetition rateand 4.6 mW/mm2 average power. Molecular dynamics simula-tions have shown that absorption of a photon by a heme heats upthe heme itself by 500–700 K under conditions far from equi-librium and the heat is dissipated from the heme to the sur-rounding protein matrix in a picosecond time regime, whichcauses transient local melting (28). The crystal is also cooledrepeatedly by the cold gas flow. Thus, this method allowsthermally driven conformational f luctuations to take place evenat cryogenic temperatures and enables the photolyzed COmolecule to migrate in the protein matrix over several hundredminutes.
First, we analyzed the crystal structure of the Mb photoprod-uct at 40 K as the starting structure for CO migration. As isconsistent with the previous cryogenic and time-resolved crys-tallographic studies, we observed similar structural features ofinitial photoproduct but at a higher resolution, as shown in Fig.1 (15–17). The CO molecule moves from the heme-binding siteto the primary docking site in the heme cavity 3.74 Å apart fromthe heme iron atom, and the iron atom shifts by 0.26 Å out of themean heme plane. The displacement is transmitted throughHis-93 to the F-helix region. In the distal pocket, concertedmotions of His-64 and Leu-29 side chains are evident uponphotodissociation of the CO molecule. The data collection andcrystallographic analysis statistics at 40 K are shown in Table 1.
Slow Dynamics of CO Migration in Mb at 100–140 K. When thecryogenic temperature was raised from 40 K to 120 K, most ofthe photodissociated CO molecule at the primary docking site
bound to the heme iron because the internal rebinding rate ofCO to the heme iron atom overcomes the rate of photodisso-ciation at 120 K. However, at the same time, CO starts to migrateslowly into the internal cavities, as shown in Fig. 2 and Movie S1.Because the crystal structures shown in Fig. 2 are the averagestructure of a large number of Mb molecules in the crystal, theoccupancy of the CO molecule in each cavity corresponds to thepopulation of Mb molecules in a particular intermediate struc-ture. Fig. 2 A and D shows that CO migrates into the cavities inthe lower part of the heme plane (Xe1 cavity) and in the backof the DP (Xe4 cavity) after 300-min laser irradiation. It is worthnoting that this migration does not take place upon continuous-wave laser illumination at the same average laser power (4.6mW/mm2). This result is consistent with the previous resultsreported by Teng et al. (18) and clearly shows that the repeatedheat-and-cool cycle by pulsed-laser illumination is essential if theligand migration dynamics are to take place. Other featuresemerge in the Xe2 cavities after 450-min laser irradiation. Thisstudy provides direct evidence of the time-dependent evolutionof the electron density of the CO molecule in the Xe2 cavity,which clearly indicates that the Xe2 cavity is also involved in theCO migration pathway of Mb. The Xe3 cavity is originallyoccupied by a water molecule (Fig. 2C), and it is difficult toestimate precisely whether the increased electron density in Xe3corresponds to the photodissociated CO molecule or to a watermolecule from the external solvent.
Photodissociation of the CO molecule from the heme iron wasconfirmed by microspectroscopic measurement of the MbCOcrystal under the same pulsed-laser illumination conditions at120 K, as shown in Fig. 2E. The optical absorption spectralchange around the visible region (500–700 nm) clearly indicatesthat the CO molecule is photodissociated from the heme ironatom and the MbCO form is partly converted to the deoxy Mbform. The differential absorbance at 580 nm corresponds to thephotolyzed population of �25% after 810-min laser irradiationat 120 K. The photolyzed population estimated by microspec-trophotometry is nearly equal to the fraction of the integratednumber of electrons in the Xe1, Xe2, and Xe4 cavities within theexperimental error. The temporal evolution of the number ofintegrated electrons in each cavity and the cavity volume at
Table 1. Data collection and crystallographic analysis statistics at40 K
Statistic Laser off Laser on
Space group P 1 21 1 P 1 21 1Cell dimensions a, Å 34.312 34.310
b, Å 30.618 30.630c, Å 63.714 63.729
�, ° 105.742 105.761Wavelength, Å 0.827 0.827Resolution, Å 50.0–1.21 50.0–1.21Rmerge 0.033 (0.205) 0.033 (0.196)I/sigma 15.4 (3.1) 15.1 (3.1)Completeness 0.947 (0.807) 0.955 (0.713)Redundancy 3.7 (3.1) 3.7 (3.0)No. reflections 37292 37319R factor 0.142 0.143Rfree 0.182 0.179No. atoms 1,457 1,446Mean B values 13.496 13.301rmsd bond length, Å 0.019 0.020rmsd angle,° 1.862 1.933
Values in parentheses are for the highest-resolution shell (1.25–1.21 Å). Asummary of the whole data collection and refinement statistics at 100–140 Kis available in Tables S1–S3.
Tomita et al. PNAS � February 24, 2009 � vol. 106 � no. 8 � 2613
BIO
PHYS
ICS
Dow
nloa
ded
by g
uest
on
Mar
ch 1
1, 2
020

100–140 K are plotted in Fig. 3 and shown in Movies S1–S3.Migration of CO to the Xe4 site is dominant at 100 K (Fig. 3A),and CO starts to migrate further at 120 K. Migration to the Xe1and Xe2 cavities becomes dominant at 140 K (Fig. 3 B and C).The number of integrated electrons correlates with the volumeof each cavity, which indicates that each cavity in Mb becomesslightly enlarged to accommodate a CO molecule (Fig. 3 D–F).
Ligand Migration Pathways in Mb. A number of kinetic studies havesuggested putative ligand migration pathways through the distal
pathway (directly escaping from the DP to the solvent outside ofthe Mb molecule gated by His-64), and theoretical simulationshave proposed several ligand migration pathways, includingsmall internal cavities other than the Xe cavities. Our result alsosupports the idea of the ligand migration pathway, which issuggested by previous time-resolved and cryogenic X-ray crys-tallography (9–21) and is also consistent with one of the putativemigration pathways predicted by the implicit ligand samplingmethod (27). Our result suggests that the pathway from the DPto the Xe3 cavity involving the Xe4, Xe2, and Xe1 cavities is a
005 6 002.0
4.0
6.0
8.0
0.1
2.1
05 0 6000- .1
0.0
1.0
L ase o r ff3 0 m 0 in4 5 m 0 in8 1 m 0 in
Ab
so
rba
nc
e
Wavelengt [ h nm]
Dif
fere
nc
e
1 e X
9 8 L 3 9 H
2 e X
4 e X
8 6 V
2 7 L
8 3 1 F
9 6 L
f f o r e s a L
f f o r e s a L
e s a L f f o r 8 1 0 n i m n i m 0 0 3
n i m 0 0 3
n i m 0 0 3
5 4 n i m 0
n i m 0 5 4
5 4 n i m 0
n i m 0 1 8
n i m 0 1 8
e s a L f f o r 3 0 0 n i m 4 5 0 n i m 8 1 0 n i m
3 e X
5 7 I
6 7 L
A
B
C
D
E
Fig. 2. Photodissociation and migration of the CO molecule in Mb at 120 K. (A–D) Internal cavities and time-dependent evolution of the CO electron densityin the Xe1 (A), Xe2 (B), Xe3 (C), and Xe4 (D) cavities at 120 K. The surfaces of the internal cavities are shown by the mesh in purple. The electron densities of theCO molecules in the cavities are presented by using the 2Fo � Fc map (contoured at 0.3 e/Å3). (E) Visible absorption spectra of MbCO crystal measured bymicrospectrophotometry at 120 K. (Inset) The differential absorption spectra against the initial MbCO spectrum.
K 0 4 1 K 0 2 1 K 0 0 1
0 002 400 006 800
4.0
8.0
2.1
6.1
0
1
2
3
4
5
6X 1eX 2eX 4e
Nor
mal
ized
Cav
ity V
olum
e
Num
ber
of E
lect
rons
miT e ]nim[ 0 002 400 006 800
4.0
8.0
2.1
6.1
0
1
2
3
4
5
61eX 2eX 4eX
Nor
mal
ized
Cav
ity Vo
lum
e
Num
ber
of E
lect
rons
miT e ]nim[ 0 200 400 006 008
4.0
8.0
2.1
6.1
0
1
2
3
4
5
6
Nor
mal
ized
Cav
ity V
olum
e
1eX 2eX 4eX
Num
ber
of E
lect
rons
Ti em [ ]nim
53 40 54 50 55 06 65
0
1
2
3 1 K 02
Num
ber o
f E
lect
oro
ns
V ytivaC A[ emulo 3]
1 K 00
1 K 04
54 05 55 06 56 07
0
1
2 1 K 02
Num
ber o
f El
ecto
rons
C tiva y V emulo A[ 3]
001 K
041 K
53 04 54 50
0
1
2 021 K
Num
ber
of E
lect
oron
s
vaC i yt A[ emuloV 3]
1 K 00
041 K
e t i s 1 e X e t i s 2 e X e t i s 4 e X
A B C
D E F
Fig. 3. Temporal evolution and correlation of the occupancy of CO and the cavity volume. (A–C)The number of electrons integrated in each cavity andnormalized volumes of the Xe1 (magenta), Xe2 (blue), and Xe4 (green) cavities at 100 K (A), 120 K (B), and 140 K (C) are shown. The number of electrons wasintegrated by using the CCP4 program suite (31). The volume of each cavity was calculated with the program CASTp (33) and normalized by the initial volumeat time 0. (D–F) The correlation between the number of electrons and the volume of cavities Xe1 (D), Xe2 (E), and Xe4 (F) is shown.
2614 � www.pnas.org�cgi�doi�10.1073�pnas.0807774106 Tomita et al.
Dow
nloa
ded
by g
uest
on
Mar
ch 1
1, 2
020
major ligand migration pathway in Mb at cryogenic tempera-tures. The consistency between the present results and those oftime-resolved crystallography at room temperature stronglysuggests the importance of this pathway at both room andcryogenic temperatures (9–14).
Breathing Motion of Internal Cavities in Concert with the LigandMigration. Our structural analysis clearly shows that the timedependence of the electron density of the CO molecule in thecavities correlates with the change in the estimated volume ofeach cavity, as shown in Fig. 3. This result suggests that the COmigration in the cavity causes expansion of the cavity itself,resulting in self-opening of the channel. We examined thestructural changes induced by ligand migration in more detailand conducted computational geometry analysis along the path-way by using the Delaunay tessellation method (29, 30). It shouldbe noted that the fact that none of the curves in Fig. 3 level offat longer time points shows that a steady state is not reached bythis method, which makes it difficult to provide kinetic modeland detailed theoretical fitting to the results.
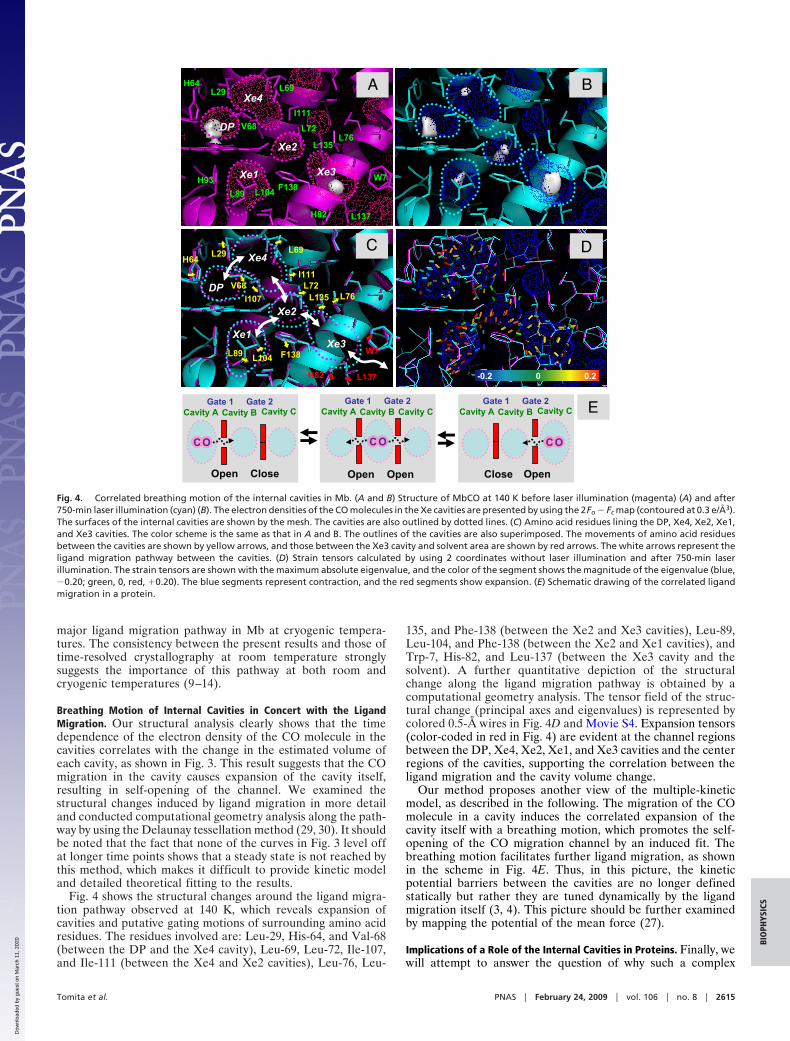
Fig. 4 shows the structural changes around the ligand migra-tion pathway observed at 140 K, which reveals expansion ofcavities and putative gating motions of surrounding amino acidresidues. The residues involved are: Leu-29, His-64, and Val-68(between the DP and the Xe4 cavity), Leu-69, Leu-72, Ile-107,and Ile-111 (between the Xe4 and Xe2 cavities), Leu-76, Leu-
135, and Phe-138 (between the Xe2 and Xe3 cavities), Leu-89,Leu-104, and Phe-138 (between the Xe2 and Xe1 cavities), andTrp-7, His-82, and Leu-137 (between the Xe3 cavity and thesolvent). A further quantitative depiction of the structuralchange along the ligand migration pathway is obtained by acomputational geometry analysis. The tensor field of the struc-tural change (principal axes and eigenvalues) is represented bycolored 0.5-Å wires in Fig. 4D and Movie S4. Expansion tensors(color-coded in red in Fig. 4) are evident at the channel regionsbetween the DP, Xe4, Xe2, Xe1, and Xe3 cavities and the centerregions of the cavities, supporting the correlation between theligand migration and the cavity volume change.
Our method proposes another view of the multiple-kineticmodel, as described in the following. The migration of the COmolecule in a cavity induces the correlated expansion of thecavity itself with a breathing motion, which promotes the self-opening of the CO migration channel by an induced fit. Thebreathing motion facilitates further ligand migration, as shownin the scheme in Fig. 4E. Thus, in this picture, the kineticpotential barriers between the cavities are no longer definedstatically but rather they are tuned dynamically by the ligandmigration itself (3, 4). This picture should be further examinedby mapping the potential of the mean force (27).
Implications of a Role of the Internal Cavities in Proteins. Finally, wewill attempt to answer the question of why such a complex
1 e X
2 e X
3 e X
4 e X
P D
2 L 9
7 L 2 7 L 6
8 L 9 1 F 3 8
6 H 4
7 W 9 H 3
6 L 9
1 1 1 I
1 L 3 7 8 H 2
8 6 V
3 e X
2 e X
4 e X
P D
1 e X
2 L 9 6 H 4
7 0 1 I
8 6 V
6 L 9
7 L 2 1 1 1 I
7 L 6 1 L 3 5
8 L 9 1 L 0 4 1 F 3 8
1 L 3 7 8 H 2
7 W
1 L 3 5
1 L 0 4
. 0 - 2 0 . 0 2
e s o l C n e p O
v a C i y t B v a C i y t C G a 1 e t G 2 e t a
v a C i y t A
n e p O e s o l C n e p O n e p O
C O C O C O
v a C i y t B C v a y t i C G a 1 e t G 2 e t a
v a C i y t A v a C i y t B v a C i y t C G a 1 e t G 2 e t a
v a C i y t A
A B
C D
E
Fig. 4. Correlated breathing motion of the internal cavities in Mb. (A and B) Structure of MbCO at 140 K before laser illumination (magenta) (A) and after750-min laser illumination (cyan) (B). The electron densities of the CO molecules in the Xe cavities are presented by using the 2Fo � Fc map (contoured at 0.3 e/Å3).The surfaces of the internal cavities are shown by the mesh. The cavities are also outlined by dotted lines. (C) Amino acid residues lining the DP, Xe4, Xe2, Xe1,and Xe3 cavities. The color scheme is the same as that in A and B. The outlines of the cavities are also superimposed. The movements of amino acid residuesbetween the cavities are shown by yellow arrows, and those between the Xe3 cavity and solvent area are shown by red arrows. The white arrows represent theligand migration pathway between the cavities. (D) Strain tensors calculated by using 2 coordinates without laser illumination and after 750-min laserillumination. The strain tensors are shown with the maximum absolute eigenvalue, and the color of the segment shows the magnitude of the eigenvalue (blue,�0.20; green, 0, red, �0.20). The blue segments represent contraction, and the red segments show expansion. (E) Schematic drawing of the correlated ligandmigration in a protein.
Tomita et al. PNAS � February 24, 2009 � vol. 106 � no. 8 � 2615
BIO
PHYS
ICS
Dow
nloa
ded
by g
uest
on
Mar
ch 1
1, 2
020

multistep ligand migration is engineered and evolutionally con-served in Mb. The amino acids lining the Xe cavities are muchmore highly conserved than other amino acids in mammalian Mband are, thus, likely to be important for function. The answer liesin the ligand migration mechanism and the discrimination ofsmall gas ligand molecules from the outer water molecules byusing the internal cavities. As shown in the crystal structure ofMb, the hydrophobic nature of the internal cavities does notfavor water molecules residing inside the cavities but allows insmall ligand molecules, such as O2, CO, and NO. Because theconcentration of water is much higher than that of O2 in solution,Mb must discriminate between O2 and the external solvent. Ourresult provides a picture of the ligand migration that the ligandmigration itself opens the gate. It proposes a general mechanismof the correlated migration of gases and ligands in proteinmatrix, which might explain why the amino acids lining thecavities are highly conserved. It is reasonable to assume thatthese features of internal cavities in proteins have been acquiredduring the long history of evolution.
Materials and MethodsSample Preparation. Native sperm whale MbCO crystals were crystallized asreported (9). The MbCO crystals were transferred from their mother liquor toa cryoprotectant solution consisting of the mother liquor with 15% glycerol.Subsequently, the crystals were flash-cooled by cold nitrogen gas and storedin liquid nitrogen until the experiment.
Cryogenic Crystallography Using Repeated Pulsed-Laser Illumination. The crys-tals were cooled to 40 K by cold helium gas or 100–140 K by cold nitrogen gas.Photolysis was done using the second harmonic of a Nd-YAG pulse laser at 532nm (Elforlight SPOT250–1064/532) with a 15-kHz repetition rate and anaverage power of 4.6 mW/mm2. Each MbCO crystal was illuminated from bothsides of the crystal. The pulse duration and the pulse energy were 2 ns and 0.97�J/pulse, respectively, corresponding to the steeple head power density of 485
W/mm2. Microspectrophotometry of the MbCO crystal was performed byusing a microscope and a spectrometer as reported (31).
Data Collection, Structure Determination, Refinement, and Analysis. The dif-fraction data were collected at beamline NW14A at PF-AR, High EnergyAccelerator Research Organization, using the undulator U20 and marDTBstage with the marCCD165 detector (32). The datasets were processed andscaled with the HKL2000 program (33). The structures were refined with theCCP4 program suite by using Protein Data Bank entry 1MBC as the startingmodel (34). The electrons in each cavity were calculated with the CCP4program suite (mainly, fft, mapmask, and mapdump). The error bars ofintegrated electrons were plotted by using the rmsd of each 2Fo � Fc map ine/Å3. Molecular graphics were created with PyMOL (35). The cavity volumeswere estimated by CASTp (36). For all structures, the size of the probe sphereradius was set at 1.4 Å. The position of the corresponding cavities was assignedwith the program CASTpyMOL (the PyMOL plug-in for the CASTp). A summaryof all data collection and refinement statistics is available in Tables S1–S3.
Computational Geometry Analysis. Delaunay tessellation was applied to theX-ray coordinates of all atoms along the putative ligand migration pathway at140 K. The pathway and the cavities were represented as an assembly ofDelaunay tetrahedra, where each tetrahedron consists of 4 atoms adjacent toeach other. After 750 min from the start of the photodissociation of CO, eachtetrahedron changes its geometry; the structural changes of the tetrahedraare illustrated by means of a strain tensor analysis with a colored segment atthe center of gravity of each tetrahedron (29, 30). The orientation of thesegment represents the principal axis of the strain tensor with the maximumabsolute eigenvalue, and the color of the segment shows the magnitude ofthe eigenvalue (blue: �0.20, green: 0, red: �0.20). The blue segments repre-sent contraction, and the red segments show expansion.
ACKNOWLEDGMENTS. We thank T. Koda, H. Ihee, and K. Moffat for com-ments on the preliminary version of the manuscript. This work was partlysupported by the Global Center of Excellence Program, Japan Society for thePromotion of Science (to S.-y.K.) and grants from the Ministry of Education,Culture, Sports, Science, and Technology (to S.-i.A.), and it was performedunder the approval of Photon Factory Program Advisory Committee (PF-PAC2004S1-001).
1. Nasu K, et al. (2004) in Photoinduced Phase Transition, ed Nasu K (World Scientific,Singapore), pp 1–342.
2. Koshihara S, Adachi S (2006) Photo-induced phase transition in an electron-latticecorrelated system: Future role of a time-resolved X-ray measurement for materialsscience. J Phys Soc Jpn 75:011005-1-10.
3. Fenimore PW, Frauenfelder H, McMahon BH, Parak FG (2002) Slaving: Solvent fluctu-ations dominate protein dynamics and functions. Proc Natl Acad Sci USA 99:16047–16051.
4. Austin RH, Beeson KW, Eisenstein L, Frauenfelder H, Gunsalus IC (1975) Dynamics ofligand binding to myoglobin. Biochemistry 14:5355–5373.
5. Alben JO, et al. (1982) Infrared spectroscopy of photodissociated carbonmonoxymyo-globin at low temperatures. Proc Natl Acad Sci USA 79:3744–3748.
6. Henry ER, Sommer JH, Hofrichter J, Eaton WA (1983) Geminate recombination ofcarbon monoxide to myoglobin. J Mol Biol 166:443–451.
7. Olson JS, Phillips GN, Jr (1996) Kinetic pathways and barriers for ligand binding tomyoglobin. J Biol Chem 271:17593–17596.
8. Scott EE, Gibson QH (1997) Ligand migration in sperm whale myoglobin. Biochemistry36:11909–11917.
9. Srajer V, et al. (1996) Photolysis of the carbon monoxide complex of myoglobin:Nanosecond time-resolved crystallography. Science 274:1726–1729.
10. Srajer V, et al. (2001) Protein conformational relaxation and ligand migration inmyoglobin: A nanosecond to millisecond molecular movie from time-resolved LaueX-ray diffraction. Biochemistry 40:13802–13815.
11. Schotte F, et al. (2003) Watching a protein as it functions with 150-ps time-resolvedX-ray crystallography. Science 300:1944–1947.
12. Bourgeois D, et al. (2003) Complex landscape of protein structural dynamics unveiledby nanosecond Laue crystallography. Proc Natl Acad Sci USA 100:8704–8709.
13. Schotte F, Soman J, Olson JS, Wulff M, Anfinrud PA (2004) Picosecond time-resolvedX-ray crystallography: Probing protein function in real time. J Struct Biol 147:235–246.
14. Schmidt M, et al. (2005) Ligand migration pathway and protein dynamics in myoglobin:A time-resolved crystallographic study on L29W MbCO. Proc Natl Acad Sci USA102:11704–11709.
15. Teng T-Y, Srajer V, Moffat K (1994) Photolysis-induced structural changes in singlecrystals of carbonmonoxymyoglobin at 40 K. Nat Struct Biol 1:701–705.
16. Schlichting I, Berendzen J, Phillips GN, Jr, Sweet RM (1994) Crystal structure of photo-lysed myoglobin. Nature 371:808–812.
17. Hartmann H, et al. (1996) X-ray structure determination of a metastable state of carbon-monoxy myoglobin after photodissociation. Proc Natl Acad Sci USA 93:7013–7016.
18. Teng T-Y, Srajer V, Moffat K (1997) Initial trajectory of carbon monoxide after photodis-sociation from myoglobin at cryogenic temperatures. Biochemistry 36:12087–12100.
19. Vitkup D, Petsko GA, Karplus MA (1997) A comparison between molecular dynamicsand X-ray results for dissociated CO in myoglobin. Nat Struct Biol 4:202–208.
20. Chu K, et al. (2000) Structure of a ligand-binding intermediate in wild-type carbon-monoxy myoglobin. Nature 403:921–923.
21. Ostermann A, Waschipky R, Parak FG, Nienhaus GU (2000) Ligand binding and con-formational motions in myoglobin. Nature 404:205–208.
22. Adachi S, Park S-Y, Tame JRH, Shiro Y, Shibayama N (2003) Direct observation ofphotolysis-induced tertiary structural changes in hemoglobin. Proc Natl Acad Sci USA100:7039–7044.
23. Tilton RF, Jr, Kuntz ID, Jr., Petsko GA (1984) Cavities in proteins: Structure of ametmyoglobin-xenon complex solved to 1.9 Å. Biochemistry 23:2849–2857.
24. Case DA, Karplus M (1979) Dynamics of ligand binding to heme proteins. J Mol Biol132:343–368.
25. Elber R, Karplus M (1987) Multiple conformational states of proteins: A moleculardynamics analysis of myoglobin. Science 235:318–321.
26. Bossa C, et al. (2004) Extended molecular dynamics simulation of the carbon monoxidemigration in sperm whale myoglobin. Biophys J 86:3855–3862.
27. Cohen J, Arkhipov A, Braun R, Schulten K (2006) Imaging the migration pathways forO2, CO, NO, and Xe inside myoglobin. Biophys J 91:1844–1857.
28. Henry ER, Eaton WA, Hochstrasser RM (1986) Molecular dynamics simulations ofcooling in laser-excited heme proteins. Proc Natl Acad Sci USA 83:8982–8986.
29. Yamato T (1996) Strain tensor field in proteins. J Mol Graphics 14:105–107.30. Yamato T, Higo J, Seno Y, Go N (1993) Conformational deformation in deoxymyoglo-
bin by hydrostatic pressure. Proteins Struct Funct Genet 16:327–340.31. Sakai K, Matsui Y, Kouyama T, Shiro Y, Adachi S (2002) Optical monitoring of freeze-
trapped reaction intermediates in protein crystals: A microspectrophotometer forcryogenic protein crystallography. J Appl Crystallogr 35:270–273.
32. Nozawa S, et al. (2007) Developing 100-ps-resolved X-ray structural analysis capabilities onbeamline NW14A at the Photon Factory Advanced Ring. J Synchrotron Rad 14:313–319.
33. Otwinowski Z, Minor W (1997) Processing of X-ray diffraction data collected in oscil-lation mode. Methods Enzymol 276:307–326.
34. Collaborative Computational Project 4 (1994) The CCP4 Suite: Programs for ProteinCrystallography. Acta Crystallogr D 50:760–763.
35. Delano WL (2002) The PyMOL Molecular Graphics System (Delano Scientific, SanCarlos, CA).
36. Dundas J, et al. (2006) CASTp: Computed atlas of surface topography of proteins withstructural and topographical mapping of functionally annotated residues. Nucleic AcidRes 34:W116–W118.
2616 � www.pnas.org�cgi�doi�10.1073�pnas.0807774106 Tomita et al.
Dow
nloa
ded
by g
uest
on
Mar
ch 1
1, 2
020