visualizing earth’s surface. i.maps: i.maps: represent a portion of the earth’s surface....
TRANSCRIPT

Visualizing Visualizing Earth’s Surface Earth’s Surface
I.I.MapsMaps:: Represent a portion of the Earth’s surface. Different maps are used to show different information about the Earth.

A. A. TypesTypes ofof MapsMaps::1-Weather1-Weather
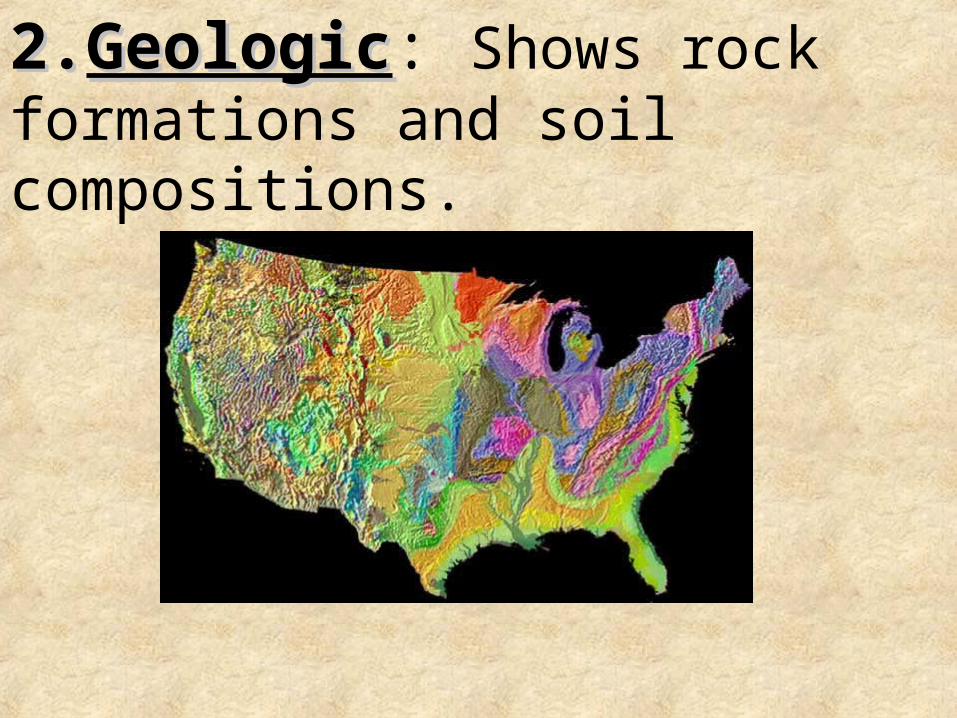
2.2.GeologicGeologic: Shows rock formations and soil compositions.

3. 3. RoadRoad: Shows roads, towns, and cities.

II-II-FieldField Maps: Maps: A map on which similar measurements are plotted
Examples: Examples: could be temperature, pressure, or elevation.
A- A- IsolinesIsolines - - Connect points of equal value on a field map.
““Iso-” means sameIso-” means same

Examples of Field Examples of Field MapsMaps
1- Isobars1- Isobars - Lines connecting equal
pressures
2- Isotherms2- Isotherms - Lines connecting equal
temperatures
3- Contour Lines - 3- Contour Lines - Lines connecting equal elevations

B- Topography: B- Topography: general form and shape of the land on Earth’s surface (mountains, valleys, mountains, valleys, streams, ectstreams, ect)

C- Topographic C- Topographic Maps -Maps --show the shape of earth’s surface
-isolines on a topographic map are called contourcontour lineslines
- ContourContour lineslines show points of equal elevation

1- Index Contour 1- Index Contour Lines Lines
- Heavy lines spaced at a predetermined
elevations on a topographic map.

2- 2- Contour IntervalContour Interval- - The vertical distance that separates each contour line on a topographic map.
Benchmark – tells the real elevation at
that point
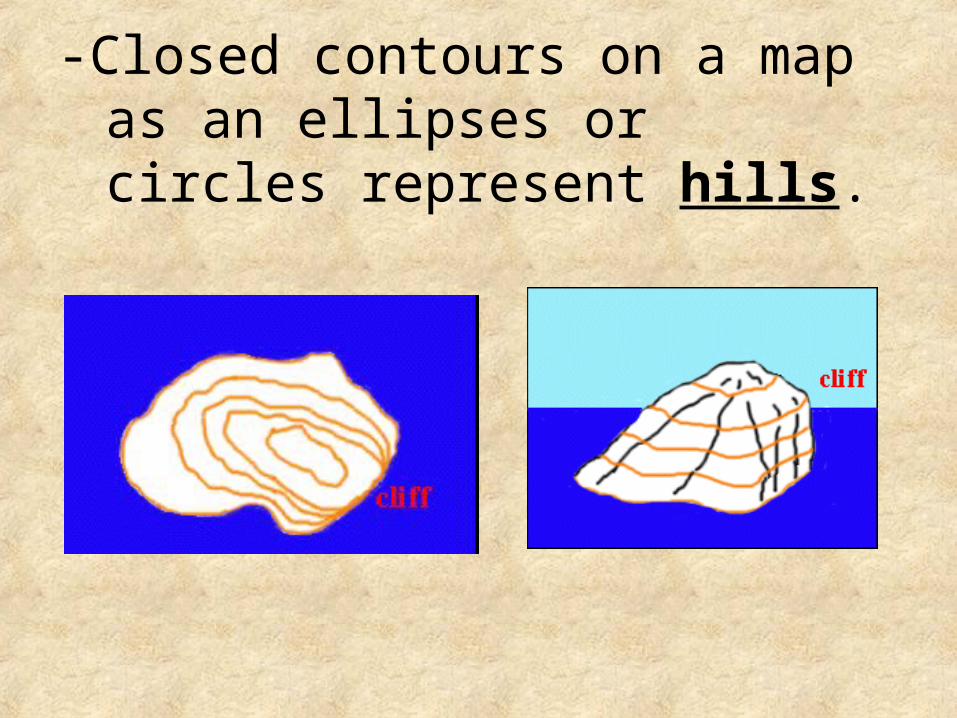
-Closed contours on a map as an ellipses or circles represent hills.
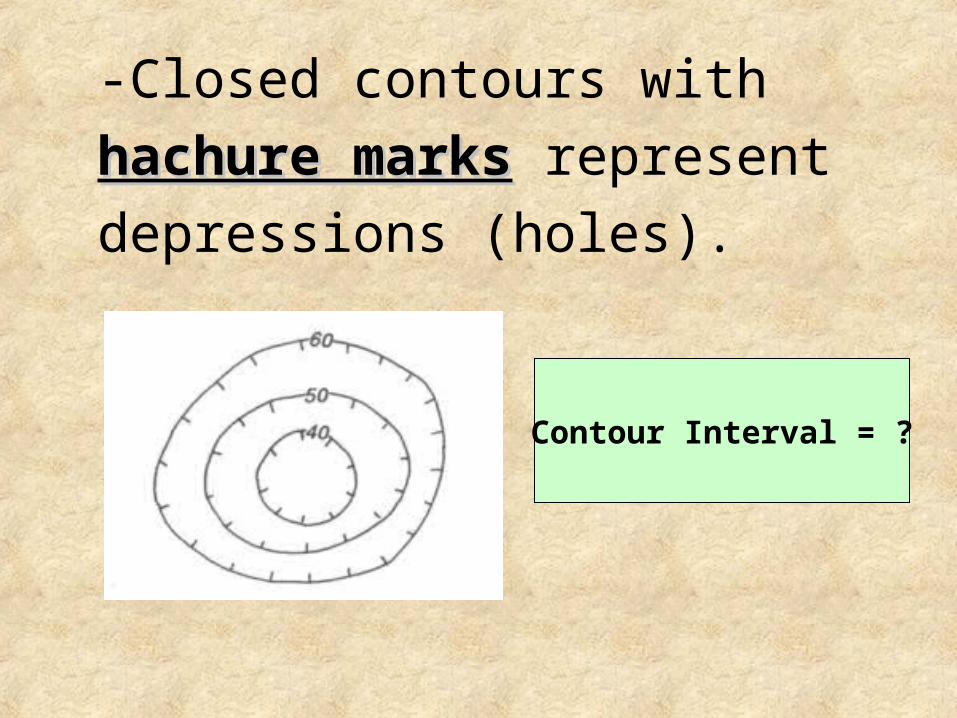
-Closed contours with hachure markshachure marks represent depressions (holes).
Contour Interval = ?
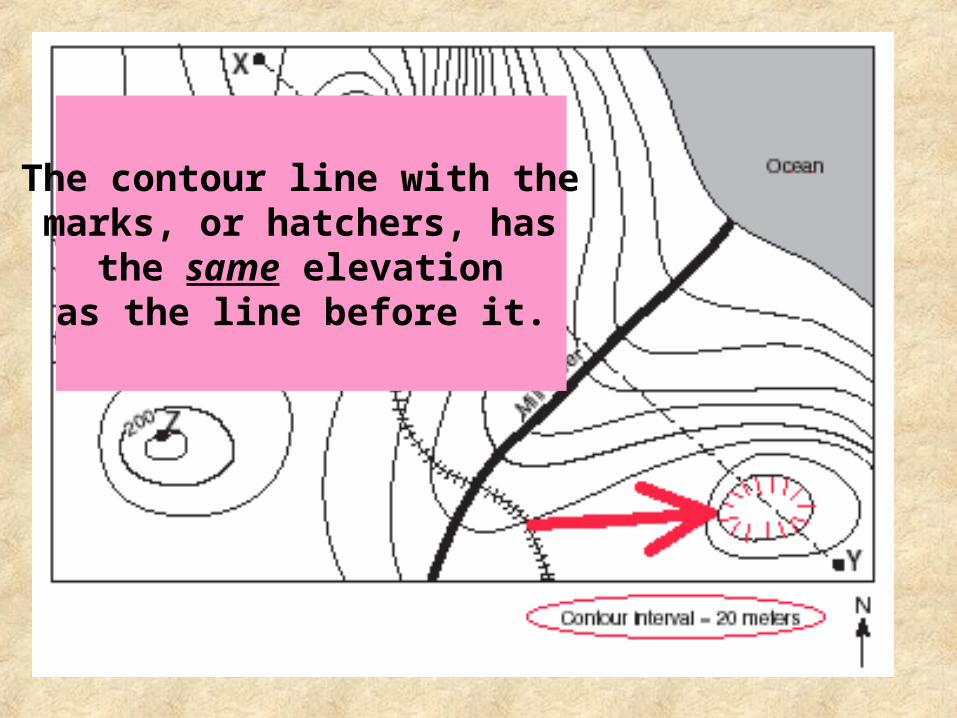
The contour line with the marks, or hatchers, has
the same elevation as the line before it.

•Water flows down
hill
•From a higher
elevation to a lower
elevation

-When a contour
lines cross a river they
make a “V” that points upstream.
(water flows in
the opposite
direction)

III- Rules for Contour III- Rules for Contour Lines: Lines: 1.A contour line represents a single equal
elevation: that is, all points on the same contour line have the same elevation.
•15
•5•5
•15•10
•10•10
•10
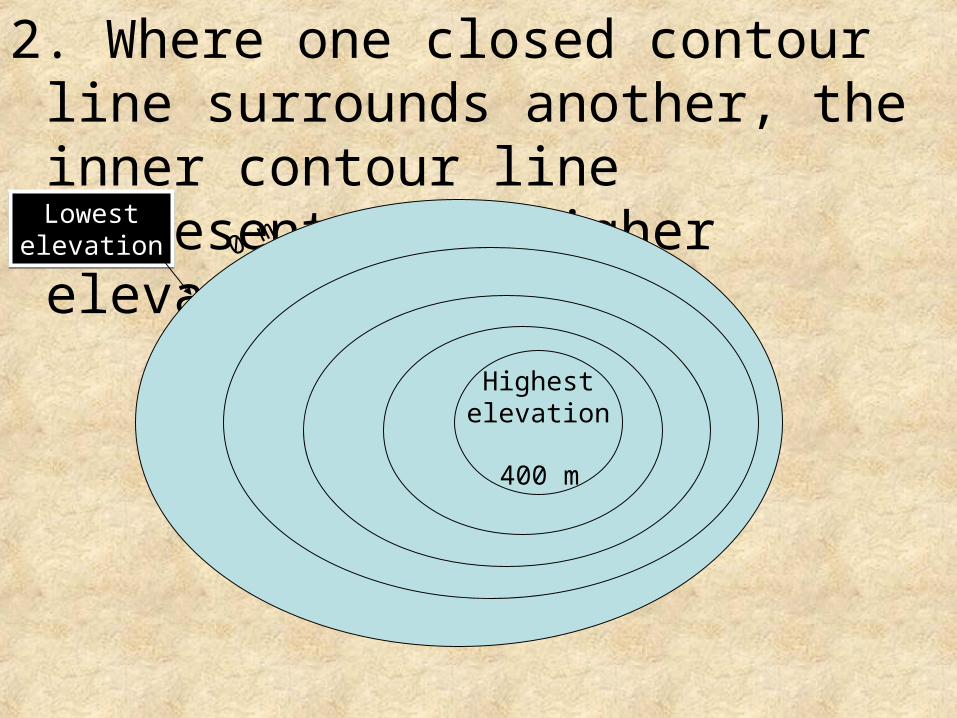
2. Where one closed contour line surrounds another, the inner contour line represents the higher elevation.
0 m
400 m
LowestelevationLowest
elevation
Highestelevation

3. The elevation represented by a contour line is always a simple multiple of the contour interval. (5, 10, 50, 100)
100 m0 m
200 m
300 m
400 m

4. A contour line that closes within the limits of the map indicates a hill, ridge or plateau.

5. On the same map, closely spaced contour lines indicate a relatively steep slope, widely spaced contour lines indicate a relatively gentle slope. Steep
GradientSteep
Gradient
GentleGradientGentle
Gradient
GentleGradientGentle
Gradient
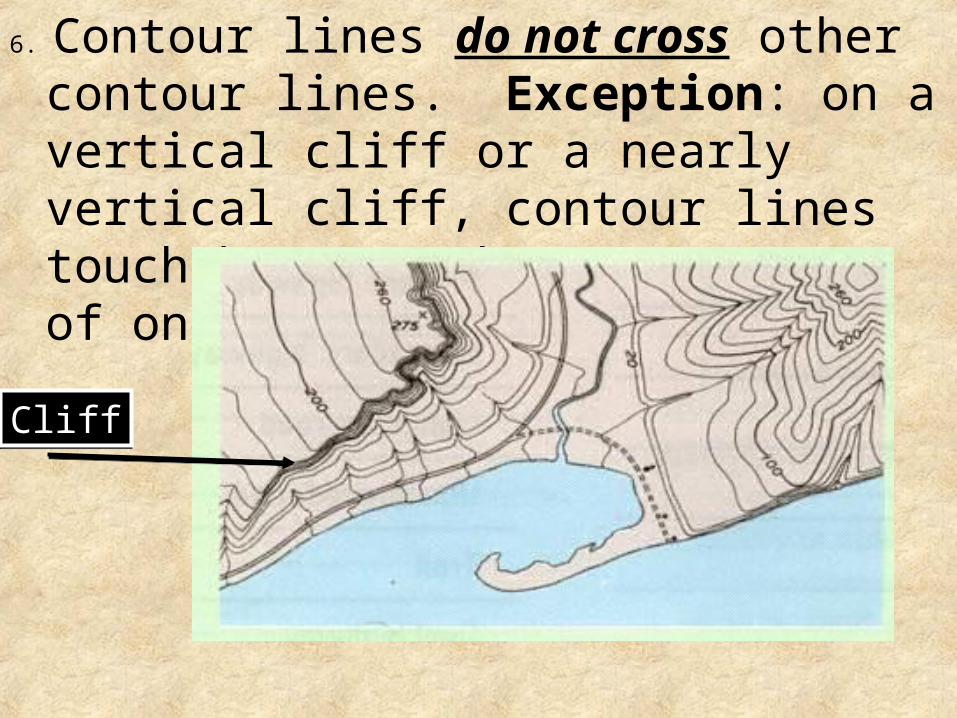
6. Contour lines do not cross other contour lines. Exception: on a vertical cliff or a nearly vertical cliff, contour lines touch because they are on top of one another
CliffCliff

7. Every contour line eventually closes against itself. However, the map area may not be large enough to show this closure. Therefore, the contours will end at the edge of the map.

8. Closed depressions are shown by hachured contour lines. The hachures point into the depression. (HachuresHachures = short dashes)

9. A hachured contour line, lying between two different contour lines, is the same elevation as the lower contour line.
Count up Count up Count down Count down
Contour Elevation Repeats
Contour Elevation Repeats

10. Where a contour line crosses a stream or valley, the contour bends to form a “V” that points upstream or up the valley.