visualizing equity: learning from “data science for social
TRANSCRIPT

The Ethical Imperative 469
Data science has developed a culture of “data science for social good,” or DSSG, to provide data analysis to public and nonprofit organizations with limited access to resources. A multidisciplinary team from the College of Built Environments had the opportunity to participate in the University of Washington DSSG summer program 2017. Their project focused on building a web-based tools for analyzing and visualizing urban equity across Seattle, Washington. This multidisciplinary collaboration created a tremendous oppor-tunity to answer specific inquiries about visualizing equity and supporting that visual analysis with the rigor of a model. As built environment colleges continue to define and address twenty-first-century challenges, especially through the lens of urban systems and data analysis, this project is an example of a built environment-generated, public-facing tool that can serve the city, university, and community equally.
INTRODUCTIONThe relatively recent field of data science—the coupling between statistics and computer science—makes sense of large data sets and uses them to answer complex questions. It began to emerge about twenty years ago and it has been most prevalent in the corporate and investment sectors, which collect, analyze, and model large quantities of data, and have the money to invest in that process. Data science and the scientists who do the work enable businesses to operate more efficiently and effectively to create larger profits. However, in contrast, the public and nonprofit sectors typically have fewer resources to put towards new approaches and technologies, though they and their stakeholders would also benefit from new strategies in data collection and analysis. Confronted with this ethical dilemma of data access being dependent upon financial resources, the data science discipline has developed an impressive culture of “data science for social good” (DSSG).
This culture has grown via events such as “data for good” hack-a-thons and data drives—the data science equivalent of a charrette—events that are vital to the creativity of the data science community and specifically support public-interest organizations and nonprofits with their data science needs. Meanwhile, over the last five years, the DSSG idea has found its way into more comprehensive university summer pro-grams. Originally begun at the University of Chicago in 2013, DSSG summer programs are now running in multiple locations including in the United States; Vancouver BC, Canada; and Cascais, Portugal, and continue to expand. These programs foster collaborations between students in data science and
related fields, data scientists, researchers, and representatives of nonprofit and public organizations over a multiple-week period.
DSSG AND BUILT ENVIRONMENT COLLABORATIONThe DSSG summer program 2017 at the University of Washington was a unique opportunity for the authors of this paper to connect across departments within the UW College of Built Environments as well as to explore issues that the team was concerned with—equity, urban systems, analysis, and visualization—through the medium of data science. Through the project, the authors, representing Architecture and Urban Design and Planning, sought to bridge data science and built environment approaches and concerns. This approach cre-ated opportunities to break down siloed thinking and create bridges across extremely diverse disciplines and allowed the project to generate innovative outcomes. Another key contri-bution of this project was to increase knowledge and exposure as the connection between the built environment disciplines and data science is still underrepresented. Departments that teach built environment professionals fall into the group of organizations that typically lack access to data scientists. As co-leads of the Equity Modeler, a project focused on visual-izing and analyzing urban equity across the built fabric of Seattle, Washington, the authors had also the opportunity to intimately immerse themselves in the culture, practices, and ethics of Data Science for Social Good (DSSG).
The primary goal of the DSSG Equity Modeler project was to create a tool that would help reveal equity issues through interactive data analysis and mapping to designers, planners, researchers, and developers concerned with the creation of a more equitable urban environment. How could hidden and complex variables that play into urban equity, called latent variables in data science, be visualized so that they can be more easily integrated in the design process? What could be learned with the help of big data about equity in the urban environment and in specific neighborhoods?
Being emerged in the DSSG culture, collaborating with data scientists, and leading a multidisciplinary team of graduate students, from outside of the BE professions, helped the project and team accomplish two important things. First, the DSSG process revealed a set of considerations and questions for how data science and the built environment domains inter-act including how teams work together, share knowledge, and so forth. Second, the project explored urban equity using big
Visualizing Equity: Learning from “Data Science for Social Good” in the Built EnvironmentGUNDULA PROKSCHUniversity of Washington
RACHEL BERNEYUniversity of Washington

470 Open: Urbanism
data; this process created new questions, approaches, and outcomes for the study of equity.
URBAN INEQUALITY AND SPATIAL MAPPINGFrom the late twentieth century onward, there has been an increased focus on examining inequities that are tied to places. Inequality is not just measured across groups of people, but also across spaces to see where resources and opportunities cluster and how the geographic distribution of opportu-nity aligns with the geographic distribution of demographic groups. Reece et al. (2013) write that “neighborhoods power-fully shape residents” access to social, political, and economic opportunities and resources”. Recognizing how place and environment affect equity, mapping equity has largely been tasked to urban planners, policymakers and nonprofits that are focused on social justice and equitable resource distribu-tion. In practice, achieving greater urban equity is a goal and a process that cuts across disciplinary boundaries.
Urban inequality is growing; it constitutes a major problem for almost all cities and metropolitan areas. Inequalities are present in terms of income, education, service provision, and even the health of neighborhoods across cities. Gentrification, displacement, and urban poverty are some of the drivers of inequitable conditions; they are all inherently complex, mul-tifaceted societal problems that demand multidisciplinary approaches to improve. Various disciplines have tackled these problems with their own methods and a limited set of indicators and datasets. Built environment professionals, for example, might employ mapping to understand the spatial dis-tribution of indicators of gentrification and their change over time aiming to create policies to manipulate the development of neighborhoods, while sociologists and economists might describe these processes via statistical analysis based on socioeconomic data. Few if any of these previous approaches to analyzing and understanding urban inequality have used a data science approach.
ESTABLISHING COLLABORATION IN A MULTIDISCIPLINARY TEAM The Equity Modeler project was selected as one of four proj-ects of the University of Washington DSSG 2017 summer program. The focus of DSSG is to train students from a wide range of disciplines in data science methodologies while help-ing community members execute social good projects (Rokem et al. 2015). Each DSSG team consists of four student fellows, two data science leads, and one or more project leads who proposed the project. The DSSG program runs for ten weeks during the summer with some lead time beforehand for the project leads and data science leads to develop project goals. The main objective of the program is to arrive at actionable information through a process of data-driven discovery (Berney et al. 2017; Herman et al. 2017).
The Equity Modeler team brought together a diverse set of disciplines. Student fellows had backgrounds in physics, eco-nomics, statistics, human-centered design, and information management; the two project leads contributed expertise in architecture and urban design and planning, while the data scientists brought expertise in statistical modeling, cloud computing, and visualization. The initial two weeks of the program—which included a workshop addressing multidisci-plinary collaboration specifically—laid the vital groundwork for the task of building a common vocabulary and under-standing across these varied backgrounds. The team found, however, that it needed to create additional collaborative infrastructure to support acquisition of the shared domain knowledge required by our project: this infrastructure revolved around vocabulary and domain language; visual note- and story-telling, and a robust information management structure that could organize inputs in the form of thoughts, ideas, documents, sketches, and photographs into one cen-tralized and accessible location. See figure 1 for a photograph of one example of the team’s visual notetaking.
In particular, the team learned that it needed to take time to brainstorm key terms and have each person define what the
Figure 1: Equity Modeler team’s visual notetaking on a whiteboard

The Ethical Imperative 471
term meant in their domain language. Second, the team made liberal use of whiteboards, paper, and so forth to create visual group notes that were able to convey and capture meaning for all team members. Visual notetaking became broadly accepted and used within the team; it was a benefit that the two project co-leads from the College of Built Environments were able to use their visual thinking abilities to help lead this process. Finally, the team developed an information manage-ment process. Specifically, the project dealt with the complex and broad subjects of urban equity and gentrification—which have been conceptualized and operationalized in different ways by different fields, yielding a large number of theorized processes, terminology definitions, and empirical indicators. In dealing with the heterogeneous literature, the team created a literature review workflow to efficiently and collaborative share information and pose questions to one another.
Given the scope of the domain, managing the literature review process and its resulting information was a challenge in its own right. Through experimentation and by drawing on insights and methods from information architecture and informa-tion systems design (Ambler 2009; Rosenfeld, Morville, and Arango 2015), the team developed a workflow and informa-tion repository incorporating a structured spreadsheet and an activity diagram alongside a traditional annotated bibli-ography. In brief, the cloud-based spreadsheet supported collaborative capture of notes, indicators, and interventions from sources in a form that can be analyzed more readily than a typical annotated bibliography. An activity diagram served as an evolving point of reference for the team, supporting team comprehension of complex subject matter through information visualization and laying the foundation for future narrative material to publish alongside the data-focused tool. (See figure 2).
THE EQUITY MODELEROne of the main challenges of identifying, analyzing, and understanding issues of equity in cities is that the bodies of literature pertaining to urban equity include a multitude of indicators but there remains a limited understanding of which ones are most significant (Herman et al. 2017). A data science approach to measuring, for example, the opportunities and risks related to urban inequality could significantly benefit the analysis process. Currently most if not all urban equity indica-tor projects rely upon informed but subjective assessments of the relative value of any given indicator to the overall set of indicators. Another challenge is that indicators projects pro-liferate and each project has its own rationale and unique set of indicators.
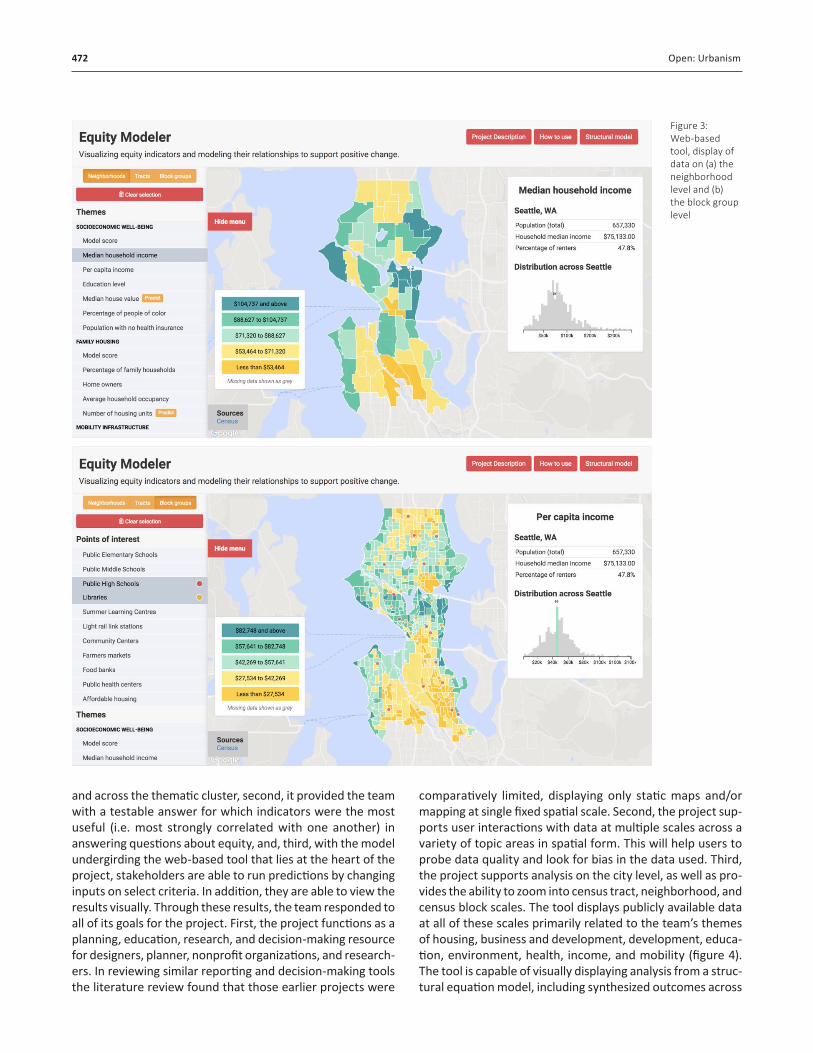
The initial focus of this project was to develop a tool for visual-izing and predicting the effects of specific indicator changes across the built fabric of a city. The project uses data science methods to test and establish a more comprehensive defini-tion of urban equity problems in the urban context. To achieve this, the project synthesizes different methods such as visual-ization and modeling into one interactive tool. This approach systematically and transparently weighs and relates equity risks and opportunities to better understand their interde-pendencies and to more effectively address them in urban development processes. Users are able to engage the visual-ization tool via an interactive web-based mapping interface (see figure 3). Using a data science approach, the first step in the project was to create a literature review to assess and select the most commonly used indicators of urban inequity and then combine them into thematic clusters. The team then ran a factor analysis on each cluster and established a structural equation model for the relationships between indi-cators based on strength of the statistical relationships. This process yielded three innovative and promising additions to indicator-based evaluation. First, it established a transparent and replicable relationship network among indicators within
Figure 2: Equity Modeler main project elements and team workflow
472 Open: Urbanism
and across the thematic cluster, second, it provided the team with a testable answer for which indicators were the most useful (i.e. most strongly correlated with one another) in answering questions about equity, and, third, with the model undergirding the web-based tool that lies at the heart of the project, stakeholders are able to run predictions by changing inputs on select criteria. In addition, they are able to view the results visually. Through these results, the team responded to all of its goals for the project. First, the project functions as a planning, education, research, and decision-making resource for designers, planner, nonprofit organizations, and research-ers. In reviewing similar reporting and decision-making tools the literature review found that those earlier projects were
comparatively limited, displaying only static maps and/or mapping at single fixed spatial scale. Second, the project sup-ports user interactions with data at multiple scales across a variety of topic areas in spatial form. This will help users to probe data quality and look for bias in the data used. Third, the project supports analysis on the city level, as well as pro-vides the ability to zoom into census tract, neighborhood, and census block scales. The tool displays publicly available data at all of these scales primarily related to the team’s themes of housing, business and development, development, educa-tion, environment, health, income, and mobility (figure 4). The tool is capable of visually displaying analysis from a struc-tural equation model, including synthesized outcomes across
Figure 3: Web-based tool, display of data on (a) the neighborhood level and (b) the block group level

The Ethical Imperative 473
Figure 4: Structural equation model, (a) schematic diagram and (b) display of model score at the neighborhood scale
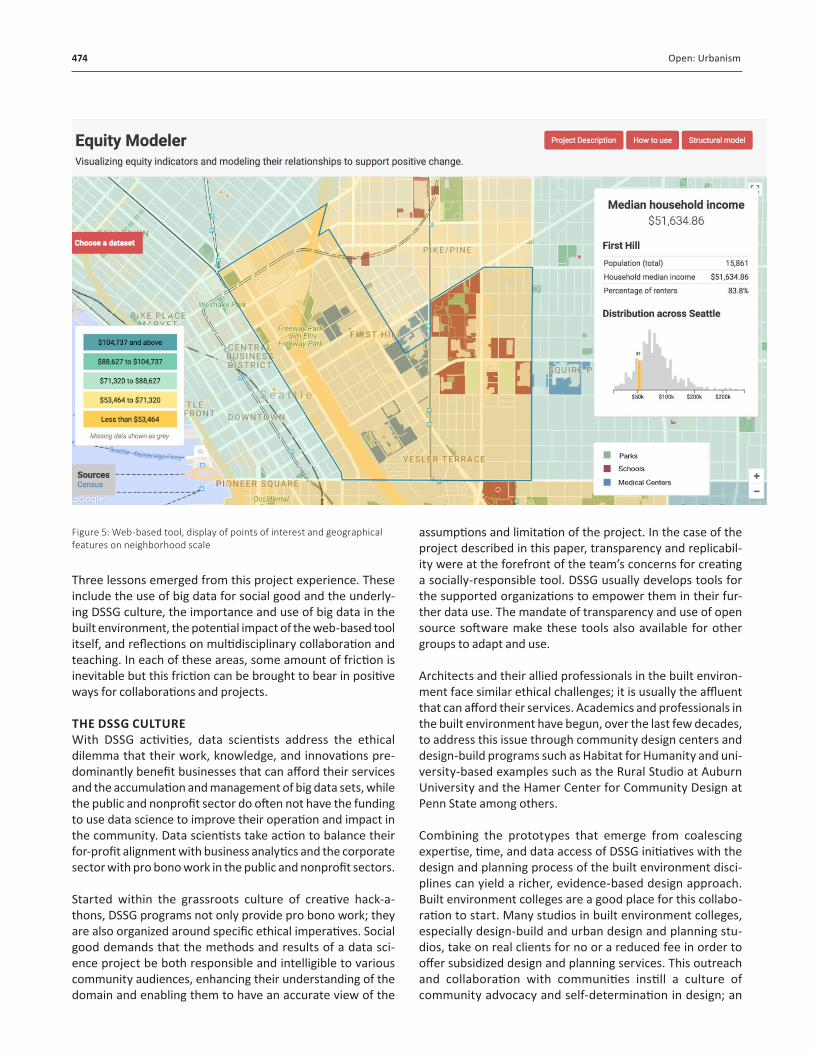
thematic clusters (figure 4b). It is also able to display the raw data sets that were sourced from the US Census Bureau and city records to be used in the tool. While much of the raw data and analytical results are most easily viewed at the census tract and census block level, the tool provides an in-depth zoom function to allow users to explore points of interest and geographical features of the built environment along with the results from the model (figure 5).
LESSONS LEARNEDOverall the team successfully explored how urban equity, a grave concern in the social sciences and community-based design and development, could be better understood and, hopefully, better solved for using a combined built environ-ment and data science approach. With a team composed of built environment faculty, data scientists, and student fellows from statistics, physics, information science, and human-cen-tered design, the team’s approach was novel but also required a lot of deliberate communication. In reality, the intense mul-tidisciplinary collaboration generated frequent juxtapositions between different domain knowledge, data science strategies, and different approaches and work cultures in the disciplines involved.
474 Open: Urbanism
Three lessons emerged from this project experience. These include the use of big data for social good and the underly-ing DSSG culture, the importance and use of big data in the built environment, the potential impact of the web-based tool itself, and reflections on multidisciplinary collaboration and teaching. In each of these areas, some amount of friction is inevitable but this friction can be brought to bear in positive ways for collaborations and projects.
THE DSSG CULTURE With DSSG activities, data scientists address the ethical dilemma that their work, knowledge, and innovations pre-dominantly benefit businesses that can afford their services and the accumulation and management of big data sets, while the public and nonprofit sector do often not have the funding to use data science to improve their operation and impact in the community. Data scientists take action to balance their for-profit alignment with business analytics and the corporate sector with pro bono work in the public and nonprofit sectors.
Started within the grassroots culture of creative hack-a-thons, DSSG programs not only provide pro bono work; they are also organized around specific ethical imperatives. Social good demands that the methods and results of a data sci-ence project be both responsible and intelligible to various community audiences, enhancing their understanding of the domain and enabling them to have an accurate view of the
assumptions and limitation of the project. In the case of the project described in this paper, transparency and replicabil-ity were at the forefront of the team’s concerns for creating a socially-responsible tool. DSSG usually develops tools for the supported organizations to empower them in their fur-ther data use. The mandate of transparency and use of open source software make these tools also available for other groups to adapt and use.
Architects and their allied professionals in the built environ-ment face similar ethical challenges; it is usually the affluent that can afford their services. Academics and professionals in the built environment have begun, over the last few decades, to address this issue through community design centers and design-build programs such as Habitat for Humanity and uni-versity-based examples such as the Rural Studio at Auburn University and the Hamer Center for Community Design at Penn State among others.
Combining the prototypes that emerge from coalescing expertise, time, and data access of DSSG initiatives with the design and planning process of the built environment disci-plines can yield a richer, evidence-based design approach. Built environment colleges are a good place for this collabo-ration to start. Many studios in built environment colleges, especially design-build and urban design and planning stu-dios, take on real clients for no or a reduced fee in order to offer subsidized design and planning services. This outreach and collaboration with communities instill a culture of community advocacy and self-determination in design; an
Figure 5: Web-based tool, display of points of interest and geographical features on neighborhood scale

The Ethical Imperative 475
influence that students may be more likely to maintain and expand in their professional careers.
DATA SCIENCE IN THE BUILT ENVIRONMENT Cities are the largest generators of data. Municipalities col-lect vast amounts of information about, for example, their residents; transportation, education, and health systems; utilities, and the physical environment. Many are still at the beginning of making sense of this wealth of data. Furthermore, cities currently frequently serve as clients in DSSG programs. Combined, these trends generate a great opportunity for the allied design and planning disciplines in the built environment to claim a stronger role in this process and establish more sophisticated approaches, in collaboration with data scien-tists, in using urban data in their work. Some notable research labs have laid the groundwork for integrating data science in the built environment disciplines. They include the Centre for Advanced Spatial Analysis (CASA) at the Bartlett Faculty of the Built Environment at University College London. CASA, under the leadership of Michael Batty, has been a pioneer in this field since 1998 and has contributed a wealth of strate-gies and analysis tools in the working papers and applications generated by the centre. More recently, in the early 2000s, the Massachusetts Institute of Technology launched its Civic Design Data Lab and Columbia University launched its Spatial Information Design Lab in 2015.
The DSSG project described in this paper explores how data science can be used to address social issues, equitable access to urban resources, and potentially other ethically challenging concerns in the built environment. While there is a growing need to address inequality in cities there are--as the litera-ture research shows--not yet sophisticated enough models yet how to use big data to more strategically to mitigate these challenges.
THE EQUITY MODELER TOOL AND ITS IMPACTSThere are three impacts of the tool that emerged during the DSSG project that are important to highlight here. They are applications for the tool and its underlying modeling, outcomes, and the relative newness of this approach. The process of developing the tool and its underlying model during the DSSG summer program shows that the process and product were disruptive in a very good way. The project needed multidisciplinary input to be successful; neither the students nor the project and data leads could function in a siloed manner. This is exemplified in the need that arose in the team to share alternative definitions of the same word as experienced in different domains. This multidisciplinary need can push design and planning practices in built environ-ment colleges and programs. One example would be to run evidence-based design studios in which data scientists and designers work together to better address complex issues. A second example would be formalizing some of the methods the team employed to better understand one another into
tools that could be used in design studios; this approach is elaborated in lesson 4 below.
CONCLUSIONS AND NEXT STEPSAs built environment colleges continue to define and address twenty-first-century challenges, especially through the lens of urban systems and urban data, the project described here provides a robust example of a built environment-generated, public-facing tool that can be both city, university, and col-laboration serving. The tool and its underlying model have the potential to better address complexities in how the built environment is developed and experienced than the more traditional subjective weighting and combining of indicators done in many projects. There is also potential for the tool to be useful to organizations with their own unique indicator projects. By running their indicators through the analytical capabilities of the tool, organizations can gain a better sense of the fitness of their indicator choices. Also, by bringing to the evidence-based design studio tradition a data science approach, the team and the project represent a new direc-tion in architecture and its allied fields as well as for design education.
Urban challenges and questions, in particular, require innova-tive and collaborative methods and approaches. This is crucial and vital work and it requires some comfort with alternative ways of thinking, horizontal and non-siloed approaches, and the time to build a supportive process. The DSSG program created a tremendous opportunity for the multidisciplinary team to propose and answer specific inquiries about visual-izing equity in spatial form and supporting that visual analysis with the rigor of a model. Working on urban equity is a com-plex process and one that no single discipline can own or hope to solve on its own.
REFERENCES1 Ambler, Scott. 2009. Agile Model-Driven Development with UML 2.0 (3rd ed.).
Cambridge: Cambridge University.
2 Berney, Rachel et al. 2017. Visualizing Equity: A Data Science for Good Tool and Model for Seattle. Data Science for Social Good Conference, University of Chicago, 28 September.
3 Herman, Bernease et al. (2017). Accessibility and Transparency in Urban Equity and Gentrification Collaborations. Bloomberg Data for Good Exchange, New York, 24 September.
4 Reece, Jason et al. 2013. Place Matters: Using Mapping to Plan for Opportunity, Equity, and Sustainability. Columbus, OH: Kirwan Institute, Ohio State University. Retrieved from http://kirwaninstitute.osu.edu/my-product/opportunity-mapping-issue-brief
5 Rokem, Ariel et al. 2015. Building an Urban Data Science Summer Program at the University of Washington eScience Institute. Bloomberg Data for Good Exchange, New York, 28 September.
6 Rosenfeld, Louis, Peter Morville, and Jorge Arango. 2015. Information Architecture for the Web and Beyond (4th ed.). Sebastopol, CA: O’Reilly Media.
ACKNOWLEDGEMENTSWe gratefully acknowledge the work of the DSSG Equity Modeler project’s data sci-entists Bernease Herman and Amanda Tan and the student fellows Hillary Dawkins, Jacob Kovacs, Yahui Ma, and Jacob Rich as well as the support of the UW eScience Institute.