visualizing globalization - princeton university
TRANSCRIPT

Slide 1
Visualizing Visualizing GlobalizationGlobalizationObserving Trade, 1980-2001
Presentation to the 37Presentation to the 37thth World Congress World Congress of the of the International Institute of Sociology, International Institute of Sociology, Stockholm, Sweden, 5Stockholm, Sweden, 5--9 July 20059 July 2005
Miguel Centeno, Sara R. Curran, John Galloway, Paulette Lloyd & Suresh SoodPrinceton University, University of Washington, University of Technology Sydney & NetMap Analytics
This presentation represents the beginning of a 5 year team project (with Miguel Centeno at PU, Sara Curran who will be at UW in the fall, John Galloway and Suresh Sood at U of Technology, Sydney and NetMap Analytics) focused on an empirical documentation and exploration of globalization processes. The first part of our multi-year, multi-institutional project examines changing trade dynamics.

Slide 2
Globalization is a process leading to Globalization is a process leading to greater interdependence and mutual greater interdependence and mutual awareness (reflexivity) among awareness (reflexivity) among economic, political, and social units in economic, political, and social units in the world, and among actors in general.the world, and among actors in general.
Mauro GuillMauro Guilléén 2001n 2001
There are multiple competing definitions of globalization. This well known quote by Mauro Guillen is emblematic of attempts to put a definition around the term and to suggest a structure to the phenomena. His definition focuses on processes including exchanges of all types among multiple social units. It also implies changes in the structure of exchanges. And, as is typical of most attempts to define globalization, fails to specify details regarding degree of interdependence, mutuality, social units, or by what mechanisms and under what conditions this occurs.
Slide 3
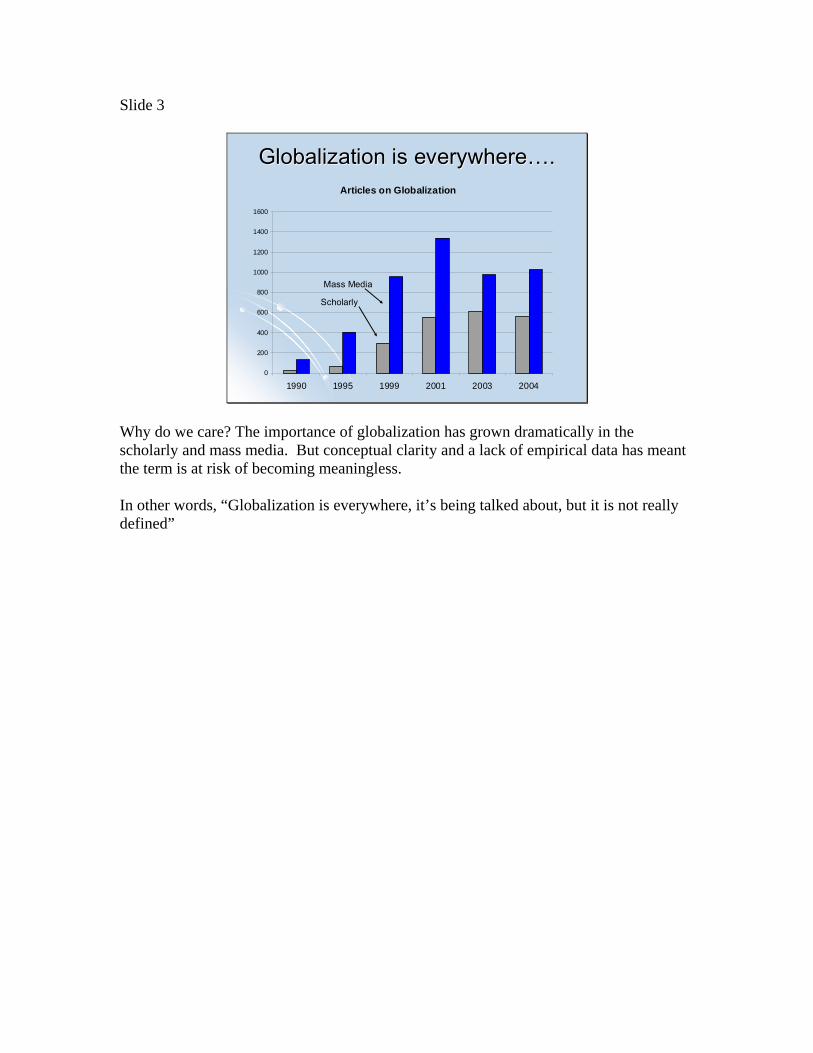
Globalization is everywhereGlobalization is everywhere……..Articles on Globalization
0
200
400
600
800
1000
1200
1400
1600
1990 1995 1999 2001 2003 2004
Scholarly
Mass Media
Why do we care? The importance of globalization has grown dramatically in the scholarly and mass media. But conceptual clarity and a lack of empirical data has meant the term is at risk of becoming meaningless. In other words, “Globalization is everywhere, it’s being talked about, but it is not really defined”

Slide 4
Globalization is a Black BoxGlobalization is a Black Box
Theory raced ahead of evidenceTheory raced ahead of evidenceEntrenched theoretical and public policy Entrenched theoretical and public policy debates: debates: Is it good or bad?Is it good or bad?Empirical evidence is unevenEmpirical evidence is uneven
In fact, globalization remains very much of a black box. Primarily this is because theory has raced ahead of evidence. Consequently, social science theorists and public policy debates tend to focus more on the question of whether it is good or bad and less on trying to empirically define what it is.

Slide 5
Consequences of theConsequences of the……..Failure to understand the structure of Failure to understand the structure of globalizationglobalizationFailure to analyze interaction dynamicsFailure to analyze interaction dynamicsFailure to foresee unintended Failure to foresee unintended consequences, crises, consequences, crises, ““normal accidentsnormal accidents””, , systemic malfunctionssystemic malfunctions
The collapse of the 2003 Cancun trade talks illustrates our need to better understand globalization processes—its structure, interaction dynamics and unintended consequences. Media analysis following this event focused on economic policy, reflecting the central role international exchanges play in defining contemporary political and economic life. The diversity of “social agents” (governments, ordinary citizens, NGOs and INGOs) involved reflects the diversity of both interpretations and consequences of globalization processes. It also highlighted conflicting goals of diverse stakeholders in changing economic dynamics, particularly those between developed and developing states. September 11, 2001 is another dramatic example of reactive policy, in this case, focused on Huntington’s clash of civilizations thesis, more likely to result in increased conflict and a “self-fulfilling prophecy” than well-reasoned policy-making as recent events (Iraq) illustrate. Both events point out the need to critically examine—through empirical evidence—globalization processes in order to substantiate theory and to guide policy.

Slide 6
Contents of the Black Box: Contents of the Black Box: Transactions Transactions
Link disparate actors (nodes) around the Link disparate actors (nodes) around the globeglobeActors can be people, cities, countries, or Actors can be people, cities, countries, or organizations organizations Measured as trade, capital transfers, treaties, Measured as trade, capital transfers, treaties, travel, collaborations, and communicationtravel, collaborations, and communication
So far we understand globalization to be transactions that link disparate actors across the globe. Transactions include economic, political, military and cultural life including trade, treaties and, in general, an extension of social relations and a compression of time of transactions.

Slide 7
Black Box of Globalization:Black Box of Globalization:Network AnalysisNetwork Analysis
Reveals the structure of social relationsReveals winners and losers of globalization processes Illustrates change over time and potentially reveals mechanisms of change
Transactions readily lend themselves to social network analysis. Whether the social units are people, countries, or organizations and Whether the ties or social relations are economic transactions such as trade, capital transfers or treaties; Examining these transactions over time will reveal the changing structure of social power—economic, political, ideological or military. Social network analysis can reveal which actors (countries) are left out of global trade or communication; illustrating the winners and losers of globalization. It can illustrate the effects of the global on the local and in general, provide multi-level analyses of complex processes.

Slide 8
Map the Pattern of Transactions:Map the Pattern of Transactions:Reveal Globalization NetworkReveal Globalization Network
Build database on transactionsBuild database on transactionsDevelop tools for visualizing transactions Develop tools for visualizing transactions statically and dynamicallystatically and dynamicallyCreate open access data and tools for Create open access data and tools for scholarly and public policy investigatorsscholarly and public policy investigators
Our project seeks to build multiple databases on globalization processes across all dimensions of society--economic, social, political, cultural, and civil Covering a variety of exchanges: trade, transportation, finance, media, institutions, human movement Our methods—social network analysis and through a social network based data mining program—will allow us to display the structure of transactions in a relational, network map And to develop dynamic depictions over time and at multiple levels (local, national, regional, and global) Our goal is to provide open access to both this data and our tools to aid in scholarly research and in policy-making

Slide 9
Visualizing GlobalizationVisualizing Globalization
Who? Who? A crossA cross--national, multinational, multi--institutional collaborationinstitutional collaboration
What? What? Database, webDatabase, web--based interface for public access, and based interface for public access, and development of visualization toolsdevelopment of visualization tools
How?How?Research, descriptive publications, teaching tools, Research, descriptive publications, teaching tools, and open access websiteand open access website
When?When?FiveFive--year effort from 2005year effort from 2005--20102010
To do this, we’ve established a project based at Princeton University called Visualizing Globalization (VG)… It is a cross-national, multi-institutional collaboration over the next 5 years focused on empirically exploring globalization processes.

Slide 10
VG Projects and ProductsVG Projects and Products
Observing TradeObserving TradeTracking PeopleTracking PeopleFollowing the MoneyFollowing the MoneyTransmitting CultureTransmitting CultureSurveying InstitutionsSurveying Institutions
Reference VolumesReference VolumesConferences Conferences Case StudiesCase StudiesWebsite Website Statistical and Data Statistical and Data ProductsProducts
Each phase of the project will focus on a different type of transaction, e.g.: Migration and Remittances Trade and Treaties Communications and Transport And will allow both scholars and policy makers to participate in conferences, supply case studies using data from the archives we are building and to contribute to reference volumes involving a layering of different transactions and relations and geospatially mapped to show the changing structure of the world and the winners and losers of globalization processes. Today we’re going to show you our results based on trade transactions. We began with trade data for several reasons, most notably because it is readily available and standardized for comparison across time. In addition, it has an intuitive appeal to many audiences as trade appears to be the most fundamental and concrete form of global transactions.

Slide 11
Observing TradeObserving TradeW o r ld w id e E x p o r t s
- 5
0
5
1 0
1 5
2 0
2 5
3 0
1 9 7 0 1 9 7 5 1 9 8 0 1 9 8 5 1 9 9 0 1 9 9 5 2 0 0 0 2 0 0 5
Perc
ent
Exports as % of GDP
Annual % Change in Trade Volume
Using the World Economic Outlook data from the IMF we calculated exports as a percent of GDP for the world and the annual percent change in trade volume from 1970 to 2005. In 1970 the exports were 11.6% of GDP and by 2005 they had almost tripled to 27.6 % of GDP. The volume of trade grew steadily with annual percentage changes consistently above 0, except for 1975 (oil shock) and in 1982 (???). For a majority of years the annual percent change in trade volume was above 5%.

Slide 12
Significant Moments of ObservationSignificant Moments of Observation
““North versus SouthNorth versus South””WTO, Internet WTO, Internet
20012001
““Victory of the MarketVictory of the Market””Establishment of EC, End of Cold War, Establishment of EC, End of Cold War, GATT, Structural Adjustment Policies, GATT, Structural Adjustment Policies, Container ShippingContainer Shipping
19901990
““Crisis in the Global SystemCrisis in the Global System””Post OPEC, UNCTAD, collapse of Post OPEC, UNCTAD, collapse of Import Substitution, onset of debt crisisImport Substitution, onset of debt crisis
19801980
Characterization of EraCharacterization of EraYearYear
We chose three different points of time for our initial foray into the trade data. For each of three decades we’ve chosen one year of trade data. Each of these dates reflect particular moments in time which we suspect affect trade relations and in turn affect future trade relations with consequences for political relations. We highlight some key events during each of these time periods. 1980 was the earliest time period for obtaining quality trade data. During this time period, we capture the effects of the post OPEC 1970s, the recent establishment of the UN commission on trade and development, the collapse of import substitution policies and programs in much of the less developed/developing country world (referred to often as the “global south”). The collapse of the system of import substitution resulted in a debt crises for these countries as they became beholden to global finance rules. In 1990, there is a reduction in the period of crises in much of the developing world; extensive efforts on the part of global finance to “open up” markets in those countries, combined with the collapse of the former Soviet Union and the end of the cold war lead to a worldwide opening up of the market, the establishment of the general agreement on tariffs and trade (GATT), the “successful” implementation of structural adjustment policies (SAP), the growth of regional economic agreements across countries (the EC, APEC, ASEAN)-- all of which opened up countries to more international trade with each other. Finally, technological innovations both sped up the movement of goods around the globe and reduced the costs of shipping--especially the interlinked system of container shipping with rail and truck transport. In 2001, the growth and turmoil of the 1980s and 1990s had slowed and evolved into formalized trade institutions like the WTO, resulting in smoother and faster financial and trade transaction technologies, including the internet….

Slide 13
Data and MethodsData and MethodsTrade DataTrade Data
World Trade AnalyzerWorld Trade Analyzer1980, 1990, 20011980, 1990, 2001$ Amount of $ Amount of Exports/imports Exports/imports between every countrybetween every countryIncluding all Including all commodities and 93 of commodities and 93 of those related to food, those related to food, shelter, clothing, shelter, clothing, energy, machinery and energy, machinery and engines.engines.
Network MapsNetwork MapsApply Apply NetMap NetMap SoftwareSoftwareAnalyze country and Analyze country and regional trade patternsregional trade patternsObserve emergent Observe emergent groupsgroupsDisplay Cartesian Display Cartesian mapsmapsFollow step links from Follow step links from central nodescentral nodes
We use World Trade Analyzer ( WTA is a trade database that allows you to access data for 600 commodity groups for 192 countries for up to 22 years (1980-2002). It is created from data reported by member countries to the United Nations Statistical Office, later compiled by Statistics Canada. Located at many universities—you can google and select a site.) We examined All Trade combined and selected 93 commodities related to food, shelter, clothing, energy, machinery and engines with the idea of writing case studies and examining commodity chains in our volume and conference in March of 2006. We calculated the total value of trade for a commodity in 1980 (by adding up all of the $ values in all cells in a country-by-country matrix.) And calculated the dollar value of 0.1% of the total trade value in 1980 of a particular commodity. Then we calculated the 1990 and 2001 values using the CPI inflator (by multiplying $P.1c80 by 1.59 for the 1990 value ($P.1c80_90) and by 2.15 for the 2001 value ($P.1c80_01).) We then included all countries whose trade with any one other country is equal to or greater than 0.1% of trade for each of the 3 time periods: $P.1c80 in 1980, $P.1c80_90 in 1990, and $P.1c80_01 in 2001. (Note: we rounded-up to the nearest 1,000 value in each cell to calculate inclusion. We began our analysis using a network based data mining program called NetMap that allowed us to explore the structure of trade for each country, region and globally. (We will also be applying other categories such as Huntington’s civilizations and examining the results in light of world systems theory as well as testing various theories of economic globalization.) We will also be applying more standard social network analysis, particularly in our case studies.

Slide 14
1980 Trade Structure at 0.1% of Total Trade Value1980 Trade Structure at 0.1% of Total Trade Value
US
Canada
Japan
AfricaLatin America
Europe
Middle East
Unknown Destinations
E. Asia
S.E. Asia
N. America
Here are the results for 1980 using the NetMap software. The large wheel or circle structure in the middle illustrates inter-regional or all country trade at the 0.1% cutoff level. (We will highlight on the names later but this is to give you a first glance of the structure of trade for this year, representing all countries who were exporting or importing 0.1% or more for all values of all commodities traded in 1980.) Each “wedge” represents a country within a region (defined by WTA which is same as the UN Statistical department). The lines between countries indicate trading partners. Each country is color coded according to its geographic and political region. For example the wedges that are colored brick red on the right hand side are western and eastern Europe. The wedges colored mustard in the lower left are East Asian countries (Taiwan and Japan in this graph). In the central picture of inter-regional trade, you’ll note the US appears to have the widest array of trade linkages around the globe. Except for SE Asia, the US is trading with every other region in the world. Note the 2 other structures outside of this central structure. The US and Canada (on the left) are shown with a solid line indicating they trade with each other at this cutoff level. There is also a smaller wheel structure for Europe, indicating these countries trade with each other at this same 0.1% cutoff level. These 2 structures represent intra-region trade. You’ll note the distinctiveness of the European regional pattern of trade. If we zoom into this region we can see that… [next slide]

Slide 15
1980 Trade Structure at 0.1% of Total Trade Value: 1980 Trade Structure at 0.1% of Total Trade Value: Regional Trade Within EuropeRegional Trade Within Europe
If we zoom into this region we note the density of ties within the region. You’ll also note that Germany is quite central as it trades with every country within this region. Germany and the Netherlands have the largest trade linkage, indicated by the thickness of the line, followed by France and Germany. Germany also trades heavily with Italy, UK, and Belgium. You’ll note the gap in the line from the UK to Switzerland. The gap is the same as an arrow, indicating directionality. Because the tie is “exports” UK exports to Switzerland—which obviously imports from UK” but it does not export to the UK. Likewise, the Netherlands exports to France but not vice versa. You’ll note that most of the ties are reciprocal. Our preliminary analysis indicated that trade within Europe dominants all of our regional patterns and the emergent groups. This is not surprising given the extent of economic and financial institutions reaching across national boundaries in the region. In order not to detract from overall patterns—which we found reflected a very integrated economy--we made a decision to treat all of the countries that share the Euro currency as one unit. There are 12 countries in this group; we refer to them as the Euro-12. Making this adjustment, we zoom out again to the larger picture of trade relations.

Slide 16
1980 Trade Structure at 0.1% of Total Trade Value: 1980 Trade Structure at 0.1% of Total Trade Value: EuroEuro--1212
AfricaLatin America
CIS & Baltics
Europe
Middle EastUnknown Destinations
E. Asia
S.E. Asia
N. America
US
Euro-12
UKJapan
Canada
Note that the Euro-12 rival the US in trade, also trading to the majority of other regions in 1980 (Euro-12 doesn’t trade to Latin America, but U.S. does; US doesn’t trade to CIS, but Euro-12 does). (Note: 12 of the FSU states formed the Commonwealth of Independent States in 1991 (includes Azerbaijan, Armenia, Belarus, Kazakstan, Kyrgyzstan, Moldova, the Russian Federation, Tajikistan, Turkmenistan, Uzbekistan and Ukraine; Georgia joined in 1993; excludes the Baltic states). The focus is on cooperation in various fields of external and internal policies.) The thickest or greatest amount of trade occurs between: U.S. and Euro-12 U.S. and Japan (Note: USSR shows up in the aggregated picture, but not in slide 14, because it only trades above the threshold when we add all its exports to the Euro-12 countries together. Also, the region colors in the Euro-12 and regular pictures are different (e.g. North America is blue in the original and dark yellow in the Euro-12 version. We will make this adjustment later.) Now the intra regional pattern for Europe reveals a particularly strong bi-directional link between the E12 and the UK with a slightly smaller link between the E12 and Switzerland. We continue to see a strong link between the US and Canada. It is important to note that there our four countries in Africa that trade (Algeria, Libya, Nigeria and South Africa) with both the US and Euro-12; three mid East countries trade at significant levels (Saudi Arabia, Iraq and UAE), but only one trades with the US, Euro-12 and Japan (Saudi Arabia). The overall structure of the graph reveals there are two poles in world trade: the US and Europe.
Slide 17
1990
N. America
S.E. Asia
E. Asia
Middle East
Europe
CIS & Baltics
Latin America
AfricaOceania
US
Euro-12
Japan
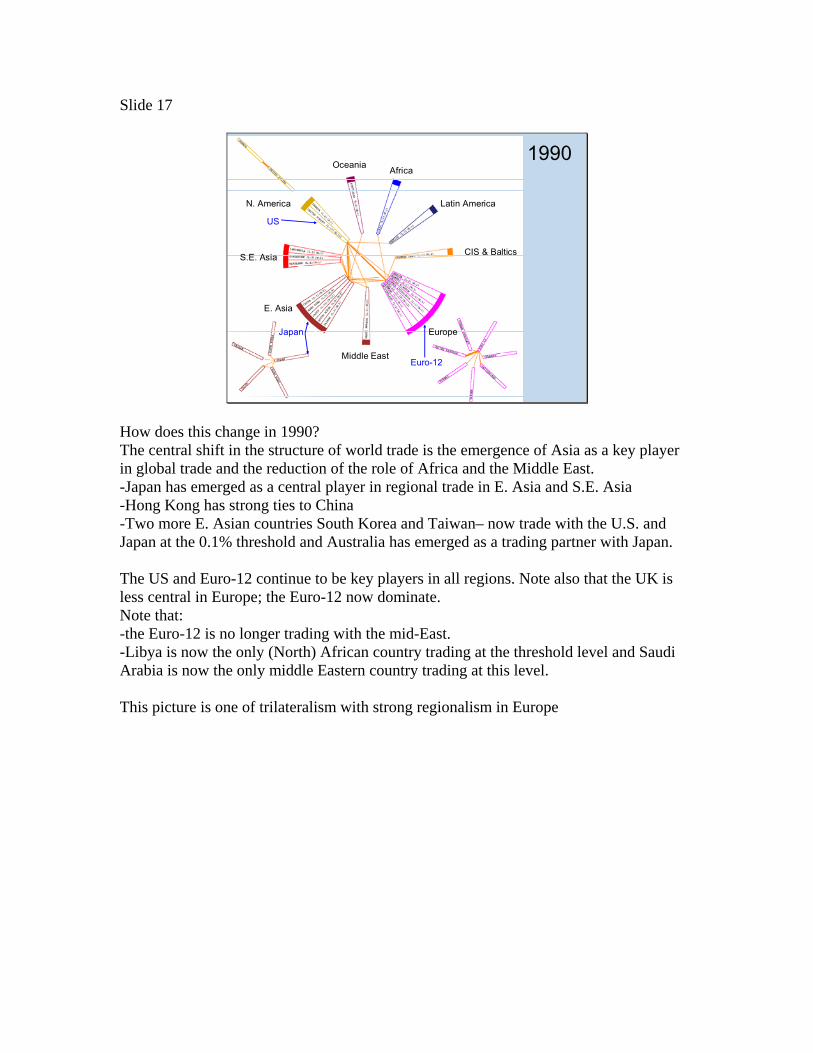
How does this change in 1990? The central shift in the structure of world trade is the emergence of Asia as a key player in global trade and the reduction of the role of Africa and the Middle East. -Japan has emerged as a central player in regional trade in E. Asia and S.E. Asia -Hong Kong has strong ties to China -Two more E. Asian countries South Korea and Taiwan– now trade with the U.S. and Japan at the 0.1% threshold and Australia has emerged as a trading partner with Japan. The US and Euro-12 continue to be key players in all regions. Note also that the UK is less central in Europe; the Euro-12 now dominate. Note that: -the Euro-12 is no longer trading with the mid-East. -Libya is now the only (North) African country trading at the threshold level and Saudi Arabia is now the only middle Eastern country trading at this level. This picture is one of trilateralism with strong regionalism in Europe

Slide 18
20012001
N. America
S.E. Asia
E. Asia
Unknown Destinations
Middle East
Europe
CIS & Baltics
Latin America
USEuro-12
Mexico
Evidence of trilateralism is even stronger in 2001. There are clearly 3 poles: a Euro-12 pole, a US pole, and an E.Asian pole There is evidence of regionalism in Asia as the number of countries trading at the threshold level of 0.1% has continued to increase—from three to five countries—and there is an emerging trade bloc within that region between Malaysia and Singapore. The trade within East Asia has also increased affecting the centrality of Japan. Note that Africa is no longer represented but Latin America trade has grown, now including Venezuela and Brazil. The Euro-12 continue to have strong inter-regional and intra-regional trade ties. Note the strong ties between the US and Mexico (although this picture melds the lines between Mexico, Venezuela and Brazil because of the thickness of Mexico’s line with the US.) NAFTA was launched in 1994 and is clearly having an effect on these trade level. Note that the Euro-12 has more links to other countries than the US, lagging behind only in trade to Latin America and SE Asia, but rivaling trade with East Asia. Note also it has the strongest levels of trade with the UK.

Slide 19
Emergent Group AnalysisEmergent Group AnalysisNetMapNetMap creates several types of analyses, creates several types of analyses, including:including:
PrePre--defined groups based on some attribute such as defined groups based on some attribute such as regions or civilizationsregions or civilizationsEmergent groupsEmergent groups
Emergent groups represent countries which Emergent groups represent countries which trade more with each other than with any other trade more with each other than with any other countries.countries.
Composed of at least 3 countriesComposed of at least 3 countriesWhich share at least 50% of the same trade tiesWhich share at least 50% of the same trade ties
NetMap creates several types of analyses, including: 1-Pre-defined groups: based on some attribute such as regions—which we just reviewed 2-Emergent groups: contain at least 3 countries which share at least 50% of the same trade ties (others include step linking, discrete groups, etc.)

Slide 20
1980 Emergent Group Analysis1980 Emergent Group Analysis
Euro-12
US
CanadaUK
Japan
Saudi Arabia
Switzerland
The result for the 1980 emergent group analysis reveals: There are strong links between two but not greater than 2 countries so there is no emergent group. The graph reveals a strong Euro-12 bloc with links to members of the central group and to several states which do not trade at the threshold level with this central group. The US also has multiple ties to central group members and strong ties to Mexico and Taiwan which are outside of the central group. The US appears to have fewer trade ties than the Euro-12 with less linked around the circle, with links to all other countries except UAE and Switzerland and has two links to countries with only ties to the US (Mexico and Taiwan).

Slide 21
1990 Emergent Group Analysis1990 Emergent Group Analysis
UK
US
Euro-12
Japan
Emergent Group Members:
USEuro-12JapanChinaUKHong KongSouth KoreaSaudi ArabiaSingaporeTaiwan
The 1990 results differ considerably; we note an emergent group (trade more among themselves than with any other country) with the following members: US Euro-12 Japan China UK Hong Kong South Korea Saudi Arabia Singapore Taiwan Note that: -China has emerged as a “regional player” -Japan links Indonesia, Australia, and Thailand to world trade at the threshold level -the Euro 12 serves as a gateway to the rest of Europe and the UK, while -the US has stronger ties to Asia -the US links Mexico and Canada to world trade at the threshold level

Slide 22
2001 Emergent Group Analysis2001 Emergent Group Analysis
US
Euro-12Mexico
UKCanada
Emergent Group Members: United StatesJapanBrazilCanadaChinaUKHong KongSouth KoreaMexicoMalaysiaSaudi ArabiaSingaporeThailandTaiwanEuro-12
The list of countries in the emergent group has expanded in 2001, providing some evidence of “globalization” in trade as theorized. The US is no longer a bridge for Mexico or Canada; NAFTA appears to have increased their overall trade; Japan no longer links Thailand but continues to link Indonesia; Australia no longer meets the threshold level. The Euro-12 links many European states to world trade. Note however that the overall number of countries has not increased dramatically—although there are new economic players, there has been little overall change in the structure of trade over the last 21. Emergent Group Members: United States Japan Brazil Canada China UK Hong Kong South Korea Mexico Malaysia Saudi Arabia Singapore Thailand Taiwan Euro-12

Slide 23
2001 Cartesian Map Analysis2001 Cartesian Map Analysis
US
Euro-12China
Unknown Destination
Japan
We superimposed the geographic structure of global trade on a GIS Cartesian plane. We note there are: Three key nodes: Europe, US, East Asia An absence of the Global South (Note that “unknown destination” represents some kind of “disguised or illegal destination—we found evidence of sanctions being ignored for example.) If we changed the longitude of the center of map (e.g. from Greenwich to Hawaii) we would get a different perspective but this map powerfully reveals the evidence of trilateralism dominating trade with the emergence of China as an economic power. Be careful of overinterpreting Unknown Destination because it sums two different destinations – Areas NES and Unknown partner. Areas NES (according to Scudder) – any country that is not on the WTA list Areas NES is slightly different than unknown partner

Slide 24
Step Link AnalysisStep Link Analysis
US
Euro-12Canada
JapanMexico
20012001
In addition to the 2 group analyses, NetMap can focus on a given node—country in this case—to illustrate its ties. This allows us to highlight several key relations for countries of interest. Here we focus on the US and note that: the US has a varied set of 1st level trade partners-- Except for E-12, none of these have subsequent 1st level partners Illustrating that for many countries, the US is their international market, while the US has several alternatives

Slide 25
19801980
19901990
20012001
Euro-12
Euro-12
Euro-12
Switzerland
Saudi Arabia
US
UK
UK
US
Switzerland
US
UK
Switzerland
… … We can see that a similar pattern holds for the E-12; note that the number of its trade partners has grown over time.
Slide 26
Step Link Analysis: ChinaStep Link Analysis: China
1990
2001
China
China
Hong Kong
Japan
Hong KongJapanSouth Korea
TaiwanUSEuro-12
1980China
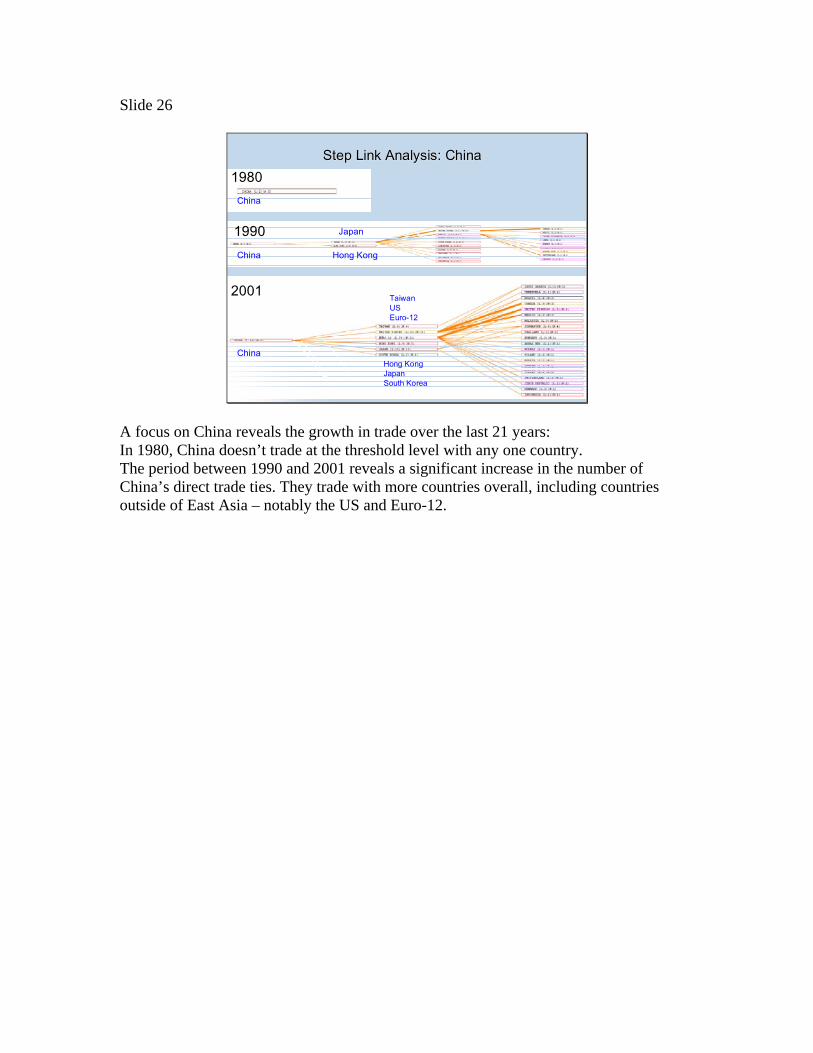
A focus on China reveals the growth in trade over the last 21 years: In 1980, China doesn’t trade at the threshold level with any one country. The period between 1990 and 2001 reveals a significant increase in the number of China’s direct trade ties. They trade with more countries overall, including countries outside of East Asia – notably the US and Euro-12.

Slide 27
2001
1990
1980
Saudi Arabia
Saudi Arabia
Saudi Arabia
USEuro-12
Japan
Japan
Taiwan
US
US
Saudi Arabia, on the other hand, suffers from dependence on a very small set of partners. This makes it politically fragile in the global commercial market.
Slide 28
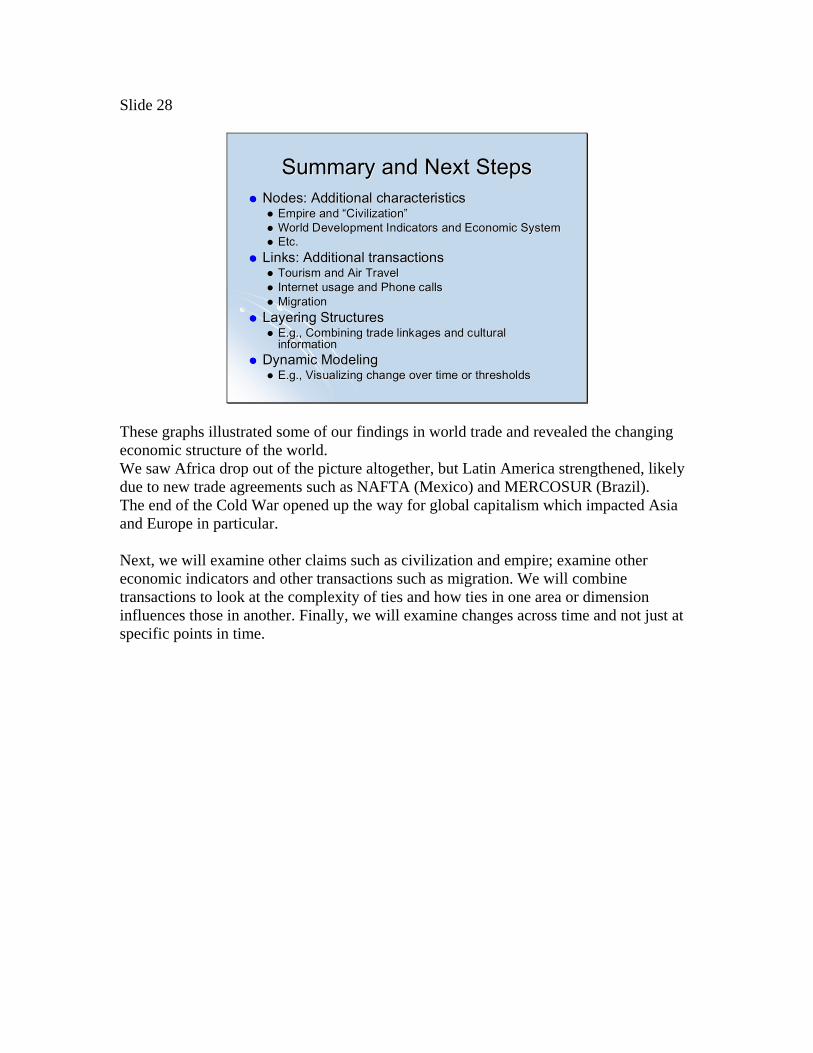
Summary and Next StepsSummary and Next StepsNodes: Additional characteristicsNodes: Additional characteristics
Empire and Empire and ““CivilizationCivilization””World Development Indicators and Economic SystemWorld Development Indicators and Economic SystemEtc.Etc.
Links: Additional transactionsLinks: Additional transactionsTourism and Air TravelTourism and Air TravelInternet usage and Phone callsInternet usage and Phone callsMigrationMigration
Layering StructuresLayering StructuresE.g., Combining trade linkages and cultural E.g., Combining trade linkages and cultural informationinformation
Dynamic ModelingDynamic ModelingE.g., Visualizing change over time or thresholdsE.g., Visualizing change over time or thresholds
These graphs illustrated some of our findings in world trade and revealed the changing economic structure of the world. We saw Africa drop out of the picture altogether, but Latin America strengthened, likely due to new trade agreements such as NAFTA (Mexico) and MERCOSUR (Brazil). The end of the Cold War opened up the way for global capitalism which impacted Asia and Europe in particular. Next, we will examine other claims such as civilization and empire; examine other economic indicators and other transactions such as migration. We will combine transactions to look at the complexity of ties and how ties in one area or dimension influences those in another. Finally, we will examine changes across time and not just at specific points in time.

Slide 29
Here’s an example of the NetMap menu. Our links focus on Trade with specific categories but any number of categories and links can be added.

Slide 30
Telephone Calls 1995by World Bank Estimated Income Levels•Classic display of the relationships predicted by dependency theory.
• Richest countries and even semi-rich (Socialist economies): internally and globally integrated.
• Poorer regions: not well integrated with each other and links only to the rich.
SocialistEconomies
High-mid
Low-mid
High
Low
Here is a sample from telephone data Here we have coded countries according to UN income status from rich to poor (not according to region) What you is revealed is a structure that reflects classic dependency theory With rich countries intra- and inter-regionally connected while the converse holds true for poorer relations. NB: Income data are from 1990 World Bank estimates of income levels: Low (<$500) Low-Mid ($500-$2200) High-Mid ($2300-$6000) High (>$6000) Socialist

Slide 31
ScheduleSchedule20052005--0606
Data uploaded to Data uploaded to www.princeton.edu/~inawww.princeton.edu/~inaInteractive production of NetmapInteractive production of NetmapConference March 2006Conference March 2006Publication of Observing Trade Fall 2006Publication of Observing Trade Fall 2006Expansion of data and further pubs, 2006Expansion of data and further pubs, 2006--2010.2010.
This data and other datasets we are accumulating will be uploaded to this website. We will also provide an interactive production of NetMap for you to experiment with. We will have a conference on global trade, a first in our series on globalization, in March 2006 at Princeton. We will publish our first volume—Observing Trade—in Fall of 2006 We will publish additional volumes in the following years.