visualizing network flows and related anomalies in industrial networks using chord diagrams and...
TRANSCRIPT

Visualizing Network Flows and RelatedAnomalies in Industrial Networks usingChord Diagrams and Whitelisting
M. Iturbe, I. Garitano, U. Zurutuza, R. UribeetxeberriaElectronics & Computing DepartmentFaculty of EngineeringMondragon University
IVAPP 2016, Rome, Italy

. . . . . . . .Introduction
. . . .System Description
. . . . .Results Conclusions
Agenda
1. Introduction
2. System Description
3. Results
4. Conclusions
2

Introduction.

. . . . . . . .Introduction
. . . .System Description
. . . . .Results Conclusions
Industrial Control Systems
CC-BY-SA 3.0 Kreuzschnabel, Schmimi1848, Wolkenkratzer, Brian Cantoni, Hermann Luyken, Beroesz
4

. . . . . . . .Introduction
. . . .System Description
. . . . .Results Conclusions
Fieldbus Network
Control Network
Demilitarized Zone
Corporate Network
Internet
PLC PLCPLC
HMI
ControlServer Engineering
Workstation
HistorianData Server
Field equipment
Workstations
CorporateServers
Fiel
d De
vice
sFi
eld
Cont
rolle
rsSu
perv
isor
y De
vice
s
5

. . . . . . . .Introduction
. . . .System Description
. . . . .Results Conclusions
ICS vs. IT
Industrial Networks IT Networks
Main Purpose Control of Physical equip-ment
Data processing and trans-mission
Failure Severity High LowReliability Required High ModerateDeterminism High Low
Data Composition Small packets of periodic andaperiodic traffic Large, aperiodic packets
Average Node Complexity Low (simple devices, sensors,actuators)
High (large servers/file sys-tems/databases)
6

. . . . . . . .Introduction
. . . .System Description
. . . . .Results Conclusions
Whitelisting
Refers to the practice of registering the set of networkflows that are allowed in a network, raising an alarmor disallowing connections that have not beenexplicitly allowed.
7

. . . . . . . .Introduction
. . . .System Description
. . . . .Results Conclusions
Whitelisting
• Recommended security measure by the industry.• Barbosa et al. [1] demostrated its efficiency to detect flowanomalies.
8

. . . . . . . .Introduction
. . . .System Description
. . . . .Results Conclusions
Chord diagrams
9
. . . . . . . .Introduction
. . . .System Description
. . . . .Results Conclusions
Chord diagrams
• Conceived initially for genomics• Previous usage on security visualizations
• ADS visual comparison [4]• Relationships between Phishing websites [3]• Relationships between IT subnets [2]
10

. . . . . . . .Introduction
. . . .System Description
. . . . .Results Conclusions
Objectives
• Gaps in related literature• No security visualizations for Industrial Networks• Previous works based on whitelisting only detect forbiddenconnections
• Objectives• Provide situational awareness through flow visualizations• Design a visual flow anomaly detection system• Detect flow anomalies through temporal whitelists• Visually highlight detected anomalies
11

System Description.

. . . . . . . .Introduction
. . . .System Description
. . . . .Results Conclusions
Overview
Industrial Network
FlowCollector
NetworkFlows
TaggedFlows
Whitelists
Chord Diagrams
Flow packets
Learning phase
Flow data Detection phaseVisualization
phase
Online
Offline
13

. . . . . . . .Introduction
. . . .System Description
. . . . .Results Conclusions
Learning Phase
• Whitelists are formed with the detected network traffic.• Source/Destination IP, Server port, IP protocol and packetnumber
• Whitelists of variable time length.
14

. . . . . . . .Introduction
. . . .System Description
. . . . .Results Conclusions
Detection Phase
• The system evaluates and tags incoming flows comparingthem to the whitelists
• Types of tags• Legitimate flow• Anomalous flow• Incorrect port• Incorrect protocol• Absent flow• Anomalous flow size
• The system triggers an alarm if a non-legitimate flow isdetected
15

. . . . . . . .Introduction
. . . .System Description
. . . . .Results Conclusions
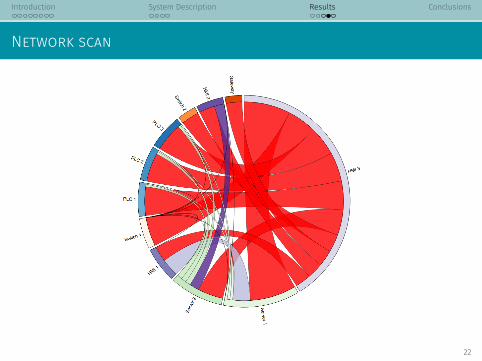
Visualization Phase
• The system builds the diagrams based on the taggedflows:
• A host → A section in the circumference• Each host type has a distinctive color group• A bidirectional flow → A chord• Chords inherit the color of the more active host in thecommunication
• Highlights non-legitimate flows:• Missing flows, in black• The rest, in red
16

. . . . . . . .Introduction
. . . .System Description
. . . . .Results Conclusions
Visualization Phase
(a) Forbidden flow betweenPLC 1 and HMI 2.
(b) Detail of the forbiddenflow.
17

Results.

. . . . . . . .Introduction
. . . .System Description
. . . . .Results Conclusions
Test network
Switch 2
Switch 1 Gateway
19

. . . . . . . .Introduction
. . . .System Description
. . . . .Results Conclusions
Tools
• NetFlow v5• Logstash• ElasticSearch• D3
20

. . . . . . . .Introduction
. . . .System Description
. . . . .Results Conclusions
Denial of Service
21
. . . . . . . .Introduction
. . . .System Description
. . . . .Results Conclusions
Network scan
22

. . . . . . . .Introduction
. . . .System Description
. . . . .Results Conclusions
Downed host
23

Conclusions.
. . . . . . . .Introduction
. . . .System Description
. . . . .Results Conclusions
Conclusions
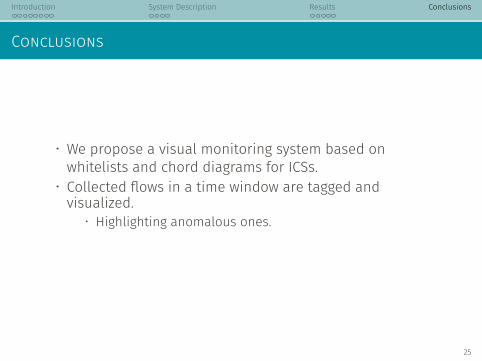
• We propose a visual monitoring system based onwhitelists and chord diagrams for ICSs.
• Collected flows in a time window are tagged andvisualized.
• Highlighting anomalous ones.
25

. . . . . . . .Introduction
. . . .System Description
. . . . .Results Conclusions
Future work
• Distinguish more anomalous flow types.• Research into re-creation of whitelists or its editionconsequences.
26

Thank you.
{miturbe,igaritano,uzurutuza,ruribeetxeberria}
@mondragon.edu
. . . . . . . .Introduction
. . . .System Description
. . . . .Results Conclusions
References I
Rafael Ramos Regis Barbosa, Ramin Sadre, and Aiko Pras.Flow Whitelisting in SCADA Networks.International Journal of Critical Infrastructure Protection,6(3):150–158, 2013.Siming Chen, Cong Guo, Xiaoru Yuan, Fabian Merkle, HannaSchaefer, and Thomas Ertl.OCEANS: online collaborative explorative analysis onnetwork security.In Proceedings of the Eleventh Workshop on Visualizationfor Cyber Security, pages 1–8. ACM, 2014.
28
. . . . . . . .Introduction
. . . .System Description
. . . . .Results Conclusions
References II
Robert Layton, Paul Watters, and Richard Dazeley.Unsupervised authorship analysis of phishing webpages.In Communications and Information Technologies (ISCIT),2012 International Symposium on, pages 1104–1109. IEEE,2012.Johan Mazel, Romain Fontugne, and Kensuke Fukuda.Visual comparison of network anomaly detectors withchord diagrams.In Proceedings of the 29th Annual ACM Symposium onApplied Computing, pages 473–480. ACM, 2014.
29