visualizing your experimental results with the integrative...
TRANSCRIPT

Visualizing your experimental results with the Integrative Genomics Browser (IGV)
BaRC Hot Topics – April 25, 2017
Bioinformatics and Research Computing Whitehead Institute
http://barc.wi.mit.edu/hot_topics/
1

2
Getting IGV http://www.broadinstitute.org/igv
Igv*.jnlp: max-heap-size

Why IGV?
• Faster navigation or browsing • Run it locally on your desktop • Special Datasets:
– ENCODE: human(hg19), mouse (mm9) – 1000 Genomes: human (hg19) – Body Map 2.0: human (hg19) – The Cancer Genomics Atlas: human (hg19)
3

UCSC genome browser vs IGV
• Some tracks are unique to one of them • IGV navigates faster because it runs locally • IGV allows you to create a new genome • It’s easier to jump to view the same region in
another species with the UCSC browser
4

IGV Interface
5
1 2
3
4
5
6
7
1. Tool Bar 2. Chr. Ideogram 3. Ruler 4. Track Data 5. Features 6. Track Names 7. Attributes
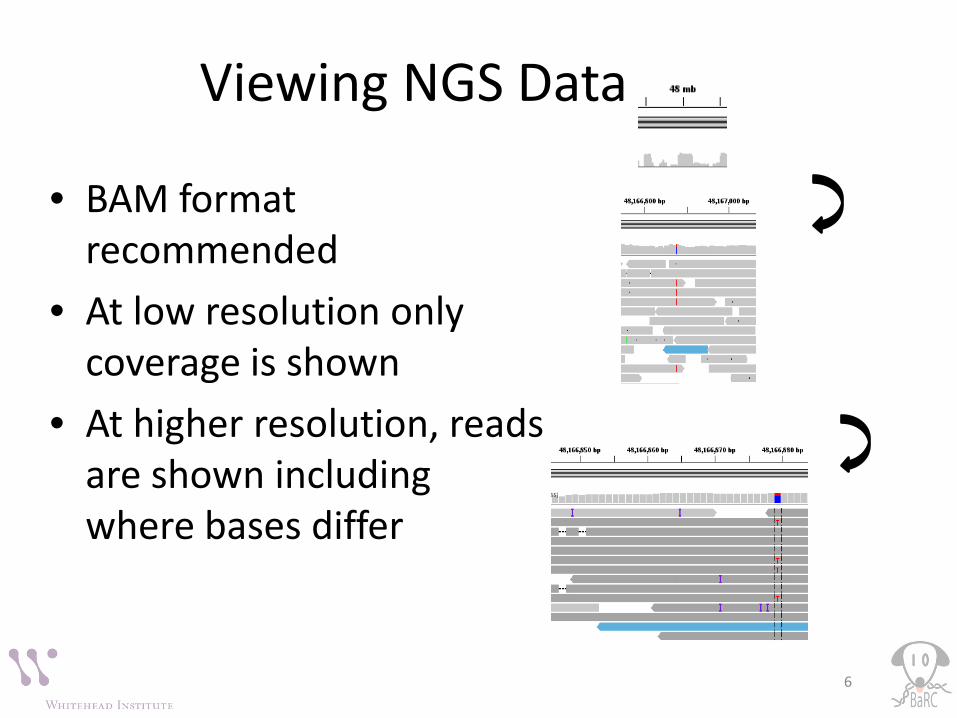
Viewing NGS Data
• BAM format recommended
• At low resolution only coverage is shown
• At higher resolution, reads are shown including where bases differ
6

7
sam/bam format
Col Field Description 1 QNAME Query template/pair NAME
2 FLAG bitwise FLAG 3 RNAME Reference sequence NAME
4 POS 1-based leftmost POSition/coordinate of clipped sequence
5 MAPQ MAPping Quality (Phred-scaled)
6 CIAGR extended CIGAR string 7 MRNM Mate Reference sequence NaMe (‘=’ if same as RNAME)
8 MPOS 1-based Mate POSistion 9 TLEN inferred Template LENgth (insert size)
10 SEQ query SEQuence on the same strand as the reference
11 QUAL query QUALity (ASCII-33 gives the Phred base quality)
12+ OPT variable OPTional fields in the format TAG:VTYPE:VALUE
Header: begins with @ Alignment:
Example: NA18502_YRI.sra.736765 272 chr1 14641 0 46M * 0 0 ATGTCAGAGCAATGGCCCAAGTCTGGGTCTGGGGGGGAAGGTGTCA :3;.9AB@A?<7-?????:@AAA9=BBB?7ABBCBBCBBBCABBBB AS:i:-3 XN:i:0 XM:i:1 XO:i:0 XG:i:0NM:i:1 MD:Z:12C33 YT:Z:UU XS:A:- NH:i:5 CC:Z:chr12 CP:i:90939 HI:i:0
Example: @SQ SN:chr1 LN:197195432
IGV: also needs to have indexed bam file (.bam.bai)
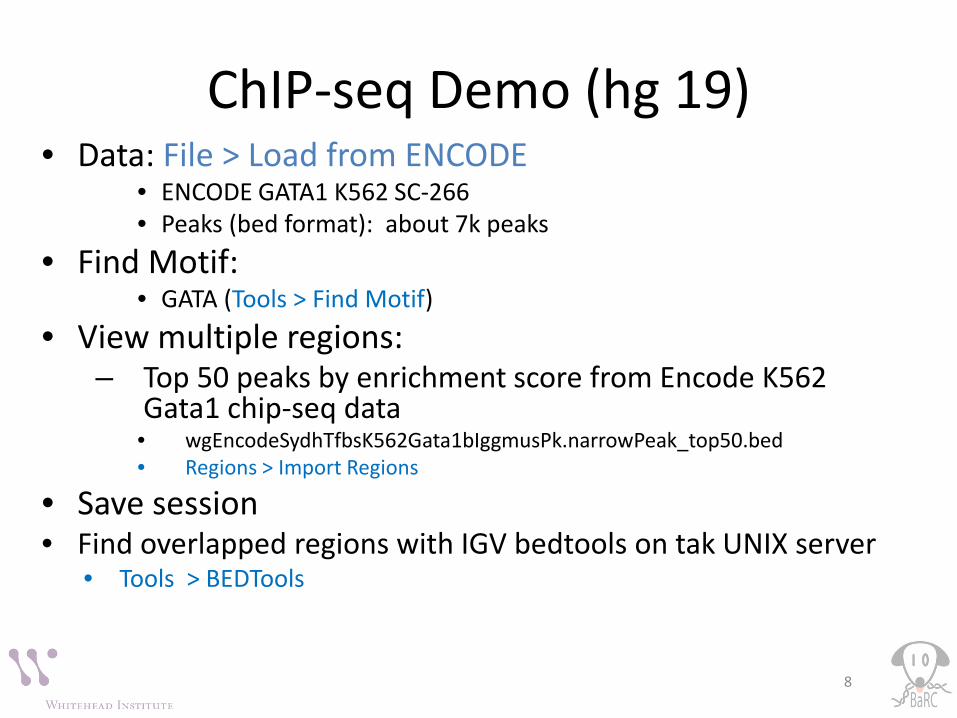
ChIP-seq Demo (hg 19) • Data: File > Load from ENCODE
• ENCODE GATA1 K562 SC-266 • Peaks (bed format): about 7k peaks
• Find Motif: • GATA (Tools > Find Motif)
• View multiple regions: – Top 50 peaks by enrichment score from Encode K562
Gata1 chip-seq data • wgEncodeSydhTfbsK562Gata1bIggmusPk.narrowPeak_top50.bed • Regions > Import Regions
• Save session • Find overlapped regions with IGV bedtools on tak UNIX server
• Tools > BEDTools
8

RNA-seq Demo (hg19) • Data:
• breast, brain from Human body Map • Pair end reads File > Load From Server > Body Map > Alignments > Merged 50bp and 75bp (hiSeq)
• View pair end reads: eg: EIF4A1 • Control (command) + click while not in “view as Pairs”
• View multiple genes side-by-side • Regions > Gene Lists > Microglia marker or your list
• View splice junctions with Sashimi plot: eg: PTPRC • View Preferences: (view > Preferences )
• Coverage mismatch threshold • Visibility range threshold • Downsample reads
9
Others
• View variant mutation files (not covered) • View methylation data: (not covered)
– BS-Seq, bisulfite sequencing – RRBS-Seq, reduced representation bisulfite
sequencing
• Create .genome file – Eg: Toxoplasma gondii:
• ToxoDB-10.0_TgondiiGT1_Genome_Chr_Only.fasta
10
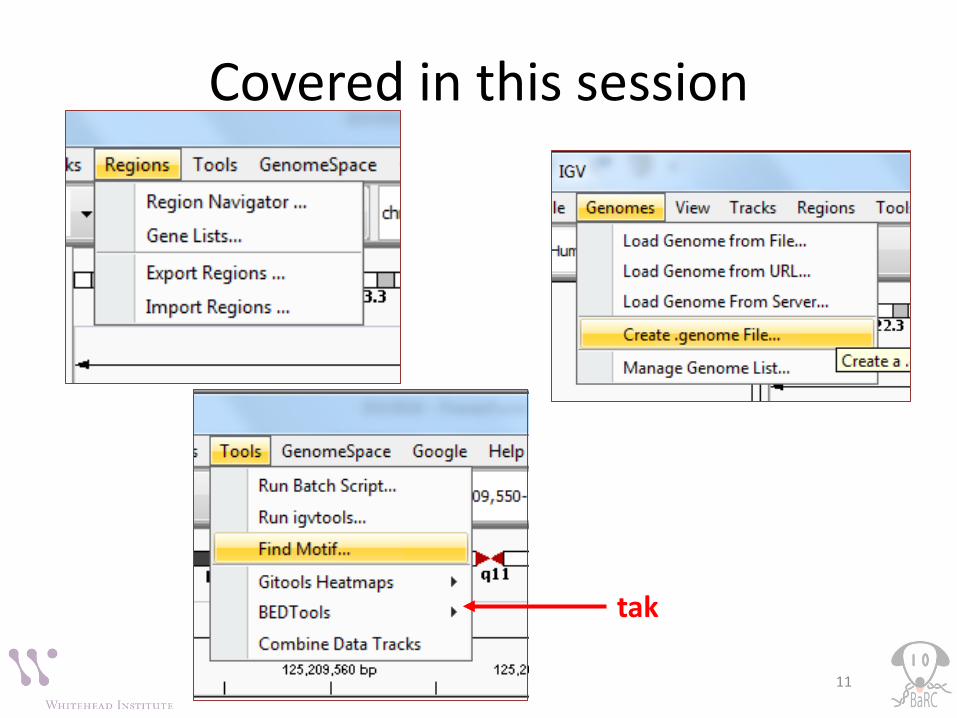
Covered in this session
11
tak

• Right-click
12

View -> Preferences…
13
More Information
• IGV User Guide: – http://www.broadinstitute.org/igv/book/export/h
tml/6 – http://www.broadinstitute.org/software/igv/dow
nload – Insertion/deletion/invertion/duplication
• ftp://ftp.broadinstitute.org/distribution/igv/COUNTWAY/IGV_Countway_2011_no_demos.pdf
• Video: – https://www.youtube.com/watch?v=IILfC3Uc6Vo
14