visvesvaraya technological university, belgauma floating wind turbine is a wind turbine mounted on a...
TRANSCRIPT
VISVESVARAYA TECHNOLOGICAL UNIVERSITY, BELGAUM
A technical seminar report onFLOATING MINDMILLS
Submitted in partial fulfillment as per VTU curriculum for VIII semester
Bachelor of Engineering
In
Mechanical Engineering
Of
Visvesvaraya Technological University, Belgaum
Submitted by
SUNNY DUBEY (1DS06ME090)
2009-2010Department of Mechanical Engineering
DAYANANDA SAGAR COLLEGE OF ENGINEERINGBANGALORE-560078
1

VISVESVARAYA TECHNOLOGICAL UNIVERSITYDAYANANDA SAGAR COLLEGE OF ENGINEERING
Department of Mechanical EngineeringBangalore – 560078
This is to certify that the Technical Seminar report entitled “FLOATING MINDMILLS”
has been presented by Mr. SUNNY DUBEY, USN: 1DS05ME090 in partial fulfillment for the award of Bachelor of Engineering in Mechanical Engineering of the Visvesvaraya Technological University, Belgaum during the year 2009-10. It is certified that all correction/suggestions indicated for internal assessment have
been incorporated in the report deposited in the department library.
Date: Sign of HOD/Coordinator
Internal Examiners: Name & sign. 1.
2.
2
CERTIFICATE
ACKNOWLEDGEMENTS
It is with great satisfaction and euphoria that I am submitting the Technical seminar report on “FLOATING MINDMILLS”. I have completed it as a part of the curriculum of our university.
First of all I thank the almighty for providing me with the strength and
courage to present the seminar.
I avail this opportunity to express my sincere gratitude towards Dr. K.J.
Sudhakar , head of mechanical engineering department, for permitting me to
conduct the seminar.
I am also indebted to all the teaching and non- teaching staff of the department of mechanical engineering for their cooperation and suggestions, which is the spirit behind this report. Last but not the least, I wish to express my sincere thanks to all my friends for their goodwill and constructive ideas.
SUNNY DUBEY
3
ABSTRACT
A floating wind turbine system with a tower structure that includes at
least one stability arm extending there from and that is anchored to
the sea floor with a rotatable position retention device that facilitates
deep water installations. Variable buoyancy for the wind turbine
system is provided by buoyancy chambers that are integral to the
tower itself as well as the stability arm. Pumps are included for
adjusting the buoyancy as an aid in system transport, installation,
repair and removal. The wind turbine rotor is located downwind of the
tower structure to allow the wind turbine to follow the wind direction
without an active yaw drive system. The support tower and stability
arm structure is designed to balance tension in the tether with
buoyancy, gravity and wind forces in such a way that the top of the
support tower leans downwind, providing a large clearance between
the support tower and the rotor blade tips. This large clearance
facilitates the use of articulated rotor hubs to reduced damaging
structural dynamic loads. Major components of the turbine can be
assembled at the shore and transported to an offshore installation site.
4
CONTENTS
1. INTRODUCTION……………………………………….6 2. NEED FOR FLOATING WINDMILLS……………...73. HISTORICAL BACKGROUND……………………….8
4. DESIGN CONSIDERATION………………………….10
5. ENERGY PRODUCTION FROM WINDMILLS……15
6. ADVANTAGES & DISADVANTAGES OF WINDMILLS……………………………………………..17
7. WIND POWER USAGE………………………………..19
8. GROWTH & COST TRENDS………………………….22
9. ENVIRONMENTAL EFFECTS………………………..24
10. GROWTH & COST TRENDS…………………..26
11. FLOATING WINDFARMS vs OIL AND GAS
RESERVOIRS……………………………………………28
12. CONCLUSION…………………………………….29
13. BIBLIOGRAPHY…………………………………30
5
INTRODUCTION
A floating wind turbine is a wind turbine mounted on a floating
structure that allows the turbine to generate electricity in water depths
where bottom-mounted towers are not feasible. The wind can be
stronger and steadier over water due to the absence of topographic
features that may disrupt wind flow. The electricity generated is sent to
shore through undersea cables. The initial capital cost of floating
turbines is competitive with bottom-mounted, near-shore wind turbines
while the rate of energy generation is higher out in the sea as the wind
flow is often more steady and unobstructed by terrain features. The
relocation of wind farms into the sea can reduce visual pollution if the
windmills are sited more than 12 miles (19 km) offshore, provide
better accommodation of fishing and shipping lanes, and allow siting
near heavily developed coastal cities.
Floating wind parks are wind farms that site several floating wind
turbines closely together to take advantage of common infrastructure
such as power transmission facilities.
6
NEED FOR FLOATING WINDMILLS
A few hundred meters offshore, winds are twice as strong as on land in
much of the world. Offshore wind energy has huge potential,
and floating wind turbines is a promising technology. Such turbines are
now being developed. They are meant to be used out at sea in deep
waters, and they do not need to be permanently moored to the ocean
bed. DEEP SEA. Criteria for location of an offshore wind farm is
excellent wind conditions and suitable water depth. The wind farm
must be situated near a strong onshore power grid and near harbours
and shipyards.
Energy is a major factor in today’s society
Alternative fuel and alternative energy resources are in
great demand
Most everyone in the world is looking for more energy-
efficient ways to live
Hybrid vehicles and other fuel-efficient technology is arising
around the world
The world has to change, this emergency that we are
experiencing today should have been taken care of long
before now.
Now we have no choice but to develop new technology in
very little time
7
HISTORICAL BACKGROUND
Humans have been using wind power for at least 5,500 years to propel
sailboats and sailing ships, and architects have used wind-
driven natural ventilation in buildings since similarly ancient
times. Windmills have been used for irrigation pumping and for milling
grain since the 7th century AD in what is
now Afghanistan, Iran and Pakistan.
In the United States, the development of the "water-pumping
windmill" was the major factor in allowing the farming and ranching of
vast areas otherwise devoid of readily accessible water. Windpumps
contributed to the expansion of rail transport systems throughout the
world, by pumping water from water wells for the steam locomotives.[6] The multi-bladed wind turbine atop a lattice tower made of wood or
steel was, for many years, a fixture of the landscape throughout rural
America. When fitted with generators and battery banks, small wind
machines provided electricity to isolated farms.
In July 1887, a Scottish academic, Professor James Blyth, undertook
wind power experiments that culminated in a UK patent in 1891.[7] In
the United States, Charles F. Brush produced electricity using a wind
powered machine, starting in the winter of 1887-1888, which powered
his home and laboratory until about 1900. In the 1890s, the Danish
8
scientist and inventor Poul la Cour constructed wind turbines to
generate electricity, which was then used to produce hydrogen.[7] These were the first of what was to become the modern form of wind
turbine.
Small wind turbines for lighting of isolated rural buildings were
widespread in the first part of the 20th century. Larger units intended
for connection to a distribution network were tried at several locations
including Balaklava USSR in 1931 and in a
1.25 megawatt (MW) experimental unit in Vermont in 1941.
The modern wind power industry began in 1979 with the serial
production of wind turbines by Danish manufacturers Kuriant, Vestas,
Nordtank, and Bonus. These early turbines were small by today's
standards, with capacities of 20–30 kW each. Since then, they have
increased greatly in size, with the Enercon E-126 capable of delivering
up to 7 MW, while wind turbine production has expanded to many
countries.
The concept for "large-scale offshore floating wind turbines was
introduced by Professor William E. Heronemus at the University
of Massachusetts in 1972. It was not until the mid 1990’s, after
the commercial wind industry was well established, that the topic
was taken up again by the mainstream research community.
As of 2003, existing offshore fixed-bottom wind turbine
technology deployments had been limited to water depths of 30-
meters. Worldwide deep-water wind resources are extremely
abundant in subsea areas with depths up to 600 meters, which
are thought to best facilitate transmission of the generated
electric power to shore communities.
9

Developed by Hydro, a Norwegian offshore producer of oil and
gas and the third largest aluminum supplier in the world.
Hydro is a fortune 500 country that was founded in 1905, with
33,000 employees in 40 countries
Hydro has researched this plan for more many years, and the
results look promising.
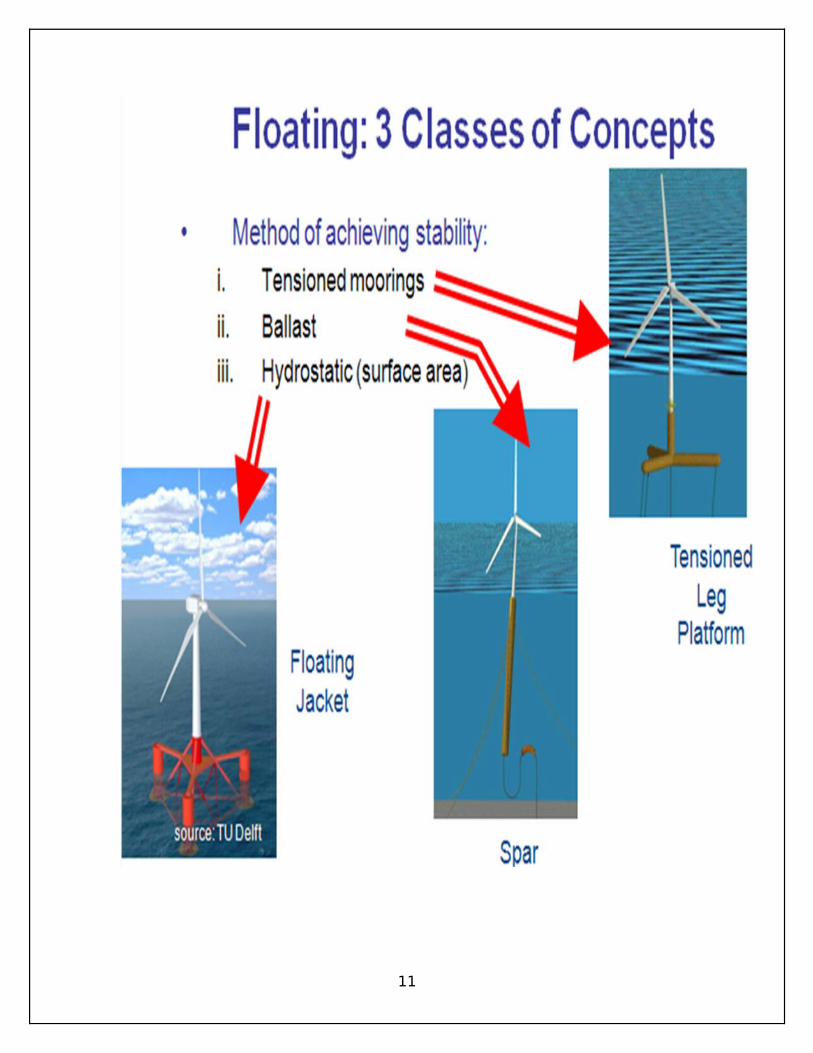
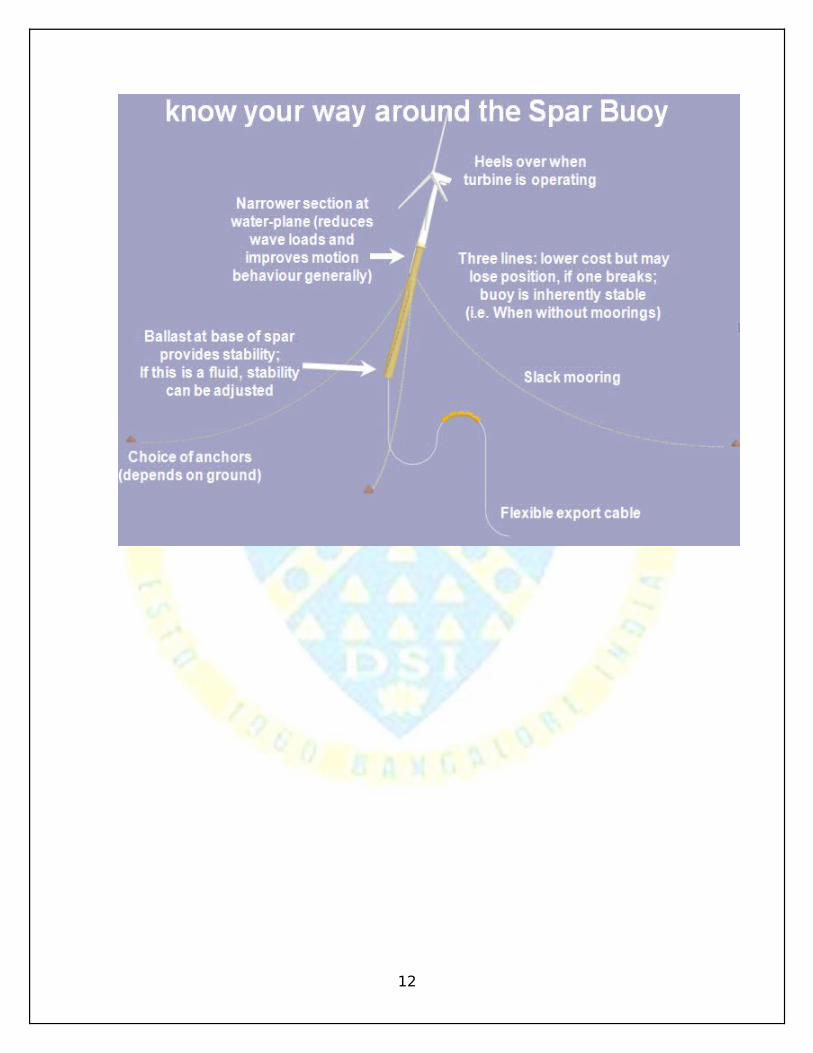
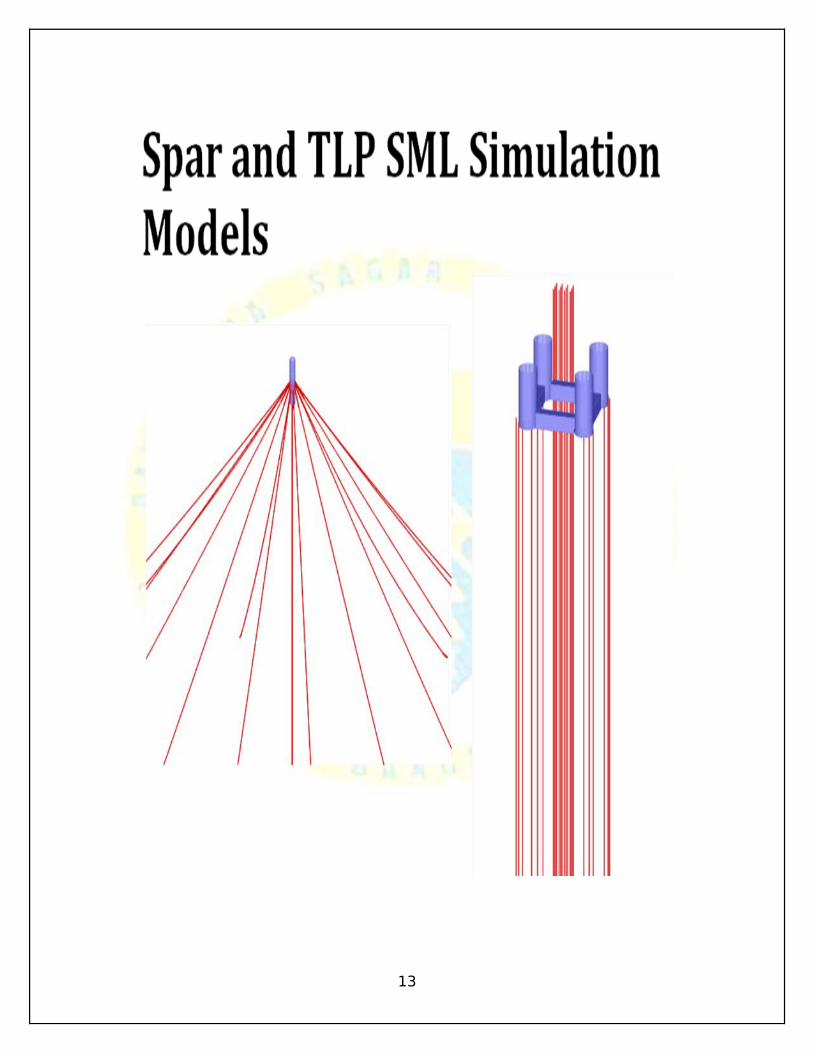
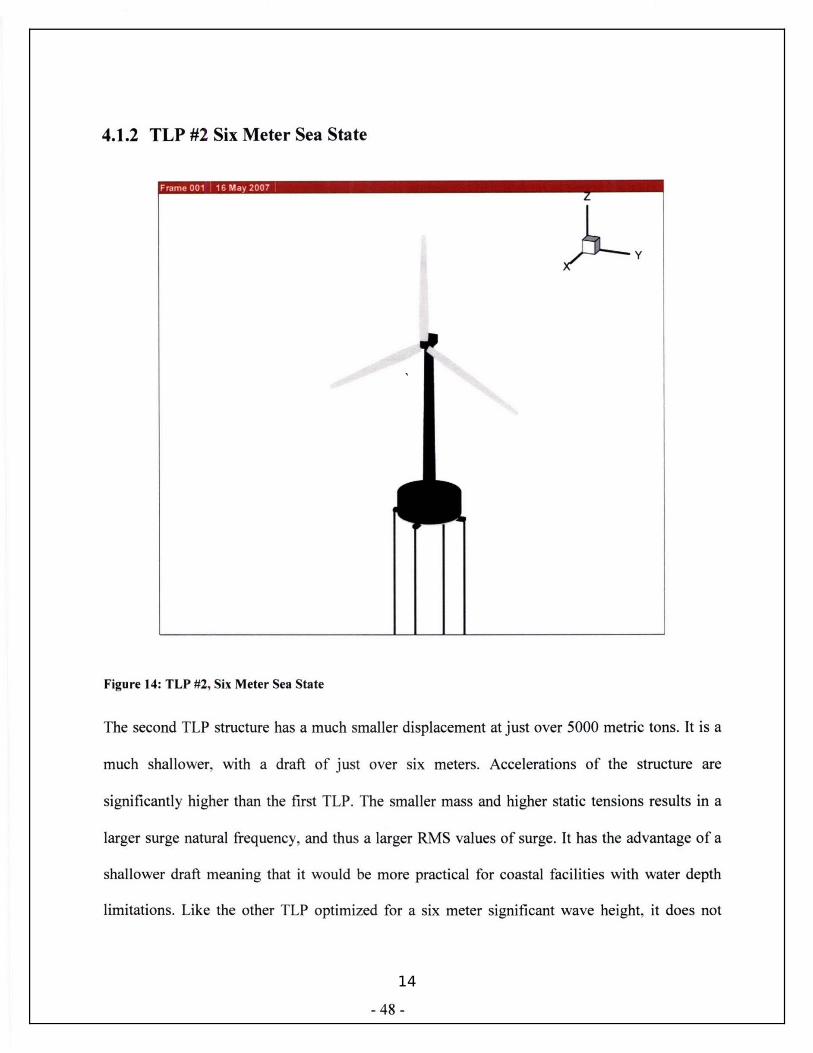
DESIGN CONSIDERATION
10
11
12
13
`
14
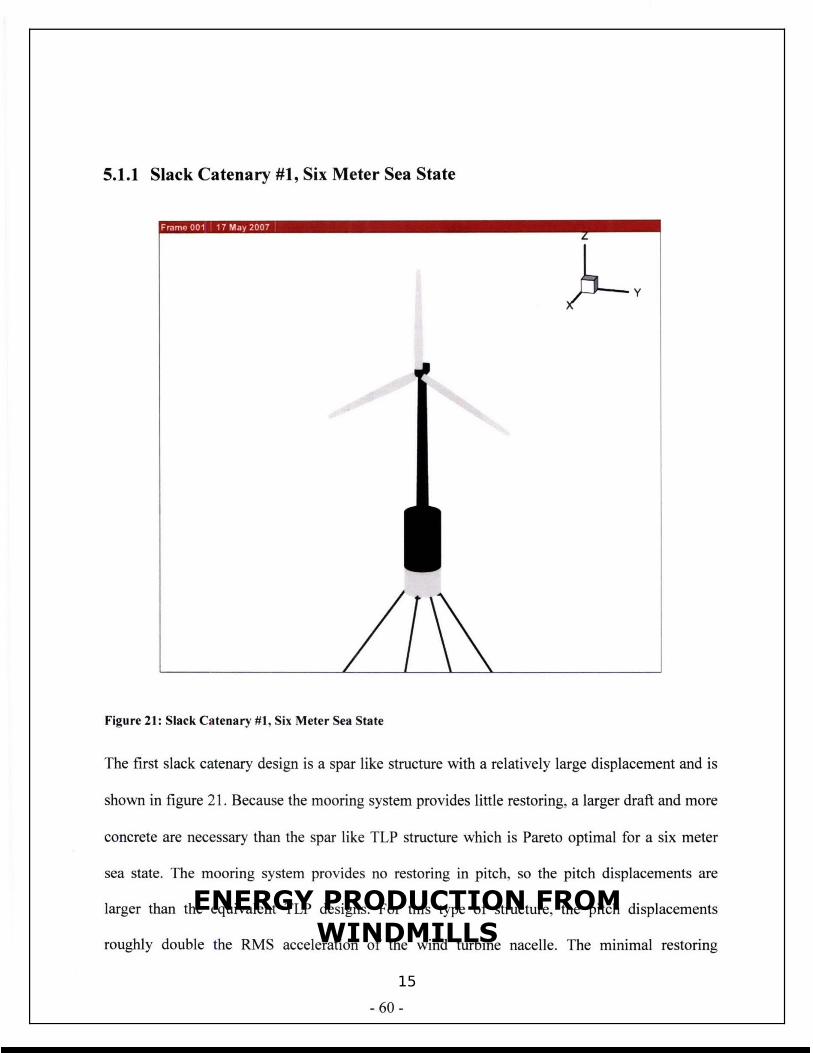
ENERGY PRODUCTION FROM WINDMILLS
15
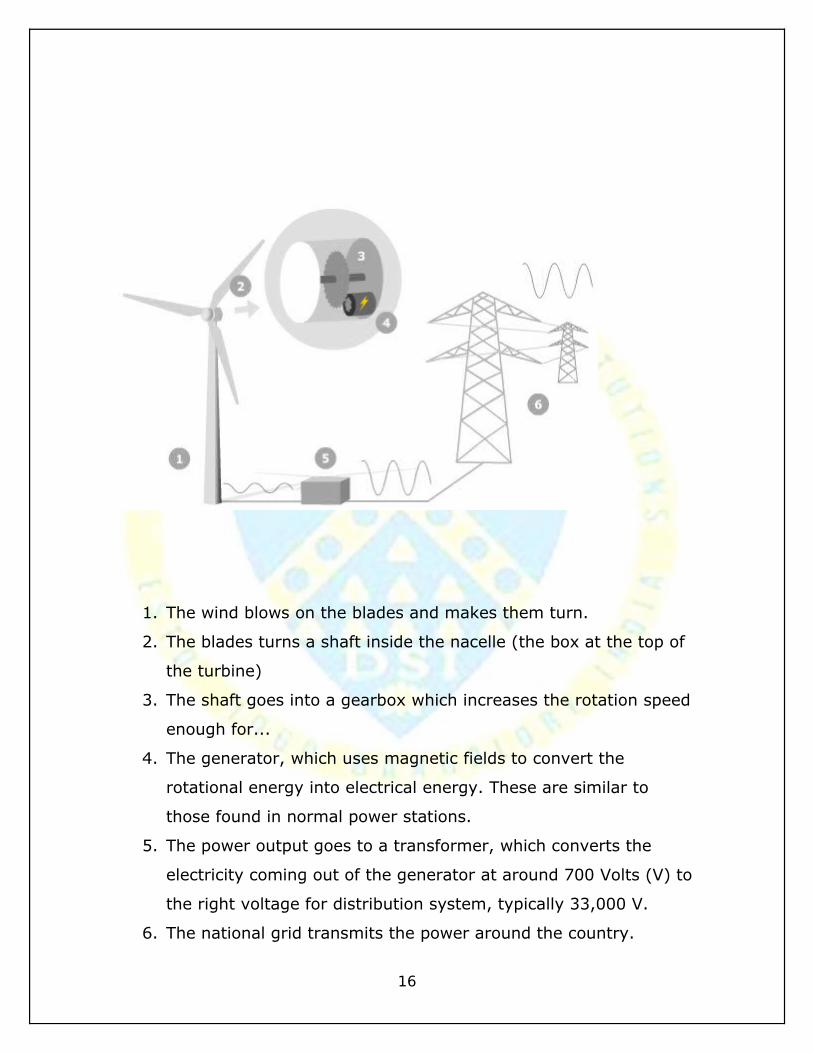
1. The wind blows on the blades and makes them turn.
2. The blades turns a shaft inside the nacelle (the box at the top of
the turbine)
3. The shaft goes into a gearbox which increases the rotation speed
enough for...
4. The generator, which uses magnetic fields to convert the
rotational energy into electrical energy. These are similar to
those found in normal power stations.
5. The power output goes to a transformer, which converts the
electricity coming out of the generator at around 700 Volts (V) to
the right voltage for distribution system, typically 33,000 V.
6. The national grid transmits the power around the country.
16
Instruments to measure the wind speed and direction are fitted on top
of the nacelle. When the wind changes direction motors turn the
nacelle, and the blades along with it, around to face the wind. The
nacelle is also fitted with brakes, so that the turbine can be switched
off in very high winds, like during storms. This prevents the turbine
being damaged. All this information is recorded by computers and
transmitted to a control centre, which means that people don't have to
visit the turbine very often, just occasionally for a mechanical check.
This is often done by local firms.
ADVANTAGES & DISADVANTAGES OF WINDMILLS
W
17
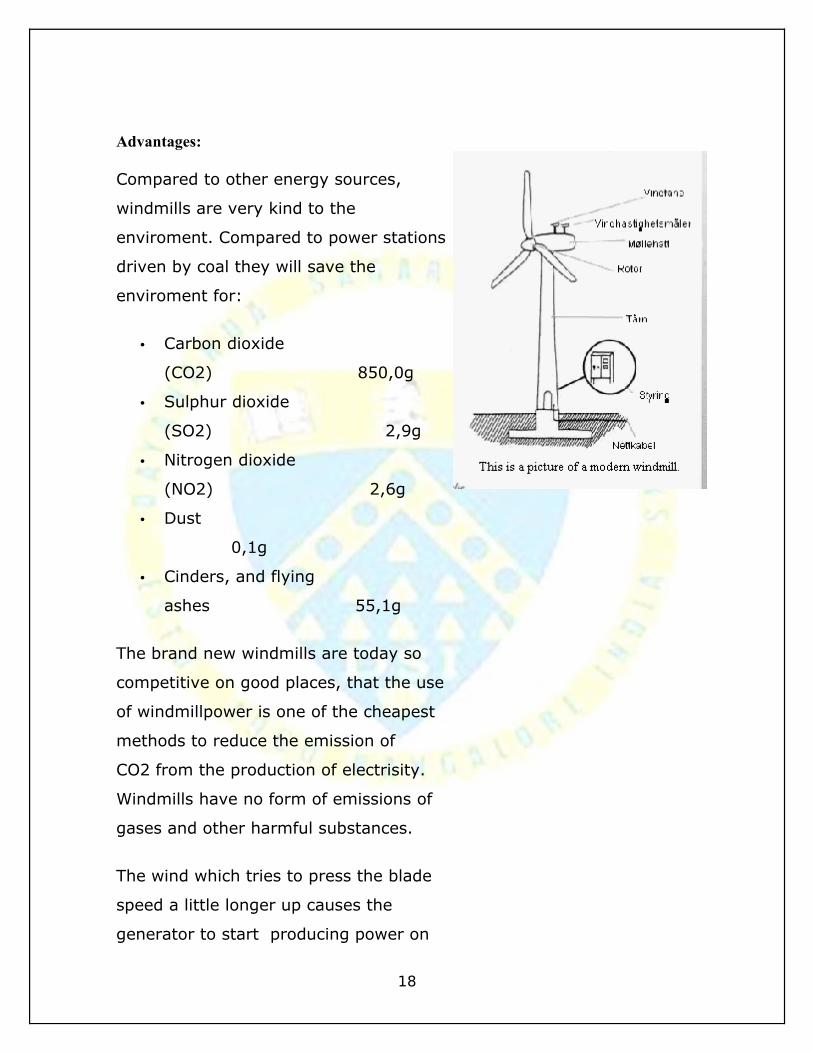
Advantages:
Compared to other energy sources,
windmills are very kind to the
enviroment. Compared to power stations
driven by coal they will save the
enviroment for:
• Carbon dioxide
(CO2) 850,0g
• Sulphur dioxide
(SO2) 2,9g
• Nitrogen dioxide
(NO2) 2,6g
• Dust
0,1g
• Cinders, and flying
ashes 55,1g
The brand new windmills are today so
competitive on good places, that the use
of windmillpower is one of the cheapest
methods to reduce the emission of
CO2 from the production of electrisity.
Windmills have no form of emissions of
gases and other harmful substances.
The wind which tries to press the blade
speed a little longer up causes the
generator to start producing power on
18
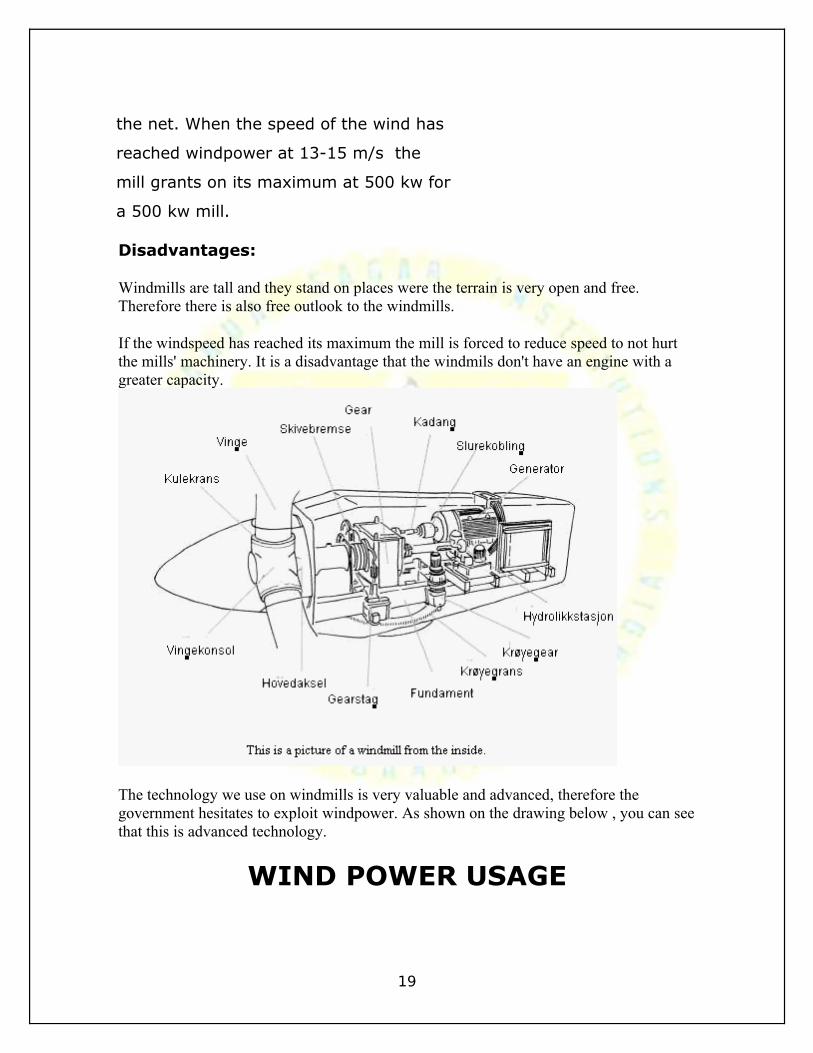
the net. When the speed of the wind has
reached windpower at 13-15 m/s the
mill grants on its maximum at 500 kw for
a 500 kw mill.
Disadvantages:
Windmills are tall and they stand on places were the terrain is very open and free. Therefore there is also free outlook to the windmills.
If the windspeed has reached its maximum the mill is forced to reduce speed to not hurt the mills' machinery. It is a disadvantage that the windmils don't have an engine with a greater capacity.
The technology we use on windmills is very valuable and advanced, therefore the government hesitates to exploit windpower. As shown on the drawing below , you can see that this is advanced technology.
WIND POWER USAGE
19
There are now many thousands of wind turbines operating, with a
total nameplate capacity of 157,899 MW of which wind power in
Europe accounts for 48% (2009). World wind generation capacity more
than quadrupled between 2000 and 2006, doubling about every three
years. 81% of wind power installations are in the US and Europe. The
share of the top five countries in terms of new installations fell from
71% in 2004 to 62% in 2006, but climbed to 73% by 2008 as those
countries—the United States, Germany, Spain, China, and India—have
seen substantial capacity growth in the past two years (see chart).
By 2010, the World Wind Energy Association expects 160 GW of
capacity to be installed worldwide,[54] up from 73.9 GW at the end of
2006, implying an anticipated net growth rate of more than 21% per
year.
Denmark generates nearly one-fifth of its electricity with wind turbines
—the highest percentage of any country—and is ninth in the world in
total wind power generation. Denmark is prominent in the
manufacturing and use of wind turbines, with a commitment made in
the 1970s to eventually produce half of the country's power by wind.
In recent years, the US has added more wind energy to its grid than
any other country, with a growth in power capacity of 45% to 16.8 GW
in 2007[55] and surpassing Germany's nameplate capacity in
2008. California was one of the incubators of the modern wind power
industry, and led the U.S. in installed capacity for many years;
however, by the end of 2006, Texas became the leading wind power
state and continues to extend its lead. At the end of 2008, the state
had 7,116 MW installed, which would have ranked it sixth in the world
if Texas was a separate country. Iowa and Minnesota each grew to
more than 1 GW installed by the end of 2007; in 2008 they were joined
by Oregon, Washington, and Colorado.[56] Wind power generation in the
20
U.S. was up 31.8% in February, 2007 from February, 2006.[57] The
average output of one MW of wind power is equivalent to the average
electricity consumption of about 250 American households. According
to theAmerican Wind Energy Association, wind will generate enough
electricity in 2008 to power just over 1% (equivalent to 4.5 million
households) of total electricity in U.S., up from less than 0.1% in
1999. U.S. Department of Energy studies have concluded wind
harvested in the Great Plains states of Texas, Kansas, and North
Dakota could provide enough electricity to power the entire nation, and
that offshore wind farms could do the same job.[58][59] In addition, the
wind resource over and around theGreat Lakes, recoverable with
currently available technology, could by itself provide 80% as much
power as the U.S. and Canada currently generate from non-renewable
resources,[60] with Michigan's share alone equating to one third of
current U.S. electricity demand.[61]
China had originally set a generating target of 30,000 MW by 2020
from renewable energy sources, but reached 22,500 MW by end of
2009 and could easily surpass 30,000 MW by end of 2010. Indigenous
wind power could generate up to 253,000 MW.[62] A Chinese renewable
energy law was adopted in November 2004, following the World Wind
Energy Conference organized by the Chinese and the World Wind
Energy Association. By 2008, wind power was growing faster in China
than the government had planned, and indeed faster in percentage
terms than in any other large country, having more than doubled each
year since 2005. Policymakers doubled their wind power prediction for
2010, after the wind industry reached the original goal of 5 GW three
years ahead of schedule.[63] Current trends suggest an actual installed
capacity near 20 GW by 2010, with China shortly thereafter pursuing
the United States for the world wind power lead.[63]
21
India ranks 5th in the world with a total wind power capacity of
10,925 MW in 2009,[1]or 3% of all electricity produced in India. The
World Wind Energy Conference in New Delhi in November 2006 has
given additional impetus to the Indian wind industry.[54] Muppandal village in Tamil Nadu state, India, has several wind
turbine farms in its vicinity, and is one of the major wind energy
harnessing centres in India led by majors
like Suzlon, Vestas, Micon among others.[64][65]
Mexico recently opened La Venta II wind power project as an important
step in reducing Mexico's consumption of fossil fuels. The 88 MW
project is the first of its kind in Mexico, and will provide 13 percent of
the electricity needs of the state of Oaxaca. By 2012 the project will
have a capacity of 3500 MW.
Another growing market is Brazil, with a wind potential of 143 GW.[66] The federal government has created an incentive program, called
Proinfa,[67] to build production capacity of 3300 MW of renewable
energy for 2008, of which 1422 MW through wind energy. The program
seeks to produce 10% of Brazilian electricity through renewable
sources.
South Africa has a proposed station situated on the West Coast north
of the Olifants River mouth near the town of Koekenaap, east of
Vredendal in the Western Cape province. The station is proposed to
have a total output of 100 MW although there are negotiations to
double this capacity. The plant could be operational by 2010.
France has announced a target of 12,500 MW installed by 2010,
though their installation trends over the past few years suggest they'll
fall well short of their goal.
22
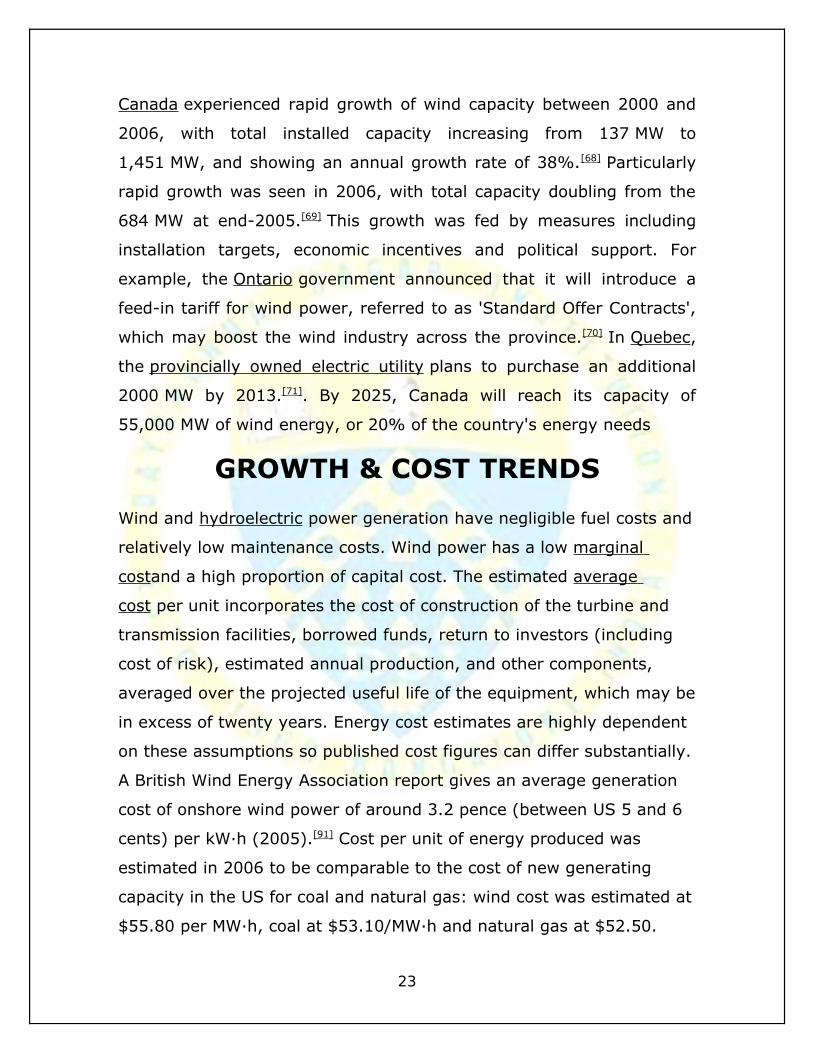
Canada experienced rapid growth of wind capacity between 2000 and
2006, with total installed capacity increasing from 137 MW to
1,451 MW, and showing an annual growth rate of 38%.[68] Particularly
rapid growth was seen in 2006, with total capacity doubling from the
684 MW at end-2005.[69] This growth was fed by measures including
installation targets, economic incentives and political support. For
example, the Ontario government announced that it will introduce a
feed-in tariff for wind power, referred to as 'Standard Offer Contracts',
which may boost the wind industry across the province.[70] In Quebec,
the provincially owned electric utility plans to purchase an additional
2000 MW by 2013.[71]. By 2025, Canada will reach its capacity of
55,000 MW of wind energy, or 20% of the country's energy needs
GROWTH & COST TRENDS
Wind and hydroelectric power generation have negligible fuel costs and
relatively low maintenance costs. Wind power has a low marginal
costand a high proportion of capital cost. The estimated average
cost per unit incorporates the cost of construction of the turbine and
transmission facilities, borrowed funds, return to investors (including
cost of risk), estimated annual production, and other components,
averaged over the projected useful life of the equipment, which may be
in excess of twenty years. Energy cost estimates are highly dependent
on these assumptions so published cost figures can differ substantially.
A British Wind Energy Association report gives an average generation
cost of onshore wind power of around 3.2 pence (between US 5 and 6
cents) per kW·h (2005).[91] Cost per unit of energy produced was
estimated in 2006 to be comparable to the cost of new generating
capacity in the US for coal and natural gas: wind cost was estimated at
$55.80 per MW·h, coal at $53.10/MW·h and natural gas at $52.50.
23
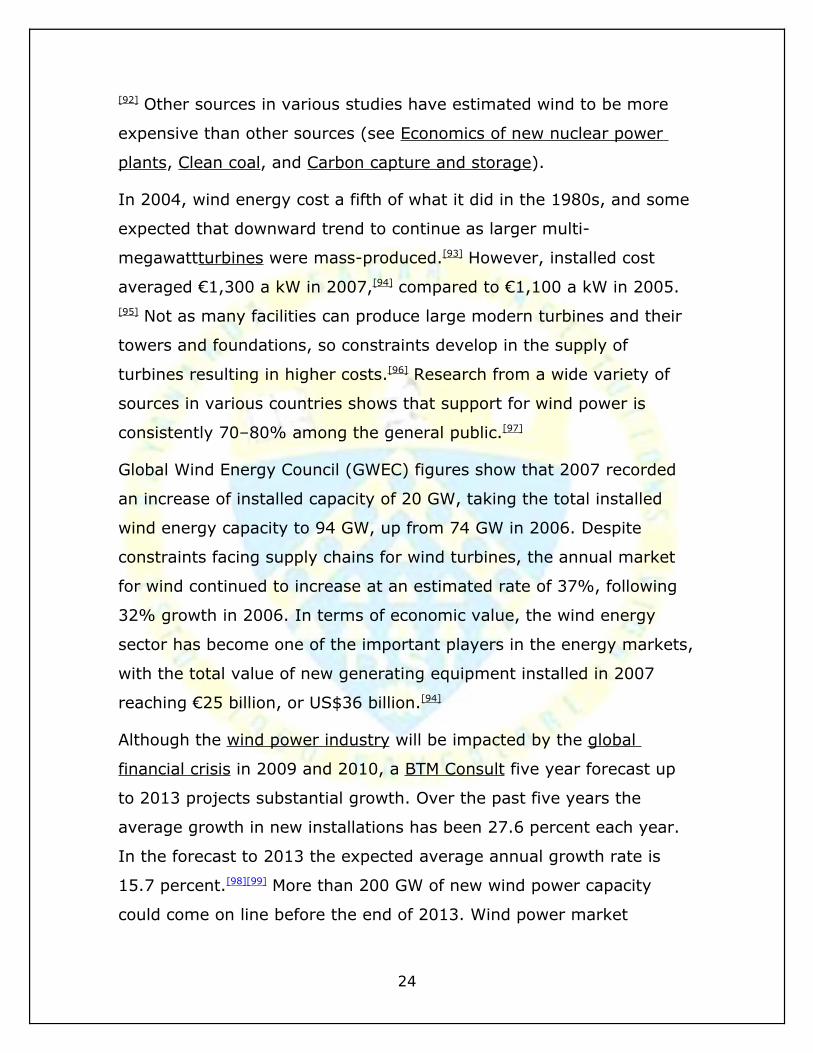
[92] Other sources in various studies have estimated wind to be more
expensive than other sources (see Economics of new nuclear power
plants, Clean coal, and Carbon capture and storage).
In 2004, wind energy cost a fifth of what it did in the 1980s, and some
expected that downward trend to continue as larger multi-
megawattturbines were mass-produced.[93] However, installed cost
averaged €1,300 a kW in 2007,[94] compared to €1,100 a kW in 2005.[95] Not as many facilities can produce large modern turbines and their
towers and foundations, so constraints develop in the supply of
turbines resulting in higher costs.[96] Research from a wide variety of
sources in various countries shows that support for wind power is
consistently 70–80% among the general public.[97]
Global Wind Energy Council (GWEC) figures show that 2007 recorded
an increase of installed capacity of 20 GW, taking the total installed
wind energy capacity to 94 GW, up from 74 GW in 2006. Despite
constraints facing supply chains for wind turbines, the annual market
for wind continued to increase at an estimated rate of 37%, following
32% growth in 2006. In terms of economic value, the wind energy
sector has become one of the important players in the energy markets,
with the total value of new generating equipment installed in 2007
reaching €25 billion, or US$36 billion.[94]
Although the wind power industry will be impacted by the global
financial crisis in 2009 and 2010, a BTM Consult five year forecast up
to 2013 projects substantial growth. Over the past five years the
average growth in new installations has been 27.6 percent each year.
In the forecast to 2013 the expected average annual growth rate is
15.7 percent.[98][99] More than 200 GW of new wind power capacity
could come on line before the end of 2013. Wind power market
24
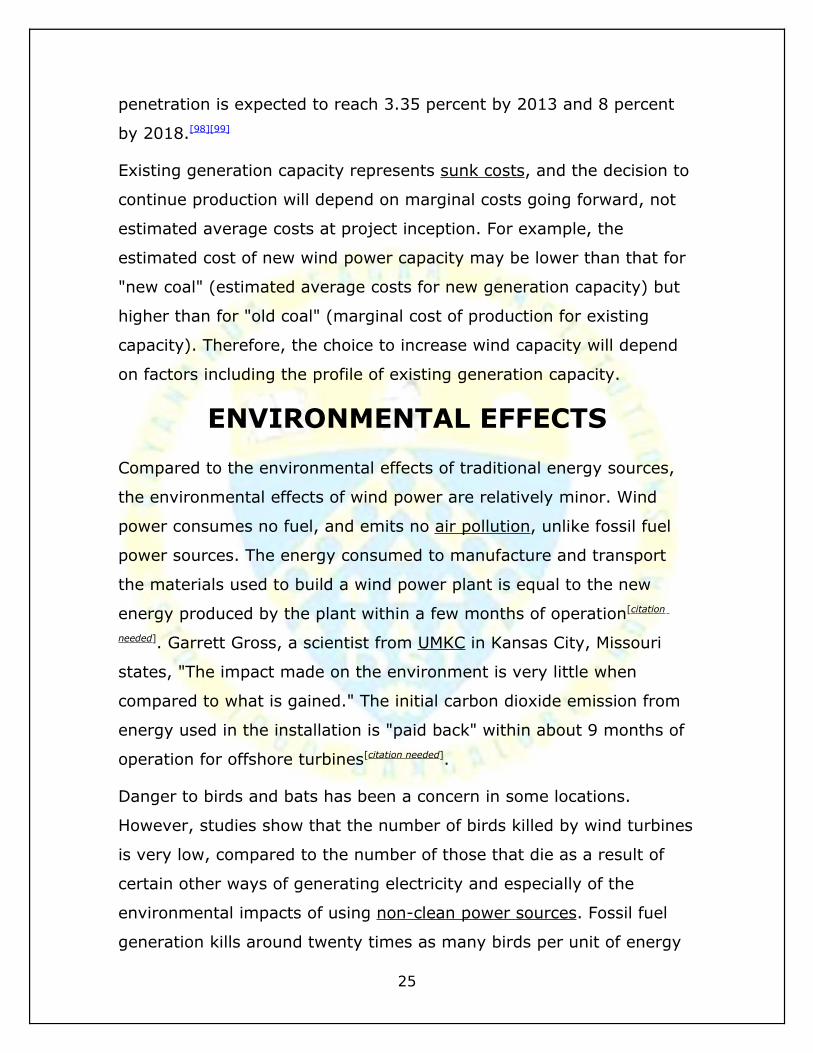
penetration is expected to reach 3.35 percent by 2013 and 8 percent
by 2018.[98][99]
Existing generation capacity represents sunk costs, and the decision to
continue production will depend on marginal costs going forward, not
estimated average costs at project inception. For example, the
estimated cost of new wind power capacity may be lower than that for
"new coal" (estimated average costs for new generation capacity) but
higher than for "old coal" (marginal cost of production for existing
capacity). Therefore, the choice to increase wind capacity will depend
on factors including the profile of existing generation capacity.
ENVIRONMENTAL EFFECTS
Compared to the environmental effects of traditional energy sources,
the environmental effects of wind power are relatively minor. Wind
power consumes no fuel, and emits no air pollution, unlike fossil fuel
power sources. The energy consumed to manufacture and transport
the materials used to build a wind power plant is equal to the new
energy produced by the plant within a few months of operation[citation
needed]. Garrett Gross, a scientist from UMKC in Kansas City, Missouri
states, "The impact made on the environment is very little when
compared to what is gained." The initial carbon dioxide emission from
energy used in the installation is "paid back" within about 9 months of
operation for offshore turbines[citation needed].
Danger to birds and bats has been a concern in some locations.
However, studies show that the number of birds killed by wind turbines
is very low, compared to the number of those that die as a result of
certain other ways of generating electricity and especially of the
environmental impacts of using non-clean power sources. Fossil fuel
generation kills around twenty times as many birds per unit of energy
25
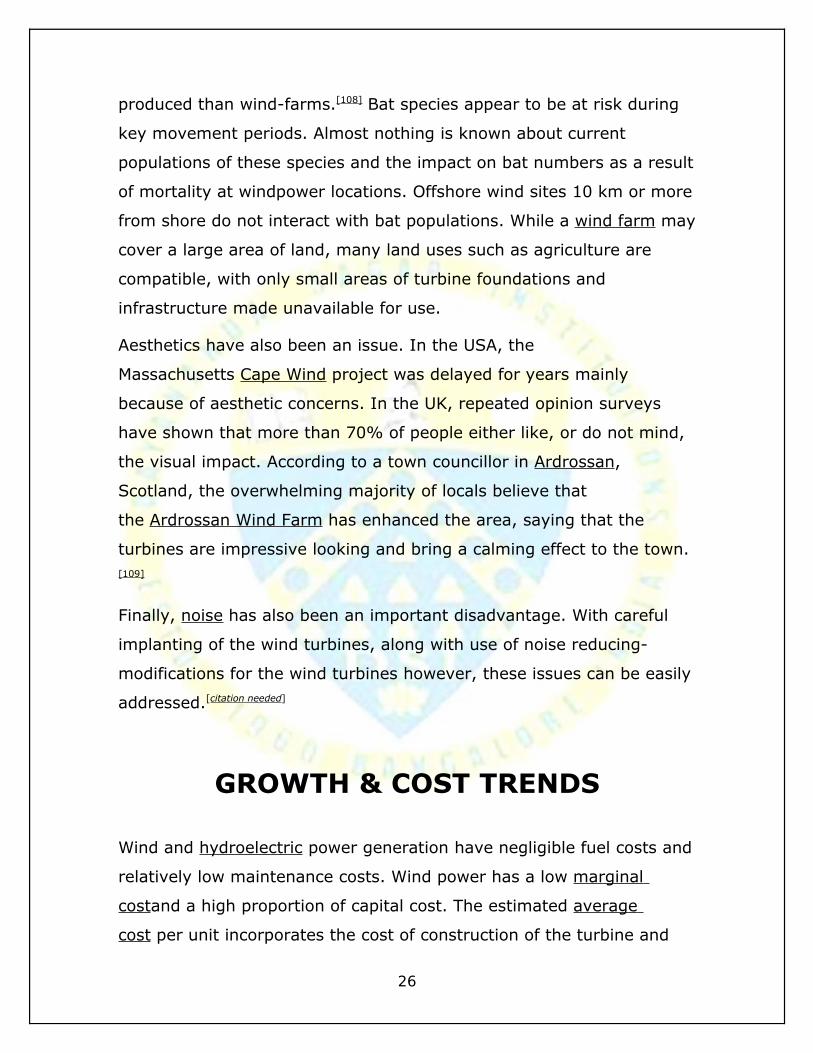
produced than wind-farms.[108] Bat species appear to be at risk during
key movement periods. Almost nothing is known about current
populations of these species and the impact on bat numbers as a result
of mortality at windpower locations. Offshore wind sites 10 km or more
from shore do not interact with bat populations. While a wind farm may
cover a large area of land, many land uses such as agriculture are
compatible, with only small areas of turbine foundations and
infrastructure made unavailable for use.
Aesthetics have also been an issue. In the USA, the
Massachusetts Cape Wind project was delayed for years mainly
because of aesthetic concerns. In the UK, repeated opinion surveys
have shown that more than 70% of people either like, or do not mind,
the visual impact. According to a town councillor in Ardrossan,
Scotland, the overwhelming majority of locals believe that
the Ardrossan Wind Farm has enhanced the area, saying that the
turbines are impressive looking and bring a calming effect to the town.[109]
Finally, noise has also been an important disadvantage. With careful
implanting of the wind turbines, along with use of noise reducing-
modifications for the wind turbines however, these issues can be easily
addressed.[citation needed]
GROWTH & COST TRENDS
Wind and hydroelectric power generation have negligible fuel costs and
relatively low maintenance costs. Wind power has a low marginal
costand a high proportion of capital cost. The estimated average
cost per unit incorporates the cost of construction of the turbine and
26
transmission facilities, borrowed funds, return to investors (including
cost of risk), estimated annual production, and other components,
averaged over the projected useful life of the equipment, which may be
in excess of twenty years. Energy cost estimates are highly dependent
on these assumptions so published cost figures can differ substantially.
A British Wind Energy Association report gives an average generation
cost of onshore wind power of around 3.2 pence (between US 5 and 6
cents) per kW·h (2005).[91] Cost per unit of energy produced was
estimated in 2006 to be comparable to the cost of new generating
capacity in the US for coal and natural gas: wind cost was estimated at
$55.80 per MW·h, coal at $53.10/MW·h and natural gas at $52.50.[92] Other sources in various studies have estimated wind to be more
expensive than other sources (see Economics of new nuclear power
plants, Clean coal, and Carbon capture and storage).
In 2004, wind energy cost a fifth of what it did in the 1980s, and some
expected that downward trend to continue as larger multi-
megawattturbines were mass-produced.[93] However, installed cost
averaged €1,300 a kW in 2007,[94] compared to €1,100 a kW in 2005.[95] Not as many facilities can produce large modern turbines and their
towers and foundations, so constraints develop in the supply of
turbines resulting in higher costs.[96] Research from a wide variety of
sources in various countries shows that support for wind power is
consistently 70–80% among the general public.[97]
Global Wind Energy Council (GWEC) figures show that 2007 recorded
an increase of installed capacity of 20 GW, taking the total installed
wind energy capacity to 94 GW, up from 74 GW in 2006. Despite
constraints facing supply chains for wind turbines, the annual market
for wind continued to increase at an estimated rate of 37%, following
32% growth in 2006. In terms of economic value, the wind energy
27
sector has become one of the important players in the energy markets,
with the total value of new generating equipment installed in 2007
reaching €25 billion, or US$36 billion.[94]
Although the wind power industry will be impacted by the global
financial crisis in 2009 and 2010, a BTM Consult five year forecast up
to 2013 projects substantial growth. Over the past five years the
average growth in new installations has been 27.6 percent each year.
In the forecast to 2013 the expected average annual growth rate is
15.7 percent.[98][99] More than 200 GW of new wind power capacity
could come on line before the end of 2013. Wind power market
penetration is expected to reach 3.35 percent by 2013 and 8 percent
by 2018.[98][99]
Existing generation capacity represents sunk costs, and the decision to
continue production will depend on marginal costs going forward, not
estimated average costs at project inception. For example, the
estimated cost of new wind power capacity may be lower than that for
"new coal" (estimated average costs for new generation capacity) but
higher than for "old coal" (marginal cost of production for existing
capacity). Therefore, the choice to increase wind capacity will depend
on factors including the profile of existing generation capacity.
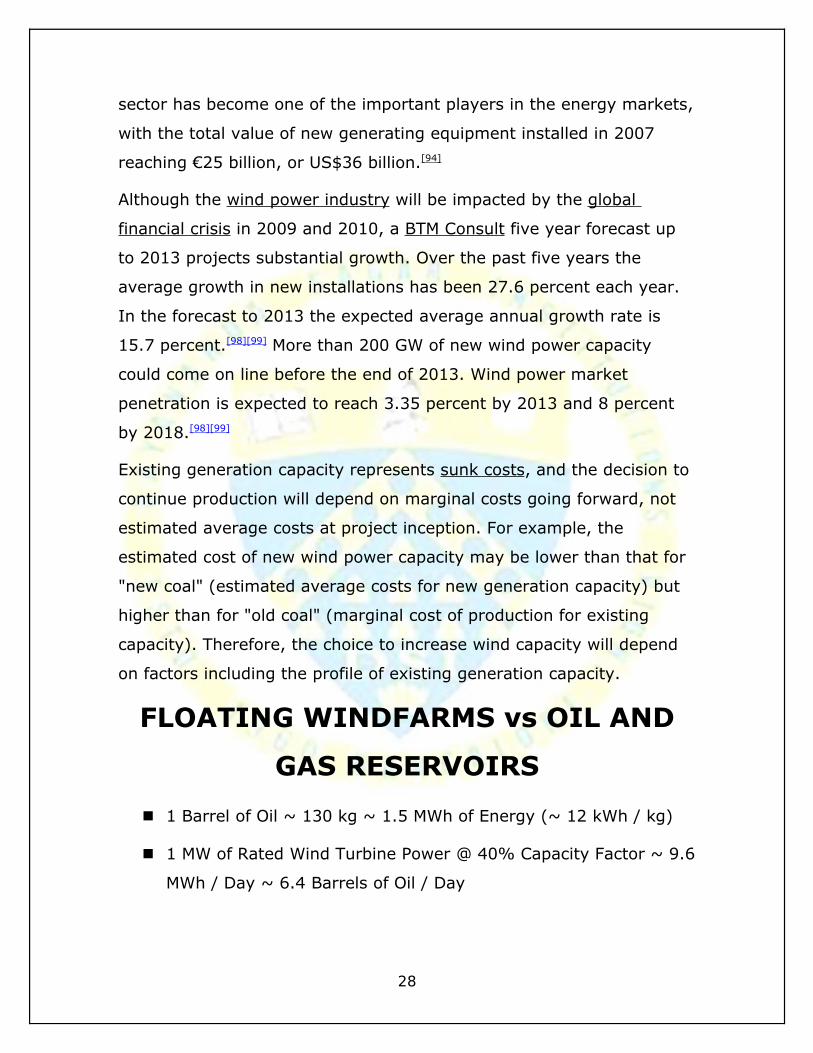
FLOATING WINDFARMS vs OIL AND
GAS RESERVOIRS
1 Barrel of Oil ~ 130 kg ~ 1.5 MWh of Energy (~ 12 kWh / kg)
1 MW of Rated Wind Turbine Power @ 40% Capacity Factor ~ 9.6
MWh / Day ~ 6.4 Barrels of Oil / Day
28
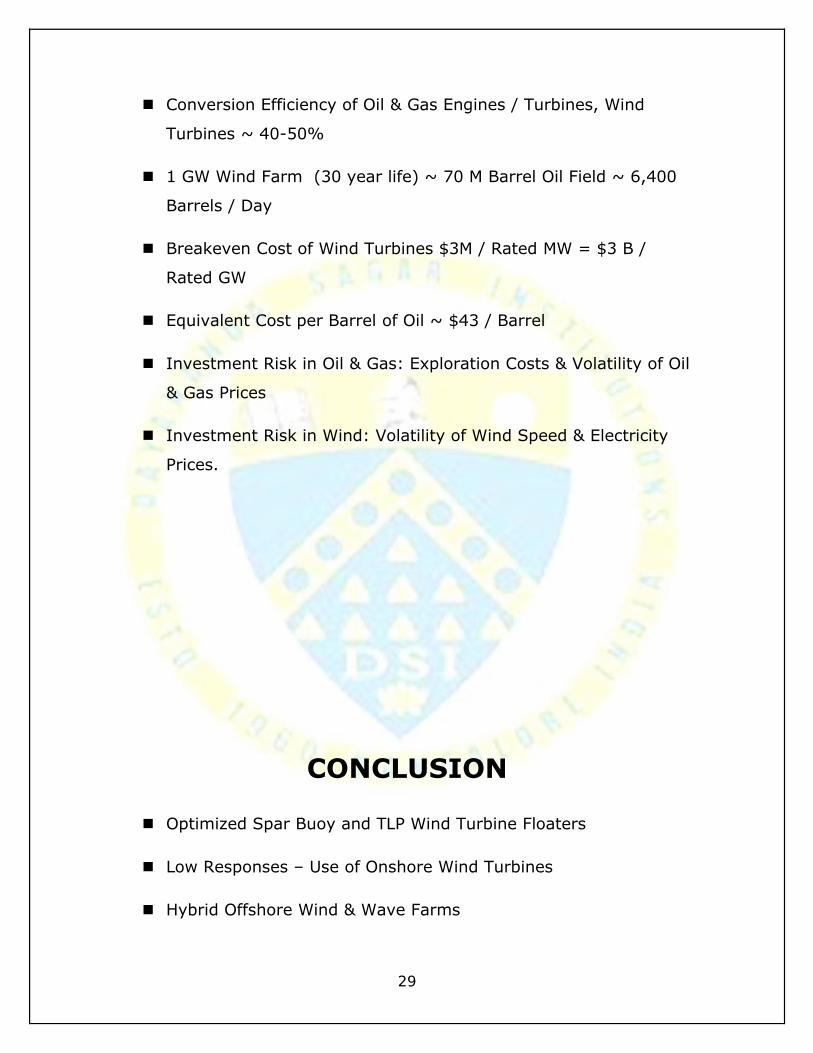
Conversion Efficiency of Oil & Gas Engines / Turbines, Wind
Turbines ~ 40-50%
1 GW Wind Farm (30 year life) ~ 70 M Barrel Oil Field ~ 6,400
Barrels / Day
Breakeven Cost of Wind Turbines $3M / Rated MW = $3 B /
Rated GW
Equivalent Cost per Barrel of Oil ~ $43 / Barrel
Investment Risk in Oil & Gas: Exploration Costs & Volatility of Oil
& Gas Prices
Investment Risk in Wind: Volatility of Wind Speed & Electricity
Prices.
CONCLUSION
Optimized Spar Buoy and TLP Wind Turbine Floaters
Low Responses – Use of Onshore Wind Turbines
Hybrid Offshore Wind & Wave Farms
29
Optimal Control to Enhance Wind and Wave Power Output
Design of Offshore Electric Grids
Attractive Economic Attributes
Project Finance for Utility Scale Offshore Wind & Wave Farms
BIBLIOGRAPHY
Musial, W.; S. Butterfield, A. Boone (2003-11). "Feasibility of
Floating Platform Systems for Wind Turbines". NREL
preprint (NREL) (NREL/CP-500-34874): 14. Retrieved 2009-09-
10.
30
(WMV) sway_movie. SWAY. Event occurs at 1m30s. Retrieved
2009-10-20. "Due to its simple construction, the capital
expenditure of the floating Sway system is competitive to bottom
mounted, near-shore wind towers; however, the average wind
speeds far off-shore are typically higher so more energy can be
produced and the cost of energy is actually reduced when
compared with near-shore wind parks.“
Mark Svenvold (2009-09-09). "The world's first floating wind
turbine goes on line in Norway". DailyFinance.com. Retrieved
2009-10-20.
Union of Concerned Scientists (2003-07-15). "Farming the Wind:
Wind Power and Agriculture". Retrieved 2009-10-20.
a b c d "Floating Wind Turbines, Deep Water Installation". Offshore
Industry 2 (4): 48-51. 2009. Retrieved 2009-10-20. "In
December 2007, Blue H launched the world's first floating wind
turbine 21.3 km off the southern Italian coast at a depth of 113
m. The concession ran out at the end of 2008 and Blue H
decommissioned the unit successfully.".
Madslien, Jorn (2009-09-08), Floating challenge for offshore
wind turbine, BBC News, retrieved 2009-09-14
d Patel, Prachi (2009-06-22). "Floating Wind Turbines to Be
Tested". IEEE Spectrum. Retrieved 2009-06-25.
31