vitrification of m-area mixed (hazardous and radioactive) f006
TRANSCRIPT
- 1 -
WSRC-TR-94-0234
Keywords: glass, vitrification, hazardous waste, mixed waste, thermal treatment, stabilization, solidification
VITRIFICATION OF M-AREA MIXED (HAZARDOUSAND RADIOACTIVE) F006 WASTES: I. SLUDGE ANDSUPERNATE CHARACTERIZATION (U)
C. M. Jantzen and J.B. Pickett
Approved by
R.H. Spires, Research ManagerImmobilization Technology Section
Publication Date: September 1, 2001
This document was prepared in conjunction with work accomplished under Contract No. DE-AC09-96SR18500 with the U.S. Department of Energy
DISCLAIMER
This report was prepared as an account of work sponsored by an agency of the UnitedStates Government. Neither the United States Government nor any agency thereof, norany of their employees, makes any warranty, express or implied, or assumes any legalliability or responsibility for the accuracy, completeness, or usefulness of anyinformation, apparatus, product or process disclosed, or represents that its use would notinfringe privately owned rights. Reference herein to any specific commercial product,process or service by trade name, trademark, manufacturer, or otherwise does notnecessarily constitute or imply its endorsement, recommendation, or favoring by theUnited States Government or any agency thereof. The views and opinions of authorsexpressed herein do not necessarily state or reflect those of the United States Governmentor any agency thereof.
This report has been reproduced directly from the best available copy.
Available for sale to the public, in paper, from U.S. Department of Commerce, NationalTechnical Information Service, 5285 Port Royal Road, Springfield, VA 22161phone: (800) 553-6847fax: (703) 605-6900email: [email protected] ordering: http://www.ntis.gov/support/index.html
Available electronically at http://www.doe.gov/bridge
Available for processing fee to U.S. Department of Energy and its contractors, in paper,from: U.S. Department of Energy, Office of Scientific and Technical Information, P.O.Box 62, Oak Ridge, TN 37831-0062, phone: (865) 576-8401, fax: (865) 576-5728, email:[email protected]
- 4 -
EXECUTIVE SUMMARY
Solidification of Resource Conservation and Recovery Act (RCRA) “listed” mixed(hazardous and radioactive) wastes that were generated in the Savannah River Site’s (SRS)M-Area facility were recently vitrified into borosilicate glass. The initial concept ofsolidification into glass began in 1987 when the sludge and supernates reported in thisstudy were first analyzed at the Savannah River Technology Center (SRTC). A year later,the SRTC Professional Planning Committee (PPC) recommended that high nitratecontaining (low-level) wastes, such as those existing in M-Area, be considered forvitrification. The investigation into vitrification of low-level high nitrate containing wasteswas considered timely because of the potential for large waste volume reduction comparedto alternative solidification into cement. Glass formulations were proposed by SRTC inthe 1990-1994 timeframe and were used as the basis for privatization of a vitrificationVendor Treatment Facility (VTF).
The M-Area operations at the Savannah River Site (SRS) in Aiken, South Carolina, producedreactor components for nuclear weapons materials for the U.S. Department of Energy. Theresulting waste was stored in nine tanks. The total volume in storage was initially ~1,200,000gallons of which ~1/3 was a gelatinous hydroxide sludge. The supernate in the tanks was treatedin a wastewater treatment facility and the resulting effluent released to a National PollutionDischarge Elimination System (NPDES) permitted outfall stream on the SRS site. There wasapproximately 425,000 gallons of waste sludge, which contained high concentrations ofaluminum, sodium, uranium, and nitrate. The sludge was mixed with 275,000 gallons of spentSiO2 rich filter aids. During the ensuing years of wastewater treatment of the supernate the typeof filter aid varied from diatomaceous earth to perlite and/or perflo. All the filter aids were SiO2
enriched and were of high surface area.
Vitrification into borosilicate glass was chosen as the preferred stabilization option because itreduced the volume of sludge by ~85% and reduced the final disposal volume by 96% comparedto alternative stabilization technologies. The large volume reduction will allow for largeassociated savings in disposal and/or long term storage costs once the vitrified waste form isdelisted.
The techniques used to chemically analyze the waste sludge, supernate, spent filter aid, and a“crust” that formed on the settled sludge solids are documented in this study. The analyticmethods used to identify the phases present in the waste sludge are also detailed. All supernatechemical analyses were assessed for accuracy and consistency by performing mass balancecalculations on the species in solution. All sludge chemical analyses were assessed for accuracyand consistency by performing mass balance calculations on the species identified by x-raydiffraction.
Zeolite-A was identified in the sludges when no zeolite had ever been used in the M-Areaprocesses. Experiments were performed in this study to demonstrate that the Zeolite-A formedin-situ in the tanks at ambient temperature from reaction of the silica containing filter aids andthe aluminate rich waste in a high caustic environment.

- 5 -
This page intentionally left blank.
- 6 -
TABLE OF CONTENTS
EXECUTIVE SUMMARY.............................................................................................................4
INTRODUCTION...........................................................................................................................9
BACKGROUND...........................................................................................................................10
EXPERIMENTAL ........................................................................................................................13Sludge-Supernate Analyses .......................................................................................................13Sludge Analyses (Tanks 1-6 and Tank 8)..................................................................................14Sludge Crust (Tank 8) ...............................................................................................................15Sludge and Spent Filter Aid Analyses (Tank 7 and Tank 10) ...................................................15Virgin Filter Aid Analyses ........................................................................................................16
QUALITY ASSURANCE.............................................................................................................16
RESULTS AND DISCUSSION....................................................................................................18Chemical Analysis of the Sludge-Supernate .............................................................................18Chemical Analysis of Sludge and Spent Filter Aids .................................................................18Chemical Analysis of Sludge Crust...........................................................................................20Chemical Analysis of Virgin Filter Aid ....................................................................................21
IDENTIFICATION OF PHASE CONSTITUENTS IN M-AREA SLUDGE AND CRUST.......21
IDENTIFICATION OF IN-TANK ZEOLITE FORMATION......................................................29
MASS BALANCE CALCULATIONS.........................................................................................31
AVERAGE M-AREA WASTE COMPOSITION ........................................................................33
CONCLUSIONS ...........................................................................................................................33
REFERENCES..............................................................................................................................36
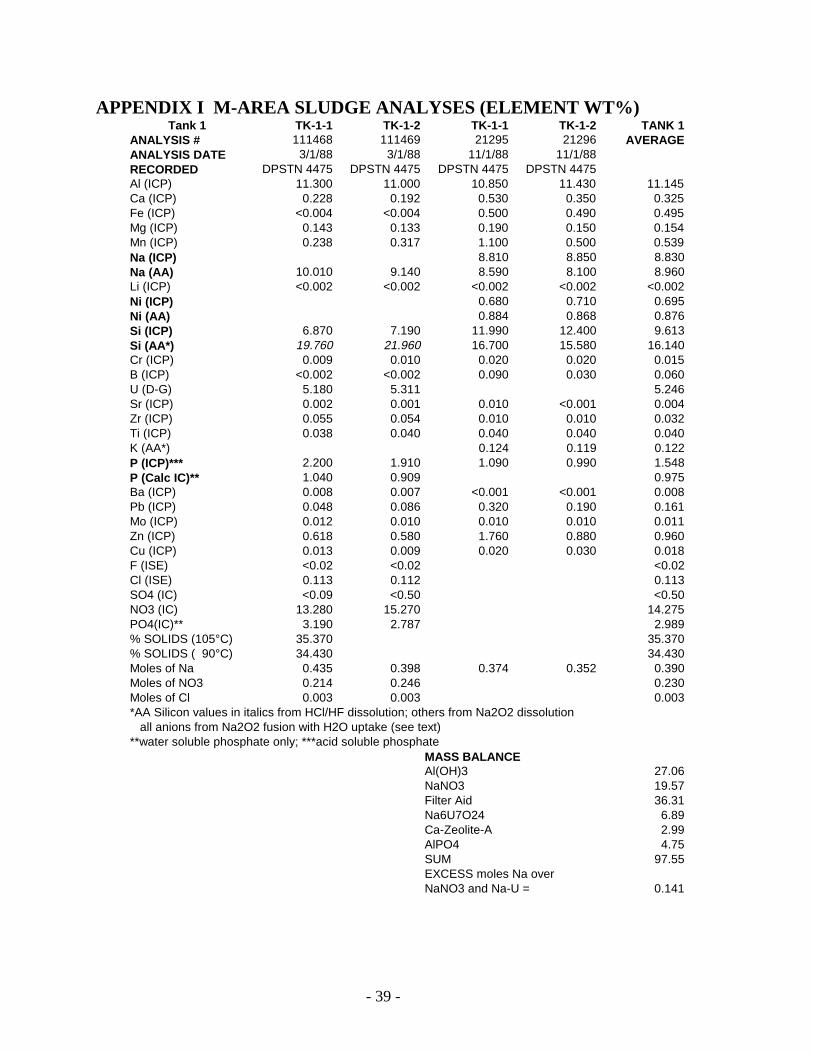
APPENDIX I M-AREA SLUDGE ANALYSES (ELEMENT WT%)........................................39
APPENDIX II M-AREA VIRGIN FILTER AID ANALYSES ...................................................51
- 7 -
LIST OF FIGURES
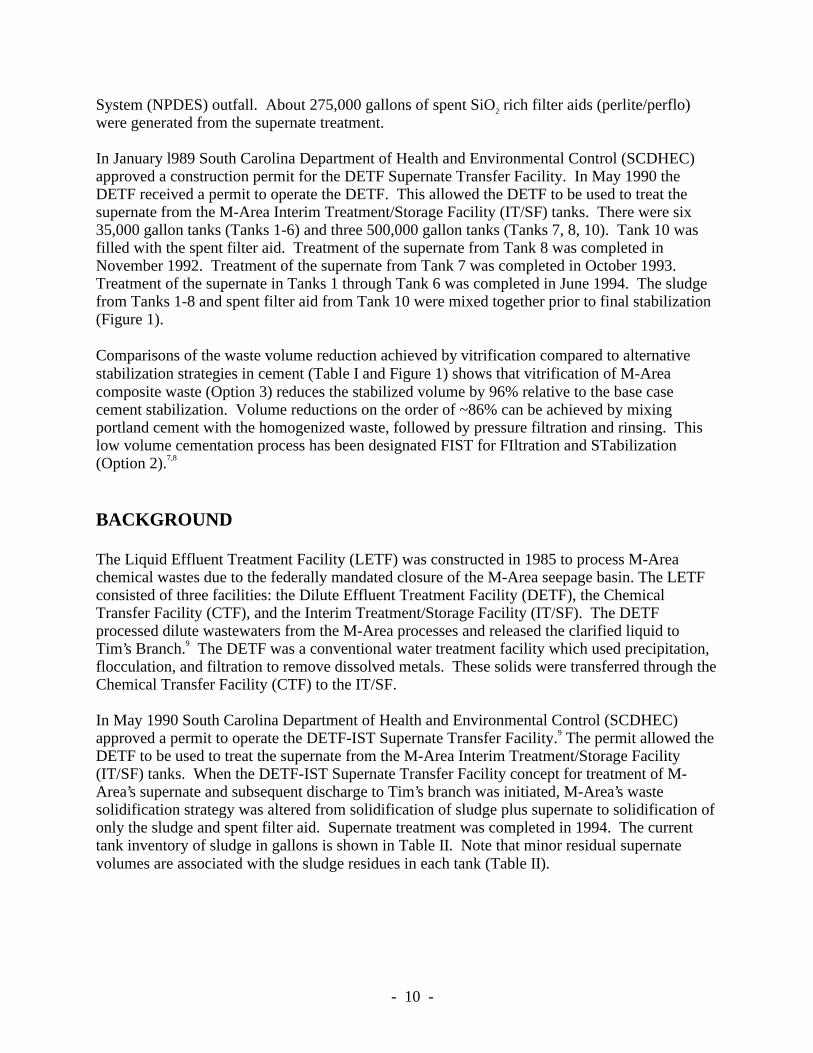
Figure 1. Schematic of the M-Area mixed waste solidification process. ......................................11
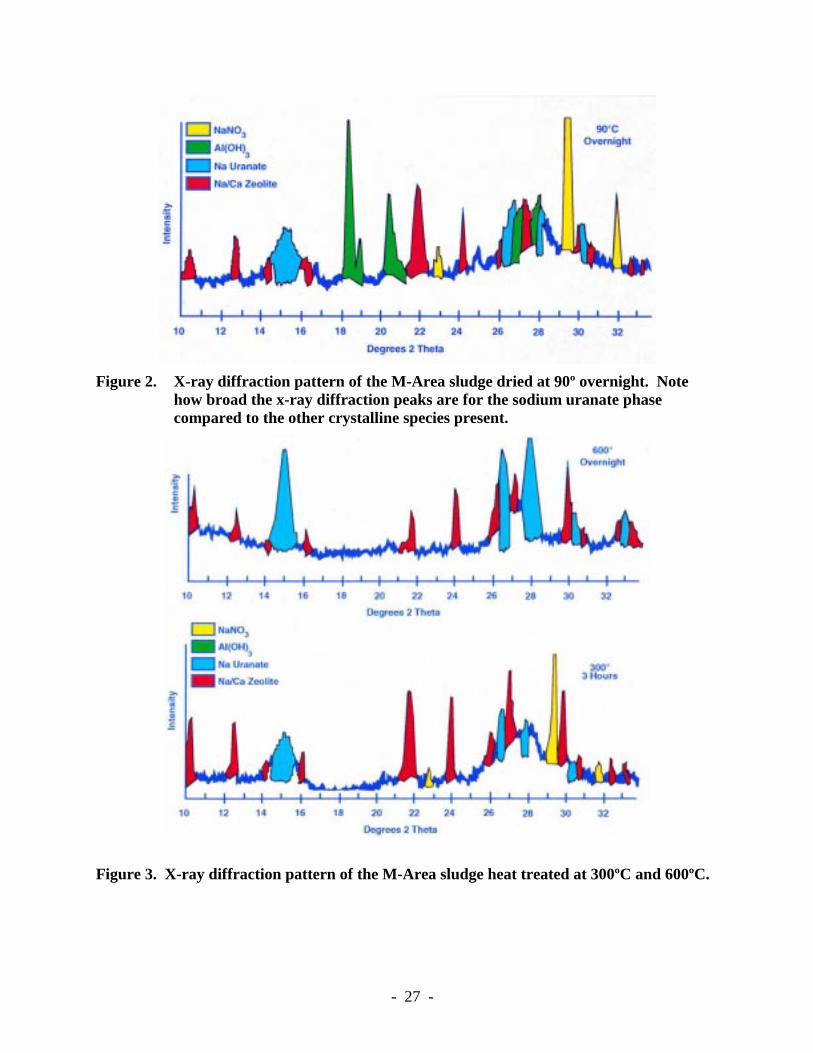
Figure 2. X-ray diffraction pattern of the M-Area sludge dried at 90º overnight. .......................27
Figure 3. X-ray diffraction pattern of the M-Area sludge heat treated at 300ºC and 600ºC. .......27
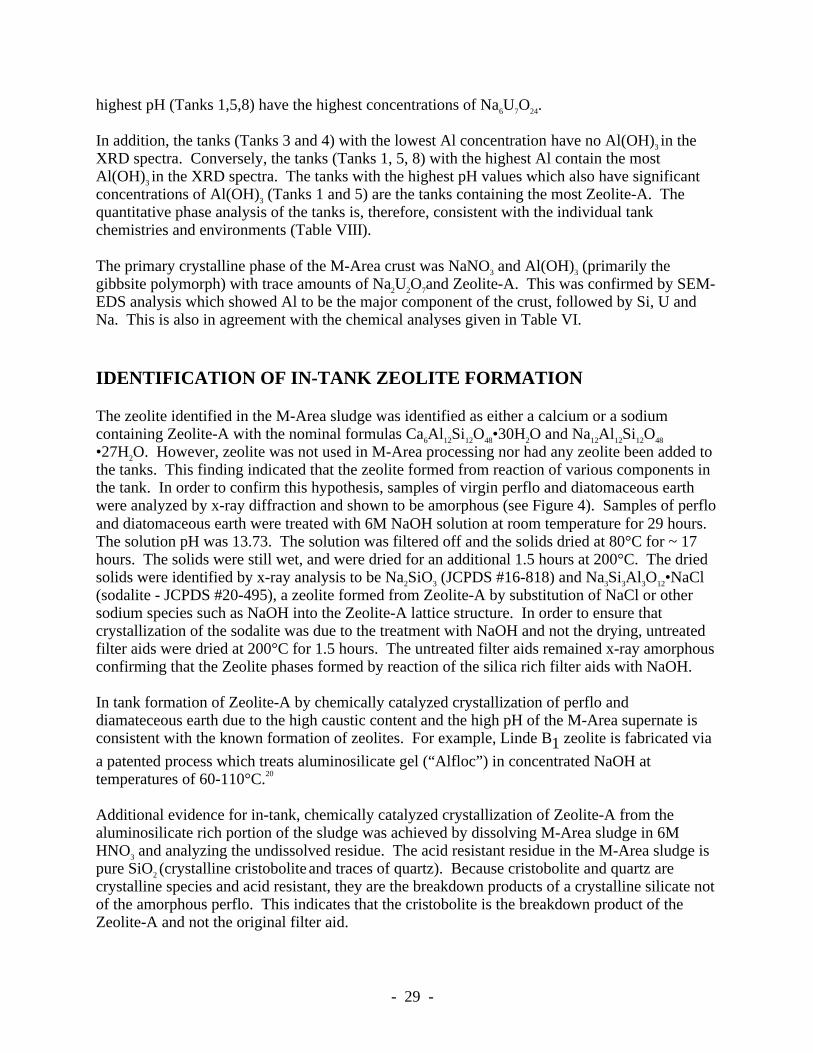
Figure 4. X-ray analysis of untreated (virgin) perflo and diatomaceous earth compared totreatment with 6M NaOH for 29 hours at room temperature which crystallizedNa2SiO3 and sodalite (a mineral related in structure to Zeolite-A). .............................30
LIST OF TABLES
Table I. Comparative Volume Reductions for M-Area Waste Stabilization. 12
Table II. M-Area Tank Inventories as of April, 1994 13
Table III. Detection Limits of Analytic Instrumentation 17
Table IV. Analyses of M-Area Waste Slurry (Sludge + Supernate) 19
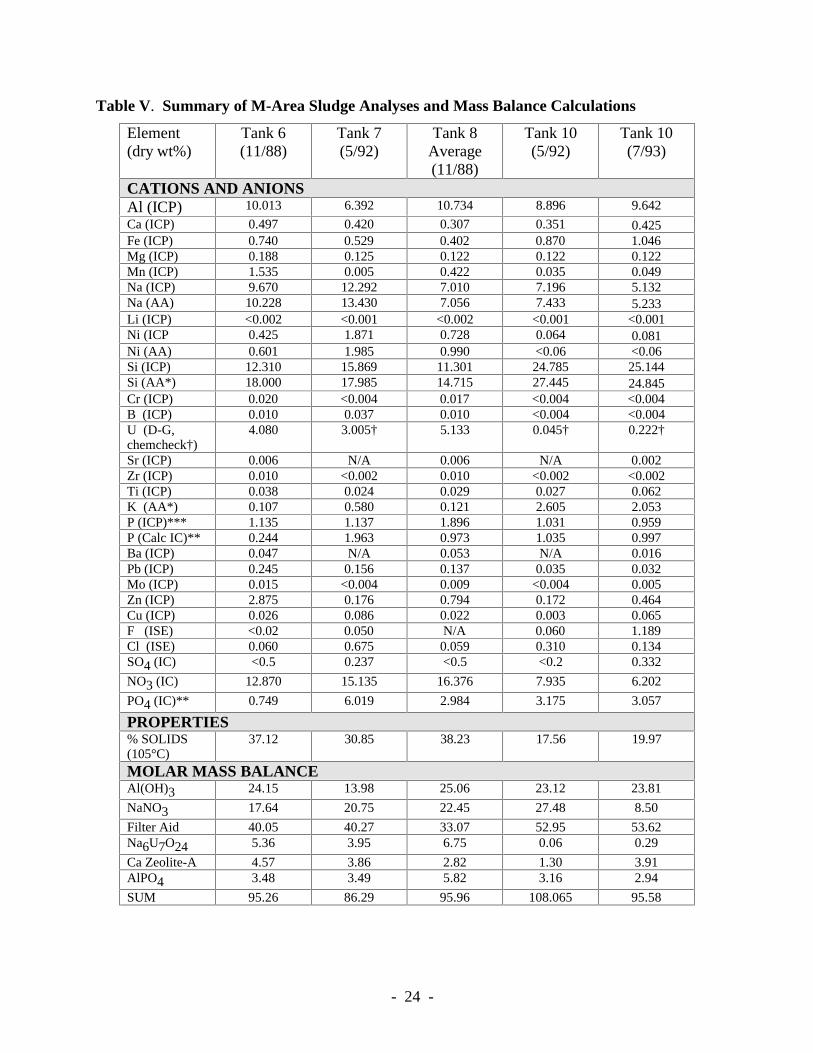
Table V. Summary of M-Area Sludge Analyses and Mass Balance Calculations 23
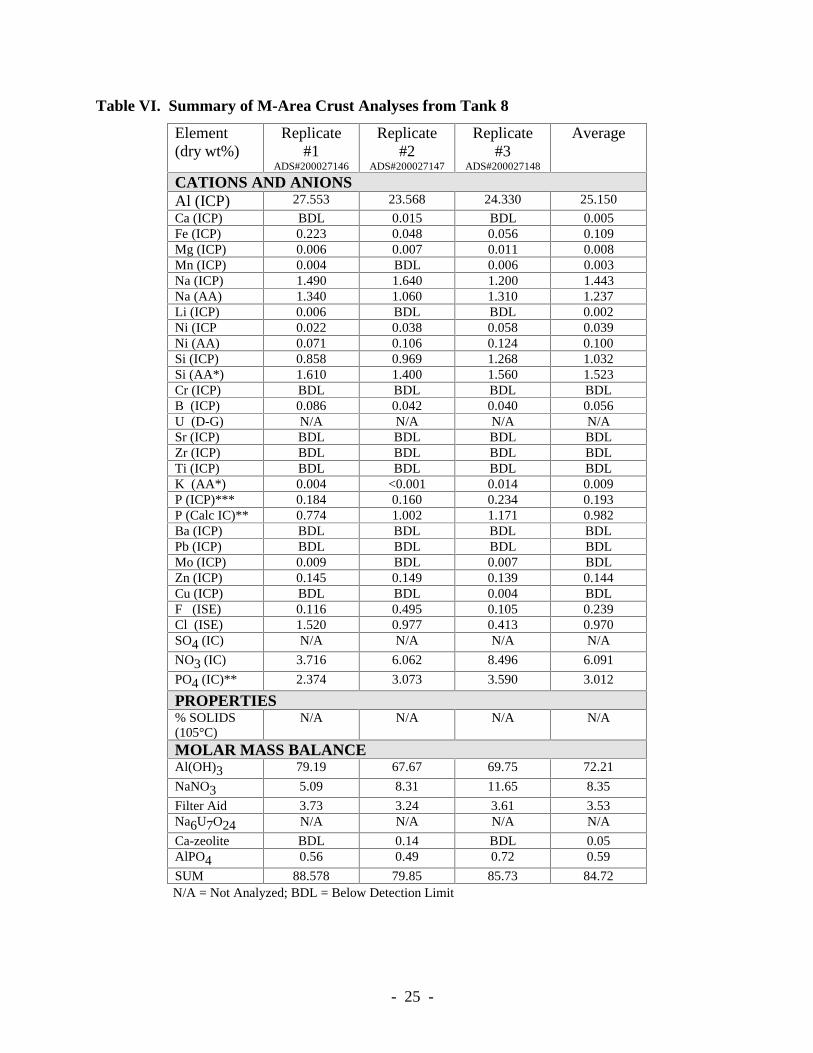
Table VI. Summary of M-Area Crust Analyses from Tank 8 25
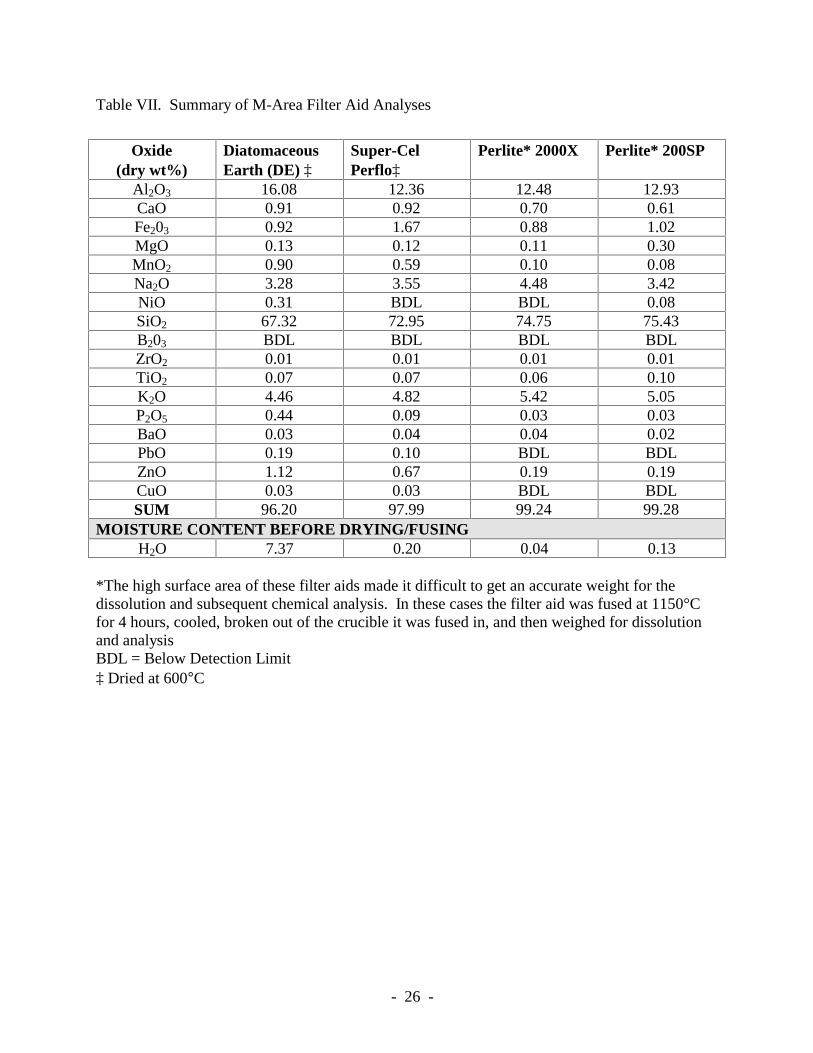
Table VII. Summary of M-Area Filter Aid Analyses 26
Table VIII. X-Ray Diffraction Phase Identification and Relative Concentrations of theSpecies in M-Area Sludge and Spent Filter Aid 28
Table IX. Example of Mass Balance Calculation for M-Area Sludge (Tank 1) 32
Table X. Measured wt% Solids and Specific Gravity of M-Area Tank Wastes 34
Table XI. M-Area Calculated Composite Sludge/Residual Supernate Composition.† 35
- 9 -
VITRIFICATION OF M-AREA MIXED (HAZARDOUS ANDRADIOACTIVE) F006 WASTES: I. SLUDGE AND SUPERNATE
CHARACTERIZATION
C.M. Jantzen and J.B. PickettSavannah River Technology Center
Westinghouse Savannah River CompanyAiken, SC 29803
INTRODUCTION
Technologies are being developed by the US Department of Energy’s (DOE) NuclearFacility sites to convert low-level and mixed (hazardous and radioactive) wastes to a solidstabilized waste form for permanent disposal. One of the alternative technologies isvitrification into a borosilicate glass waste form. The Environmental Protection Agency(EPA) has declared vitrification the Best Demonstrated Available Technology (BDAT) forhigh-level radioactive mixed waste1 and produced a Handbook of VitrificationTechnologies for Treatment of Hazardous and Radioactive Waste.2 The DOE Office ofTechnology Development (OTD) has taken the position that mixed waste needs to bestabilized to the highest level reasonably possible to ensure that the resulting waste formswill meet both current and future regulatory specifications. Stabilization of low level andhazardous wastes in glass are in accord with the 1988 Savannah River Technology Center(SRTC), then the Savannah River Laboratory (SRL), Professional Planning Committee(PPC) recommendation3 that high nitrate containing (low-level) wastes be incorporatedinto a low temperature glass (via a sol-gel technology). The investigation into this newtechnology was considered timely because of the potential for large waste volumereduction compared to solidification into cement.
Vitrification produces durable waste forms at volume reductions up to 97%.4 Large reductions involume minimize long-term storage costs, making vitrification a cost effective technology on alife cycle basis.5 The US DOE Savannah River Site (SRS), which is operated by WestinghouseSavannah River Company (WSRC), investigated vitrification for disposal of various low-leveland mixed wastes.4,6 The first /mixed wastes vitrified in laboratory studies at SRS were the M-Area nickel plating line wastes reported in this study.
The M-Area operations at the SRS in Aiken, South Carolina, produced reactor components fornuclear weapons materials for the U.S. Department of Energy. The mixed waste resulting fromthese operations was a listed Resource Conservation and Recovery Act (RCRA) F006 waste‡
which was stored in the M-Area Process Waste Interim Treatment/Storage Facility (PWIT/SF).The total volume in storage was initially ~1,200,000 gallons of which ~33% was a gelatinoushydroxide sludge containing high concentrations of aluminum, sodium, uranium, and nitrate plusthe RCRA metal of concern, nickel. It had been demonstrated7,8 that a volume reduction of 65-70% of the M-Area stored waste could be achieved by wastewater treatment of the supernate,with the resulting effluent released via a permitted National Pollution Discharge Elimination ‡ a wastewater treatment sludge from electroplating operations
- 10 -
System (NPDES) outfall. About 275,000 gallons of spent SiO2 rich filter aids (perlite/perflo)were generated from the supernate treatment.
In January l989 South Carolina Department of Health and Environmental Control (SCDHEC)approved a construction permit for the DETF Supernate Transfer Facility. In May 1990 theDETF received a permit to operate the DETF. This allowed the DETF to be used to treat thesupernate from the M-Area Interim Treatment/Storage Facility (IT/SF) tanks. There were six35,000 gallon tanks (Tanks 1-6) and three 500,000 gallon tanks (Tanks 7, 8, 10). Tank 10 wasfilled with the spent filter aid. Treatment of the supernate from Tank 8 was completed inNovember 1992. Treatment of the supernate from Tank 7 was completed in October 1993.Treatment of the supernate in Tanks 1 through Tank 6 was completed in June 1994. The sludgefrom Tanks 1-8 and spent filter aid from Tank 10 were mixed together prior to final stabilization(Figure 1).
Comparisons of the waste volume reduction achieved by vitrification compared to alternativestabilization strategies in cement (Table I and Figure 1) shows that vitrification of M-Areacomposite waste (Option 3) reduces the stabilized volume by 96% relative to the base casecement stabilization. Volume reductions on the order of ~86% can be achieved by mixingportland cement with the homogenized waste, followed by pressure filtration and rinsing. Thislow volume cementation process has been designated FIST for FIltration and STabilization(Option 2).7,8
BACKGROUND
The Liquid Effluent Treatment Facility (LETF) was constructed in 1985 to process M-Areachemical wastes due to the federally mandated closure of the M-Area seepage basin. The LETFconsisted of three facilities: the Dilute Effluent Treatment Facility (DETF), the ChemicalTransfer Facility (CTF), and the Interim Treatment/Storage Facility (IT/SF). The DETFprocessed dilute wastewaters from the M-Area processes and released the clarified liquid toTim’s Branch.9 The DETF was a conventional water treatment facility which used precipitation,flocculation, and filtration to remove dissolved metals. These solids were transferred through theChemical Transfer Facility (CTF) to the IT/SF.
In May 1990 South Carolina Department of Health and Environmental Control (SCDHEC)approved a permit to operate the DETF-IST Supernate Transfer Facility.9 The permit allowed theDETF to be used to treat the supernate from the M-Area Interim Treatment/Storage Facility(IT/SF) tanks. When the DETF-IST Supernate Transfer Facility concept for treatment of M-Area’s supernate and subsequent discharge to Tim’s branch was initiated, M-Area’s wastesolidification strategy was altered from solidification of sludge plus supernate to solidification ofonly the sludge and spent filter aid. Supernate treatment was completed in 1994. The currenttank inventory of sludge in gallons is shown in Table II. Note that minor residual supernatevolumes are associated with the sludge residues in each tank (Table II).
- 11 -
Supernate
Sludge
Spent filter aid(275,000 gal.)Sludge(425,000 gal.)
Sludge + Supernate = 2,400,000 gallonsof cement
DirectCementation
Waste waterTreatment of
Supernate
Vitrification
Sludge +spent filter
aid = 92,000gallons of
glass
Figure 1. Schematic of the M-Area mixed waste solidification process. Large volumereductions can be achieved by combining wastewater treatment with vitrificationinstead of stabilization of sludge plus supernate in cement, e.g. 92,000 gallons ofglass equals ~1673 drums (55-gallon size) while 2,400,000 gallons of cement makes43,636 drums. This is a ratio of 1 drum of glass to every 26 drums of cement.
- 12 -
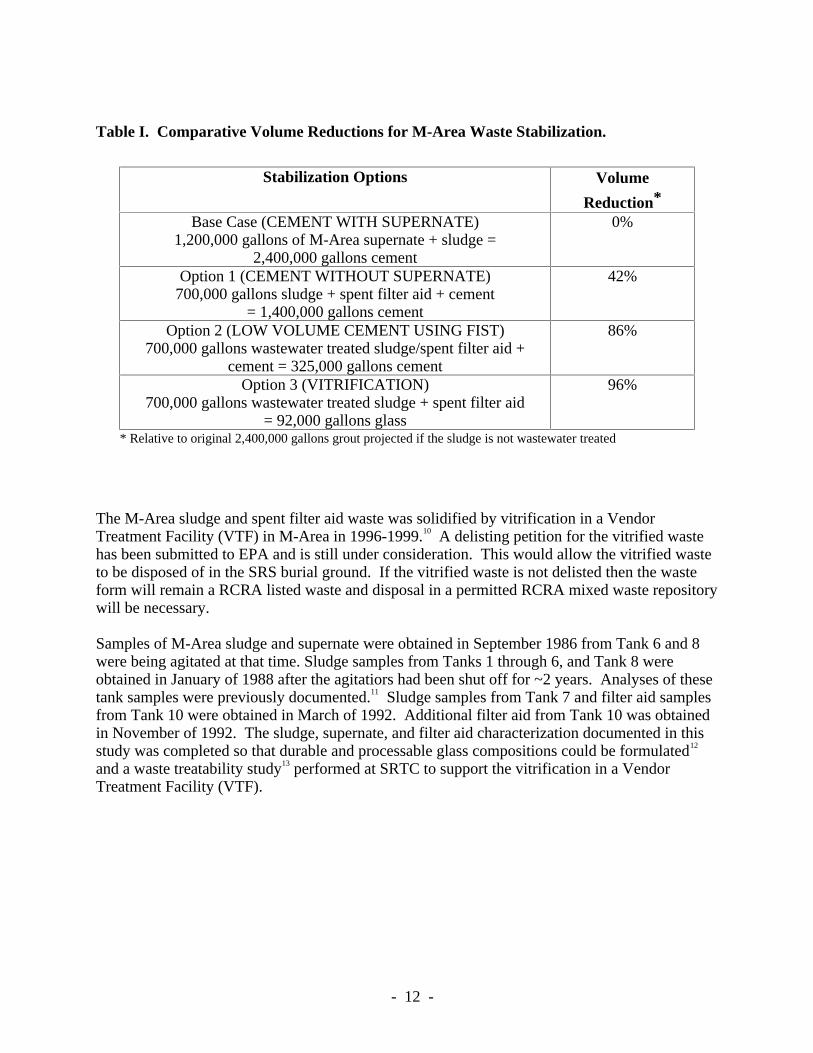
Table I. Comparative Volume Reductions for M-Area Waste Stabilization.
Stabilization Options Volume
Reduction*
Base Case (CEMENT WITH SUPERNATE)1,200,000 gallons of M-Area supernate + sludge =
2,400,000 gallons cement
0%
Option 1 (CEMENT WITHOUT SUPERNATE)700,000 gallons sludge + spent filter aid + cement
= 1,400,000 gallons cement
42%
Option 2 (LOW VOLUME CEMENT USING FIST)700,000 gallons wastewater treated sludge/spent filter aid +
cement = 325,000 gallons cement
86%
Option 3 (VITRIFICATION)700,000 gallons wastewater treated sludge + spent filter aid
= 92,000 gallons glass
96%
* Relative to original 2,400,000 gallons grout projected if the sludge is not wastewater treated
The M-Area sludge and spent filter aid waste was solidified by vitrification in a VendorTreatment Facility (VTF) in M-Area in 1996-1999.10 A delisting petition for the vitrified wastehas been submitted to EPA and is still under consideration. This would allow the vitrified wasteto be disposed of in the SRS burial ground. If the vitrified waste is not delisted then the wasteform will remain a RCRA listed waste and disposal in a permitted RCRA mixed waste repositorywill be necessary.
Samples of M-Area sludge and supernate were obtained in September 1986 from Tank 6 and 8were being agitated at that time. Sludge samples from Tanks 1 through 6, and Tank 8 wereobtained in January of 1988 after the agitatiors had been shut off for ~2 years. Analyses of thesetank samples were previously documented.11 Sludge samples from Tank 7 and filter aid samplesfrom Tank 10 were obtained in March of 1992. Additional filter aid from Tank 10 was obtainedin November of 1992. The sludge, supernate, and filter aid characterization documented in thisstudy was completed so that durable and processable glass compositions could be formulated12
and a waste treatability study13 performed at SRTC to support the vitrification in a VendorTreatment Facility (VTF).
- 13 -
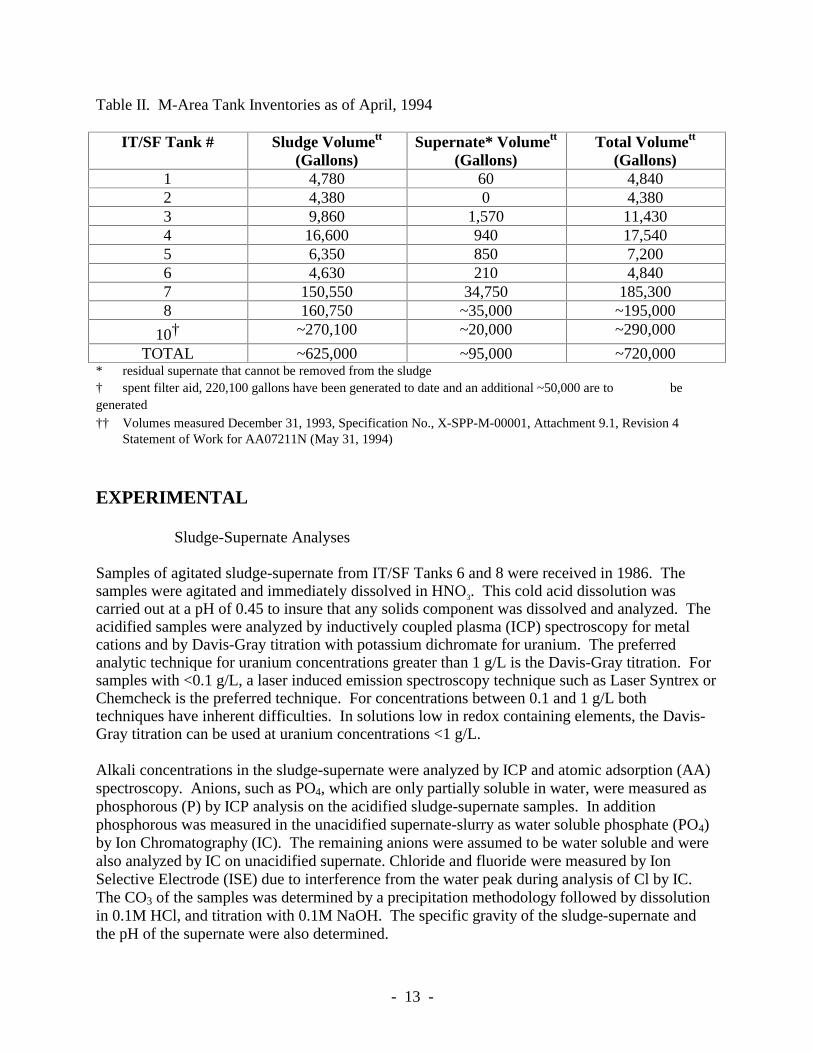
Table II. M-Area Tank Inventories as of April, 1994
IT/SF Tank # Sludge Volumett
(Gallons)Supernate* Volumett
(Gallons)Total Volumett
(Gallons)1 4,780 60 4,8402 4,380 0 4,3803 9,860 1,570 11,4304 16,600 940 17,5405 6,350 850 7,2006 4,630 210 4,8407 150,550 34,750 185,3008 160,750 ~35,000 ~195,000
10† ~270,100 ~20,000 ~290,000
TOTAL ~625,000 ~95,000 ~720,000* residual supernate that cannot be removed from the sludge† spent filter aid, 220,100 gallons have been generated to date and an additional ~50,000 are to begenerated†† Volumes measured December 31, 1993, Specification No., X-SPP-M-00001, Attachment 9.1, Revision 4
Statement of Work for AA07211N (May 31, 1994)
EXPERIMENTAL
Sludge-Supernate Analyses
Samples of agitated sludge-supernate from IT/SF Tanks 6 and 8 were received in 1986. Thesamples were agitated and immediately dissolved in HNO3. This cold acid dissolution wascarried out at a pH of 0.45 to insure that any solids component was dissolved and analyzed. Theacidified samples were analyzed by inductively coupled plasma (ICP) spectroscopy for metalcations and by Davis-Gray titration with potassium dichromate for uranium. The preferredanalytic technique for uranium concentrations greater than 1 g/L is the Davis-Gray titration. Forsamples with <0.1 g/L, a laser induced emission spectroscopy technique such as Laser Syntrex orChemcheck is the preferred technique. For concentrations between 0.1 and 1 g/L bothtechniques have inherent difficulties. In solutions low in redox containing elements, the Davis-Gray titration can be used at uranium concentrations <1 g/L.
Alkali concentrations in the sludge-supernate were analyzed by ICP and atomic adsorption (AA)spectroscopy. Anions, such as PO4, which are only partially soluble in water, were measured asphosphorous (P) by ICP analysis on the acidified sludge-supernate samples. In additionphosphorous was measured in the unacidified supernate-slurry as water soluble phosphate (PO4)by Ion Chromatography (IC). The remaining anions were assumed to be water soluble and werealso analyzed by IC on unacidified supernate. Chloride and fluoride were measured by IonSelective Electrode (ISE) due to interference from the water peak during analysis of Cl by IC.The CO3 of the samples was determined by a precipitation methodology followed by dissolutionin 0.1M HCl, and titration with 0.1M NaOH. The specific gravity of the sludge-supernate andthe pH of the supernate were also determined.
- 14 -
Sludge Analyses (Tanks 1-6 and Tank 8)
Sludge samples from IT/SF Tanks 1-6 and Tank 8 were obtained in January l988. The supernatewas decanted off each sample. The wt% solids were obtained in duplicate from samples dried at105°C. Additional samples were dried overnight at 90°C to obtain x-ray diffraction (XRD)analyses of the crystalline species. Drying at 90°C evaporates adsorbed water but does notevaporate water of crystallization of hydrated species. In cases where precursor, poorlycrystallized phases were observed in the XRD spectra, the samples were sequentially heated at300°C and 600°C to crystallize the poorly formed phase(s) and aid in phase identification andmass balance calculations.
The sludge was dried at ~300°C to remove both residual hydroxide species and waters ofhydration. Dried sludge compositions were determined in duplicate in March, 1988 and induplicate in November 1988 because the Ni and K analyses had been omitted from the Marchanalyses. Moreover, the HCl/HF dissolution had been used to determine Si by AA in March andthis number was biased higher than the ICP analysis for Si. This bias was attributed to the HFdissolving Si from the glass bead in the nebulizer of the AA. Silica was redetermined by AAfrom the Na2O2 dissolution in November l988.
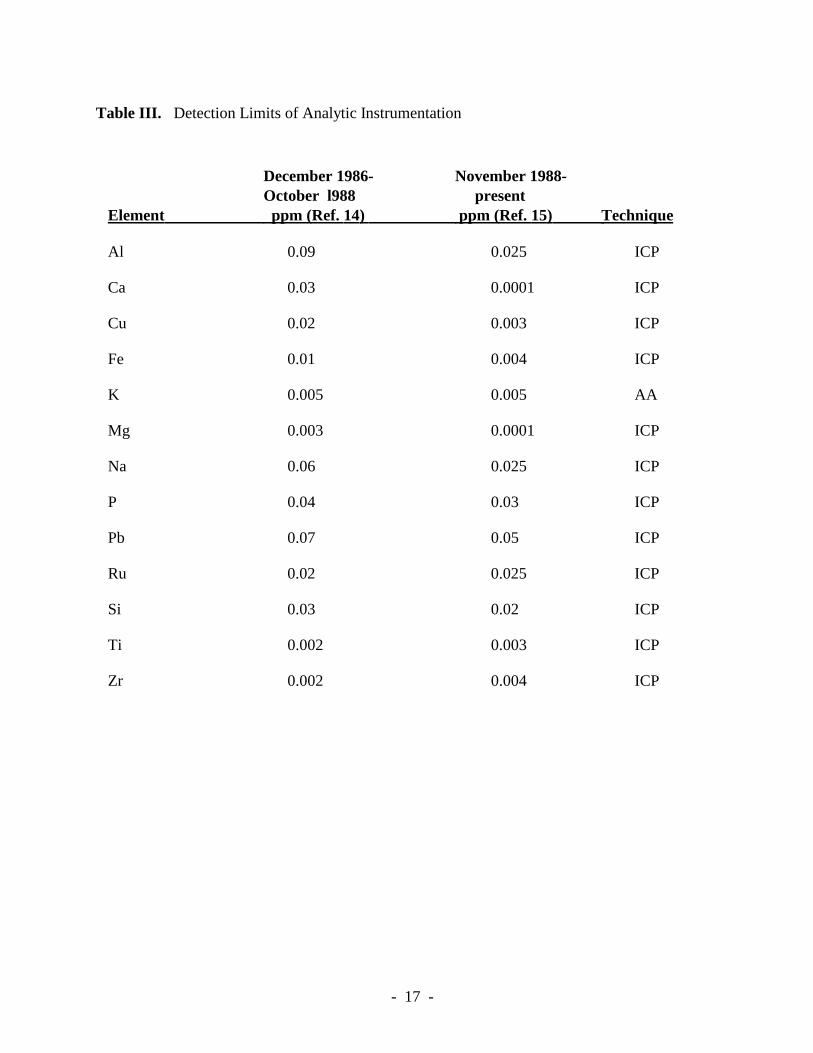
Different ICP instruments were used for the March l988 and November l988 analyses. Thedetection limits for each of these instruments is listed in Table III . The major elements (K, Na,Ca, Mg, Si, Al, and Fe) are accurate to within ±10% at concentrations >1 ppm. Within a factorof two of the detection limits listed (Table III), the precision of any element is only ±100%.
The dried sludge was completely analyzed by the following techniques:
• Dissolution by Na2O2 with an HCl uptake- ICP for Al, Ca, Fe, Mg, Mn, Li, Si, Cr, B, Sr, Ti, P, Ba, Pb, Mo, Zn, Cu (March and November l988)- AA for Si (November 1988)
• Dissolution by HCl/HF bomb- ICP for Na, Ni, Zr (November l988)- AA for Ni due to Ni interferences on ICP in the presence of U (November, 1988)- AA for Na (March and November 1988)- AA for K (November l988)- AA for Si (March 1988)
• Uranium by Davis-Gray titration (March 1988)
• Dissolution by Na2O2 with a H2O uptake- IC for SO4, NO3, PO4 (March 1988)
- ISE for Cl and F (March 1988)
- 15 -
Sludge Crust (Tank 8)
A layer of white crystalline material was found to have formed on the surface of the sludge inTank 8. This layer separated the sludge from the supernate and was thought to have precipitatedfrom the supernate. The same crust was identified in most of the M-Area tanks but only onesample was analyzed. The crust varied from 9.51 to 12.7 mm (3/8 to ½ inch). A small slab ofcrust from Tank 8 was received for analysis in early 1989. The sample was chemically analyzedin triplicate using the same techniques as used for the sludge analyses for Tank 8. The samplephases were also identified by XRD and the sample was examined by Scanning ElectronMicroscopy (SEM).
Sludge and Spent Filter Aid Analyses (Tank 7 and Tank 10)
Sludge samples from IT/SF Tank 7 and Tank 10 were obtained in March 1992. A second largersample of Tank 10 was obtained in November 1992 that was more representative of the contentsof Tank 10. For each tank the wt% solids were obtained in duplicate from samples dried at105°C. Tank 7 and 10 samples were dried overnight at 90°C to obtain x-ray diffraction (XRD)analyses of the crystalline species without driving off any hydroxide species. In cases wherebroad poorly crystallized diffraction peaks were observed in the XRD spectra, the samples wereheat treated at 600°C to crystallize the poorly formed phase(s) and aid in phase identification.
The chemical analyses of the sludge compositions were determined in duplicate. The sludge wasdried at ~300°C to remove residual hydroxide species and completely analyzed for the remainingcations and ions by the following techniques:
• Dissolution by Na2O2 with an HCl uptake- ICP for Al, Ca, Fe, Mg, Mn, Li, Si, Cr, B, Sr, Ti, P, Ba, Pb, Mo, Zn, Cu - AA for Si
• Dissolution by HCl/HF bomb- ICP for Na, Ni, Zr- AA for Ni, Na, K, Si
• Uranium by ChemCheck
• Dissolution by Na2O2 with a H2O uptake- IC for SO4, NO3, PO4
- ISE for Cl and F
- 16 -
Virgin Filter Aid Analyses
Perflo, perlite, and diatomaceous earth are high silica containing additives used in M-Areaprocessing. Samples of these additives, which are oxide based, were analyzed only for cations inNovember 1988. Additional perlite and perflo were analyzed in February, 1993. The followingtechniques were used:
• H2O content by drying at 600°C overnight
• Dissolution by Na2O2 with an HCl uptake- ICP for Al, Ca, Fe, Mg, Mn, Li, Si, Cr, B, Sr, Ti, P, Ba, Pb, Mo, Zn, Cu
• Dissolution by HCl/HF bomb- ICP for Na, Ni, Zr- AA for Ni, Na, K
XRD analyses were also performed on perflo and diatomaceous earth both before and afterchemical treatment with NaOH in order to determine if chemical alteration of these additives wasoccurring due to the high pH environment in the IT/SF storage tanks. The filter aids wereanalyzed by XRD before chemical treatment. The filter aids were then treated with 6M NaOHsolution for 29 hours, filtered, dried at 80°C overnight, dried an additional 1.5 hours at 200°C,and the XRD analysis repeated.
QUALITY ASSURANCE
All analyses were conducted at Savannah River Technology Center (SRTC) in accordance withDOE/RW-0214 and ASME NQA-1 based quality assurance program in use at the time the workwas performed. The analytic results are recorded in laboratory notebooks DPSTN-4475,DPSTN-4725, and DPSTN-4695. The data and calculations from this report were used in theVendor Design Specification Number X-SPP-M-0001, Revision 5. For this reason all of thecalculations were verified by Glenn Diener and documented in calculation package Q-CLC-M-94012 on May 31, 1994 and accepted by John B. Pickett on June 11, 1994.
- 17 -
Table III. Detection Limits of Analytic Instrumentation
December 1986- November 1988-October l988 present
Element ppm (Ref. 14) ppm (Ref. 15) Technique
Al 0.09 0.025 ICP
Ca 0.03 0.0001 ICP
Cu 0.02 0.003 ICP
Fe 0.01 0.004 ICP
K 0.005 0.005 AA
Mg 0.003 0.0001 ICP
Na 0.06 0.025 ICP
P 0.04 0.03 ICP
Pb 0.07 0.05 ICP
Ru 0.02 0.025 ICP
Si 0.03 0.02 ICP
Ti 0.002 0.003 ICP
Zr 0.002 0.004 ICP
- 18 -
RESULTS AND DISCUSSION
Chemical Analysis of the Sludge-Supernate
Samples of agitated sludge-supernate slurry from IT/SF Tanks 6 and 8 were dissolved in HNO3
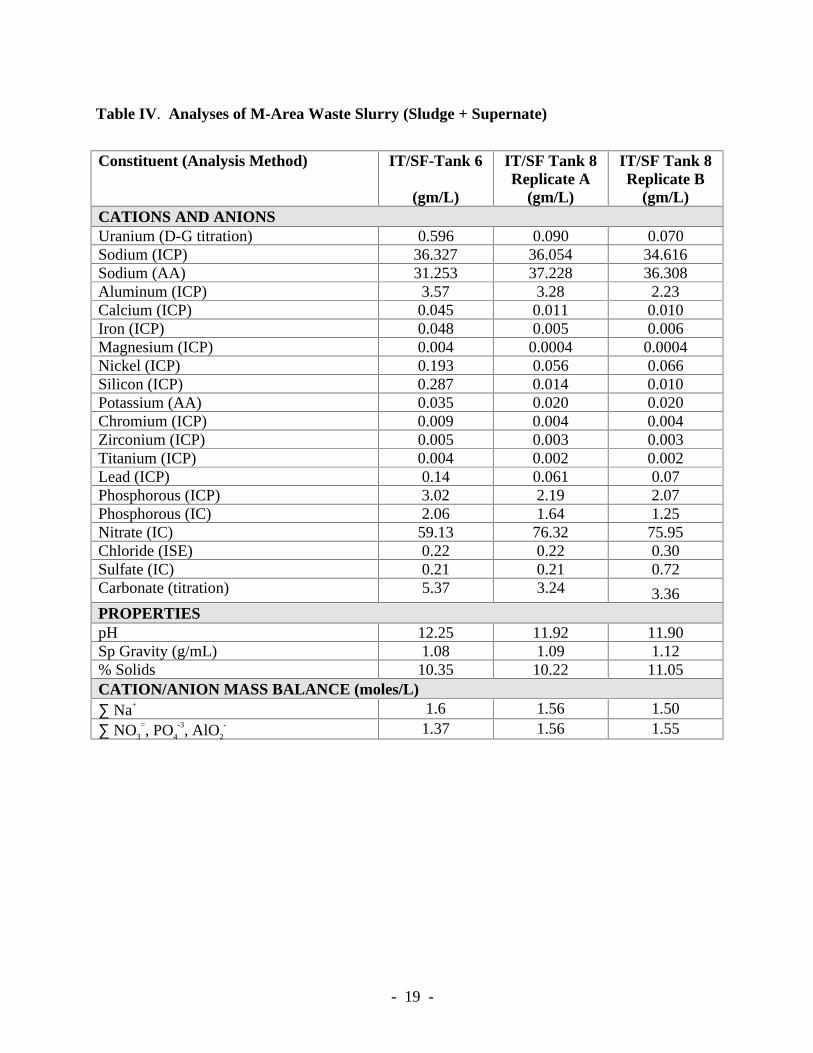
as described previously and analyzed. The pH of the slurry varied from 11.90-12.25 (Table IV).The specific gravity was ~1.10 g/mL while the wt% solids varied from 10.22 to 11.05. Thesludge-supernate slurry contains high concentrations of sodium, nitrate, phosphate andaluminum (Table IV).
The cation analyses by ICP are given in Table IV. Sodium analyzed by ICP and AA gavecomparable results (Table IV). Uranium analyses were determined by Davis-Gray titration eventhough the concentrations were <1 g/L because significant quantities of other redox species werenot present in the slurry (Table IV). The uranium concentrations were low enough not to causespectral interferences. This allowed Ni, Pb, and Zn to be determined by ICP analysis.
Acid soluble PO4, was analyzed as P by ICP on the acidified sludge-supernate samples. Watersoluble PO4 was measured by IC and is lower than the acid soluble PO4 values listed in Table IV.This implies that water soluble PO4 is a major constituent of the supernate and that a PO4
containing solid is a major constituent of the sludge portion of the slurry. The remaining watersoluble anions were analyzed by IC while the CO3 of the samples was analyzed by aprecipitation-titration technique.
From the analyses in Table IV, the major elements in the slurry are Na, Al, NO3, and PO4. At pHvalues >11 the stable Al species is AlO2
- and at pH values >12 the major P species is PO4.16 The
major aqueous species in the supernate-sludge at pH values of ~12 are NaNO3, NaAlO2, andNa3PO4. A molar anion-cation mass balance based on this speciation is shown at the bottom ofTable IV. The mass balance shows excellent agreement and consistency in the analysesperformed.
Chemical Analysis of Sludge and Spent Filter Aids
The chemical analysis of the M-Area sludge (Tanks 1 through 6 and 8) was initially determinedin duplicate in March 1988 and a second set of duplicate analyses performed in November 1988.Chemical analysis of sludge from Tank 7 and spent filter aid from Tank 10 was performed inMay 1992. The Tank 10 chemical analysis was repeated on a more representative sample in July1993. The data is summarized in Table V and the replicate analyses for each tank are given inAppendix I. Different ICP units were used for the March l988 and November l988 analyses andthis accounts for some of the variation in detection limits and some of the large standarddeviations (Appendix I).
- 19 -
Table IV. Analyses of M-Area Waste Slurry (Sludge + Supernate)
Constituent (Analysis Method) IT/SF-Tank 6
(gm/L)
IT/SF Tank 8Replicate A
(gm/L)
IT/SF Tank 8Replicate B
(gm/L)CATIONS AND ANIONSUranium (D-G titration) 0.596 0.090 0.070Sodium (ICP) 36.327 36.054 34.616Sodium (AA) 31.253 37.228 36.308Aluminum (ICP) 3.57 3.28 2.23Calcium (ICP) 0.045 0.011 0.010Iron (ICP) 0.048 0.005 0.006Magnesium (ICP) 0.004 0.0004 0.0004Nickel (ICP) 0.193 0.056 0.066Silicon (ICP) 0.287 0.014 0.010Potassium (AA) 0.035 0.020 0.020Chromium (ICP) 0.009 0.004 0.004Zirconium (ICP) 0.005 0.003 0.003Titanium (ICP) 0.004 0.002 0.002Lead (ICP) 0.14 0.061 0.07Phosphorous (ICP) 3.02 2.19 2.07Phosphorous (IC) 2.06 1.64 1.25Nitrate (IC) 59.13 76.32 75.95Chloride (ISE) 0.22 0.22 0.30Sulfate (IC) 0.21 0.21 0.72Carbonate (titration) 5.37 3.24 3.36PROPERTIESpH 12.25 11.92 11.90Sp Gravity (g/mL) 1.08 1.09 1.12% Solids 10.35 10.22 11.05CATION/ANION MASS BALANCE (moles/L)∑ Na+ 1.6 1.56 1.50∑ NO3
=, PO4
-3, AlO2
- 1.37 1.56 1.55
- 20 -
All wt% sludge solids were measured at 105°C. All the sludge samples for analysis were driedat 300°C prior to dissolution. Sodium was analyzed by AA in all the HCl/HF dissolutions andby ICP only in the HCl/HF dissolutions performed after November 1988. The agreementbetween the various analyses for Na is excellent (Table V and Appendix I). Nickel wasdetermined by both ICP and AA in all analyses after November l988. Nickel by ICP is difficultdue to interferences in the presence of uranium and AA is the preferred technique for analysis ofNi in the presence of uranium. To ensure that Ni determined by AA did not exhibit anenhancement in the presence of uranium (Table V and Appendix I), the uranium was precipitatedout of one series of samples and the Ni analyses repeated. The Ni analyses determined by AA inthe presence and absence of uranium were the same. Zinc and lead analyses by ICP can also beaffected by the presence of uranium but no alternate technique is available for theirdetermination.
Silicon was analyzed by ICP and by AA in all the analyses. In the March 1988 analyses thesilicon concentration had been measured from the HCl/HF dissolution. This number was biasedhigher than the ICP analyses for Si or the AA analyses for Si from the Na2O2 dissolution(analyses after November, l988). This bias was attributed to the HF dissolving Si from the glassbead in the nebulizer of the AA. The results for the average silicon concentration determined byAA is therefore, only the average of the duplicate November analyses. Correspondingly, the AAresults for Si in Appendix I are shown as italics and are not included in the average dry wt%sludge analyses. Although ICP is the preferred technique for analysis of Si, the ICP results for Sihave higher standard deviations (Appendix I) than the AA results. The November 1988 AAresults for Si are considered more accurate and used preferentially in this study.
Phosphorous was measured as P by ICP for sludges dissolved in Na2O2 with an HCl uptake.Phosphorous was measured as PO4 by ICP for sludges dissolved in Na2O2 with an H2O uptake.The observed differences in wt % P shown in Table IV and Appendix I is attributed todifferences in the acid soluble and water soluble concentrations of P. Note that the acid soluble Pis always greater than the water soluble P.
Tank 10 spent filter aid wt% solids were determined at 105°C. Additional sample was dried at300°C and the same dissolution procedures that were used on the dried sludge were used on thedried spent filter aid. Both the May 1992 and the July 1993 analyses are given in Table V. Thedetails are given in Appendix I.
Uranium was analyzed by David-Gray titration for the sludges in Tanks 1-6 and 8. Uranium wasanalyzed by laser emission spectroscopy (Chemcheck) for Tanks 7 and 10 (Table V).
Chemical Analysis of Sludge Crust
The sludge crust from Tank 8 was analyzed in triplicate using the same procedures used for thesludge analyses from Tank 8. The results are reported in Table VI which shows that the crust isprimarily Al enriched. Note that U was not analyzed by dissolution and ICP but U was identifiedas a component of the crust by the Energy Dispersive Spectroscopy (EDS) during the ScanningElectron Microscopy (SEM) analysis. The U was primarily attached to the sludge side of thecrust. X-ray analysis indicated that Al(OH)3 was the primary crystalline phase and this is
- 21 -
confirmed by the mass balance calculations in Table VI. The mass balance calculations do notsum to 100±5 wt% since all of the elements and the amount of moisture in the sample were notdetermined before chemical analysis.
Chemical Analysis of Virgin Filter Aid
The virgin filter aids used in wastewater treatment of the M-Area supernate were primarily perfloand diatomaceous earth. These two filter aids were chemically analyzed in March, 1988. Twoother filter aids used subsequently, perlite 2000X and Renissance perlite (200 SP), were analyzedin February 1993. The diatomaceous earth and perflo filter aids were dried at 600°C overnight todetermine their water content. The higher surface area perlites were more problematic, e.g. aconstant weight for dissolution and subsequent chemical analysis was difficult to obtain. Hence,the perlites were fused at 1150°C for 4 hours before chemical analysis. Therefore, the perlitewt% moisture represents this higher temperature. The same dissolution procedures that wereused on the M-Area sludge were used on the perflo, perlite and diatomaceous earth. Anions werenot analyzed because these materials are oxide based and oxygen is the only anion present inthese solids. A good analysis of an oxide bearing material should sum to 100±5 wt% on an oxidebasis.17
Table VII compares the analyses of perflo, diatomaceous earth, and perlite in terms of oxidewt%. The elemental analyses and the conversions to oxide wt% are given in Appendix II. Theoxide wt% sums in Table VII are within 100±5 wt% for all of these species. Since these speciesdo not contain uranium and have not been in contact with M-Area wastes, the presence of Zn, Pb,and Ni is considered significant because some of the trace elements observed in the sludgeanalyses are originating from the processing additives. The diatomaceous earth was the leastpure of all the filter aids used in processing.
IDENTIFICATION OF PHASE CONSTITUENTS IN M-AREA SLUDGEAND CRUST
X-ray diffraction was performed on sludge samples that had been dried at 90°C for 12 hours.The crystalline sludge species in the eight tanks included varying amounts of NaNO3, Al(OH)3
(both gibbsite and bayerite polymorphs), Na12Al 12Si12O48•27H2O or the Ca substituted formCa6Al 12Si12O48•30H2O (Linde Zeolite-A), and poorly crystallized Na6U7O24 (partially converted insome tanks to Na2U2O7), and AlPO4. The Tank 10 spent filter aid was primarily amorphous butcontained NaNO3, Zeolite-A, and a trace of AlPO4. The relative amounts of each phases in eachtank was estimated by the relative peak heights of each species in the x-ray diffraction pattern.The results of the peak height analysis are given in
- 22 -
Table VIII. Four designations are used, major for species present in the greatest quantity, tracefor species present in the smallest quantities, present for species present in average concentration,and none for species not identified by XRD.
The identification of the sodium uranate species was difficult because it was poorly crystallized,e.g. the x-ray diffraction reflections for this phase were very broad instead of being sharplydefined (see Figure 2). Positive identification of the poorly crystallized uranium phase was madeby sequential heat treatment to higher and higher temperatures. After each heat treatment thedried sludge was analyzed by XRD again. Sludge from Tank 1 was heat treated at 300°C for 3hours. The XRD indicated that the uranium phase was still poorly crystallized (), e.g. the uranate diffraction peaks are still broad and poorly defined. A subsequent heattreatment at 600°C overnight was performed which crystallized the Na6U7O24 to Na2U2O7 (). This transformation has been reported previously in the literature18 and was used to confirmthe presence of the Na2U2O7 precursor phase, Na6U7O24. Similar results were obtained on Tank 7samples heat treated to 600°C overnight. Note that the NaNO3 “disappears” from the highertemperature spectra shown in Figure 3 as the nitrate in the NaNO3 vaporizes at thesetemperatures.
- 23 -
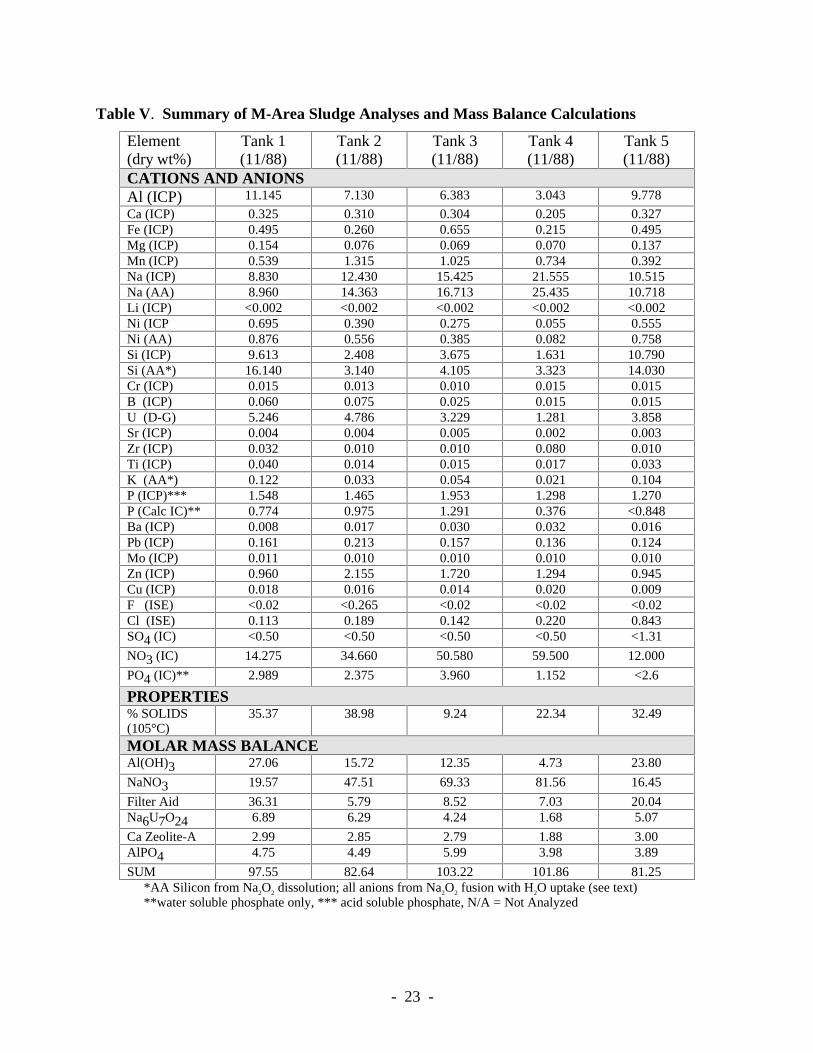
Table V. Summary of M-Area Sludge Analyses and Mass Balance Calculations
Element(dry wt%)
Tank 1(11/88)
Tank 2(11/88)
Tank 3(11/88)
Tank 4(11/88)
Tank 5(11/88)
CATIONS AND ANIONSAl (ICP) 11.145 7.130 6.383 3.043 9.778
Ca (ICP) 0.325 0.310 0.304 0.205 0.327Fe (ICP) 0.495 0.260 0.655 0.215 0.495Mg (ICP) 0.154 0.076 0.069 0.070 0.137Mn (ICP) 0.539 1.315 1.025 0.734 0.392Na (ICP) 8.830 12.430 15.425 21.555 10.515Na (AA) 8.960 14.363 16.713 25.435 10.718Li (ICP) <0.002 <0.002 <0.002 <0.002 <0.002Ni (ICP 0.695 0.390 0.275 0.055 0.555Ni (AA) 0.876 0.556 0.385 0.082 0.758Si (ICP) 9.613 2.408 3.675 1.631 10.790Si (AA*) 16.140 3.140 4.105 3.323 14.030Cr (ICP) 0.015 0.013 0.010 0.015 0.015B (ICP) 0.060 0.075 0.025 0.015 0.015U (D-G) 5.246 4.786 3.229 1.281 3.858Sr (ICP) 0.004 0.004 0.005 0.002 0.003Zr (ICP) 0.032 0.010 0.010 0.080 0.010Ti (ICP) 0.040 0.014 0.015 0.017 0.033K (AA*) 0.122 0.033 0.054 0.021 0.104P (ICP)*** 1.548 1.465 1.953 1.298 1.270P (Calc IC)** 0.774 0.975 1.291 0.376 <0.848Ba (ICP) 0.008 0.017 0.030 0.032 0.016Pb (ICP) 0.161 0.213 0.157 0.136 0.124Mo (ICP) 0.011 0.010 0.010 0.010 0.010Zn (ICP) 0.960 2.155 1.720 1.294 0.945Cu (ICP) 0.018 0.016 0.014 0.020 0.009F (ISE) <0.02 <0.265 <0.02 <0.02 <0.02Cl (ISE) 0.113 0.189 0.142 0.220 0.843SO4 (IC) <0.50 <0.50 <0.50 <0.50 <1.31
NO3 (IC) 14.275 34.660 50.580 59.500 12.000
PO4 (IC)** 2.989 2.375 3.960 1.152 <2.6
PROPERTIES% SOLIDS(105°C)
35.37 38.98 9.24 22.34 32.49
MOLAR MASS BALANCEAl(OH)3 27.06 15.72 12.35 4.73 23.80
NaNO3 19.57 47.51 69.33 81.56 16.45
Filter Aid 36.31 5.79 8.52 7.03 20.04Na6U7O24 6.89 6.29 4.24 1.68 5.07
Ca Zeolite-A 2.99 2.85 2.79 1.88 3.00AlPO4 4.75 4.49 5.99 3.98 3.89
SUM 97.55 82.64 103.22 101.86 81.25*AA Silicon from Na2O2 dissolution; all anions from Na2O2 fusion with H2O uptake (see text)**water soluble phosphate only, *** acid soluble phosphate, N/A = Not Analyzed
- 24 -
Table V. Summary of M-Area Sludge Analyses and Mass Balance Calculations
Element(dry wt%)
Tank 6(11/88)
Tank 7(5/92)
Tank 8Average(11/88)
Tank 10(5/92)
Tank 10(7/93)
CATIONS AND ANIONSAl (ICP) 10.013 6.392 10.734 8.896 9.642
Ca (ICP) 0.497 0.420 0.307 0.351 0.425Fe (ICP) 0.740 0.529 0.402 0.870 1.046Mg (ICP) 0.188 0.125 0.122 0.122 0.122Mn (ICP) 1.535 0.005 0.422 0.035 0.049Na (ICP) 9.670 12.292 7.010 7.196 5.132Na (AA) 10.228 13.430 7.056 7.433 5.233Li (ICP) <0.002 <0.001 <0.002 <0.001 <0.001Ni (ICP 0.425 1.871 0.728 0.064 0.081Ni (AA) 0.601 1.985 0.990 <0.06 <0.06Si (ICP) 12.310 15.869 11.301 24.785 25.144Si (AA*) 18.000 17.985 14.715 27.445 24.845Cr (ICP) 0.020 <0.004 0.017 <0.004 <0.004B (ICP) 0.010 0.037 0.010 <0.004 <0.004U (D-G,chemcheck†)
4.080 3.005† 5.133 0.045† 0.222†
Sr (ICP) 0.006 N/A 0.006 N/A 0.002Zr (ICP) 0.010 <0.002 0.010 <0.002 <0.002Ti (ICP) 0.038 0.024 0.029 0.027 0.062K (AA*) 0.107 0.580 0.121 2.605 2.053P (ICP)*** 1.135 1.137 1.896 1.031 0.959P (Calc IC)** 0.244 1.963 0.973 1.035 0.997Ba (ICP) 0.047 N/A 0.053 N/A 0.016Pb (ICP) 0.245 0.156 0.137 0.035 0.032Mo (ICP) 0.015 <0.004 0.009 <0.004 0.005Zn (ICP) 2.875 0.176 0.794 0.172 0.464Cu (ICP) 0.026 0.086 0.022 0.003 0.065F (ISE) <0.02 0.050 N/A 0.060 1.189Cl (ISE) 0.060 0.675 0.059 0.310 0.134SO4 (IC) <0.5 0.237 <0.5 <0.2 0.332
NO3 (IC) 12.870 15.135 16.376 7.935 6.202
PO4 (IC)** 0.749 6.019 2.984 3.175 3.057
PROPERTIES% SOLIDS(105°C)
37.12 30.85 38.23 17.56 19.97
MOLAR MASS BALANCEAl(OH)3 24.15 13.98 25.06 23.12 23.81
NaNO3 17.64 20.75 22.45 27.48 8.50
Filter Aid 40.05 40.27 33.07 52.95 53.62Na6U7O24 5.36 3.95 6.75 0.06 0.29
Ca Zeolite-A 4.57 3.86 2.82 1.30 3.91AlPO4 3.48 3.49 5.82 3.16 2.94
SUM 95.26 86.29 95.96 108.065 95.58
- 25 -
Table VI. Summary of M-Area Crust Analyses from Tank 8
Element(dry wt%)
Replicate#1
ADS#200027146
Replicate#2
ADS#200027147
Replicate#3
ADS#200027148
Average
CATIONS AND ANIONSAl (ICP) 27.553 23.568 24.330 25.150
Ca (ICP) BDL 0.015 BDL 0.005Fe (ICP) 0.223 0.048 0.056 0.109Mg (ICP) 0.006 0.007 0.011 0.008Mn (ICP) 0.004 BDL 0.006 0.003Na (ICP) 1.490 1.640 1.200 1.443Na (AA) 1.340 1.060 1.310 1.237Li (ICP) 0.006 BDL BDL 0.002Ni (ICP 0.022 0.038 0.058 0.039Ni (AA) 0.071 0.106 0.124 0.100Si (ICP) 0.858 0.969 1.268 1.032Si (AA*) 1.610 1.400 1.560 1.523Cr (ICP) BDL BDL BDL BDLB (ICP) 0.086 0.042 0.040 0.056U (D-G) N/A N/A N/A N/ASr (ICP) BDL BDL BDL BDLZr (ICP) BDL BDL BDL BDLTi (ICP) BDL BDL BDL BDLK (AA*) 0.004 <0.001 0.014 0.009P (ICP)*** 0.184 0.160 0.234 0.193P (Calc IC)** 0.774 1.002 1.171 0.982Ba (ICP) BDL BDL BDL BDLPb (ICP) BDL BDL BDL BDLMo (ICP) 0.009 BDL 0.007 BDLZn (ICP) 0.145 0.149 0.139 0.144Cu (ICP) BDL BDL 0.004 BDLF (ISE) 0.116 0.495 0.105 0.239Cl (ISE) 1.520 0.977 0.413 0.970SO4 (IC) N/A N/A N/A N/A
NO3 (IC) 3.716 6.062 8.496 6.091
PO4 (IC)** 2.374 3.073 3.590 3.012
PROPERTIES% SOLIDS(105°C)
N/A N/A N/A N/A
MOLAR MASS BALANCEAl(OH)3 79.19 67.67 69.75 72.21
NaNO3 5.09 8.31 11.65 8.35
Filter Aid 3.73 3.24 3.61 3.53Na6U7O24 N/A N/A N/A N/A
Ca-zeolite BDL 0.14 BDL 0.05AlPO4 0.56 0.49 0.72 0.59
SUM 88.578 79.85 85.73 84.72 N/A = Not Analyzed; BDL = Below Detection Limit
- 26 -
Table VII. Summary of M-Area Filter Aid Analyses
Oxide(dry wt%)
DiatomaceousEarth (DE) ‡
Super-CelPerflo‡
Perlite* 2000X Perlite* 200SP
Al 2O3 16.08 12.36 12.48 12.93CaO 0.91 0.92 0.70 0.61Fe203 0.92 1.67 0.88 1.02MgO 0.13 0.12 0.11 0.30MnO2 0.90 0.59 0.10 0.08Na2O 3.28 3.55 4.48 3.42NiO 0.31 BDL BDL 0.08SiO2 67.32 72.95 74.75 75.43B203 BDL BDL BDL BDLZrO2 0.01 0.01 0.01 0.01TiO2 0.07 0.07 0.06 0.10K2O 4.46 4.82 5.42 5.05P2O5 0.44 0.09 0.03 0.03BaO 0.03 0.04 0.04 0.02PbO 0.19 0.10 BDL BDLZnO 1.12 0.67 0.19 0.19CuO 0.03 0.03 BDL BDLSUM 96.20 97.99 99.24 99.28
MOISTURE CONTENT BEFORE DRYING/FUSINGH2O 7.37 0.20 0.04 0.13
*The high surface area of these filter aids made it difficult to get an accurate weight for thedissolution and subsequent chemical analysis. In these cases the filter aid was fused at 1150°Cfor 4 hours, cooled, broken out of the crucible it was fused in, and then weighed for dissolutionand analysisBDL = Below Detection Limit‡ Dried at 600°C
- 27 -
Figure 2. X-ray diffraction pattern of the M-Area sludge dried at 90º overnight. Notehow broad the x-ray diffraction peaks are for the sodium uranate phasecompared to the other crystalline species present.
Figure 3. X-ray diffraction pattern of the M-Area sludge heat treated at 300ºC and 600ºC.
- 28 -
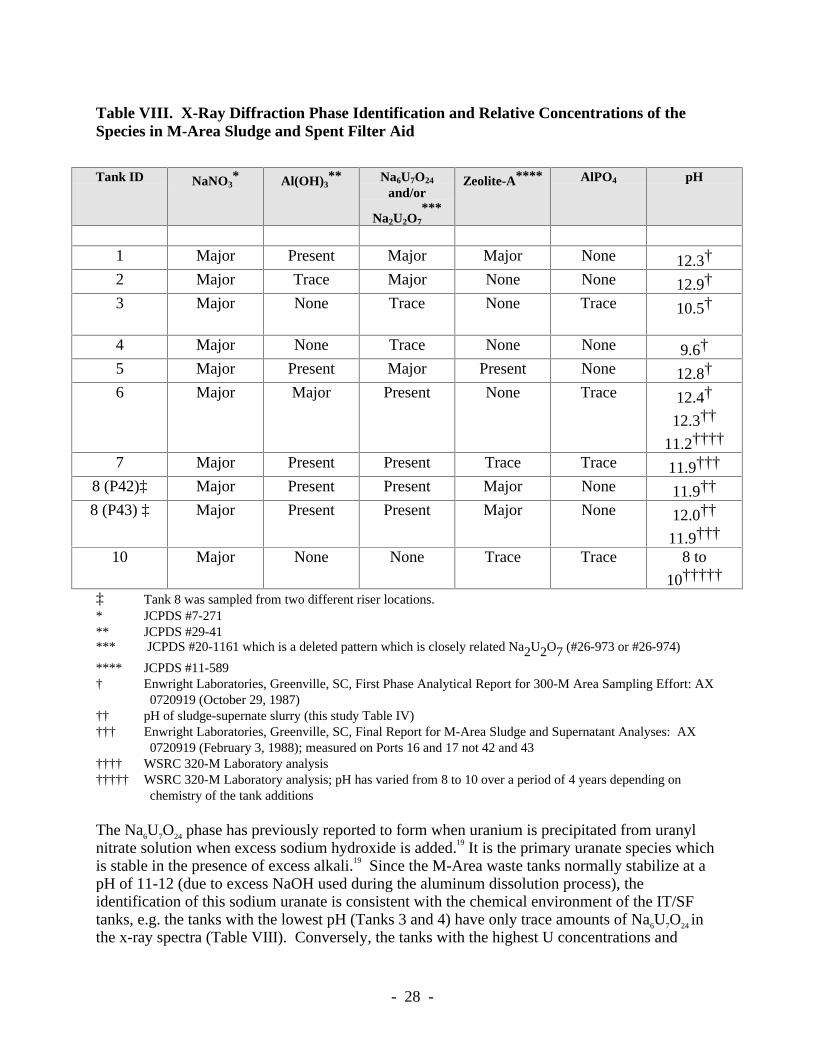
Table VIII. X-Ray Diffraction Phase Identification and Relative Concentrations of theSpecies in M-Area Sludge and Spent Filter Aid
Tank ID NaNO3* Al(OH)3
** Na6U7O24
and/or
Na2U2O7
***
Zeolite-A**** AlPO4 pH
1 Major Present Major Major None 12.3†
2 Major Trace Major None None 12.9†
3 Major None Trace None Trace 10.5†
4 Major None Trace None None 9.6†
5 Major Present Major Present None 12.8†
6 Major Major Present None Trace 12.4†
12.3††
11.2††††
7 Major Present Present Trace Trace 11.9†††
8 (P42)‡ Major Present Present Major None 11.9††
8 (P43) ‡ Major Present Present Major None 12.0††
11.9†††
10 Major None None Trace Trace 8 to
10†††††
‡ Tank 8 was sampled from two different riser locations.* JCPDS #7-271** JCPDS #29-41*** JCPDS #20-1161 which is a deleted pattern which is closely related Na2U2O7 (#26-973 or #26-974)
**** JCPDS #11-589† Enwright Laboratories, Greenville, SC, First Phase Analytical Report for 300-M Area Sampling Effort: AX
0720919 (October 29, 1987)†† pH of sludge-supernate slurry (this study Table IV)††† Enwright Laboratories, Greenville, SC, Final Report for M-Area Sludge and Supernatant Analyses: AX
0720919 (February 3, 1988); measured on Ports 16 and 17 not 42 and 43†††† WSRC 320-M Laboratory analysis††††† WSRC 320-M Laboratory analysis; pH has varied from 8 to 10 over a period of 4 years depending on
chemistry of the tank additions
The Na6U7O24 phase has previously reported to form when uranium is precipitated from uranylnitrate solution when excess sodium hydroxide is added.19 It is the primary uranate species whichis stable in the presence of excess alkali.19 Since the M-Area waste tanks normally stabilize at apH of 11-12 (due to excess NaOH used during the aluminum dissolution process), theidentification of this sodium uranate is consistent with the chemical environment of the IT/SFtanks, e.g. the tanks with the lowest pH (Tanks 3 and 4) have only trace amounts of Na6U7O24 inthe x-ray spectra (Table VIII). Conversely, the tanks with the highest U concentrations and
- 29 -
highest pH (Tanks 1,5,8) have the highest concentrations of Na6U7O24.
In addition, the tanks (Tanks 3 and 4) with the lowest Al concentration have no Al(OH)3 in theXRD spectra. Conversely, the tanks (Tanks 1, 5, 8) with the highest Al contain the mostAl(OH)3 in the XRD spectra. The tanks with the highest pH values which also have significantconcentrations of Al(OH)3 (Tanks 1 and 5) are the tanks containing the most Zeolite-A. Thequantitative phase analysis of the tanks is, therefore, consistent with the individual tankchemistries and environments (Table VIII).
The primary crystalline phase of the M-Area crust was NaNO3 and Al(OH)3 (primarily thegibbsite polymorph) with trace amounts of Na2U2O7and Zeolite-A. This was confirmed by SEM-EDS analysis which showed Al to be the major component of the crust, followed by Si, U andNa. This is also in agreement with the chemical analyses given in Table VI.
IDENTIFICATION OF IN-TANK ZEOLITE FORMATION
The zeolite identified in the M-Area sludge was identified as either a calcium or a sodiumcontaining Zeolite-A with the nominal formulas Ca6Al12Si12O48•30H2O and Na12Al 12Si12O48
•27H2O. However, zeolite was not used in M-Area processing nor had any zeolite been added tothe tanks. This finding indicated that the zeolite formed from reaction of various components inthe tank. In order to confirm this hypothesis, samples of virgin perflo and diatomaceous earthwere analyzed by x-ray diffraction and shown to be amorphous (see Figure 4). Samples of perfloand diatomaceous earth were treated with 6M NaOH solution at room temperature for 29 hours.The solution pH was 13.73. The solution was filtered off and the solids dried at 80°C for ~ 17hours. The solids were still wet, and were dried for an additional 1.5 hours at 200°C. The driedsolids were identified by x-ray analysis to be Na2SiO3 (JCPDS #16-818) and Na3Si3Al 3O12•NaCl(sodalite - JCPDS #20-495), a zeolite formed from Zeolite-A by substitution of NaCl or othersodium species such as NaOH into the Zeolite-A lattice structure. In order to ensure thatcrystallization of the sodalite was due to the treatment with NaOH and not the drying, untreatedfilter aids were dried at 200°C for 1.5 hours. The untreated filter aids remained x-ray amorphousconfirming that the Zeolite phases formed by reaction of the silica rich filter aids with NaOH.
In tank formation of Zeolite-A by chemically catalyzed crystallization of perflo anddiamateceous earth due to the high caustic content and the high pH of the M-Area supernate isconsistent with the known formation of zeolites. For example, Linde B1 zeolite is fabricated via
a patented process which treats aluminosilicate gel (“Alfloc”) in concentrated NaOH attemperatures of 60-110°C.20
Additional evidence for in-tank, chemically catalyzed crystallization of Zeolite-A from thealuminosilicate rich portion of the sludge was achieved by dissolving M-Area sludge in 6MHNO3 and analyzing the undissolved residue. The acid resistant residue in the M-Area sludge ispure SiO2 (crystalline cristobolite and traces of quartz). Because cristobolite and quartz arecrystalline species and acid resistant, they are the breakdown products of a crystalline silicate notof the amorphous perflo. This indicates that the cristobolite is the breakdown product of theZeolite-A and not the original filter aid.
- 30 -
Figure 4. X-ray analysis of untreated (virgin) perflo and diatomaceous earth indicatedthat these materials were amorphous (top) while treatment with 6M NaOH for29 hours at room temperature crystallized Na2SiO3 and sodalite (a mineralrelated in structure to Zeolite-A).
- 31 -
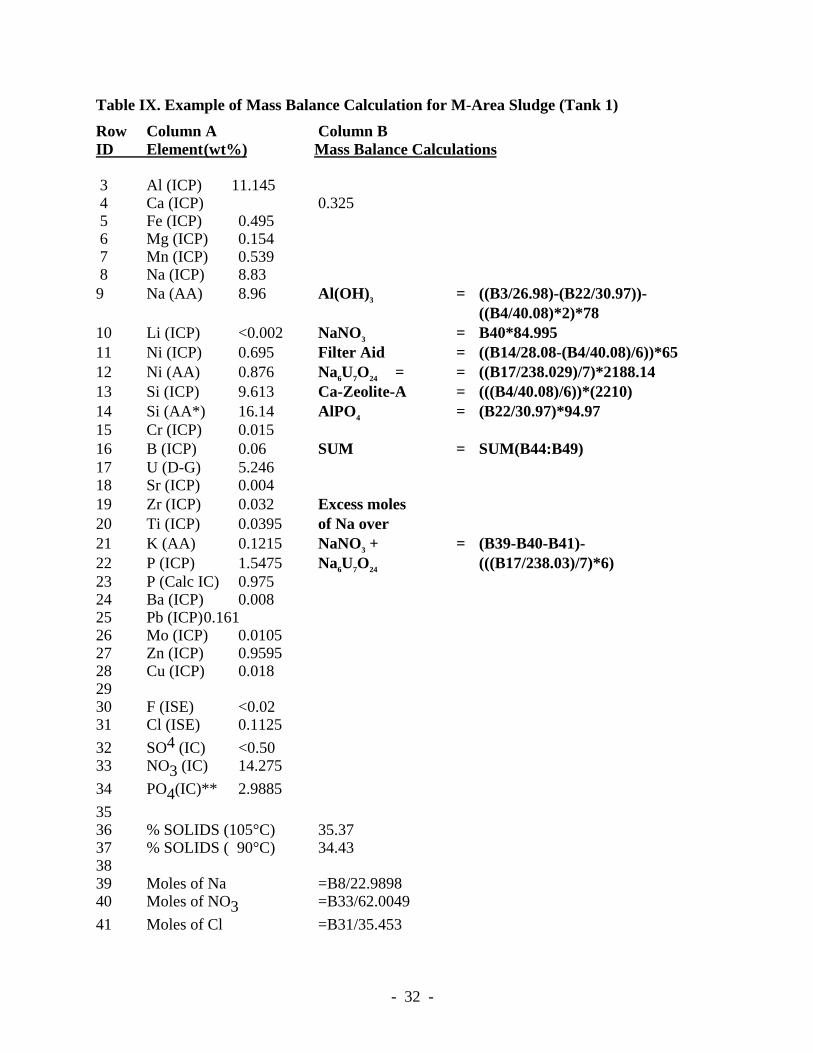
MASS BALANCE CALCULATIONS
The x-ray diffraction analysis indicated that the crystalline species present in the M-Area sludgesare NaNO3, Na6U7O24, Al(OH)3, AlPO4, and Zeolite-A of the approximate formulaCa6Al12Si12O48•30H2O (with a molecular weight of 2210 grams) or Na12Al 12Si12O48•27H2O (with amolecular weight of 2242 grams). The remainder of the sludge is amorphous perlite or perflo. Amass balance based on these 5 crystalline species and amorphous SiO2 was calculated from theelement wt% analyses given in Table V and Table VI for the M-Area sludges and crust,respectively.
Table IX shows a sample molar mass balance calculation for Tank-1 sludge. In the molar massbalance calculations all of the molar NO3 was assumed to form NaNO3. All of the molar U wasassumed to form Na6U7O24. All of the molar Ca was assumed to form Ca rich Zeolite-A. All ofthe acid soluble molar PO4 determined by ICP was assumed to form AlPO4. The molar Alconcentration minus the molar amount of Al assigned to AlPO4 minus the molar concentration ofAl in the Zeolite-A was assumed to form Al(OH)3. All of the Si determined by AA minus theamount of Si consumed in the Zeolite-A phase, was assigned to the filter aid as described below.
The average molecular formulas for the filter aid species were determined from the normalizedoxide mole% analyses given in Appendix II. Based on the data in Appendix II the averagemolecular formulas for these filter aid species can be written as follows on an equal oxygenbasis:
perflo = K0.08Na0.08Al 0.165Si0.83O2
diatomaceous earth = K0.08Na0.08Al 0.23Si0.79O2.
For perflo the average molecular weight is 64.53 and for diatomaceous earth the averagemolecular weight is 65.45. Since the relative amounts of each filter aid used in any one M-Areatank is unknown, an average molecular weight of 65 grams was used to calculate the contributionof the filter aids to the mass balance.
The resulting mass balance results are summarized in Table V and Table VI and Appendix I.The mass balance sums calculated from the chemical analyses in Table V sum to be between 95-105 mole% indicating that most of the chemical analyses are accurate. Deviations from massbalance of 100±5mole% appear to be due to incorrect speciation of Na. Excess Na over thatassigned to NaNO3 and Na6U7O24 was calculated as moles/100grams (Appendix I). This probablyshould have been assigned to the Zeolite-A phase since this is a mixed Na-Ca Zeolite-A but themass balance calculations assumed a pure Ca bearing Zeolite-A. The Na may also be partiallytied up in minor phases such as NaCl and sodium aluminate phases which did not show upduring x-ray diffraction analysis due to their low volume fraction. Interestingly, the tanks withexcess Na in the mass balance (Tanks 1, 5 and 6) have relatively high pH values, while the tankssuch as 3 and 4 which do not have excess Na have lower pH values.
- 32 -
Table IX. Example of Mass Balance Calculation for M-Area Sludge (Tank 1)
Row Column A Column BID Element (wt%) Mass Balance Calculations
3 Al (ICP) 11.145 4 Ca (ICP) 0.325 5 Fe (ICP) 0.495 6 Mg (ICP) 0.154 7 Mn (ICP) 0.539 8 Na (ICP) 8.839 Na (AA) 8.96 Al(OH)3 = ((B3/26.98)-(B22/30.97))-
((B4/40.08)*2)*7810 Li (ICP) <0.002 NaNO3 = B40*84.99511 Ni (ICP) 0.695 Filter Aid = ((B14/28.08-(B4/40.08)/6))*6512 Ni (AA) 0.876 Na6U7O24 = = ((B17/238.029)/7)*2188.1413 Si (ICP) 9.613 Ca-Zeolite-A = (((B4/40.08)/6))*(2210)14 Si (AA*) 16.14 AlPO4 = (B22/30.97)*94.9715 Cr (ICP) 0.01516 B (ICP) 0.06 SUM = SUM(B44:B49)17 U (D-G) 5.24618 Sr (ICP) 0.00419 Zr (ICP) 0.032 Excess moles20 Ti (ICP) 0.0395 of Na over21 K (AA) 0.1215 NaNO3 + = (B39-B40-B41)-22 P (ICP) 1.5475 Na6U7O24 (((B17/238.03)/7)*6)23 P (Calc IC) 0.97524 Ba (ICP) 0.00825 Pb (ICP)0.16126 Mo (ICP) 0.010527 Zn (ICP) 0.959528 Cu (ICP) 0.0182930 F (ISE) <0.0231 Cl (ISE) 0.1125
32 SO4 (IC) <0.5033 NO3 (IC) 14.275
34 PO4(IC)** 2.9885
3536 % SOLIDS (105°C) 35.3737 % SOLIDS ( 90°C) 34.433839 Moles of Na =B8/22.989840 Moles of NO3 =B33/62.0049
41 Moles of Cl =B31/35.453
- 33 -
The mass balance summaries (Table V) agree with the concentrations of the phases predictedfrom the x-ray diffraction peak height analysis (Table VIII): Tanks 3 and 4 with low pH have lessAl(OH)3 and only trace amount of Na6U7O24 while Tanks 1, 2, 5, 6, and 8 contain the mostAl(OH)3 and Na6U7O24. All of the tanks have NaNO3 as the major species. Tank 10 has thelargest fraction of filter aid and the lowest concentrations of Na6U7O24.
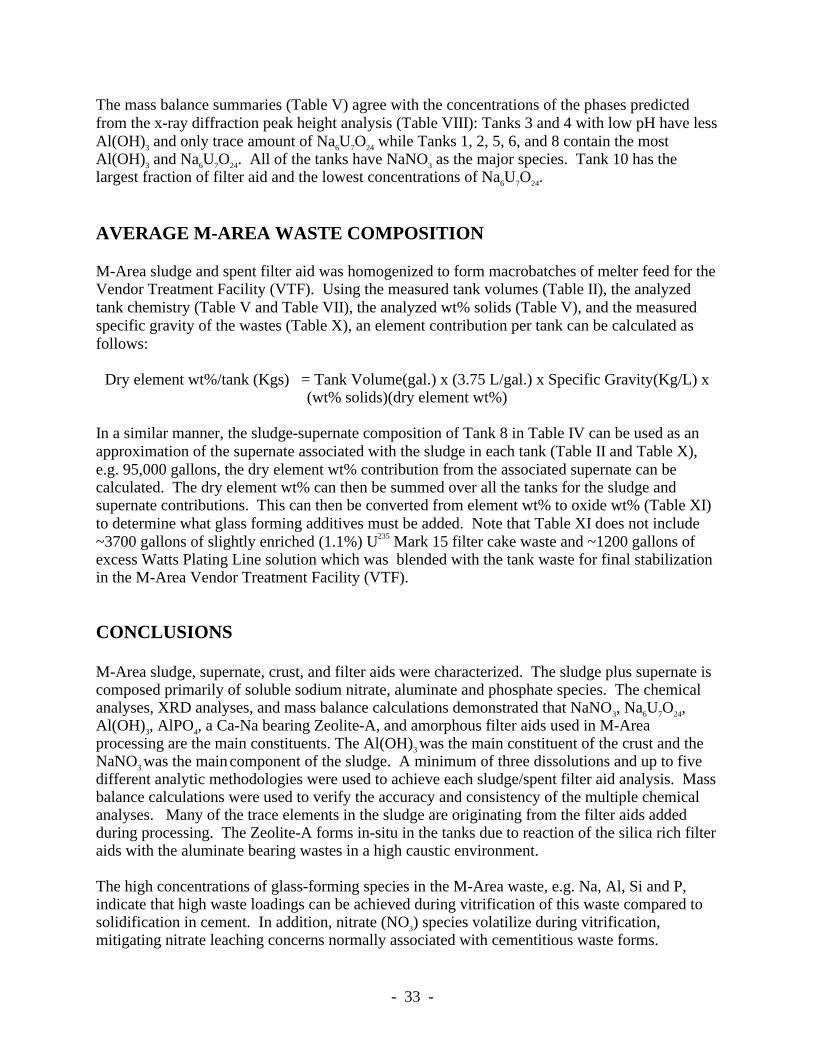
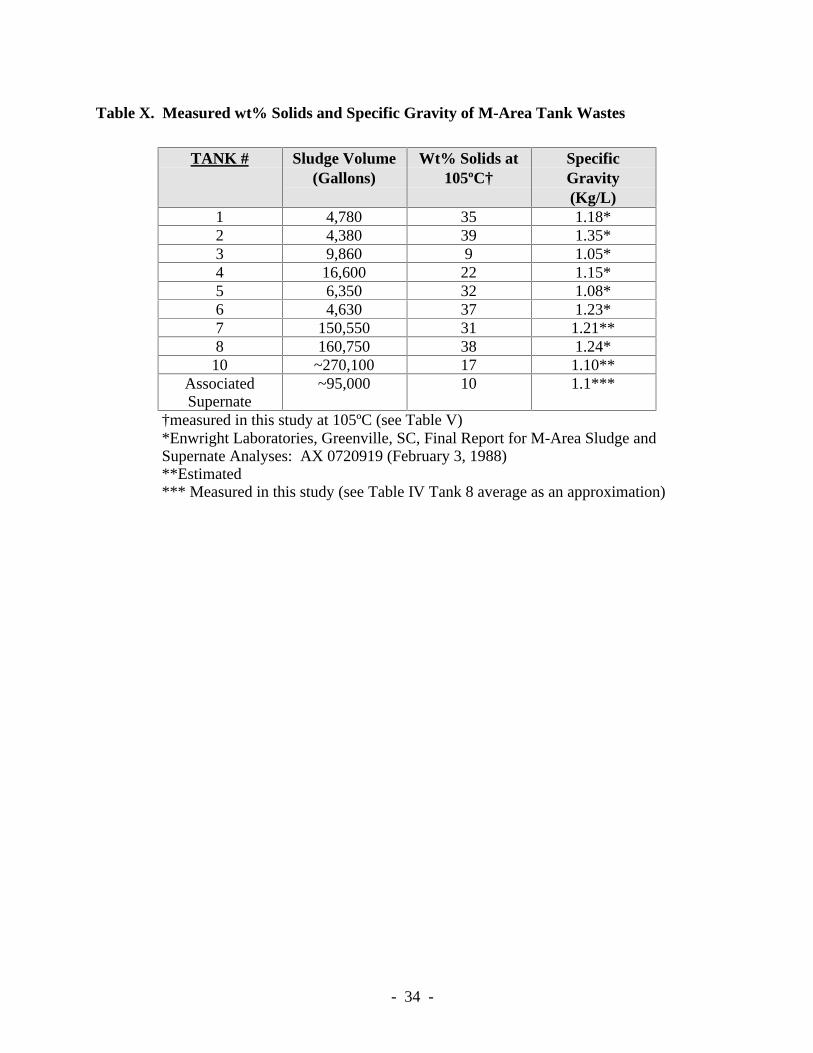
AVERAGE M-AREA WASTE COMPOSITION
M-Area sludge and spent filter aid was homogenized to form macrobatches of melter feed for theVendor Treatment Facility (VTF). Using the measured tank volumes (Table II), the analyzedtank chemistry (Table V and Table VII), the analyzed wt% solids (Table V), and the measuredspecific gravity of the wastes (Table X), an element contribution per tank can be calculated asfollows:
Dry element wt%/tank (Kgs) = Tank Volume(gal.) x (3.75 L/gal.) x Specific Gravity(Kg/L) x(wt% solids)(dry element wt%)
In a similar manner, the sludge-supernate composition of Tank 8 in Table IV can be used as anapproximation of the supernate associated with the sludge in each tank (Table II and Table X),e.g. 95,000 gallons, the dry element wt% contribution from the associated supernate can becalculated. The dry element wt% can then be summed over all the tanks for the sludge andsupernate contributions. This can then be converted from element wt% to oxide wt% (Table XI)to determine what glass forming additives must be added. Note that Table XI does not include~3700 gallons of slightly enriched (1.1%) U235 Mark 15 filter cake waste and ~1200 gallons ofexcess Watts Plating Line solution which was blended with the tank waste for final stabilizationin the M-Area Vendor Treatment Facility (VTF).
CONCLUSIONS
M-Area sludge, supernate, crust, and filter aids were characterized. The sludge plus supernate iscomposed primarily of soluble sodium nitrate, aluminate and phosphate species. The chemicalanalyses, XRD analyses, and mass balance calculations demonstrated that NaNO3, Na6U7O24,Al(OH)3, AlPO4, a Ca-Na bearing Zeolite-A, and amorphous filter aids used in M-Areaprocessing are the main constituents. The Al(OH)3 was the main constituent of the crust and theNaNO3 was the main component of the sludge. A minimum of three dissolutions and up to fivedifferent analytic methodologies were used to achieve each sludge/spent filter aid analysis. Massbalance calculations were used to verify the accuracy and consistency of the multiple chemicalanalyses. Many of the trace elements in the sludge are originating from the filter aids addedduring processing. The Zeolite-A forms in-situ in the tanks due to reaction of the silica rich filteraids with the aluminate bearing wastes in a high caustic environment.
The high concentrations of glass-forming species in the M-Area waste, e.g. Na, Al, Si and P,indicate that high waste loadings can be achieved during vitrification of this waste compared tosolidification in cement. In addition, nitrate (NO3) species volatilize during vitrification,mitigating nitrate leaching concerns normally associated with cementitious waste forms.
- 34 -
Table X. Measured wt% Solids and Specific Gravity of M-Area Tank Wastes
TANK # Sludge Volume(Gallons)
Wt% Solids at105ºC†
SpecificGravity(Kg/L)
1 4,780 35 1.18*2 4,380 39 1.35*3 9,860 9 1.05*4 16,600 22 1.15*5 6,350 32 1.08*6 4,630 37 1.23*7 150,550 31 1.21**8 160,750 38 1.24*10 ~270,100 17 1.10**
AssociatedSupernate
~95,000 10 1.1***
†measured in this study at 105ºC (see Table V)*Enwright Laboratories, Greenville, SC, Final Report for M-Area Sludge andSupernate Analyses: AX 0720919 (February 3, 1988)**Estimated*** Measured in this study (see Table IV Tank 8 average as an approximation)
- 35 -
Table XI. M-Area Calculated Composite Sludge/Residual Supernate Composition.†
Oxide Oxide Wt% Species Molar MassBalance
Al2O3 20.27 Al(OH)3 23.18CaO 0.59 NaNO3 17.88Fe203 0.96 Filter Aid 47.06MgO 0.24 Na6U7O24 3.48MnO 0.37 Ca Zeolite-A 3.15Na2O 17.74 AlPO4 4.32NiO 1.52 SUM 99.06SiO2 47.48Cr2O3 0.01B203 0.06UO2 4.21TiO2 0.05K2O 1.28P2O5 4.19BaO 0.03PbO 0.15MoO3 0.01ZnO 0.77CuO 0.05SO4 0.07NO3 19.10SUMS 102.97
WT% 23.8
† Calculated total inventory. Composition does not include ~3700 gallons of slightlyenriched (1.1%) U235 Mark 15 filter cake waste and ~1200 gallons of excess Watts PlatingLine solution were homogenized with the tank waste for final stabilization in the M-AreaVendor Treatment Facility (VTF).
- 36 -
REFERENCES 1 Federal Register, “Land Disposal Restrictions for Third Third Scheduled Wastes,
Final Rule,” 55 FR22627 (June 1, 1990).
2 U.S. Environmental Protection Agency, “Handbook: Vitrification Technologies forTreatment of Hazardous and Radioactive Waste,” EPA/625/R-92/002 (May, 1992).
3 J. A. Stone, "PPC Program Proposals for FY-l989 and Beyond," U.S. DOE ReportDPST-88-599, Savannah River Laboratory, E. I. duPont deNemours & Co., Aiken, SC(l988).
4 C.M. Jantzen, J.B. Pickett, and W.G. Ramsey, “Reactive Additive StabilizationProcess (RASP) for Hazardous and Mixed Waste Vitrification,”. Proceedings of theSecond International Symposium on Mixed Waste, A.A. Moghissi, R.K. Blauvelt, G.A.Benda, and N.E. Rothermich (Eds.), American Society of Mechanical Engineers, p.4.2.1to 4.2.13 (1993).
5 J.L.England and S. Shah, “Preliminary Planning Cost Estimate for VitrificationAlternatives of Mixed Waste,” U.S. DOE Report WSRC-RP-92-1209, WestinghouseSavannah River Co., Aiken, SC (October 15, 1992).
6 D.F. Bickford, “Advanced Radioactive Waste-Glass Melters,” Nuclear WasteManagement IV, G.G. Wicks, D.F. Bickford, and L.R. Bunnell (Eds.), CeramicTransactions, V. 23, American Ceramic Society, Westerville, OH, 335-347 (1991).
7 H. L. Martin, J.B. Pickett and C.A. Langton, “Radioactive and Hazardous WasteSludge Treatment and Stabilization by Filtration,” Am. Filtration Society 1992National Meeting, May 1992, WSRC-MS-91- 235, Westinghouse Savannah River Co.,Savannah River Site, Aiken, SC 29802 (1992).
8 J.B. Pickett, J.C. Musall, H.L. Martin, “Treatment and Disposal of Mixed F006 PlatingLine Sludge at the Savannah River Site,” Proceedings of the Second InternationalSymposium on Mixed Waste,” A.A. Moghissi, R.K. Blauvelt, G.A. Benda, and N.E.Rothermich (Eds.), American Society of Mechanical Engineers, 1.3.1-1.3.9 (1993).
9 SCDHEC Construction Permit #14,832 (January 11, l989).
10 B.W. Bowan, II and M.H. Clements, “Vendor Vitrification Programs for theSavannah River Site,” Proceedings of the Second International Symposium on MixedWaste, A.A. Moghissi, B.R. Love, R.K. Blauvelt (Eds.), American Society of MechanicalEngineers, p.8.4.1 to 8.4.8 (1995).
11 C.M. Jantzen, “Solidification of M-Area Sludge and Supernate Into LowTemperature Glass: Sludge and Supernate Characterization,” U.S. DOE ReportDPST-89-351, E.I. duPont deNemours & Co., Aiken, SC (March 1, 1989).
- 37 -
12 C.M. Jantzen, “Relationship of Glass Composition to Glass Viscosity, Resistivity,
Liquidus Temperature, and Durability: First Principles Process-Product Modelsfor Vitrification of Nuclear Waste,” Proceedings of the 5th International Symposium onCeramics in Nuclear Waste Management, G.G. Wicks, D.F. Bickford, and R. Bunnell(Eds.), American Ceramic Society, Westerville, OH, 37-51 (1991).
13 C.M. Jantzen, J.B. Pickett, W.G. Ramsey, and D.C. Beam, “Treatability Studies onMixed (Radioactive and Hazardous) M-Area F006 Waste Sludge: Vitrification Viathe Reactive Additive Stabilization Process (RASP),” Proceedings of the InternationalTopical Meeting on Nuclear and Hazardous Waste Management, Vol. I, Spectrum 1994,American Nuclear Society, La Grange Park, IL, 737-742 (1994).
14 G. L. Pine, and C.M. Jantzen, "Implications of a One-Year Basalt Weathering/Reactivity Study for a Basalt Repository Environment," E.I. du Pont de Nemours &Co., Savannah River Laboratory, DP-1742, 66p (March, 1987).
15 A. R. Jurgensen, DPSTM 87-700-6, ADD-1500, Revison 0 (1989).
16 M. Pourbaix, Atlas of Electrochemical Equilibria in Aqueous Solutions, EnglishTranslation of 1966 French version by J.A. Franklin (Ed)., National Association ofCorrosion Engineers, Houston, TX, 644p (1974).
17 C. M. Jantzen, "Verification of Glass Composition and Strategy for SGM and DWPF Glass Composition Determination," DPST-86-708 (March 30, 1987).
18 E. H. P. Cordfunke and B O. Loopstra, "Sodium Uranates: Preparation andThermochemical Properties," J. Inorgan. Chem., 33, 2427-2436 (1971).
19 C. A. Wamser, J. Belle, E. Bernsohn, and B. Williamson, "The Constitution ofthe Uranates of Sodium," J. Amer. Chem. Soc., 74, 1020-1022 (1952).
20 R.M. Barrer, J.W. Baynham, F.W. Bultitude and W.M. Meier, “HydrothermalChemistry of the Silicates. Part VIII. Low-temperature Growth of Aluminosilicates,and of some Gallium and Germanium Analogues,” J. Chem. Soc., 195-208 (1959).

- 38 -
This page intentionally left blank.
- 39 -
APPENDIX I M-AREA SLUDGE ANALYSES (ELEMENT WT%)Tank 1 TK-1-1 TK-1-2 TK-1-1 TK-1-2 TANK 1
ANALYSIS # 111468 111469 21295 21296 AVERAGEANALYSIS DATE 3/1/88 3/1/88 11/1/88 11/1/88RECORDED DPSTN 4475 DPSTN 4475 DPSTN 4475 DPSTN 4475Al (ICP) 11.300 11.000 10.850 11.430 11.145Ca (ICP) 0.228 0.192 0.530 0.350 0.325Fe (ICP) <0.004 <0.004 0.500 0.490 0.495Mg (ICP) 0.143 0.133 0.190 0.150 0.154Mn (ICP) 0.238 0.317 1.100 0.500 0.539Na (ICP) 8.810 8.850 8.830Na (AA) 10.010 9.140 8.590 8.100 8.960Li (ICP) <0.002 <0.002 <0.002 <0.002 <0.002Ni (ICP) 0.680 0.710 0.695Ni (AA) 0.884 0.868 0.876Si (ICP) 6.870 7.190 11.990 12.400 9.613Si (AA*) 19.760 21.960 16.700 15.580 16.140Cr (ICP) 0.009 0.010 0.020 0.020 0.015B (ICP) <0.002 <0.002 0.090 0.030 0.060U (D-G) 5.180 5.311 5.246Sr (ICP) 0.002 0.001 0.010 <0.001 0.004Zr (ICP) 0.055 0.054 0.010 0.010 0.032Ti (ICP) 0.038 0.040 0.040 0.040 0.040K (AA*) 0.124 0.119 0.122P (ICP)*** 2.200 1.910 1.090 0.990 1.548P (Calc IC)** 1.040 0.909 0.975Ba (ICP) 0.008 0.007 <0.001 <0.001 0.008Pb (ICP) 0.048 0.086 0.320 0.190 0.161Mo (ICP) 0.012 0.010 0.010 0.010 0.011Zn (ICP) 0.618 0.580 1.760 0.880 0.960Cu (ICP) 0.013 0.009 0.020 0.030 0.018F (ISE) <0.02 <0.02 <0.02Cl (ISE) 0.113 0.112 0.113SO4 (IC) <0.09 <0.50 <0.50NO3 (IC) 13.280 15.270 14.275PO4(IC)** 3.190 2.787 2.989% SOLIDS (105°C) 35.370 35.370% SOLIDS ( 90°C) 34.430 34.430Moles of Na 0.435 0.398 0.374 0.352 0.390Moles of NO3 0.214 0.246 0.230Moles of Cl 0.003 0.003 0.003*AA Silicon values in italics from HCl/HF dissolution; others from Na2O2 dissolution all anions from Na2O2 fusion with H2O uptake (see text)**water soluble phosphate only; ***acid soluble phosphate
MASS BALANCEAl(OH)3 27.06NaNO3 19.57Filter Aid 36.31Na6U7O24 6.89Ca-Zeolite-A 2.99AlPO4 4.75SUM 97.55EXCESS moles Na overNaNO3 and Na-U = 0.141
- 40 -
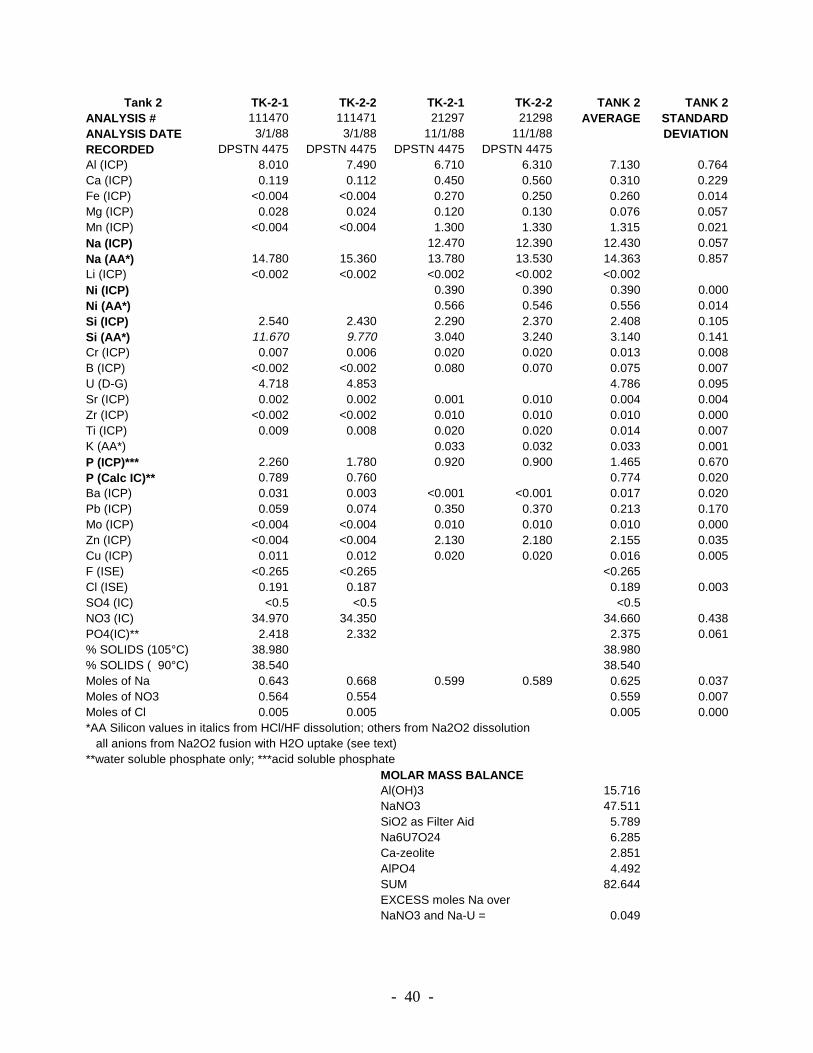
Tank 2 TK-2-1 TK-2-2 TK-2-1 TK-2-2 TANK 2 TANK 2ANALYSIS # 111470 111471 21297 21298 AVERAGE STANDARDANALYSIS DATE 3/1/88 3/1/88 11/1/88 11/1/88 DEVIATIONRECORDED DPSTN 4475 DPSTN 4475 DPSTN 4475 DPSTN 4475Al (ICP) 8.010 7.490 6.710 6.310 7.130 0.764Ca (ICP) 0.119 0.112 0.450 0.560 0.310 0.229Fe (ICP) <0.004 <0.004 0.270 0.250 0.260 0.014Mg (ICP) 0.028 0.024 0.120 0.130 0.076 0.057Mn (ICP) <0.004 <0.004 1.300 1.330 1.315 0.021Na (ICP) 12.470 12.390 12.430 0.057Na (AA*) 14.780 15.360 13.780 13.530 14.363 0.857Li (ICP) <0.002 <0.002 <0.002 <0.002 <0.002Ni (ICP) 0.390 0.390 0.390 0.000Ni (AA*) 0.566 0.546 0.556 0.014Si (ICP) 2.540 2.430 2.290 2.370 2.408 0.105Si (AA*) 11.670 9.770 3.040 3.240 3.140 0.141Cr (ICP) 0.007 0.006 0.020 0.020 0.013 0.008B (ICP) <0.002 <0.002 0.080 0.070 0.075 0.007U (D-G) 4.718 4.853 4.786 0.095Sr (ICP) 0.002 0.002 0.001 0.010 0.004 0.004Zr (ICP) <0.002 <0.002 0.010 0.010 0.010 0.000Ti (ICP) 0.009 0.008 0.020 0.020 0.014 0.007K (AA*) 0.033 0.032 0.033 0.001P (ICP)*** 2.260 1.780 0.920 0.900 1.465 0.670P (Calc IC)** 0.789 0.760 0.774 0.020Ba (ICP) 0.031 0.003 <0.001 <0.001 0.017 0.020Pb (ICP) 0.059 0.074 0.350 0.370 0.213 0.170Mo (ICP) <0.004 <0.004 0.010 0.010 0.010 0.000Zn (ICP) <0.004 <0.004 2.130 2.180 2.155 0.035Cu (ICP) 0.011 0.012 0.020 0.020 0.016 0.005F (ISE) <0.265 <0.265 <0.265Cl (ISE) 0.191 0.187 0.189 0.003SO4 (IC) <0.5 <0.5 <0.5NO3 (IC) 34.970 34.350 34.660 0.438PO4(IC)** 2.418 2.332 2.375 0.061% SOLIDS (105°C) 38.980 38.980% SOLIDS ( 90°C) 38.540 38.540Moles of Na 0.643 0.668 0.599 0.589 0.625 0.037Moles of NO3 0.564 0.554 0.559 0.007Moles of Cl 0.005 0.005 0.005 0.000*AA Silicon values in italics from HCl/HF dissolution; others from Na2O2 dissolution all anions from Na2O2 fusion with H2O uptake (see text)**water soluble phosphate only; ***acid soluble phosphate
MOLAR MASS BALANCEAl(OH)3 15.716NaNO3 47.511SiO2 as Filter Aid 5.789Na6U7O24 6.285Ca-zeolite 2.851AlPO4 4.492SUM 82.644EXCESS moles Na overNaNO3 and Na-U = 0.049
- 41 -
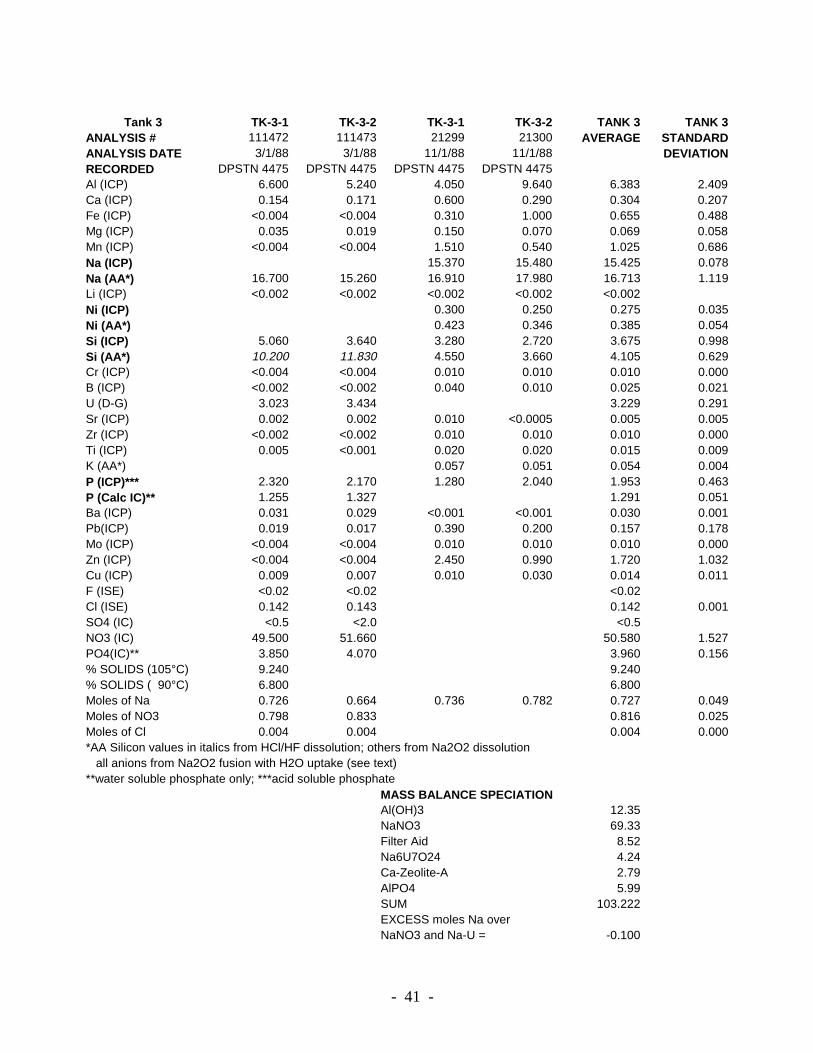
Tank 3 TK-3-1 TK-3-2 TK-3-1 TK-3-2 TANK 3 TANK 3ANALYSIS # 111472 111473 21299 21300 AVERAGE STANDARDANALYSIS DATE 3/1/88 3/1/88 11/1/88 11/1/88 DEVIATIONRECORDED DPSTN 4475 DPSTN 4475 DPSTN 4475 DPSTN 4475Al (ICP) 6.600 5.240 4.050 9.640 6.383 2.409Ca (ICP) 0.154 0.171 0.600 0.290 0.304 0.207Fe (ICP) <0.004 <0.004 0.310 1.000 0.655 0.488Mg (ICP) 0.035 0.019 0.150 0.070 0.069 0.058Mn (ICP) <0.004 <0.004 1.510 0.540 1.025 0.686Na (ICP) 15.370 15.480 15.425 0.078Na (AA*) 16.700 15.260 16.910 17.980 16.713 1.119Li (ICP) <0.002 <0.002 <0.002 <0.002 <0.002Ni (ICP) 0.300 0.250 0.275 0.035Ni (AA*) 0.423 0.346 0.385 0.054Si (ICP) 5.060 3.640 3.280 2.720 3.675 0.998Si (AA*) 10.200 11.830 4.550 3.660 4.105 0.629Cr (ICP) <0.004 <0.004 0.010 0.010 0.010 0.000B (ICP) <0.002 <0.002 0.040 0.010 0.025 0.021U (D-G) 3.023 3.434 3.229 0.291Sr (ICP) 0.002 0.002 0.010 <0.0005 0.005 0.005Zr (ICP) <0.002 <0.002 0.010 0.010 0.010 0.000Ti (ICP) 0.005 <0.001 0.020 0.020 0.015 0.009K (AA*) 0.057 0.051 0.054 0.004P (ICP)*** 2.320 2.170 1.280 2.040 1.953 0.463P (Calc IC)** 1.255 1.327 1.291 0.051Ba (ICP) 0.031 0.029 <0.001 <0.001 0.030 0.001Pb(ICP) 0.019 0.017 0.390 0.200 0.157 0.178Mo (ICP) <0.004 <0.004 0.010 0.010 0.010 0.000Zn (ICP) <0.004 <0.004 2.450 0.990 1.720 1.032Cu (ICP) 0.009 0.007 0.010 0.030 0.014 0.011F (ISE) <0.02 <0.02 <0.02Cl (ISE) 0.142 0.143 0.142 0.001SO4 (IC) <0.5 <2.0 <0.5NO3 (IC) 49.500 51.660 50.580 1.527PO4(IC)** 3.850 4.070 3.960 0.156% SOLIDS (105°C) 9.240 9.240% SOLIDS ( 90°C) 6.800 6.800Moles of Na 0.726 0.664 0.736 0.782 0.727 0.049Moles of NO3 0.798 0.833 0.816 0.025Moles of Cl 0.004 0.004 0.004 0.000*AA Silicon values in italics from HCl/HF dissolution; others from Na2O2 dissolution all anions from Na2O2 fusion with H2O uptake (see text)**water soluble phosphate only; ***acid soluble phosphate
MASS BALANCE SPECIATIONAl(OH)3 12.35NaNO3 69.33Filter Aid 8.52Na6U7O24 4.24Ca-Zeolite-A 2.79AlPO4 5.99SUM 103.222EXCESS moles Na overNaNO3 and Na-U = -0.100
- 42 -
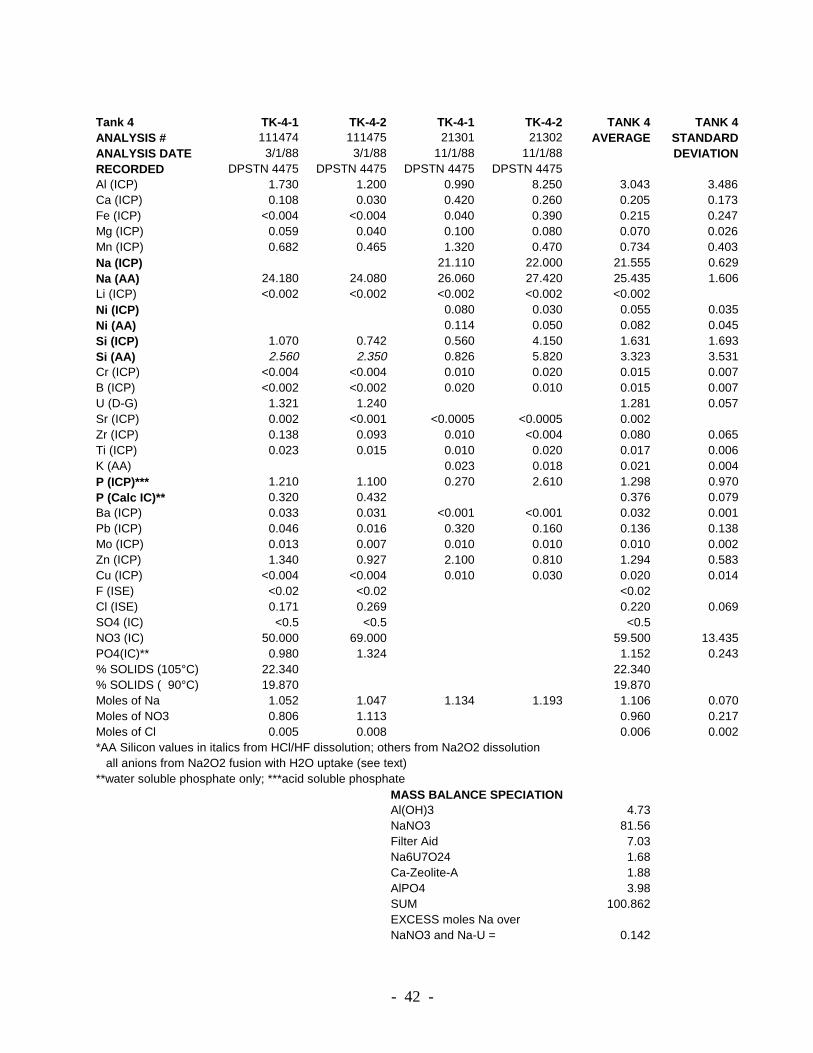
Tank 4 TK-4-1 TK-4-2 TK-4-1 TK-4-2 TANK 4 TANK 4ANALYSIS # 111474 111475 21301 21302 AVERAGE STANDARDANALYSIS DATE 3/1/88 3/1/88 11/1/88 11/1/88 DEVIATIONRECORDED DPSTN 4475 DPSTN 4475 DPSTN 4475 DPSTN 4475Al (ICP) 1.730 1.200 0.990 8.250 3.043 3.486Ca (ICP) 0.108 0.030 0.420 0.260 0.205 0.173Fe (ICP) <0.004 <0.004 0.040 0.390 0.215 0.247Mg (ICP) 0.059 0.040 0.100 0.080 0.070 0.026Mn (ICP) 0.682 0.465 1.320 0.470 0.734 0.403Na (ICP) 21.110 22.000 21.555 0.629Na (AA) 24.180 24.080 26.060 27.420 25.435 1.606Li (ICP) <0.002 <0.002 <0.002 <0.002 <0.002Ni (ICP) 0.080 0.030 0.055 0.035Ni (AA) 0.114 0.050 0.082 0.045Si (ICP) 1.070 0.742 0.560 4.150 1.631 1.693Si (AA) 2.560 2.350 0.826 5.820 3.323 3.531Cr (ICP) <0.004 <0.004 0.010 0.020 0.015 0.007B (ICP) <0.002 <0.002 0.020 0.010 0.015 0.007U (D-G) 1.321 1.240 1.281 0.057Sr (ICP) 0.002 <0.001 <0.0005 <0.0005 0.002Zr (ICP) 0.138 0.093 0.010 <0.004 0.080 0.065Ti (ICP) 0.023 0.015 0.010 0.020 0.017 0.006K (AA) 0.023 0.018 0.021 0.004P (ICP)*** 1.210 1.100 0.270 2.610 1.298 0.970P (Calc IC)** 0.320 0.432 0.376 0.079Ba (ICP) 0.033 0.031 <0.001 <0.001 0.032 0.001Pb (ICP) 0.046 0.016 0.320 0.160 0.136 0.138Mo (ICP) 0.013 0.007 0.010 0.010 0.010 0.002Zn (ICP) 1.340 0.927 2.100 0.810 1.294 0.583Cu (ICP) <0.004 <0.004 0.010 0.030 0.020 0.014F (ISE) <0.02 <0.02 <0.02Cl (ISE) 0.171 0.269 0.220 0.069SO4 (IC) <0.5 <0.5 <0.5NO3 (IC) 50.000 69.000 59.500 13.435PO4(IC)** 0.980 1.324 1.152 0.243% SOLIDS (105°C) 22.340 22.340% SOLIDS ( 90°C) 19.870 19.870Moles of Na 1.052 1.047 1.134 1.193 1.106 0.070Moles of NO3 0.806 1.113 0.960 0.217Moles of Cl 0.005 0.008 0.006 0.002*AA Silicon values in italics from HCl/HF dissolution; others from Na2O2 dissolution all anions from Na2O2 fusion with H2O uptake (see text)**water soluble phosphate only; ***acid soluble phosphate
MASS BALANCE SPECIATIONAl(OH)3 4.73NaNO3 81.56Filter Aid 7.03Na6U7O24 1.68Ca-Zeolite-A 1.88AlPO4 3.98SUM 100.862EXCESS moles Na overNaNO3 and Na-U = 0.142
- 43 -
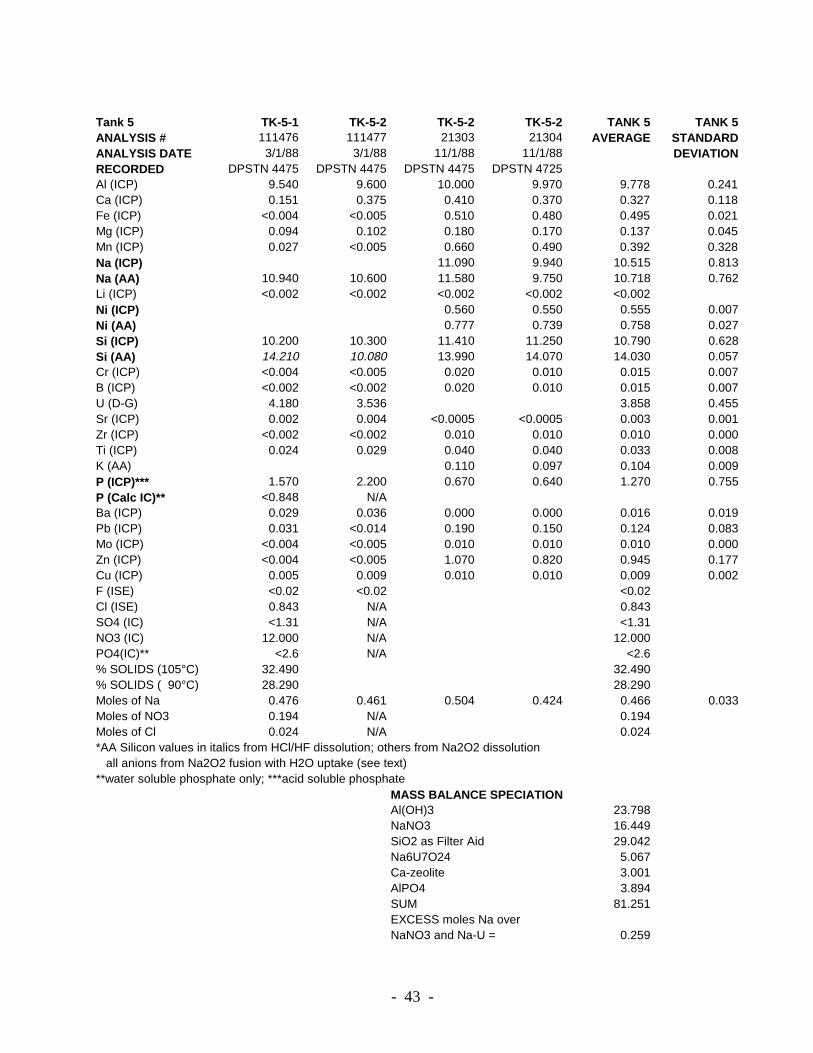
Tank 5 TK-5-1 TK-5-2 TK-5-2 TK-5-2 TANK 5 TANK 5ANALYSIS # 111476 111477 21303 21304 AVERAGE STANDARDANALYSIS DATE 3/1/88 3/1/88 11/1/88 11/1/88 DEVIATIONRECORDED DPSTN 4475 DPSTN 4475 DPSTN 4475 DPSTN 4725Al (ICP) 9.540 9.600 10.000 9.970 9.778 0.241Ca (ICP) 0.151 0.375 0.410 0.370 0.327 0.118Fe (ICP) <0.004 <0.005 0.510 0.480 0.495 0.021Mg (ICP) 0.094 0.102 0.180 0.170 0.137 0.045Mn (ICP) 0.027 <0.005 0.660 0.490 0.392 0.328Na (ICP) 11.090 9.940 10.515 0.813Na (AA) 10.940 10.600 11.580 9.750 10.718 0.762Li (ICP) <0.002 <0.002 <0.002 <0.002 <0.002Ni (ICP) 0.560 0.550 0.555 0.007Ni (AA) 0.777 0.739 0.758 0.027Si (ICP) 10.200 10.300 11.410 11.250 10.790 0.628Si (AA) 14.210 10.080 13.990 14.070 14.030 0.057Cr (ICP) <0.004 <0.005 0.020 0.010 0.015 0.007B (ICP) <0.002 <0.002 0.020 0.010 0.015 0.007U (D-G) 4.180 3.536 3.858 0.455Sr (ICP) 0.002 0.004 <0.0005 <0.0005 0.003 0.001Zr (ICP) <0.002 <0.002 0.010 0.010 0.010 0.000Ti (ICP) 0.024 0.029 0.040 0.040 0.033 0.008K (AA) 0.110 0.097 0.104 0.009P (ICP)*** 1.570 2.200 0.670 0.640 1.270 0.755P (Calc IC)** <0.848 N/ABa (ICP) 0.029 0.036 0.000 0.000 0.016 0.019Pb (ICP) 0.031 <0.014 0.190 0.150 0.124 0.083Mo (ICP) <0.004 <0.005 0.010 0.010 0.010 0.000Zn (ICP) <0.004 <0.005 1.070 0.820 0.945 0.177Cu (ICP) 0.005 0.009 0.010 0.010 0.009 0.002F (ISE) <0.02 <0.02 <0.02Cl (ISE) 0.843 N/A 0.843SO4 (IC) <1.31 N/A <1.31NO3 (IC) 12.000 N/A 12.000PO4(IC)** <2.6 N/A <2.6% SOLIDS (105°C) 32.490 32.490% SOLIDS ( 90°C) 28.290 28.290Moles of Na 0.476 0.461 0.504 0.424 0.466 0.033Moles of NO3 0.194 N/A 0.194Moles of Cl 0.024 N/A 0.024*AA Silicon values in italics from HCl/HF dissolution; others from Na2O2 dissolution all anions from Na2O2 fusion with H2O uptake (see text)**water soluble phosphate only; ***acid soluble phosphate
MASS BALANCE SPECIATIONAl(OH)3 23.798NaNO3 16.449SiO2 as Filter Aid 29.042Na6U7O24 5.067Ca-zeolite 3.001AlPO4 3.894SUM 81.251EXCESS moles Na overNaNO3 and Na-U = 0.259

- 44 -
Tank 6 TK-6-1 TK-6-2 TK-6-1 TK-6-2 TANK 6 TANK 6ANALYSIS # 111478 111479 21305 & 6 21307 AVERAGE STANDARDANALYSIS DATE 3/1/88 3/1/88 11/1/88 11/1/88 DEVIATIONRECORDED DPSTN 4475 DPSTN 4475 DPSTN 4725 DPSTN 4725Al (ICP) 9.870 9.740 11.020 9.420 10.013 0.698Ca (ICP) 0.203 0.195 1.180 0.410 0.497 0.466Fe (ICP) <0.004 <0.004 0.850 0.630 0.740 0.156Mg (ICP) 0.102 0.101 0.350 0.200 0.188 0.117Mn (ICP) BDL BDL 2.650 0.420 1.535 1.577Na (ICP) 11.000 8.340 9.670 1.881Na (AA) 9.480 9.180 11.980 10.270 10.228 1.256Li (ICP) <0.002 <0.002 <0.002 <0.002 <0.002Ni (ICP) 0.430 0.420 0.425 0.007Ni (AA) 0.604 0.597 0.601 0.005Si (ICP) 10.800 10.700 11.750 15.990 12.310 2.499Si (AA) 14.760 13.190 17.800 18.200 18.000 0.283Cr (ICP) <0.004 <0.004 0.020 0.020 0.020 0.000B (ICP) <0.002 <0.002 <0.009 0.010 0.010U (D-G) 4.519 3.640 4.080 0.622Sr (ICP) 0.004 0.004 0.010 <0.0005 0.006 0.003Zr (ICP) <0.002 <0.002 0.010 0.010 0.010 0.000Ti (ICP) 0.026 0.026 0.050 0.050 0.038 0.014K (AA) 0.108 0.106 0.107 0.001P (ICP)*** 1.680 1.520 0.650 0.690 1.135 0.541P (Calc IC)** 0.233 0.255 0.244 0.016Ba (ICP) 0.048 0.046 <0.001 <0.001 0.047 0.001Pb (ICP) 0.048 0.021 0.760 0.150 0.245 0.348Mo (ICP) <0.004 <0.004 0.020 0.010 0.015 0.007Zn (ICP) <0.004 <0.004 5.000 0.750 2.875 3.005Cu (ICP) 0.012 0.010 0.040 0.040 0.026 0.017F (ISE) <0.02 N/A <0.02Cl (ISE) 0.060 0.060 0.060 0.000SO4 (IC) <0.5 <0.5 <0.5NO3 (IC) 12.650 13.090 12.870 0.311PO4(IC)** 0.715 0.783 0.749 0.048% SOLIDS (105°C) 37.120 37.120% SOLIDS ( 90°C) 36.980 36.980Moles of Na 0.412 0.399 0.521 0.447 0.445 0.055Moles of NO3 0.204 0.211 0.208 0.005Moles of Cl 0.002 0.002 0.002 0.000*AA Silicon values in italics from HCl/HF dissolution; others from Na2O2 dissolution all anions from Na2O2 fusion with H2O uptake (see text)**water soluble phosphate only; ***acid soluble phosphate
MASS BALANCE SPECIATIONAl(OH)3 24.15NaNO3 17.64Filter Aid 40.05Na6U7O24 5.36Ca-Zeolite-A 4.57AlPO4 3.48SUM 95.26EXCESS moles Na overNaNO3 and Na-U = 0.223

- 45 -
Tank 7 TK-7-1 TK-7-2 TANK 7 TANK 7ANALYSIS # 200076566 200076567 AVERAGE STANDARDANALYSIS DATE 5/12/92 5/12/92 DEVIATIONRECORDED DPSTN 4725 DPSTN 4725Al (ICP) 6.236 6.549 6.392 0.222Ca (ICP) 0.576 0.264 0.420 0.220Fe (ICP) 0.456 0.601 0.529 0.102Mg (ICP) 0.136 0.115 0.125 0.014Mn (ICP) 0.006 0.003 0.005 0.002Na (ICP) 12.863 11.720 12.292 0.808Na (AA) 13.820 13.040 13.430 0.552Li (ICP) <0.001 <0.001 <0.001Ni (ICP) 1.781 1.961 1.871 0.127Ni (AA) 1.837 2.133 1.985 0.209Si (ICP) 15.715 16.023 15.869 0.218Si (AA) 18.260 17.710 17.985 0.389Cr (ICP) <0.004 <0.004 <0.004B (ICP) 0.073 <0.004 0.037U (Chemcheck) 2.880 3.130 3.005 0.177Sr (ICP) <0.000 <0.000 <0.000Zr (ICP) <0.002 <0.002 <0.002Ti (ICP) 0.028 0.019 0.024 0.006K (AA) 0.530 0.630 0.580 0.071P (ICP)*** 1.624 0.651 1.137 0.688P (Calc IC)** 1.931 1.994 1.963 0.045Ba (ICP) <0.00 <0.00 0.000Pb (ICP) <0.020 0.156 0.156Mo (ICP) <0.004 <0.004 <0.004Zn (ICP) 0.171 0.181 0.176 0.007Cu (ICP) <0.001 0.172 0.172F (ISE) 0.050 0.050 0.050 0.000Cl (ISE) 0.700 0.650 0.675 0.035SO4 (IC) 0.271 0.204 0.237 0.047NO3 (IC) 15.260 15.010 15.135 0.177PO4(IC)** 5.922 6.116 6.019 0.137% SOLIDS (105°C) 30.860 30.840 30.850 0.014% SOLIDS ( 90°C) N/A N/A N/A N/AMoles of Na 0.601 0.567 0.584 0.024Moles of NO3 0.246 0.242 0.244 0.003Moles of Cl 0.020 0.018 0.019 0.001*AA Silicon values in italics from HCl/HF dissolution; others from Na2O2 dissolution all anions from Na2O2 fusion with H2O uptake (see text)**water soluble phosphate only; ***acid soluble phosphate
MASS BALANCE SPECIATIONAl(OH)3 13.98NaNO3 20.75Filter Aid 40.27Na6U7O24 3.95Ca-Zeolite-A 3.86AlPO4 3.49SUM 86.291EXCESS moles Na overNaNO3 and Na-U = 0.329
- 46 -
Tank 8 (P42) TK-8-P42-1 TK-8-P42-2 TK-8-P42-1 TK-8-P42-2 TANK 8-P42 TANK 8-P42ANALYSIS # 111480 111481 21308 21309 AVERAGE STANDARDANALYSIS DATE 3/1/88 3/1/88 11/1/88 11/1/88 DEVIATIONRECORDED DPSTN 4475 DPSTN 4475 DPSTN 4725 DPSTN 4725Al (ICP) 10.900 10.700 10.780 10.770 10.788 0.083Ca (ICP) 0.183 0.183 0.340 0.560 0.317 0.178Fe (ICP) <0.004 <0.004 0.440 0.400 0.420 0.028Mg (ICP) 0.096 0.087 0.130 0.160 0.118 0.033Mn (ICP) <0.004 <0.004 0.440 0.770 0.605 0.233Na (ICP) 7.590 5.850 6.720 1.230Na (AA) 6.810 6.730 8.220 7.250 7.253 0.684Li (ICP) <0.002 <0.002 <0.002 <0.002 <0.002Ni (ICP) 0.740 0.740 0.740 0.000Ni (AA) 0.959 0.952 0.956 0.005Si (ICP) 10.900 10.500 11.390 11.510 11.075 0.465Si (AA) 14.260 14.860 14.060 15.030 14.545 0.686Cr (ICP) 0.004 <0.004 0.020 0.020 0.015 0.009B (ICP) <0.002 <0.002 0.010 0.010 0.010 0.000U (D-G) 6.840 6.023 6.432 0.578Sr (ICP) 0.004 0.004 <0.0005 0.010 0.006 0.003Zr (ICP) <0.002 <0.002 0.010 0.010 0.010 0.000Ti (ICP) 0.022 0.020 0.030 0.040 0.028 0.009K (AA) 0.124 0.121 0.123 0.002P (ICP)*** 2.730 2.780 1.350 1.310 2.043 0.823P (Calc IC)** 0.964 1.023 0.993 0.042Ba (ICP) 0.049 0.051 <0.001 <0.001 0.050 0.001Pb (ICP) <0.012 <0.012 0.150 0.220 0.185 0.049Mo (ICP) <0.004 <0.004 0.010 0.010 0.010 0.000Zn (ICP) <0.004 <0.004 0.770 1.280 1.025 0.361Cu (ICP) 0.016 0.011 0.040 0.020 0.022 0.013F (ISE) N/A N/A N/ACl (ISE) 0.059 0.060 0.059 0.001SO4 (IC) <0.5 <0.5 <0.5NO3 (IC) 15.810 16.750 16.280 0.665PO4(IC)** 2.955 3.136 3.046 0.128% SOLIDS (105°C) 34.480 34.480% SOLIDS ( 90°C) 31.650 31.650Moles of Na 0.296 0.293 0.358 0.315 0.315 0.030Moles of NO3 0.255 0.270 0.263 0.011Moles of Cl 0.002 0.002 0.002 0.000*AA Silicon values in italics from HCl/HF dissolution; others from Na2O2 dissolution all anions from Na2O2 fusion with H2O uptake (see text)**water soluble phosphate only; ***acid soluble phosphate
MASS BALANCE SPECIATIONAl(OH)3 24.81NaNO3 22.32Filter Aid 32.64Na6U7O24 8.45Ca-Zeolite-A 2.91AlPO4 6.26SUM 97.39EXCESS moles Na overNaNO3 and Na-U = 0.030
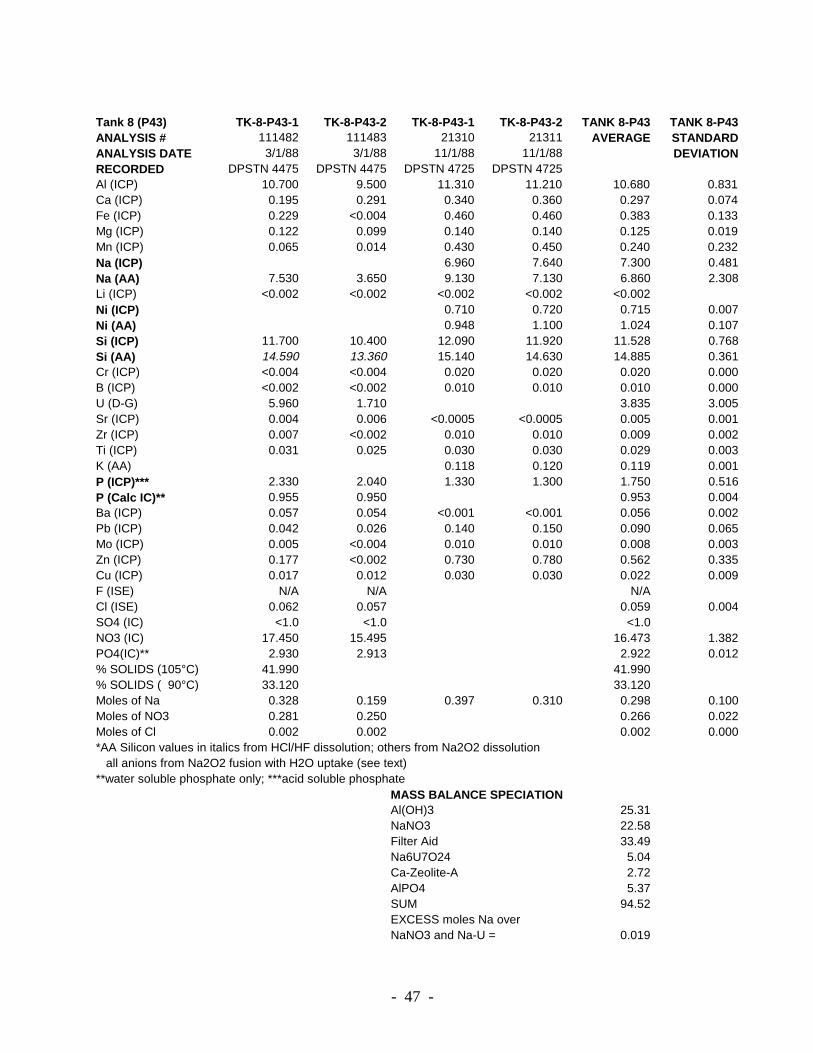
- 47 -
Tank 8 (P43) TK-8-P43-1 TK-8-P43-2 TK-8-P43-1 TK-8-P43-2 TANK 8-P43 TANK 8-P43ANALYSIS # 111482 111483 21310 21311 AVERAGE STANDARDANALYSIS DATE 3/1/88 3/1/88 11/1/88 11/1/88 DEVIATIONRECORDED DPSTN 4475 DPSTN 4475 DPSTN 4725 DPSTN 4725Al (ICP) 10.700 9.500 11.310 11.210 10.680 0.831Ca (ICP) 0.195 0.291 0.340 0.360 0.297 0.074Fe (ICP) 0.229 <0.004 0.460 0.460 0.383 0.133Mg (ICP) 0.122 0.099 0.140 0.140 0.125 0.019Mn (ICP) 0.065 0.014 0.430 0.450 0.240 0.232Na (ICP) 6.960 7.640 7.300 0.481Na (AA) 7.530 3.650 9.130 7.130 6.860 2.308Li (ICP) <0.002 <0.002 <0.002 <0.002 <0.002Ni (ICP) 0.710 0.720 0.715 0.007Ni (AA) 0.948 1.100 1.024 0.107Si (ICP) 11.700 10.400 12.090 11.920 11.528 0.768Si (AA) 14.590 13.360 15.140 14.630 14.885 0.361Cr (ICP) <0.004 <0.004 0.020 0.020 0.020 0.000B (ICP) <0.002 <0.002 0.010 0.010 0.010 0.000U (D-G) 5.960 1.710 3.835 3.005Sr (ICP) 0.004 0.006 <0.0005 <0.0005 0.005 0.001Zr (ICP) 0.007 <0.002 0.010 0.010 0.009 0.002Ti (ICP) 0.031 0.025 0.030 0.030 0.029 0.003K (AA) 0.118 0.120 0.119 0.001P (ICP)*** 2.330 2.040 1.330 1.300 1.750 0.516P (Calc IC)** 0.955 0.950 0.953 0.004Ba (ICP) 0.057 0.054 <0.001 <0.001 0.056 0.002Pb (ICP) 0.042 0.026 0.140 0.150 0.090 0.065Mo (ICP) 0.005 <0.004 0.010 0.010 0.008 0.003Zn (ICP) 0.177 <0.002 0.730 0.780 0.562 0.335Cu (ICP) 0.017 0.012 0.030 0.030 0.022 0.009F (ISE) N/A N/A N/ACl (ISE) 0.062 0.057 0.059 0.004SO4 (IC) <1.0 <1.0 <1.0NO3 (IC) 17.450 15.495 16.473 1.382PO4(IC)** 2.930 2.913 2.922 0.012% SOLIDS (105°C) 41.990 41.990% SOLIDS ( 90°C) 33.120 33.120Moles of Na 0.328 0.159 0.397 0.310 0.298 0.100Moles of NO3 0.281 0.250 0.266 0.022Moles of Cl 0.002 0.002 0.002 0.000*AA Silicon values in italics from HCl/HF dissolution; others from Na2O2 dissolution all anions from Na2O2 fusion with H2O uptake (see text)**water soluble phosphate only; ***acid soluble phosphate
MASS BALANCE SPECIATIONAl(OH)3 25.31NaNO3 22.58Filter Aid 33.49Na6U7O24 5.04Ca-Zeolite-A 2.72AlPO4 5.37SUM 94.52EXCESS moles Na overNaNO3 and Na-U = 0.019
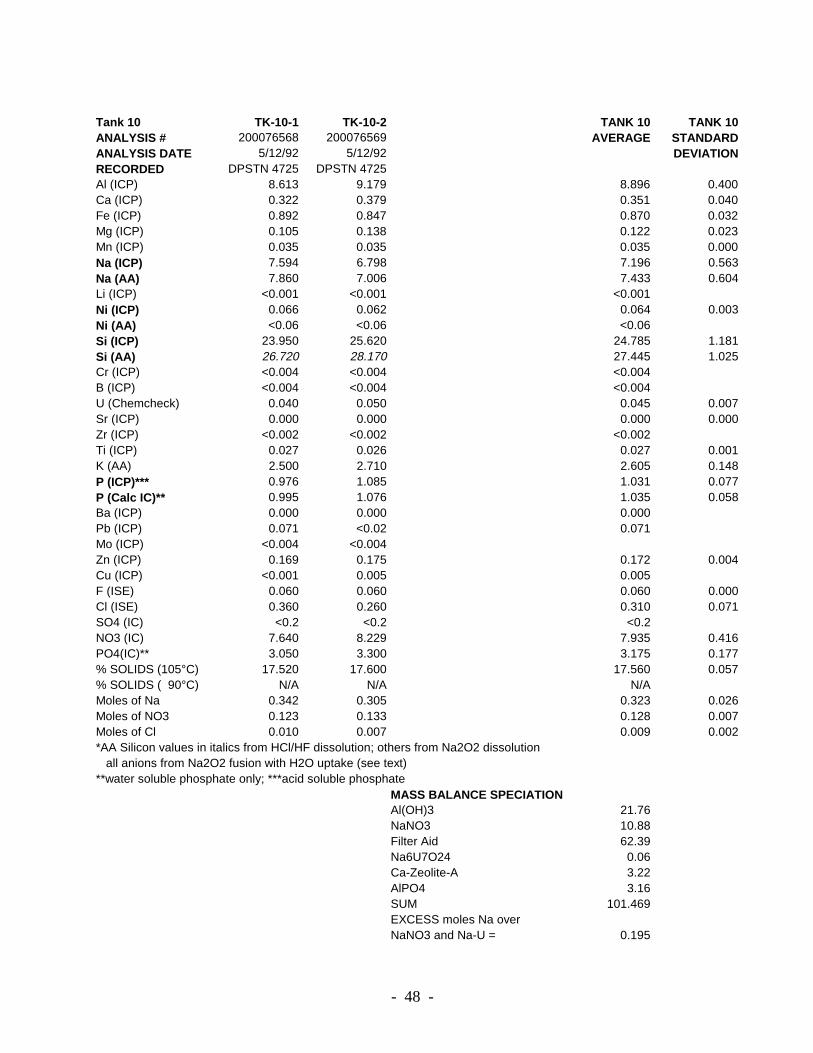
- 48 -
Tank 10 TK-10-1 TK-10-2 TANK 10 TANK 10ANALYSIS # 200076568 200076569 AVERAGE STANDARDANALYSIS DATE 5/12/92 5/12/92 DEVIATIONRECORDED DPSTN 4725 DPSTN 4725Al (ICP) 8.613 9.179 8.896 0.400Ca (ICP) 0.322 0.379 0.351 0.040Fe (ICP) 0.892 0.847 0.870 0.032Mg (ICP) 0.105 0.138 0.122 0.023Mn (ICP) 0.035 0.035 0.035 0.000Na (ICP) 7.594 6.798 7.196 0.563Na (AA) 7.860 7.006 7.433 0.604Li (ICP) <0.001 <0.001 <0.001Ni (ICP) 0.066 0.062 0.064 0.003Ni (AA) <0.06 <0.06 <0.06Si (ICP) 23.950 25.620 24.785 1.181Si (AA) 26.720 28.170 27.445 1.025Cr (ICP) <0.004 <0.004 <0.004B (ICP) <0.004 <0.004 <0.004U (Chemcheck) 0.040 0.050 0.045 0.007Sr (ICP) 0.000 0.000 0.000 0.000Zr (ICP) <0.002 <0.002 <0.002Ti (ICP) 0.027 0.026 0.027 0.001K (AA) 2.500 2.710 2.605 0.148P (ICP)*** 0.976 1.085 1.031 0.077P (Calc IC)** 0.995 1.076 1.035 0.058Ba (ICP) 0.000 0.000 0.000Pb (ICP) 0.071 <0.02 0.071Mo (ICP) <0.004 <0.004Zn (ICP) 0.169 0.175 0.172 0.004Cu (ICP) <0.001 0.005 0.005F (ISE) 0.060 0.060 0.060 0.000Cl (ISE) 0.360 0.260 0.310 0.071SO4 (IC) <0.2 <0.2 <0.2NO3 (IC) 7.640 8.229 7.935 0.416PO4(IC)** 3.050 3.300 3.175 0.177% SOLIDS (105°C) 17.520 17.600 17.560 0.057% SOLIDS ( 90°C) N/A N/A N/AMoles of Na 0.342 0.305 0.323 0.026Moles of NO3 0.123 0.133 0.128 0.007Moles of Cl 0.010 0.007 0.009 0.002*AA Silicon values in italics from HCl/HF dissolution; others from Na2O2 dissolution all anions from Na2O2 fusion with H2O uptake (see text)**water soluble phosphate only; ***acid soluble phosphate
MASS BALANCE SPECIATIONAl(OH)3 21.76NaNO3 10.88Filter Aid 62.39Na6U7O24 0.06Ca-Zeolite-A 3.22AlPO4 3.16SUM 101.469EXCESS moles Na overNaNO3 and Na-U = 0.195
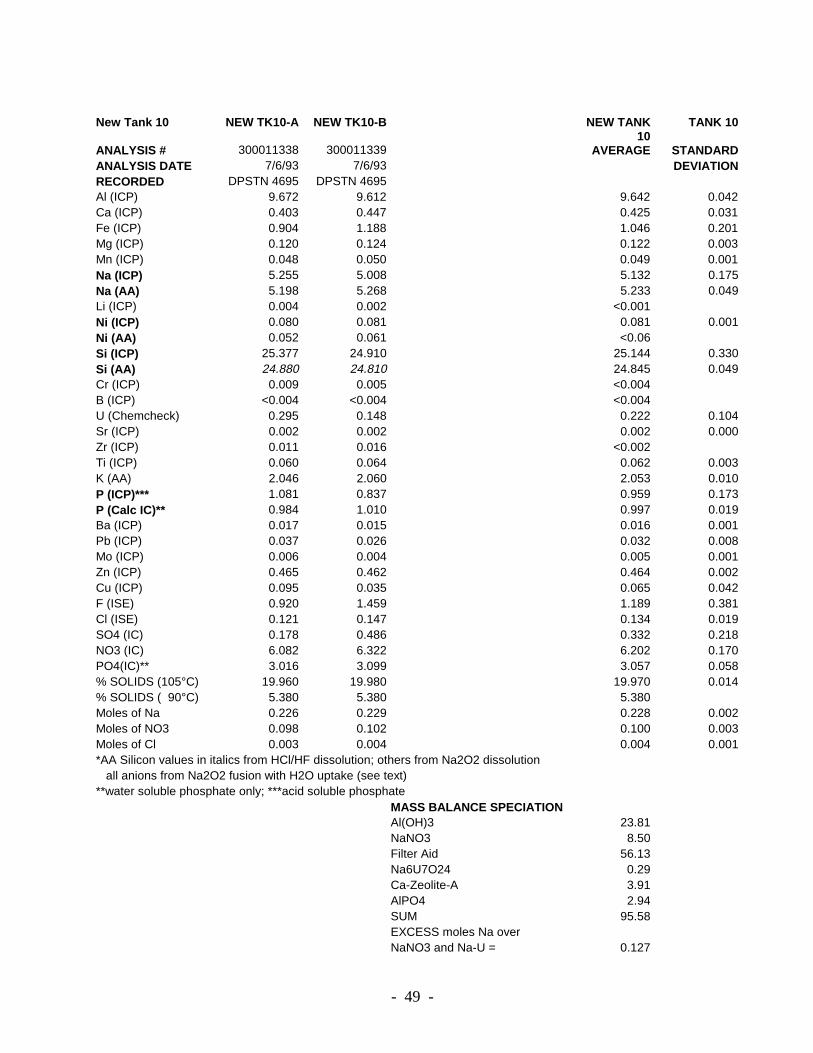
- 49 -
New Tank 10 NEW TK10-A NEW TK10-B NEW TANK10
TANK 10
ANALYSIS # 300011338 300011339 AVERAGE STANDARDANALYSIS DATE 7/6/93 7/6/93 DEVIATIONRECORDED DPSTN 4695 DPSTN 4695Al (ICP) 9.672 9.612 9.642 0.042Ca (ICP) 0.403 0.447 0.425 0.031Fe (ICP) 0.904 1.188 1.046 0.201Mg (ICP) 0.120 0.124 0.122 0.003Mn (ICP) 0.048 0.050 0.049 0.001Na (ICP) 5.255 5.008 5.132 0.175Na (AA) 5.198 5.268 5.233 0.049Li (ICP) 0.004 0.002 <0.001Ni (ICP) 0.080 0.081 0.081 0.001Ni (AA) 0.052 0.061 <0.06Si (ICP) 25.377 24.910 25.144 0.330Si (AA) 24.880 24.810 24.845 0.049Cr (ICP) 0.009 0.005 <0.004B (ICP) <0.004 <0.004 <0.004U (Chemcheck) 0.295 0.148 0.222 0.104Sr (ICP) 0.002 0.002 0.002 0.000Zr (ICP) 0.011 0.016 <0.002Ti (ICP) 0.060 0.064 0.062 0.003K (AA) 2.046 2.060 2.053 0.010P (ICP)*** 1.081 0.837 0.959 0.173P (Calc IC)** 0.984 1.010 0.997 0.019Ba (ICP) 0.017 0.015 0.016 0.001Pb (ICP) 0.037 0.026 0.032 0.008Mo (ICP) 0.006 0.004 0.005 0.001Zn (ICP) 0.465 0.462 0.464 0.002Cu (ICP) 0.095 0.035 0.065 0.042F (ISE) 0.920 1.459 1.189 0.381Cl (ISE) 0.121 0.147 0.134 0.019SO4 (IC) 0.178 0.486 0.332 0.218NO3 (IC) 6.082 6.322 6.202 0.170PO4(IC)** 3.016 3.099 3.057 0.058% SOLIDS (105°C) 19.960 19.980 19.970 0.014% SOLIDS ( 90°C) 5.380 5.380 5.380Moles of Na 0.226 0.229 0.228 0.002Moles of NO3 0.098 0.102 0.100 0.003Moles of Cl 0.003 0.004 0.004 0.001*AA Silicon values in italics from HCl/HF dissolution; others from Na2O2 dissolution all anions from Na2O2 fusion with H2O uptake (see text)**water soluble phosphate only; ***acid soluble phosphate
MASS BALANCE SPECIATIONAl(OH)3 23.81NaNO3 8.50Filter Aid 56.13Na6U7O24 0.29Ca-Zeolite-A 3.91AlPO4 2.94SUM 95.58EXCESS moles Na overNaNO3 and Na-U = 0.127

- 50 -
This page intentionally left blank.
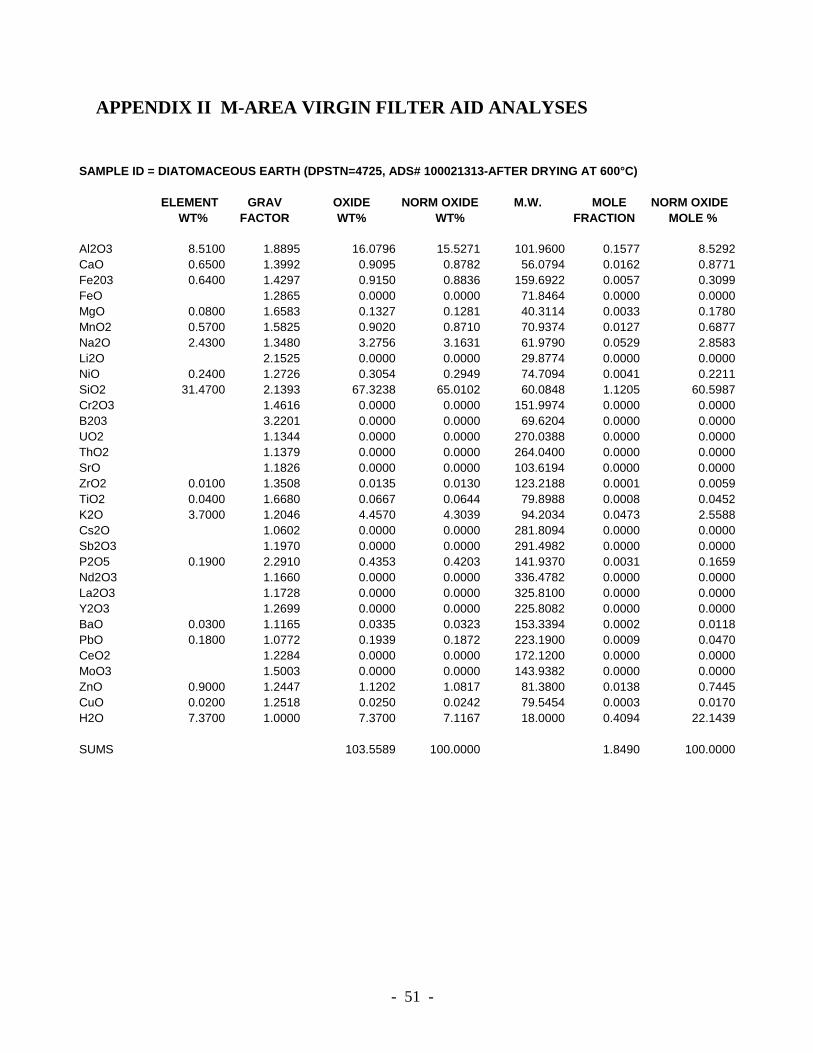
- 51 -
APPENDIX II M-AREA VIRGIN FILTER AID ANALYSES
SAMPLE ID = DIATOMACEOUS EARTH (DPSTN=4725, ADS# 100021313-AFTER DRYING AT 600°C)
ELEMENT GRAV OXIDE NORM OXIDE M.W. MOLE NORM OXIDE WT% FACTOR WT% WT% FRACTION MOLE %
Al2O3 8.5100 1.8895 16.0796 15.5271 101.9600 0.1577 8.5292CaO 0.6500 1.3992 0.9095 0.8782 56.0794 0.0162 0.8771Fe203 0.6400 1.4297 0.9150 0.8836 159.6922 0.0057 0.3099FeO 1.2865 0.0000 0.0000 71.8464 0.0000 0.0000MgO 0.0800 1.6583 0.1327 0.1281 40.3114 0.0033 0.1780MnO2 0.5700 1.5825 0.9020 0.8710 70.9374 0.0127 0.6877Na2O 2.4300 1.3480 3.2756 3.1631 61.9790 0.0529 2.8583Li2O 2.1525 0.0000 0.0000 29.8774 0.0000 0.0000NiO 0.2400 1.2726 0.3054 0.2949 74.7094 0.0041 0.2211SiO2 31.4700 2.1393 67.3238 65.0102 60.0848 1.1205 60.5987Cr2O3 1.4616 0.0000 0.0000 151.9974 0.0000 0.0000B203 3.2201 0.0000 0.0000 69.6204 0.0000 0.0000UO2 1.1344 0.0000 0.0000 270.0388 0.0000 0.0000ThO2 1.1379 0.0000 0.0000 264.0400 0.0000 0.0000SrO 1.1826 0.0000 0.0000 103.6194 0.0000 0.0000ZrO2 0.0100 1.3508 0.0135 0.0130 123.2188 0.0001 0.0059TiO2 0.0400 1.6680 0.0667 0.0644 79.8988 0.0008 0.0452K2O 3.7000 1.2046 4.4570 4.3039 94.2034 0.0473 2.5588Cs2O 1.0602 0.0000 0.0000 281.8094 0.0000 0.0000Sb2O3 1.1970 0.0000 0.0000 291.4982 0.0000 0.0000P2O5 0.1900 2.2910 0.4353 0.4203 141.9370 0.0031 0.1659Nd2O3 1.1660 0.0000 0.0000 336.4782 0.0000 0.0000La2O3 1.1728 0.0000 0.0000 325.8100 0.0000 0.0000Y2O3 1.2699 0.0000 0.0000 225.8082 0.0000 0.0000BaO 0.0300 1.1165 0.0335 0.0323 153.3394 0.0002 0.0118PbO 0.1800 1.0772 0.1939 0.1872 223.1900 0.0009 0.0470CeO2 1.2284 0.0000 0.0000 172.1200 0.0000 0.0000MoO3 1.5003 0.0000 0.0000 143.9382 0.0000 0.0000ZnO 0.9000 1.2447 1.1202 1.0817 81.3800 0.0138 0.7445CuO 0.0200 1.2518 0.0250 0.0242 79.5454 0.0003 0.0170H2O 7.3700 1.0000 7.3700 7.1167 18.0000 0.4094 22.1439
SUMS 103.5589 100.0000 1.8490 100.0000
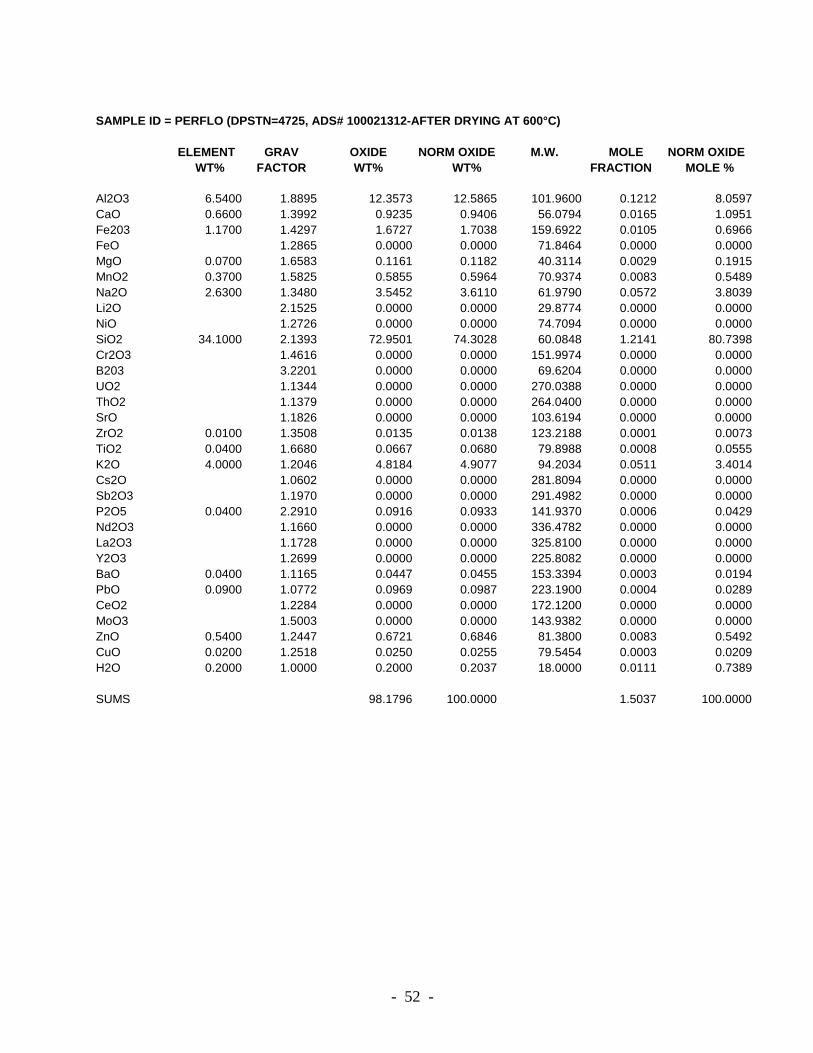
- 52 -
SAMPLE ID = PERFLO (DPSTN=4725, ADS# 100021312-AFTER DRYING AT 600°C)
ELEMENT GRAV OXIDE NORM OXIDE M.W. MOLE NORM OXIDE WT% FACTOR WT% WT% FRACTION MOLE %
Al2O3 6.5400 1.8895 12.3573 12.5865 101.9600 0.1212 8.0597CaO 0.6600 1.3992 0.9235 0.9406 56.0794 0.0165 1.0951Fe203 1.1700 1.4297 1.6727 1.7038 159.6922 0.0105 0.6966FeO 1.2865 0.0000 0.0000 71.8464 0.0000 0.0000MgO 0.0700 1.6583 0.1161 0.1182 40.3114 0.0029 0.1915MnO2 0.3700 1.5825 0.5855 0.5964 70.9374 0.0083 0.5489Na2O 2.6300 1.3480 3.5452 3.6110 61.9790 0.0572 3.8039Li2O 2.1525 0.0000 0.0000 29.8774 0.0000 0.0000NiO 1.2726 0.0000 0.0000 74.7094 0.0000 0.0000SiO2 34.1000 2.1393 72.9501 74.3028 60.0848 1.2141 80.7398Cr2O3 1.4616 0.0000 0.0000 151.9974 0.0000 0.0000B203 3.2201 0.0000 0.0000 69.6204 0.0000 0.0000UO2 1.1344 0.0000 0.0000 270.0388 0.0000 0.0000ThO2 1.1379 0.0000 0.0000 264.0400 0.0000 0.0000SrO 1.1826 0.0000 0.0000 103.6194 0.0000 0.0000ZrO2 0.0100 1.3508 0.0135 0.0138 123.2188 0.0001 0.0073TiO2 0.0400 1.6680 0.0667 0.0680 79.8988 0.0008 0.0555K2O 4.0000 1.2046 4.8184 4.9077 94.2034 0.0511 3.4014Cs2O 1.0602 0.0000 0.0000 281.8094 0.0000 0.0000Sb2O3 1.1970 0.0000 0.0000 291.4982 0.0000 0.0000P2O5 0.0400 2.2910 0.0916 0.0933 141.9370 0.0006 0.0429Nd2O3 1.1660 0.0000 0.0000 336.4782 0.0000 0.0000La2O3 1.1728 0.0000 0.0000 325.8100 0.0000 0.0000Y2O3 1.2699 0.0000 0.0000 225.8082 0.0000 0.0000BaO 0.0400 1.1165 0.0447 0.0455 153.3394 0.0003 0.0194PbO 0.0900 1.0772 0.0969 0.0987 223.1900 0.0004 0.0289CeO2 1.2284 0.0000 0.0000 172.1200 0.0000 0.0000MoO3 1.5003 0.0000 0.0000 143.9382 0.0000 0.0000ZnO 0.5400 1.2447 0.6721 0.6846 81.3800 0.0083 0.5492CuO 0.0200 1.2518 0.0250 0.0255 79.5454 0.0003 0.0209H2O 0.2000 1.0000 0.2000 0.2037 18.0000 0.0111 0.7389
SUMS 98.1796 100.0000 1.5037 100.0000

- 53 -
SAMPLE ID = PERLITE 2000X (DPSTN=4725, ADS# 200002283-AFTER MELTING AT 1150°C)
ELEMENT GRAV OXIDE NORM OXIDE M.W. MOLE NORM OXIDE WT% FACTOR WT% WT% FRACTION MOLE %
Al2O3 6.6040 1.8895 12.4783 12.5644 101.9600 0.1224 8.0277CaO 0.5010 1.3992 0.7010 0.7058 56.0794 0.0125 0.8199Fe203 0.6160 1.4297 0.8807 0.8868 159.6922 0.0055 0.3617FeO 1.2865 0.0000 0.0000 71.8464 0.0000 0.0000MgO 0.0630 1.6583 0.1045 0.1052 40.3114 0.0026 0.1700MnO2 0.0650 1.5825 0.1029 0.1036 70.9374 0.0015 0.0951Na2O 3.3230 1.3480 4.4794 4.5103 61.9790 0.0723 4.7407Li2O 2.1525 0.0000 0.0000 29.8774 0.0000 0.0000NiO <0.005 1.2726 0.0000 0.0000 74.7094 0.0000 0.0000SiO2 34.9410 2.1393 74.7493 75.2652 60.0848 1.2441 81.6034Cr2O3 1.4616 0.0000 0.0000 151.9974 0.0000 0.0000B203 3.2201 0.0000 0.0000 69.6204 0.0000 0.0000UO2 1.1344 0.0000 0.0000 270.0388 0.0000 0.0000ThO2 1.1379 0.0000 0.0000 264.0400 0.0000 0.0000SrO 1.1826 0.0000 0.0000 103.6194 0.0000 0.0000ZrO2 0.0080 1.3508 0.0108 0.0109 123.2188 0.0001 0.0058TiO2 0.0370 1.6680 0.0617 0.0621 79.8988 0.0008 0.0507K2O 4.5020 1.2046 5.4231 5.4605 94.2034 0.0576 3.7761Cs2O 1.0602 0.0000 0.0000 281.8094 0.0000 0.0000Sb2O3 1.1970 0.0000 0.0000 291.4982 0.0000 0.0000P2O5 0.0130 2.2910 0.0298 0.0300 141.9370 0.0002 0.0138Nd2O3 1.1660 0.0000 0.0000 336.4782 0.0000 0.0000La2O3 1.1728 0.0000 0.0000 325.8100 0.0000 0.0000Y2O3 1.2699 0.0000 0.0000 225.8082 0.0000 0.0000BaO 0.0360 1.1165 0.0402 0.0405 153.3394 0.0003 0.0172PbO <0.019 1.0772 0.0000 0.0000 223.1900 0.0000 0.0000CeO2 1.2284 0.0000 0.0000 172.1200 0.0000 0.0000MoO3 1.5003 0.0000 0.0000 143.9382 0.0000 0.0000ZnO 0.1510 1.2447 0.1879 0.1892 81.3800 0.0023 0.1515CuO 0.0200 1.2518 0.0250 0.0252 79.5454 0.0003 0.0206H2O 0.0400 1.0000 0.0400 0.0403 18.0000 0.0022 0.1458
SUMS 99.3146 100.0000 1.5245 100.0000
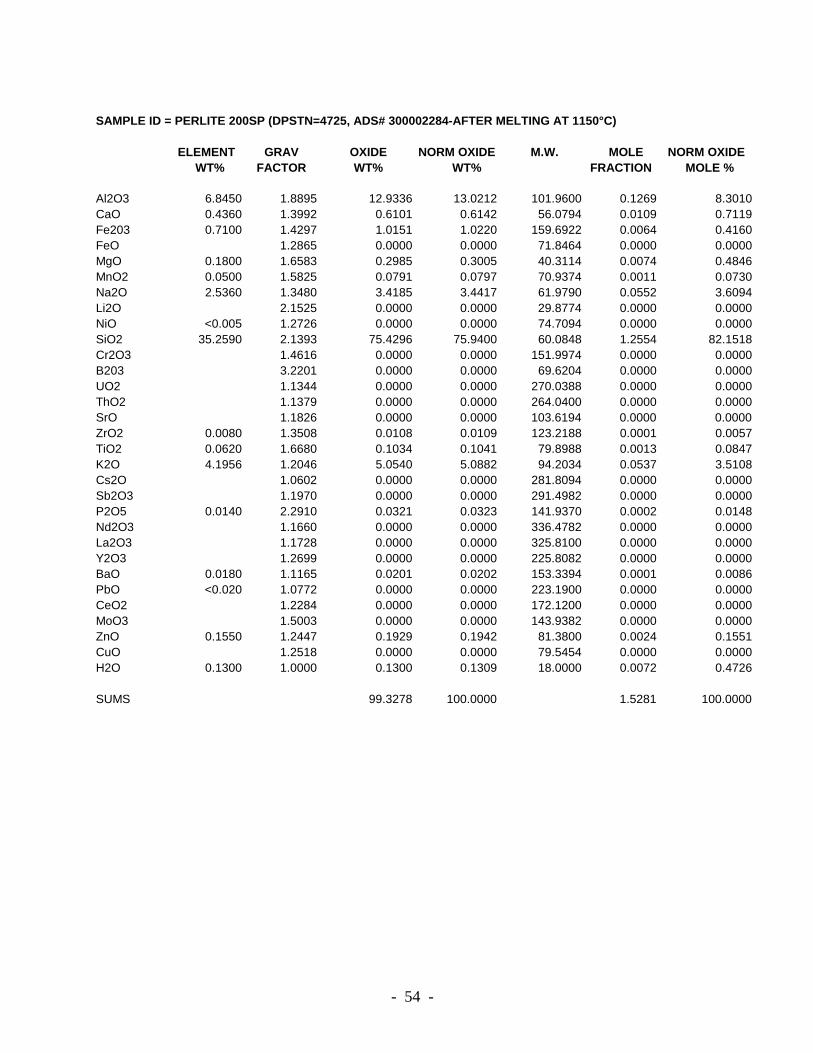
- 54 -
SAMPLE ID = PERLITE 200SP (DPSTN=4725, ADS# 300002284-AFTER MELTING AT 1150°C)
ELEMENT GRAV OXIDE NORM OXIDE M.W. MOLE NORM OXIDE WT% FACTOR WT% WT% FRACTION MOLE %
Al2O3 6.8450 1.8895 12.9336 13.0212 101.9600 0.1269 8.3010CaO 0.4360 1.3992 0.6101 0.6142 56.0794 0.0109 0.7119Fe203 0.7100 1.4297 1.0151 1.0220 159.6922 0.0064 0.4160FeO 1.2865 0.0000 0.0000 71.8464 0.0000 0.0000MgO 0.1800 1.6583 0.2985 0.3005 40.3114 0.0074 0.4846MnO2 0.0500 1.5825 0.0791 0.0797 70.9374 0.0011 0.0730Na2O 2.5360 1.3480 3.4185 3.4417 61.9790 0.0552 3.6094Li2O 2.1525 0.0000 0.0000 29.8774 0.0000 0.0000NiO <0.005 1.2726 0.0000 0.0000 74.7094 0.0000 0.0000SiO2 35.2590 2.1393 75.4296 75.9400 60.0848 1.2554 82.1518Cr2O3 1.4616 0.0000 0.0000 151.9974 0.0000 0.0000B203 3.2201 0.0000 0.0000 69.6204 0.0000 0.0000UO2 1.1344 0.0000 0.0000 270.0388 0.0000 0.0000ThO2 1.1379 0.0000 0.0000 264.0400 0.0000 0.0000SrO 1.1826 0.0000 0.0000 103.6194 0.0000 0.0000ZrO2 0.0080 1.3508 0.0108 0.0109 123.2188 0.0001 0.0057TiO2 0.0620 1.6680 0.1034 0.1041 79.8988 0.0013 0.0847K2O 4.1956 1.2046 5.0540 5.0882 94.2034 0.0537 3.5108Cs2O 1.0602 0.0000 0.0000 281.8094 0.0000 0.0000Sb2O3 1.1970 0.0000 0.0000 291.4982 0.0000 0.0000P2O5 0.0140 2.2910 0.0321 0.0323 141.9370 0.0002 0.0148Nd2O3 1.1660 0.0000 0.0000 336.4782 0.0000 0.0000La2O3 1.1728 0.0000 0.0000 325.8100 0.0000 0.0000Y2O3 1.2699 0.0000 0.0000 225.8082 0.0000 0.0000BaO 0.0180 1.1165 0.0201 0.0202 153.3394 0.0001 0.0086PbO <0.020 1.0772 0.0000 0.0000 223.1900 0.0000 0.0000CeO2 1.2284 0.0000 0.0000 172.1200 0.0000 0.0000MoO3 1.5003 0.0000 0.0000 143.9382 0.0000 0.0000ZnO 0.1550 1.2447 0.1929 0.1942 81.3800 0.0024 0.1551CuO 1.2518 0.0000 0.0000 79.5454 0.0000 0.0000H2O 0.1300 1.0000 0.1300 0.1309 18.0000 0.0072 0.4726
SUMS 99.3278 100.0000 1.5281 100.0000