viva energy reit trust financial report
TRANSCRIPT

1
VIVA ENERGY REIT TRUST ARSN 613 146 464
FINANCIAL REPORT
For the Year Ended 31 December 2019
Contents
Directors’ Report 2
Auditor’s Independence Declaration 9
Financial Statements 10
Directors’ Declaration 38
Independent Auditor’s Report 39
Corporate Directory 44

VIVA ENERGY REIT TRUST 31 DECEMBER 2019 FINANCIAL REPORT
2
DIRECTORS' REPORT The directors of VER Limited (‘Responsible Entity’), the responsible entity of Viva Energy REIT Trust (‘Trust’), present their report and the financial statements for the year ended 31 December 2019 for Viva Energy REIT Trust. The Trust formed a stapled group with Viva Energy REIT Limited on 3 August 2016 when Viva Energy REIT Limited and the Trust were stapled. The Trust and Viva Energy REIT Limited are separate entities for which the units and shares have been stapled together to enable trading as one security. The stapled securities trade on the Australian Securities Exchange (‘ASX’) under the code VVR. Each stapled security consists of one share in Viva Energy REIT Limited and one unit in the Trust. The units of the Trust and the shares of Viva Energy REIT Limited cannot be traded separately. For the results of the stapled group, refer to the Viva Energy REIT Group (Group) annual report for the year to 31 December 2019. Directors of VER Limited The following persons were directors of VER Limited during the whole of the financial year and up to the date of this report: Laurence Brindle Independent Non-executive Chairman Georgina Lynch Independent Non-executive Director Stephen Newton Independent Non-executive Director Lachlan Pfeiffer Non-independent Non-executive Director. Tina Mitas was appointed as Company Secretary on 15 May 2018 and continues in office at the date of this report. Principal activities During the period, the principal activity of Viva Energy REIT Trust was investment in service station property. Viva Energy REIT Trust owns a portfolio of 469 service station properties located in all Australian states and mainland territories. The properties in the portfolio are leased on a long-term basis to Viva Energy Australia Pty Limited, other service station operators and various convenience and fast food store operators. Operating and financial review
The Trust is part of Viva Energy REIT Group (‘Group’), a stapled group. Investors should refer to the operating and financial review prepared for Viva Energy REIT Group set out in the financial statements of the Viva Energy REIT Group lodged with the ASX on 20 February 2020. A separate operating and financial review for the Trust has not been prepared as investors should consider the operations of the stapled group in its entirety.

VIVA ENERGY REIT TRUST 31 DECEMBER 2019 FINANCIAL REPORT
3
Distribution to unit holders Distributions paid to unit holders during the financial year were as follows:
2019 2018
$'000 $'000
Final distribution for the period ended 31 December 2018 – 7.03 cents per security 51,020 -
Interim distribution for the half year ended 30 June 2019 – 7.18 cents per security 55,694 -
Final distribution for year ended 31 December 2017 – 6.60 cents per security - 47,899
Interim distribution for the half year ended 30 June 2018 – 6.99 cents per security - 50,731
Total distributions paid
106,714
98,630
On 19 December 2019 the directors announced the payment of an estimated final distribution of $56.0 million for the year ended 31 December 2019. This represents 7.19 cents per unit and is expected to be paid on 27 February 2020. Significant changes in state of affairs There was no significant change in the state of affairs of the Trust that occurred during the year ended 31 December 2019. Matters subsequent to the end of the financial year Subsequent to the end of the financial year:
• The directors have confirmed the payment of a final distribution for the year ended 31 December 2019 of $56.0 million which is expected to be paid on 27 February 2020;
• On 8 January 2020 funds have been drawn down from one of the syndicated facilities for $56.0 million to fund this distribution; and
• Three investment properties with a purchase price of $20.0 million which was contracted before 31 December 2019 were settled during January and February 2020.
No other matter or circumstance has arisen since 31 December 2019 that has significantly affected, or may significantly affect:
• the operations of the Trust in future financial years; • the results of those operations in future financial years; or • the state of affairs of the Trust in future financial years.
Likely developments and expected results of operations The Trust will continue to be managed in accordance with its existing investment objectives and guidelines. The results of the Trust’s operations will be affected by a number of factors, including, but not limited to, the performance of the property investment market. Investment performance is not guaranteed and future returns may differ from past returns. As investment conditions change over time, past returns should not be used to predict future returns.

VIVA ENERGY REIT TRUST 31 DECEMBER 2019 FINANCIAL REPORT
4
Material business risks The Responsible Entity has adopted a Compliance Plan which sets out the key processes, systems and measures that the Responsible Entity will apply in operating the Trust. The Compliance Plan also includes a compliance management and reporting structure. The material business risks that could adversely affect the achievement of the Trust’s financial prospects include the following: Tenant concentration risk, financial standing and sector concentration risk
97% of the Trust’s rental income is received from Viva Energy Australia Pty Limited (‘Viva Energy Australia’). If Viva Energy Australia’s financial standing materially deteriorates, Viva Energy Australia’s ability to make rental payments to Viva Energy REIT may be adversely impacted, which may have a materially adverse impact on the Trust’s results of operations, financial position and ability to service and/or obtain financing. Furthermore, a material decline in the profitability of Viva Energy Australia’s business could affect the perceived stability of the rental income of Viva Energy REIT and may affect Viva Energy REIT’s ability to obtain financing on acceptable terms, and lead to lesser capacity to pay market rents when renewal options are exercised and a decline in the values of Viva Energy REIT’s investment properties. Termination of Viva Energy Australia’s right to use Shell branding could adversely affect Viva Energy Australia’s ability to meet its rental obligations and therefore the value of Viva Energy REIT’s portfolio of investment properties and its ability to service and/or obtain financing. Investment property value
The value of the Group’s portfolio of investment properties may be adversely affected by a number of other factors, including of factors outside the control of the Group, such as supply and demand for service station properties, general property market conditions, the availability and cost of credit, the ability to attract and implement economically viable rental arrangements, Viva Energy Australia’s financial condition deteriorating, occupiers not extending the term of leases, re-leasing of properties, capitalisation rates and general economic factors such as the level of inflation and interest rates. As changes in valuations are recorded on the statutory net profit statement, any decreases in value will have a negative impact on the statutory net profit statement and net tangible assets per security and in turn the market price of the Group’s securities may fall. Environmental and climate risk
The Group depends on its tenants to perform their obligations under various environmental arrangements in relation to properties they lease. If the tenants were to fail to meet their obligations under these arrangements (including due to their insolvency), the Trust may incur significant costs to rectify contamination on its properties and also on other properties which may be consequently impacted. The Trust is subject to a range of regulatory regimes that cover the specific assets of the Trust and how they are operated and the Trust’s Australian Financial Services Licence (‘AFSL’). These regulatory regimes are subject to ongoing review and change which may increase the cost of compliance, reporting and maintenance of the Trust’s assets. Extreme weather and other climate change related events have the potential to damage the Group’s assets and disrupt the tenants’ operations. Such events may increase costs for maintenance and insurance of the Group’s assets, and may affect the ability to re-lease the Group’s investment properties in the future and the rent levels for which they can be leased, thereby affecting future investment property valuations and rental cash flows. Insurance may not be able to be obtained at all.

VIVA ENERGY REIT TRUST 31 DECEMBER 2019 FINANCIAL REPORT
5
The precise nature of these risks is uncertain as it depends on complex factors such as policy change, technology development, market forces, and the links between these factors and climatic conditions.
Cash flow and fair value interest rate risk
The Group’s cash and cash equivalents, floating rate borrowings and interest rate swaps expose it to a risk of change in the fair value or future cash flows due to changes in interest rates. The Group economically hedges some or all of its exposure to changes in interest rates on variable rate borrowings by using floating-to-fixed interest rate swaps. By hedging against changes in interest rates, the Group has limited its exposure to changes in interest rates on its cash flows. Liquidity risk
Liquidity risk is the risk that the Group may not be able to generate sufficient cash resources to settle its obligations in full as they fall due or can only do so on terms that are materially disadvantageous. The Group monitors its exposure to liquidity risk by ensuring that there is sufficient cash on hand as required or debt facility funding available to meet financial liabilities as they fall due. Debt agreement and refinancing risk
The Group has outstanding debt facilities. General economic and business conditions that impact the debt or equity markets could impact the Group’s ability to refinance its debt facilities when required. If the covenants in these facilities are breached by the Group this may result in the Group being subject to increased interest rate margins and covenants restricting its ability to engage in certain types of activities or to pay distributions to unitholders. Debt may not be able to be obtained at all. If debt facilities are not available or are not available in adequate volume the Group may need to sell assets to repay debt. There is no guarantee that there will be willing purchasers for the Group’s assets or that purchasers will pay prices at or greater than book value of these investment properties. If Viva Energy Australia Pty Limited ceases to beneficially own and control, either directly or indirectly, at least 20% of the securities of Viva Energy REIT by selling or transferring its interest, or an entity other than a member of the Viva Energy Group controls Viva Energy REIT, then this would constitute a review event under the terms of the Group’s debt facility agreements, and (subject to specified negotiation and notification periods) a repayment of the Group’s debt facilities may be required. The directors regularly monitor the debt facility covenants to ensure compliance and consider the refinancing options and timing available to the Group. Personnel risk
Viva Energy REIT is managed by VER Manager Pty Limited (‘Manager’), which is a subsidiary of Viva Energy Group Limited. Viva Energy REIT does not have direct employees (other than non-executive directors) and consequently is reliant on the expertise and experience of the key executives of Viva Energy Group Limited made available to the Manager which provides the services to Viva Energy REIT under the Management Agreement. As a consequence, loss of such key personnel could potentially have an adverse impact on the management and the financial performance of Viva Energy REIT and in turn may affect the returns to security holders.

VIVA ENERGY REIT TRUST 31 DECEMBER 2019 FINANCIAL REPORT
6
Environmental regulation As a landlord, the operations of the Group are subject to a range of environmental laws and regulations under Commonwealth, state and territory law. However, the lease attaching to each investment property requires that the tenant manages the environmental conditions at each site and indemnifies the Group for any contamination caused by their operations. The Group did not receive any environmental infringements or notices from environmental regulators in the year ended 31 December 2019. Information on Directors and Officers Laurence Brindle Independent Non-executive Chairman, Member of the Audit and Risk Management Committee Laurence has extensive experience in funds management, finance and investment and is currently independent non-executive chairman of National Storage REIT. Until 2009, Laurence was an executive with Queensland Investment Corporation (‘QIC’). During his 21 years with QIC, he served in various senior positions including Head of Global Real Estate, where he was responsible for QIC’s large global investment portfolio. Laurence was also a long-term member of QIC’s Investment Strategy Committee. Laurence provides advice to a number of investment institutions on real estate investment and funds management matters. He is a former chairman of the Shopping Centre Council of Australia and a former director of Westfield Retail Trust and Scentre Group. Laurence holds a Bachelor of Engineering (Honours) and a Bachelor of Commerce from the University of Queensland, and a Masters of Business Administration from Cass Business School, London, where he graduated with distinction. Georgina Lynch Independent Non-executive Director, Member of the Audit and Risk Management Committee Georgina has over 25 years’ experience in the financial services and property industry. She is currently independent non-executive Chair of Cbus Property, non-executive Director of Investec Property Limited, and a non-executive Director of Tassal Group Limited and a member of their audit and risk management committee and remuneration committee. Georgina has significant global experience in corporate transactions, capital raisings, initial public offerings (IPOs), funds management, corporate strategy and acquisitions and divestments. Georgina holds a Bachelor of Arts and Bachelor of Laws Degree. Stephen Newton Independent Non-executive Director, Chair of the Audit and Risk Management Committee Stephen has extensive industry experience spanning in excess of 40 years across real estate investment and funds management, development and property management, as well as in infrastructure investment and management. Stephen has been a Principal of Arcadia Funds Management for more than 15 years. Prior to that, Stephen held various senior executive positions at Lend Lease over 22 years.

VIVA ENERGY REIT TRUST 31 DECEMBER 2019 FINANCIAL REPORT
7
Stephen is currently a non-executive director of Stockland Property Group, BAI Communications Group (formerly Broadcast Australia Group) and Sydney Catholic Schools Ltd. Stephen was formerly a director of Gateway Lifestyle Group. Stephen is a member of both Chartered Accountants Australia and New Zealand and the Australian Institute of Company Directors. He holds a Bachelor of Arts (Economics and Accounting) degree from Macquarie University and a Masters of Commerce post graduate degree from The University of New South Wales. Lachlan Pfeiffer Non-independent Non-executive Director, Member of the Audit and Risk Management Committee
Lachlan is the Executive General Manager of Legal and External Affairs of Viva Energy Group Limited. Lachlan has over 5 years’ experience managing corporate affairs functions at Viva Energy Group, including legal, governance, external relations, sustainability and significant projects. Prior to joining Viva Energy, Lachlan spent over 10 years' working in corporate law, specialising in mergers and acquisitions, private equity, corporate finance and debt and equity capital markets in Australia, UK, USA and Europe. His previous position was with Skadden, Arps, Slate, Meagher and Flom in London, and prior to this with Norton Rose Fulbright in Melbourne. Lachlan holds a Bachelor of Commerce and Bachelor of Laws and is a member of the Australian Institute of Company Directors. Tina Mitas Company Secretary
Tina has over 15 years’ experience in corporate law including corporate governance, compliance, mergers and acquisitions, private equity and information technology. Tina’s previous positions include senior legal counsel roles at Aconex Limited and SMS Management Limited and senior associate at Herbert Smith Freehills. Tina holds a Bachelor of Laws (Hons) and Bachelor of Commerce from the University of Melbourne and a Graduate Diploma in Applied Corporate Governance from the Governance Institute of Australia (GIA). Tina is a Chartered Secretary and Associate of the GIA and is a member of the Institute of Chartered Secretaries and Administrators (ICSA). Meetings of directors The numbers of meetings of the Directors and of each Board Committee held during the year ended 31 December 2019, and the numbers of meetings attended by each Director were:
Name VER Limited Audit and Risk Management Committee
Independent Board
Committee
A B A B A B
Laurence Brindle 16 16 4 4 5 5
Georgina Lynch 16 16 4 4 5 5
Stephen Newton 16 16 4 4 5 5
Lachlan Pfeiffer 16 16 4 4 - -

VIVA ENERGY REIT TRUST 31 DECEMBER 2019 FINANCIAL REPORT
8
A = Number of meetings attended.
B = Number of meetings held during the time the Director held office or was a member of the committee during the year
ended 31 December 2019.
Indemnification and insurance of officers and auditors During the financial year, the Trust has paid insurance premiums to insure each of the directors and officers of the Trust against liabilities for costs and expenses incurred by them in defending any legal proceedings arising out of their conduct while acting in their capacities as directors of the Trust, other than conduct involving a wilful breach of duty in relation to the Trust. The contract of insurance prohibits disclosure of the nature of the liability covered and the amount of the premium. The Trust has not during or since the end of the financial year indemnified or agreed to indemnify an auditor of the Trust or of any related body corporate against a liability incurred in their capacity as an auditor. Audit and non-audit services The Trust may decide to employ the auditor on assignments additional to their statutory audit duties where the auditor’s expertise and experience with the Trust are important. Details of the amounts paid or payable to the auditor for audit and non-audit services provided during the year are disclosed in note 17 to the consolidated financial statements. The Directors have considered the position and, in accordance with advice received from the Company’s Audit and Risk Management Committee (‘ARMC’), are satisfied that the provision of non-audit services is compatible with the general standard of independence for auditors imposed by the Corporations Act 2001 for the following reasons:
• all non-audit services have been reviewed by the ARMC to ensure they do not impact the impartiality and objectivity of the auditor; and
• none of the services undermines the general principles relating to auditor independence as set out in APES 110 Code of Ethics for Professional Accountants.
Auditor’s independence declaration A copy of the auditor’s independence declaration as required under section 307C of the Corporations Act 2001 is set out on page 9. Rounding of amounts to the nearest thousand dollars The Trust is of a kind referred to in ASIC Legislative Instrument 2016/191, relating to the “rounding off” of amounts in the Directors’ Report. Amounts in the Directors’ Report have been rounded off in accordance with that instrument to the nearest thousand dollars, or in certain cases, to the nearest dollar. The report is made in accordance with a resolution of Directors.
Laurence Brindle Chairman 20 February 2020

VIVA ENERGY REIT TRUST 31 DECEMBER 2019 FINANCIAL REPORT
9

VIVA ENERGY REIT TRUST 31 DECEMBER 2019 FINANCIAL REPORT
10
VIVA ENERGY REIT TRUST ARSN 613 146 464
FINANCIAL STATEMENTS
For the Year Ended 31 December 2019
This financial report is for Viva Energy REIT Trust. VER Limited ABN 43 609 868 000 AFSL 483795 is the responsible entity of Viva Energy REIT Trust ARSN 613 146 464 (‘Trust’). The financial report is presented in Australian currency. The manager of the Trust is VER Manager Pty Limited (‘Manager’). The registered office of the Company, VER Limited (‘Responsible Entity’) and the Manager is: Level 16, 720 Bourke Street Docklands VIC 3008, Australia.
Contents
Financial Statements
- Consolidated Statement of Comprehensive Income
11
- Consolidated Balance Sheet 12
- Consolidated Statement of Changes in Equity
13
- Consolidated Statement of Cash Flows 14
- Notes to the Consolidated Financial Statements
15
Directors’ Declaration 38
Independent Auditor’s Report 39
VIVA ENERGY REIT TRUST 31 DECEMBER 2019 FINANCIAL REPORT
11
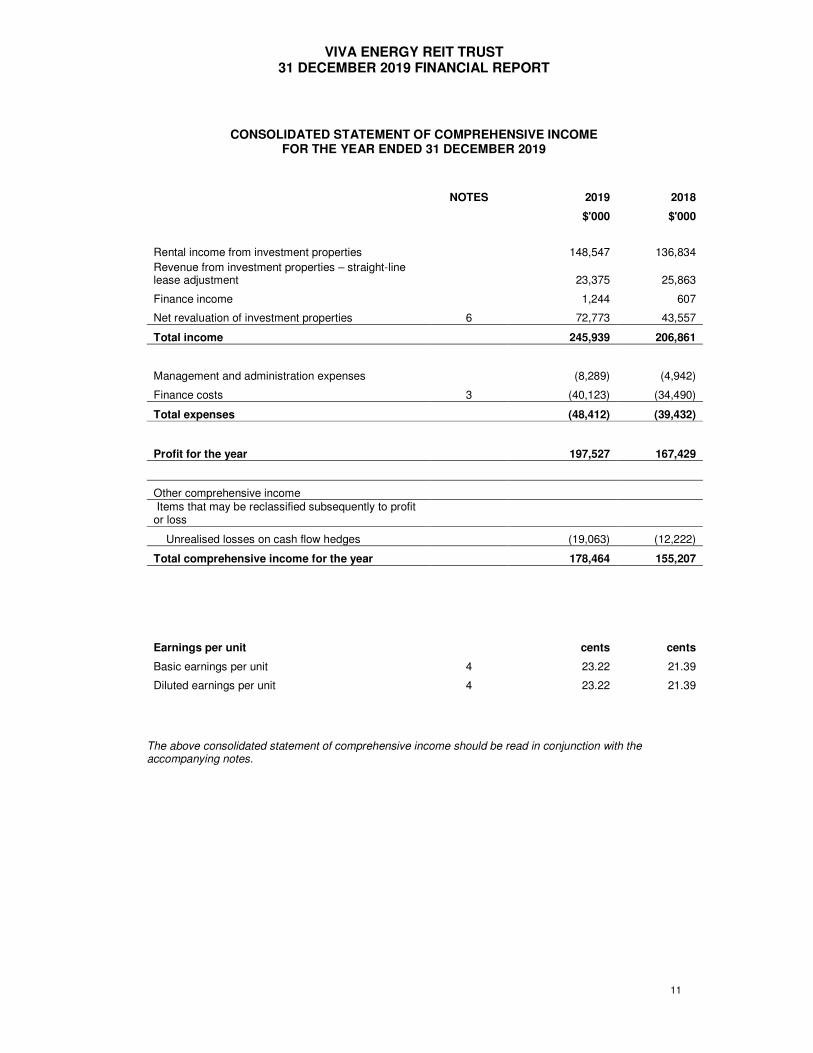
CONSOLIDATED STATEMENT OF COMPREHENSIVE INCOME FOR THE YEAR ENDED 31 DECEMBER 2019
NOTES 2019 2018
$'000 $'000
Rental income from investment properties 148,547 136,834
Revenue from investment properties – straight-line lease adjustment 23,375 25,863
Finance income 1,244 607
Net revaluation of investment properties 6 72,773 43,557
Total income 245,939 206,861
Management and administration expenses (8,289) (4,942)
Finance costs 3 (40,123) (34,490)
Total expenses (48,412) (39,432)
Profit for the year 197,527 167,429
Other comprehensive income Items that may be reclassified subsequently to profit or loss
Unrealised losses on cash flow hedges (19,063) (12,222)
Total comprehensive income for the year 178,464 155,207
Earnings per unit cents cents
Basic earnings per unit 4 23.22 21.39
Diluted earnings per unit 4 23.22 21.39
The above consolidated statement of comprehensive income should be read in conjunction with the accompanying notes.

VIVA ENERGY REIT TRUST 31 DECEMBER 2019 FINANCIAL REPORT
12
CONSOLIDATED BALANCE SHEET AS AT 31 DECEMBER 2019
NOTES 31 December
2019 31 December
2018
$'000 $'000
ASSETS Current assets Cash and cash equivalents 5 17,473 6,384
Derivative financial instruments 8 - 882
Other current assets 16,252 23,738
Total current assets 33,725 31,004
Non-current assets Investment properties 6 2,652,143 2,496,128
Deposits and development costs 37,555 851
Total non-current assets 2,689,698 2,496,979
Total assets 2,723,423 2,527,983
LIABILITIES Current liabilities Trade and other payables 10,903 20,270
Rent received in advance 2,314 2,260
Interest payable 3,007 3,866
Distribution payable 10 55,988 51,020
Total current liabilities 72,212 77,416
Non-current liabilities Borrowings 7 843,118 849,319
Derivative financial instruments 8 25,922 7,741
Total non-current liabilities 869,040 857,060
Total liabilities 941,252 934,476
Net assets 1,782,171 1,593,507
EQUITY Contributed equity 1,616,298 1,494,416
Accumulated profit 191,795 105,950
Hedge reserve 8 (25,922) (6,859)
Total equity 1,782,171 1,593,507
The above consolidated balance sheet should be read in conjunction with the accompanying notes.
VIVA ENERGY REIT TRUST 31 DECEMBER 2019 FINANCIAL REPORT
13
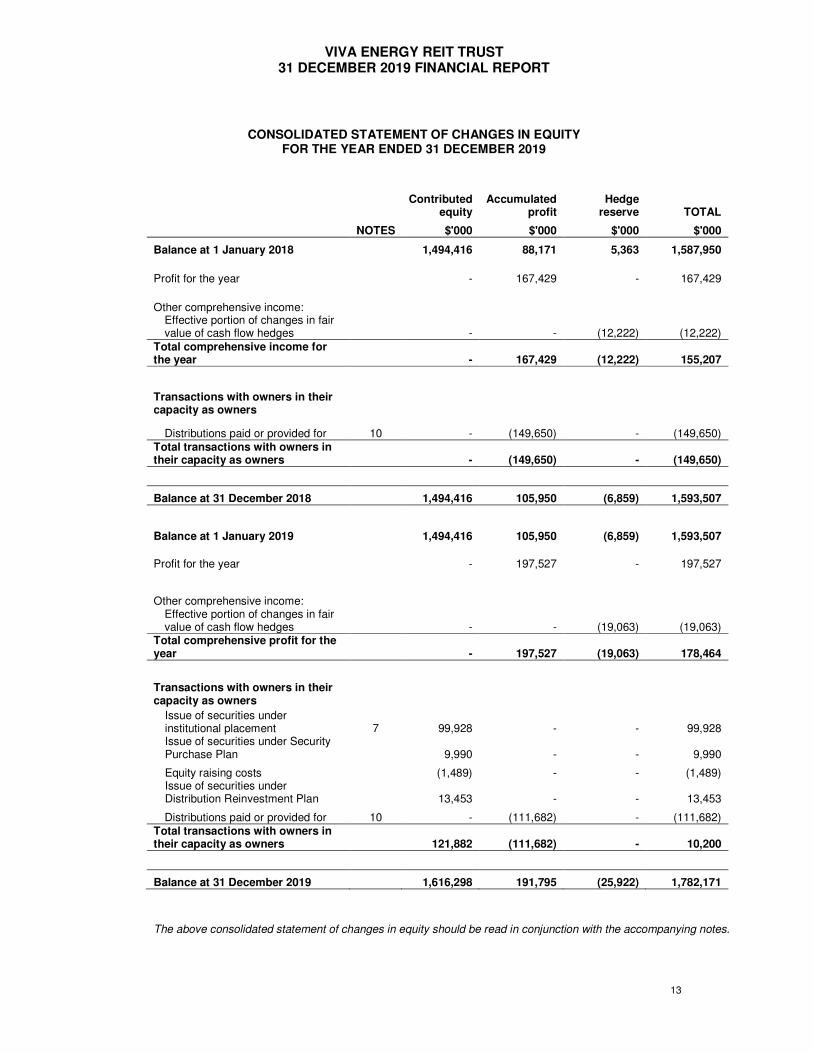
CONSOLIDATED STATEMENT OF CHANGES IN EQUITY FOR THE YEAR ENDED 31 DECEMBER 2019
Contributed
equity Accumulated
profit Hedge
reserve TOTAL
NOTES $'000 $'000 $'000 $'000
Balance at 1 January 2018 1,494,416 88,171 5,363 1,587,950
Profit for the year - 167,429 - 167,429
Other comprehensive income: Effective portion of changes in fair value of cash flow hedges - - (12,222) (12,222)
Total comprehensive income for the year - 167,429 (12,222) 155,207
Transactions with owners in their capacity as owners
Distributions paid or provided for 10 - (149,650) - (149,650) Total transactions with owners in their capacity as owners - (149,650) - (149,650)
Balance at 31 December 2018 1,494,416 105,950 (6,859) 1,593,507
Balance at 1 January 2019 1,494,416 105,950 (6,859) 1,593,507
Profit for the year - 197,527 - 197,527
Other comprehensive income: Effective portion of changes in fair value of cash flow hedges - - (19,063) (19,063)
Total comprehensive profit for the year - 197,527 (19,063) 178,464
Transactions with owners in their capacity as owners
Issue of securities under institutional placement 7 99,928 - - 99,928 Issue of securities under Security Purchase Plan 9,990 - - 9,990
Equity raising costs (1,489) - - (1,489) Issue of securities under Distribution Reinvestment Plan 13,453 - - 13,453
Distributions paid or provided for 10 - (111,682) - (111,682) Total transactions with owners in their capacity as owners 121,882 (111,682) - 10,200
Balance at 31 December 2019 1,616,298 191,795 (25,922) 1,782,171
The above consolidated statement of changes in equity should be read in conjunction with the accompanying notes.

VIVA ENERGY REIT TRUST 31 DECEMBER 2019 FINANCIAL REPORT
14
CONSOLIDATED STATEMENT OF CASH FLOWS FOR THE YEAR ENDED 31 DECEMBER 2019
2019 2018
NOTES $'000 $'000
Cash flows from operating activities
Rental income from investment properties (inclusive of goods and services tax) 164,131 150,668
Payments to suppliers and employees (inclusive of goods and services tax) (22,080) (21,283)
142,051 129,385
Interest received 606 741
Interest paid (30,760) (37,529)
Net cash inflow from operating activities 11 111,897 92,597
Cash flows from investing activities
Payments for acquisition of investment properties (100,411) (138,365) Proceeds on sale and compulsory resumption (including reimbursement of legal fees and other costs) 383 -
Net cash outflow from investing activities (100,028) (138,365)
Cash flows from financing activities
Proceeds of equity issue (net of costs) 108,389 -
Proceeds from borrowings 99,000 163,432
Repayments of borrowings (105,000) (50,000)
Payments for upfront borrowing costs (728) -
Payment for interest rate swap cancellation (9,189) -
Distributions paid to security holders 10 (93,252) (98,630)
Net cash inflow/(outflow) from financing activities (780) 14,802
Net increase/(decrease) in cash and cash equivalents 11,089 (30,966)
Cash and cash equivalents at beginning of the year 6,384 37,350
Cash and cash equivalents at end of the year 5 17,473 6,384
The above consolidated statement of cash flows should be read in conjunction with accompanying notes.

VIVA ENERGY REIT TRUST 31 DECEMBER 2019 FINANCIAL REPORT
15
NOTES TO THE CONSOLIDATED FINANCIAL STATEMENTS
1. CORPORATE STRUCTURE AND GENERAL INFORMATION These consolidated financial statements contain the results of Viva Energy REIT Trust (‘Trust’) and the entities it controlled for the year ended 31 December 2019. The comparative period shown is for the year ended 31 December 2018. The financial statements were authorised for issue by the directors on 20 February 2020. The directors have the power to amend and reissue the financial statements. (a) Basis of preparation These general purpose financial statements have been prepared in accordance with Australian Accounting Standards and interpretations issued by the Australian Accounting Standards Board and the Corporations Act 2001. Viva Energy REIT Trust is a for-profit entity for the purpose of preparing the financial statements. The financial report has been prepared on an accruals and historical cost basis except for investment properties and derivative financial instruments which are measured at fair value. Cost is based on the fair value of consideration given in exchange for assets. The consolidated financial statements of the Trust are prepared and presented in Australian dollars (the presentation currency). The accounting policies adopted are consistent with those of the previous financial period, unless otherwise stated.
(b) Going concern As at 31 December 2019, the Trust had a net current asset deficiency of $38.5 million. This deficiency is due to working capital management within the Trust, and the difference in timing of drawdowns from the Trust’s debt facilities and the timing of payments for investment property acquisitions. The Trust has $250.0 million of unused debt facilities at 31 December 2019, which can be drawn upon to fund the Trust’s cashflow requirements. After taking into account all available information, the directors have concluded that there are reasonable grounds to believe:
• The Trust will be able to pay its debts as and when the fall due; and • The basis of preparation of the financial report on a going concern basis is appropriate.
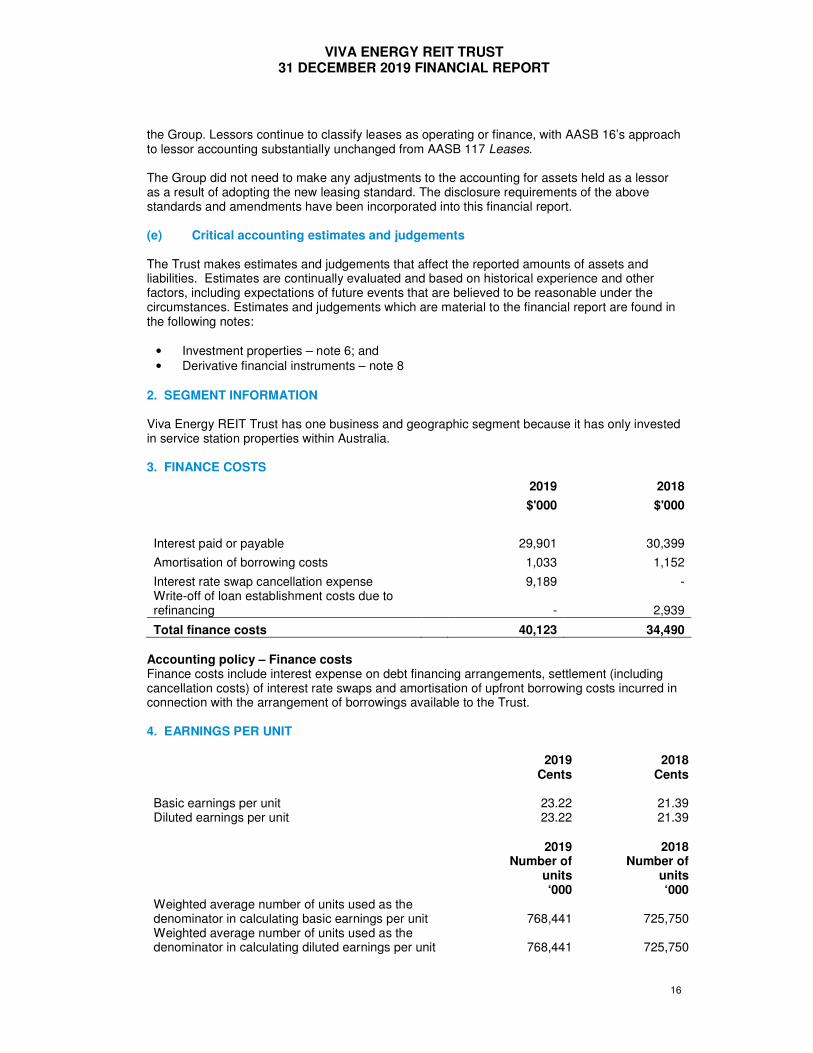
(c) Compliance with International Financial Reporting Standards The consolidated financial statements of the Trust also comply with International Financial Reporting Standards (‘IFRS’) as issued by the International Accounting Standards Board (‘IASB’). (d) New and amended standards adopted by the Group The Group has applied the following standards and amendments for the first time for the reporting period commencing 1 January 2019:
• AASB 16 Leases. AASB 16 establishes a comprehensive framework for the accounting policies and disclosures applicable to leases, both for lessees and lessors. The Group has applied this standard effective 1 January 2019, and, as a lessor, there is no impact on the operations or financial reporting of
VIVA ENERGY REIT TRUST 31 DECEMBER 2019 FINANCIAL REPORT
16
the Group. Lessors continue to classify leases as operating or finance, with AASB 16’s approach to lessor accounting substantially unchanged from AASB 117 Leases. The Group did not need to make any adjustments to the accounting for assets held as a lessor as a result of adopting the new leasing standard. The disclosure requirements of the above standards and amendments have been incorporated into this financial report. (e) Critical accounting estimates and judgements The Trust makes estimates and judgements that affect the reported amounts of assets and liabilities. Estimates are continually evaluated and based on historical experience and other factors, including expectations of future events that are believed to be reasonable under the circumstances. Estimates and judgements which are material to the financial report are found in the following notes:
• Investment properties – note 6; and • Derivative financial instruments – note 8
2. SEGMENT INFORMATION Viva Energy REIT Trust has one business and geographic segment because it has only invested in service station properties within Australia. 3. FINANCE COSTS
2019 2018
$'000 $'000
Interest paid or payable 29,901 30,399
Amortisation of borrowing costs 1,033 1,152
Interest rate swap cancellation expense 9,189 - Write-off of loan establishment costs due to refinancing - 2,939
Total finance costs 40,123 34,490 Accounting policy – Finance costs Finance costs include interest expense on debt financing arrangements, settlement (including cancellation costs) of interest rate swaps and amortisation of upfront borrowing costs incurred in connection with the arrangement of borrowings available to the Trust. 4. EARNINGS PER UNIT
2019 2018
Cents Cents
Basic earnings per unit 23.22 21.39 Diluted earnings per unit 23.22 21.39
2019 2018
Number of units ‘000
Number of units ‘000
Weighted average number of units used as the denominator in calculating basic earnings per unit 768,441 725,750 Weighted average number of units used as the denominator in calculating diluted earnings per unit 768,441 725,750

VIVA ENERGY REIT TRUST 31 DECEMBER 2019 FINANCIAL REPORT
17
Accounting policy – Earnings per unit (i) Basic earnings per unit Basic earnings per unit is calculated by dividing:
• the profit for the period attributable to the security holders, excluding any costs of servicing equity other than ordinary unit; by
• the weighted average number of ordinary units outstanding during the financial period. (ii) Diluted earnings per unit Diluted earnings per security adjust the figures used in the determination of basic earnings per unit to take into account:
• the effect of interest and other financial costs associated with potential ordinary units; and • the weighted average number of additional ordinary units that would have been
outstanding assuming the conversion of all potential ordinary units. 5. CASH AND CASH EQUIVALENTS
31 December 2019
31 December 2018
$'000 $'000
Cash at bank 17,473 6,384
Total cash and cash equivalents 17,473 6,384
Accounting policy – Cash and cash equivalents For the purpose of presentation in the consolidated statement of cash flows, cash and cash equivalents include cash on hand, deposits held at call with financial institutions, and other short- term, highly liquid investments with original maturities of three months or less from the date of acquisition that are readily convertible to known amounts of cash and which are subject to an insignificant risk of changes in value. 6. INVESTMENT PROPERTIES
(a) Valuations and carrying amounts
31 December 2019
31 December 2018
$'000 $'000
Service station properties 2,652,143 2,496,128
Total investment properties 2,652,143 2,496,128 Independent valuations were performed on 164 investment properties during the year ended 31 December 2019 by Jones Lang LaSalle. The directors have reviewed these valuation outcomes and determined they are appropriate to adopt as at 31 December 2019. The key inputs into the valuation are based on market information for comparable properties. The independent valuers have experience in valuing similar assets and have access to market evidence to support their conclusions. Comparable assets are considered to be those in similar markets, of similar scale and condition and with similar lease terms to the subject property. For investment properties not independently valued during the year, directors’ valuations have been performed. The directors’ valuations were determined by capitalising each property’s rent as at 31 December 2019 at the prior year’s capitalisation rate, adjusted with reference to the change in capitalisation rate evident in the 164 independently valued properties when considered in light of investment properties in the same state and with similar lease terms,

VIVA ENERGY REIT TRUST 31 DECEMBER 2019 FINANCIAL REPORT
18
segregated between metropolitan and regional sites. The results are assessed and further work performed to address any outlier results identified. These investment properties not independently valued during the year were most recently independently valued effective 31 December 2017 or 31 December 2018, or on acquisition during the year 31 December 2019. The key inputs into valuations are:
• passing rent; • market rents; • capitalisation rates; • lease terms; • discount rate; and • estimates of the quantum and timing of future cash flows.
Key assumptions
31 December 2019
31 December 2018
Weighted average capitalisation rate 5.78% 5.81%
Weighted average passing yield 5.78% 5.81%
Investment properties have been classified as level 3 in the fair value hierarchy (refer to note 12(e)). There have been no transfers between the levels in the fair value hierarchy during the period.
All investment properties are freehold, apart from all sites in the Australia Capital Territory and one site in New South Wales that are subject to either perpetual or crown leases. (b) Movements during the financial period
2019 2018
$'000 $'000
At fair value
Opening balance 2,496,128 2,280,967 Property acquisitions and capital expenditure 60,178 145,741
Straight-line rental asset 23,375 25,863 Net revaluation of investment properties 72,773 43,557
Disposal of investment properties (311) -
Closing balance 2,652,143 2,496,128 (c) Amounts recognised in profit or loss for investment properties
2019 2018
$'000 $'000
Rental income 148,547 136,834 Other rental income (recognised on a straight-line basis) 23,375 25,863 Net revaluation of investment properties 72,773 43,557

VIVA ENERGY REIT TRUST 31 DECEMBER 2019 FINANCIAL REPORT
19
(d) Leasing arrangements Investment properties are leased to Viva Energy Australia Pty Limited (97% of rental income), other fuel operators and various convenience and fast food store operators (3% of rental income) under long-term operating leases with rentals payable in advance monthly, quarterly or annually. Rental income for 95% of the investment properties is subject to fixed annual increases of between 2.75% and 4.0%. The remainder of the leases include CPI increases, but there are no other variable lease payments that depend on an index or rate. Where considered necessary to reduce credit risk, the Group may obtain bank guarantees or security deposits for the term of the lease.. Minimum lease receivables under non-cancellable operating leases of investment properties not recognised in the financial statements are receivable as follows:
31 December 2019
31 December 2018
$'000 $'000
Within one year 155,809 147,385 Later than one year but not later than two years 158,767 151,815 Later than two years but not later than three years 162,219 154,703 Later than three years but not later than four years 166,646 158,331 Later than four years but not later than five years 171,723 162,865
Later than five years 1,327,553 1,461,644
Total 2,142,717 2,236,743 Accounting policy – Investment properties The Trust carries its investment properties at fair value with changes in the fair values recognised in the consolidated statement of profit or loss. The fair value of investment property is determined based on real estate valuation experts using recognised valuation techniques and the principles of IFRS 13 Fair Value Measurement. The fair value of the properties is reviewed by the directors at each reporting date. The directors’ assessment of fair value is periodically assessed by engaging an independent valuer to assess the fair value of individual properties with at least one-third of the properties within the portfolio being independently valued on an annual rolling basis. Valuations may occur more frequently if there is reason to believe that the fair value of a property has materially changed from its carrying value (e.g. as a result of changes in market conditions, leasing activity in relation to the property or capital expenditure). The independent valuer is rotated at least every three years Valuations are derived from a number of factors that may include a direct comparison between the subject property and a range of comparable sales, the present value of net future cash flow projections based on reliable estimates of future cash flows, existing lease contracts, external evidence such as current market rents for similar properties, and using capitalisation rates and discount rates that reflect current market assessments of the uncertainty in the amount and timing of cash flows. Key estimate – Valuation of investment properties All of Viva Energy REIT Trust’s properties are treated as investment properties for the purpose of financial reporting. Under Australian Accounting Standards, investment property buildings and improvements are not depreciated over time. Instead, investment properties are initially valued at cost, including transaction costs, and then at the end of each accounting period the carrying values are restated at their fair value at the time. Gains and losses arising from changes in the

VIVA ENERGY REIT TRUST 31 DECEMBER 2019 FINANCIAL REPORT
20
fair value of investment properties are recognised as a non-cash gain or loss in the statutory net profit in the accounting period in which they arise. As a result of this accounting policy, changes in the fair value of Viva Energy REIT Trust’s investment properties may have a significant impact on its reported statutory net profit in any given period. At the end of each reporting period, the directors assess the carrying value of Viva Energy REIT Trust’s investment properties, and where the carrying value differs materially from the assessed fair value an adjustment is made to the carrying value of such investment properties. 7. BORROWINGS
31 December 2019
31 December 2018
$'000 $'000
Non-current liabilities
Syndicated facilities 761,687 767,687
Bilateral facility 25,000 25,000
Institutional term loans 60,000 60,000
Sub-total 846,687 852,687
Unamortised borrowing costs (3,569) (3,368)
Total unsecured borrowings 843,118 849,319
Total facilities available 1,096,687 956,687
Undrawn facilities available 250,000 104,000 Debt facility overview All facilities are denominated in Australian dollars, and are interest only facilities with any drawn balances payable at maturity. The weighted average tenure as at 31 December 2019 was 2.9 years (31 December 2018: 3.8 years), and maturity dates range from 3 June 2021 to 6 September 2028. The interest rate applying to the drawn amount of the facilities is set on a periodic basis (one, three or six months) at the prevailing market interest rate at the commencement of the period (Australian dollar, bank bill swap rate), plus the applicable margin. For the majority of the debt facilities, the interest margin has a rate increase/decrease applied if:
- Debt Covenant Gearing is higher than 40% increase by 0.20% - Debt Covenant Gearing is lower than 30% decrease by 0.10%
The key terms of the facility agreements include:
- Interest cover ratio of not less than 2.0 times (actual at 31 December 2019: 5.8 times) - Debt Covenant Gearing ratio of not more than 50% (actual at 31 December 2019: 33.5%) - A draw down cannot be completed if Debt Covenant Gearing is or will exceed 45% via
that drawn down being completed; and - Review events will occur if Viva Energy Group Limited or its affiliates sells or transfers
their security holding such that their holding falls below 20%, or if another entity takes control of the Group.
Subject to compliance with the Group’s financial covenants, the undrawn amount of the debt facilities may be drawn at any time. The Group was in compliance with its covenants throughout the period. Accounting policy – Borrowings Borrowings are initially recognised at fair value and subsequently measured at amortised cost using the effective interest rate method. Under the effective interest rate method, any transaction fees, costs, discounts and premiums directly related to borrowings are recognised in the profit

VIVA ENERGY REIT TRUST 31 DECEMBER 2019 FINANCIAL REPORT
21
and loss over the expected life of the borrowings. Borrowings are removed from the consolidated balance sheet when the obligation specified in the contract is discharged, cancelled or expired. Borrowings with maturities greater than 12 months after reporting date are classified as non-current liabilities. 8. DERIVATIVE FINANCIAL INSTRUMENTS The Trust has the following derivative financial instruments:
31 December 2019
31 December 2018
$'000 $'000
Current assets Interest rate swaps – cash flow hedges - 882
- 882
Non-current liabilities Interest rate swaps – cash flow hedges 25,922 7,741
25,922 7,741 The Trust has entered into interest rate swap contracts under which it receives interest at variable rates and pays interest at fixed rates to protect interest-bearing liabilities from exposure to changes in interest rates. Swaps were in place cover 94.1% of the facility principal outstanding at 31 December 2019. The weighted average fixed interest swap rate at 31 December 2019 was 2.1% per annum, and the weighted average term was 2.8 years. The notional principal amounts and periods of expiry of the interest rate swap contracts are as follows, including interest rate swaps that have a deferred start date:
31 December 2019
31 December 2018
$'000 $'000
Less than 1 year - 368,343
1 to 2 years 368,344 -
2 to 3 years 110,000 368,344
3 to 4 years 258,000 110,000
4 to 5 years - 258,000
5 to 6 years - -
6 to 7 years 40,000 -
7 to 8 years - 40,000
8 to 9 years 20,000 -
9 to 10 years - 20,000
796,344 1,164,687

VIVA ENERGY REIT TRUST 31 DECEMBER 2019 FINANCIAL REPORT
22
Accounting policy – Derivative financial instruments Derivatives are initially recognised at fair value on the date a derivative contract is entered into and are subsequently remeasured to their fair value at the end of each reporting period. The accounting for subsequent changes in fair value depends on whether the derivative is designated as a hedging instrument, and if so, the nature of the item being hedged. The Group designates certain derivatives as either:
• hedges of the fair value of recognised assets or liabilities or a firm commitment (fair value hedges); or
• hedges of a particular risk associated with the cash flows of recognised assets and liabilities and highly probable forecast transactions (cash flow hedges).
The Trust documents at the inception of the hedging transaction the relationship between hedging instruments and hedged items, as well as its risk management objective and strategy for undertaking various hedge transactions. The Trust also documents its assessment, both at hedge inception and on an ongoing basis, of whether the derivatives that are used in hedging transactions have been and will continue to be highly effective in offsetting changes in fair values or cash flows of hedged items. (a) Cash flow hedges The effective portion of changes in the fair value of derivatives that are designated and qualify as cash flow hedges is recognised in other comprehensive income and accumulated in reserves in equity. The gain or loss relating to the ineffective portion is recognised immediately in profit or loss within other income or other expense. Amounts accumulated in equity are reclassified to profit or loss in the periods when the hedged item affects profit or loss (for instance when the forecast sale that is hedged takes place). The gain or loss relating to the effective portion of interest rate swaps hedging variable rate borrowings is recognised in profit or loss within finance costs. When a hedging instrument expires or is sold or terminated, or when a hedge no longer meets the criteria for hedge accounting, any cumulative gain or loss existing in equity at that time remains in equity and is recognised when the forecast transaction is ultimately recognised in profit or loss. When a forecast transaction is no longer expected to occur, the cumulative gain or loss that was reported in equity is immediately reclassified to profit or loss. (b) Derivatives that do not qualify for hedge accounting Certain derivative instruments do not qualify for hedge accounting. Changes in the fair value of any derivative instrument that does not qualify for hedge accounting are recognised immediately in profit or loss and are included in other income or other expenses. Key estimate – Valuation of derivative financial instruments The Trust’s financial instruments are over-the-counter derivatives for which there are no quoted market prices. Valuation techniques (including, pricing models which estimate the present value of estimated future cash flows based on observable yield curves) are used to determine fair values. Models use observable data, to the extent practicable. However, areas such as credit risk (both own and counterparty), volatilities and correlations require management to make estimates. Changes in assumptions about these factors could affect the reported fair value of financial instruments.
VIVA ENERGY REIT TRUST 31 DECEMBER 2019 FINANCIAL REPORT
23
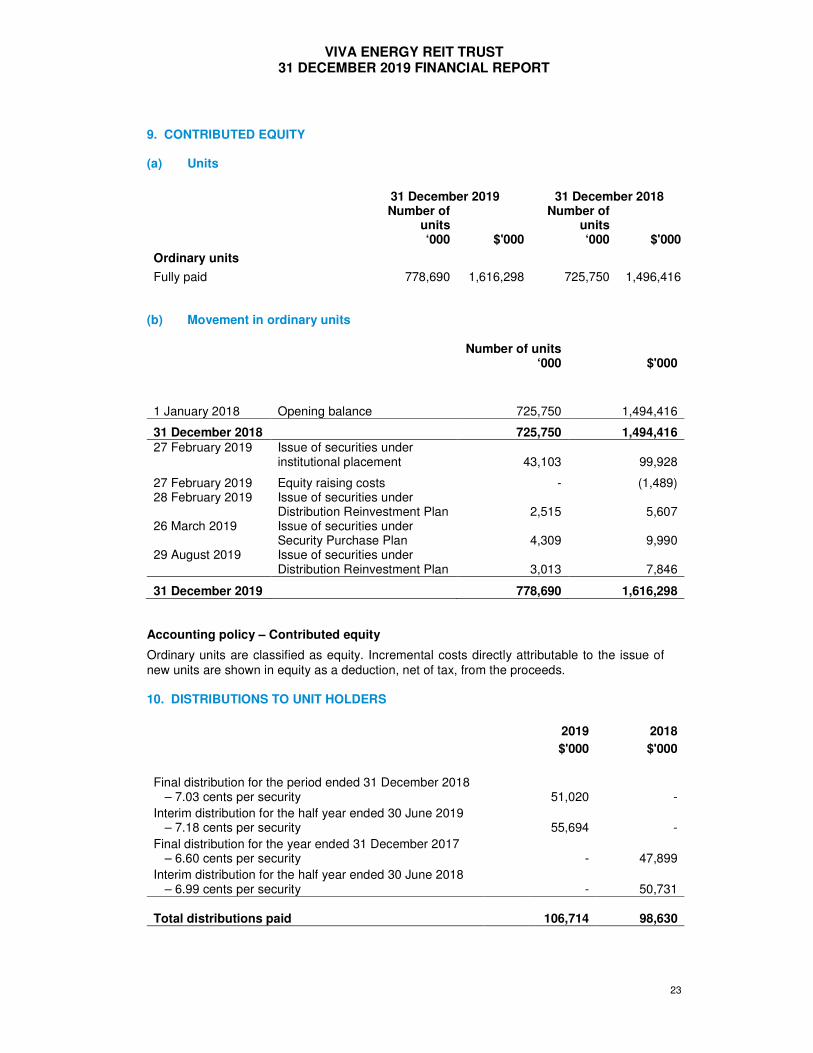
9. CONTRIBUTED EQUITY (a) Units
31 December 2019 31 December 2018
Number of units ‘000 $'000
Number of units ‘000 $'000
Ordinary units
Fully paid 778,690 1,616,298 725,750 1,496,416 (b) Movement in ordinary units
Number of units ‘000 $'000
1 January 2018 Opening balance 725,750 1,494,416
31 December 2018 725,750 1,494,416 27 February 2019 Issue of securities under
institutional placement 43,103 99,928
27 February 2019 Equity raising costs - (1,489) 28 February 2019 Issue of securities under
Distribution Reinvestment Plan 2,515 5,607 26 March 2019 Issue of securities under
Security Purchase Plan 4,309 9,990 29 August 2019 Issue of securities under
Distribution Reinvestment Plan 3,013 7,846
31 December 2019 778,690 1,616,298 Accounting policy – Contributed equity
Ordinary units are classified as equity. Incremental costs directly attributable to the issue of new units are shown in equity as a deduction, net of tax, from the proceeds. 10. DISTRIBUTIONS TO UNIT HOLDERS
2019 2018
$'000 $'000
Final distribution for the period ended 31 December 2018
– 7.03 cents per security 51,020 -
Interim distribution for the half year ended 30 June 2019 – 7.18 cents per security 55,694 -
Final distribution for the year ended 31 December 2017 – 6.60 cents per security - 47,899
Interim distribution for the half year ended 30 June 2018 – 6.99 cents per security - 50,731
Total distributions paid 106,714
98,630

VIVA ENERGY REIT TRUST 31 DECEMBER 2019 FINANCIAL REPORT
24
On 19 December 2019 the directors announced the payment of an estimated final distribution of $56.0 million for the year ended 31 December 2019. This represents 7.19 cents per stapled security and is expected to be paid on 27 February 2020. Other than the above, no distributions to unit holders were declared or paid during the financial year. Accounting policy – Distributions to unit holders The Trust distributes net operating profit, being net profit adjusted to remove transaction costs and non-cash items, including straight-lining of rental income, the amortisation of debt establishment fees and any fair value adjustment to investment properties and derivatives. A provision is made for any distribution amount declared but not distributed, being appropriately disclosed and no longer at the discretion of the entity, on or before the reporting date. When declared, the distributions are recognised within the consolidated balance sheet and consolidated statement of changes in equity as a reduction in equity.
11. CASH FLOW INFORMATION
(a) Reconciliation of net profit after income tax to net cash inflow from operating activities
2019 2018
$'000 $'000
Profit for the year 197,527 167,429
Amortisation of borrowing costs 1,033 4,091
Interest rate swap cancellation expense 9,189 -
Net revaluation of investment properties (72,773) (43,557)
Straight-line adjusting on rental income (23,375) (25,863)
Change in operating assets and liabilities
Decrease/(increase) in other current assets 7,486 (8,464)
Increase/(decrease) in trade and other payables (6,385) 5,998
Increase in rent received in advance 54 156
Increase/(decrease) in interest payable (859) (7,193)
Net cash inflow from operating activities 111,897 92,597
(b) Non-cash investing and financing activities
2019 2018
$'000 $'000
Loan establishment costs netted off against borrowings drawn down - 2,568 Total non-cash financing and investing activities - 2,568

VIVA ENERGY REIT TRUST 31 DECEMBER 2019 FINANCIAL REPORT
25
(c) Net debt reconciliation
Cash and cash
equivalents
Borrowings due within 1
year
Borrowings due after 1
year
Total
$'000 $'000 $'000 $'000
Net debt at 1 January 2018 37,350 - 736,687 699,337
Cash flows (30,966) - 116,000 146,966
Net debt at 31 December 2018 6,384 - 852,687
846,303
Cash flows 11,089 - (6,000) (17,089) Net debt at 31 December 2019 17,473 - 846,687 829,214
12. FINANCIAL RISK MANAGEMENT The Trust’s investing activities expose it to various types of risk that are associated with the financial instruments and markets in which it invests. The most important types of financial risk which the Trust is exposed to are market risk, cash flow and fair value interest rate risk, credit risk and liquidity risk. The exposure to each of these risks, as well as the Group’s policies and processes for managing these risks are described below. (a) Market risk Market risk embodies the potential for both loss and gains and includes interest rate risk and price risk. Cash flow and fair value interest rate risk The Trust’s cash and cash equivalents, floating rate borrowings and interest rate swaps expose it to a risk of change in the fair value or future cash flows due to changes in interest rates. The Trust economically hedges some or all of its exposure to changes in interest rates on variable rate borrowings by using floating-to-fixed interest rate swaps. By hedging against changes in interest rates, the Group has limited its exposure to changes in interest rates on its cash flows. The portion that is hedged is set by the directors and is influenced by the hedging requirements set out in the Group’s debt facility documents, its hedging policy and the market outlook. The Trust’s exposure to interest rate risk at reporting date, including its sensitivity to changes in market interest rates that were reasonably possible, is as follows:
31 December 2019
31 December 2018
$'000 $'000
Financial assets
Cash and cash equivalents 17,473 6,384 Derivative financial instruments (notional principal amount)
- Fixed interest rate swaps 796,344 796,687
Financial liabilities Interest-bearing liabilities – floating rate interest 846,687 852,687
Net exposure (32,870) (49,616)

VIVA ENERGY REIT TRUST 31 DECEMBER 2019 FINANCIAL REPORT
26
Sensitivity of profit or loss to movements in market interest rates:
2019 2018
$'000 $'000
Market interest rate increased by 100 basis points (328) (496) Market interest rate decreased by 100 basis points 328 496
Instruments with fair value risk
Derivative financial instruments Sensitivity of profit and loss to movements in market interest rates for financial instrument with fair value risk: Market interest rate increased by 100 basis points - - Market interest rate decreased by 100 basis points - -
The interest rate range for sensitivity purposes has been determined using the assumption that interest rates changed by +/- 100 basis points from year-end rates with all other variables held constant. In determining the impact of an increase/decrease in equity for security holders arising from market risk, the Trust has considered prior period and expected future movements of the portfolio information in order to determine a reasonably possible shift in assumptions. As the derivative financial instruments are designated as cash flow hedges, the impact of a market interest rate change flows through Other Comprehensive Income. Investment property valuation risk The Trust’s investment properties expose it to a risk of change in the fair value due to changes in market capitalisation rates of such investment properties. Investment properties of the type owned by the Trust are generally valued on a capitalisation of income basis.
2019 2018
$'000 $'000
Investment properties Sensitivity of profit and loss to movements in market capitalisation rates: Market capitalisation rates decreases by 25 basis points 119,893 112,310 Market capitalisation rates increases by 25 basis points (109,952) (103,038) Market capitalisation rates decreases by 50 basis points 251,139 235,204 Market capitalisation rates increases by 50 basis points (211,150) (197,907)
The impacts on carrying values as shown above for the noted movement in capitalisation rates would impact the statutory net profit and balance sheet, but there is no impact on Distributable Income as the unrealised movement in carrying value of investment properties is excluded from the Distributable Income calculation.

VIVA ENERGY REIT TRUST 31 DECEMBER 2019 FINANCIAL REPORT
27
(b) Credit risk Credit risk is the risk that one party to a financial instrument will fail to discharge its obligation and cause the other party to incur a financial loss. The Trust’s maximum credit risk exposure at balance date in relation to each class of recognised financial asset, other than equity and derivative financial instruments, is the carrying amount of those assets as indicated in the consolidated balance sheet. This does not represent the maximum risk exposure that could arise in the future as a result of changes in values, but best represents the current maximum exposure at reporting date.
31 December 2019
31 December 2018
$'000 $'000
Cash at bank 17,473 6,384 Maximum exposure to credit risk The Trust manages credit risk and the losses which could arise from default by ensuring that parties to contractual arrangements are of an appropriate credit rating, or do not show a history of defaults. Financial assets such as cash at bank and interest rate swaps are held with high credit quality financial institutions. All receivables are monitored by the Trust. If any amounts owing are overdue, these are followed up and, if necessary, allowances are made for debts that are doubtful. At the end of the reporting period, there were no issues with the credit quality of financial assets and all amounts are expected to be received in full. (c) Liquidity risk Liquidity risk is the risk that the Trust may not be able to generate sufficient cash resources to settle its obligations in full as they fall due or can only do so on terms that are materially disadvantageous. The Trust monitors its exposure to liquidity risk by ensuring that there is sufficient cash on hand as required or debt funding available to meet the contractual obligations of financial liabilities as they fall due. The Trust sets budgets to monitor cash flows. The weighted average debt maturity is 2.9 years, and the weighted average lease expiry is 11.7 years. The table below analyses the Trust’s financial liabilities into relevant maturity groupings based on the remaining period as at the reporting date to the contractual maturity date. The amounts disclosed in the table are the contractual undiscounted cash flows.
31 December 2019 Less than 12 months
Between 1 and 2 years
Over 2 years
Total contractual cash flows
Carrying amount
liabilities $'000 $'000 $'000 $'000 $'000
Trade and other payables 10,903 - - 10,903 10,903
Rent received in advance 2,314 - - 2,314 2,314
Variable rate borrowings 22,690 141,835 752,845 917,370 849,694 Contractual cash flows (excluding gross settled derivatives) 35,907 141,835 752,845 930,587 862,911

VIVA ENERGY REIT TRUST 31 DECEMBER 2019 FINANCIAL REPORT
28
31 December 2018 Less than
12 months Between 1
and 2 years Over
2 years Total
contractual cash flows
Carrying amount
liabilities $'000 $'000 $'000 $'000 $'000
Trade and other payables 20,270 - - 20,270 20,270
Rent received in advance 2,260 - - 2,260 2,260
Variable rate borrowings 33,320 57,818 896,270 987,408 856,553 Contractual cash flows (excluding gross settled derivatives) 55,850 57,818 896,270 1,009,938 879,083
(d) Capital risk management The Trust aims to invest to meet the Trust’s investment objectives while maintaining sufficient liquidity to meet its commitments. The Trust regularly reviews performance, including asset allocation strategies, investment and operational management strategies, investment opportunities and risk management. In order to maintain an appropriate capital structure, the Trust may adjust the amount of distributions paid to security holders, return capital to security holders, issue new units, sell or buy assets or reduce or raise debt. The Trust monitors capital through the analysis of a number of financial ratios, including the debt covenant gearing ratio which is assessed against the Group.
31 December 2019
31 December 2018
$'000 $'000
Total liabilities (excluding derivative financial instruments)
909,283
908,608
Total assets (excluding derivative financial instruments)
2,718,117
2,510,126
Debt covenant gearing ratio 33.5% 36.2% (e) Fair value hierarchy (i) Classification of financial assets and financial liabilities AASB 13 Fair Value Measurement requires disclosure of fair value measurements by level of fair value hierarchy. The fair value hierarchy has the following levels:
• Quoted prices (unadjusted) in active markets for identical assets or liabilities (level 1); • Inputs other than quoted prices included within level 1 that are observable for the asset or
liability, either directly (that is, as prices) or indirectly (that is, derived from prices) (level 2); and
• Inputs for the asset or liability that are not based on observable market data (that is, unobservable inputs) (level 3).
The level in the fair value hierarchy within which the fair value measurement is categorised in its entirety is determined on the basis of the lowest level input that is significant to the fair value measurement in its entirety. For this purpose, the significance of an input is assessed against the fair value measurement in its entirety. If a fair value measurement uses observable inputs that require significant adjustment based on unobservable inputs, that measurement is a level 3 measurement. Assessing the significance of a particular input to the fair value measurement in its entirety requires judgement, considering factors specific to the asset or liability.

VIVA ENERGY REIT TRUST 31 DECEMBER 2019 FINANCIAL REPORT
29
The determination of what constitutes observable requires significant judgement by the directors. The directors consider observable data to be that market data that is readily available, regularly distributed or updated, reliable and verifiable, not proprietary, and provided by independent sources that are actively involved in the relevant market. The following table presents the Trust’s financial assets and liabilities (by class) measured at fair value according to the fair value hierarchy at 31 December 2019 on a recurring basis:
31 December 2019 Level 1 Level 2 Level 3 Total $'000 $'000 $'000 $'000
Investment properties - - 2,652,143 2,652,143
Interest rate swaps - (25,922) - (25,922)
Total - (25,922) 2,652,143 2,626,221
31 December 2018 Level 1 Level 2 Level 3 Total
$'000 $'000 $'000 $'000
Investment properties - -
2,496,128 2,496,128
Interest rate swaps - (6,859) - (6,859) Total - (6,859) 2,496,128 2,489,269
The Trust’s policy is to recognise transfers into and transfers out of fair value hierarchy levels as at the end of the reporting period. There were no transfers between levels during the period. The Trust did not measure any financial assets or financial liabilities at fair value on a non-recurring basis as at 31 December 2019. (ii) Valuation techniques used to derive level 2 and level 3 values The fair value of financial instruments that are not traded in an active market (for example, over-the-counter derivatives) is determined using valuation techniques. These valuation techniques maximise the use of observable market data where it is available and rely as little as possible on entity specific estimates. If all significant inputs required to fair value an instrument are observable, the instrument is included in level 2. If one or more of the significant inputs is not based on observable market data, the instrument is included in level 3. The fair value of interest rate swaps is calculated as the present value of the estimated future cash flows based on observable yield curves, taking into account any material credit risk. (f) Investment risk (i) Tenant concentration risk, financial standing and sector concentration risk Viva Energy REIT’s rental income is 97% derived from leases with Viva Energy Australia Pty Limited (Viva Energy Australia). If Viva Energy Australia’s financial standing materially deteriorates, Viva Energy Australia’s ability to make rental payments to Viva Energy REIT may be adversely impacted, which may have a materially adverse impact on the Group’s results of operations, financial position and ability to service and/or obtain financing. Furthermore, a material decline in the profitability of Viva Energy Australia’s business could affect the perceived stability of the rental income of Viva Energy REIT and may affect Viva Energy REIT’s ability to obtain financing on acceptable terms, and lead to lower market rents when renewal options are exercised and a decline in the values of Viva Energy REIT’s investment properties.

VIVA ENERGY REIT TRUST 31 DECEMBER 2019 FINANCIAL REPORT
30
Termination of Viva Energy Australia’s right to use Shell branding could adversely affect Viva Energy Australia’s ability to meet its rental obligations and therefore the value of Viva Energy REIT’s portfolio of investment properties and its ability to service and/or obtain financing. (ii) Investment property value The value of the Trust’s portfolio of investment properties may be adversely affected by a number of other factors, including factors outside the control of the Trust, such as supply and demand for service station properties, general property market conditions, the availability and cost of credit, the ability to attract and implement economically viable rental arrangements, Viva Energy Australia’s financial condition deteriorating, occupiers not extending the term of leases, re-leasing of properties, capitalisation rates and general economic factors such as the level of inflation and interest rates. As changes in valuations are recorded on the statutory net profit statement, any decreases in value will have a negative impact on the statutory net profit statement and net tangible assets per security and in turn the market price of the Group’s securities may fall. (iii) Environmental and climate risk The Group depends on its tenants to perform their obligations under various environmental arrangements in relation to the properties they lease. If the tenants were to fail to meet their obligations under these arrangements (including due to their insolvency), Viva Energy REIT may incur significant costs to rectify contamination on its properties and also on other properties which may be consequently impacted. The Group is subject to a range of regulatory regimes that cover the specific assets of the Group and how they are operated. These regulatory regimes are subject to ongoing review and change which may increase the cost of compliance, reporting and maintenance of the Group’s assets. Extreme weather and other climate change related events have the potential to damage the Group’s assets and disrupt the tenants’ operations. Such events may increase costs for maintenance and insurance of the Group’s assets, and may affect the ability to re-lease the Group’s investment properties in the future and the rent levels for which they can be leased, thereby affecting future investment property valuations and rental cash flows. Insurance may not be able to be obtained at all. The precise nature of these risks is uncertain as it depends on complex factors such as policy change, technology development, market forces, and the links between these factors and climatic conditions. (iv) Debt agreement and refinancing risk The Trust has outstanding debt facilities. General economic and business conditions that impact the debt or equity markets could impact the Trust’s ability to refinance its debt facilities when required. If the covenants in these facilities are breached by the Group this may result in the Group being subject to increased interest rate margins and covenants restricting its ability to engage in certain types of activities or to pay distributions to unitholders. Debt may not be able to be obtained at all. If Viva Energy Australia Pty Limited ceases to beneficially own and control, either directly or indirectly, at least 20% of the securities of Viva Energy REIT by selling or transferring its interest, or an entity other than a member of the Viva Energy Group controls Viva Energy REIT, then this would constitute a review event under the terms of the Group’s debt facility agreements, and (subject to specified negotiation and notification periods) a repayment of the Group’s debt facilities may be required.

VIVA ENERGY REIT TRUST 31 DECEMBER 2019 FINANCIAL REPORT
31
The directors regularly monitor the debt facility covenants to ensure compliance and consider the refinancing options and timing available to the Trust. (v) Personnel risk Viva Energy REIT Trust is managed by VER Manager Pty Limited (‘Manager’), which is a subsidiary of Viva Energy Group Limited. The Trust does not have employees (other than directors) and consequently is reliant on the expertise and experience of the key executives of Viva Energy Group Limited made available to the Manager which provides the services to Viva Energy REIT under the Management Agreement. As a consequence, loss of such key personnel could potentially have an adverse impact on the management and the financial performance of Viva Energy REIT and in turn may affect the returns to security holders. 13. INVESTMENTS IN CONTROLLED ENTITIES The consolidated financial statements incorporate the assets, liabilities and results of the following controlled entities:
Percentage of equity
interest held by the Trust
Date of
establishment 2019 2018
Name % %
VER Trust 10 July 2016 100 100
VER Finco Pty Limited 10 June 2016 100 100
66 McNulty Street Miles Queensland Trust 16 July 2018 100 100
555-557 Albany Highway Albany Western Australia Trust 16 July 2018 100 100
47 Eric Road Old Noarlunga South Australia Trust 20 August 2018 100 100
127 Youngman Street Kingaroy Queensland Trust 20 July 2018 100 100
73-75 Chrystal Street Roma Queensland Trust 20 July 2018 100 100
199-205 Charters Towers Road Townsville Queensland Trust
20 August 2018 100 100
341 Sand Road Longwarry Victoria Trust 16 July 2018 100 100
290 Sand Road Longwarry Victoria Trust 16 July 2018 100 100
6776 Cunningham Highway Aratula Queensland Trust 16 July 2018 100 100
80 Alfred Street Warragul Victoria Trust 12 October 2018 100 100
7-11 Burnett Highway Biloela Queensland Trust 12 October 2018 100 100
176-190 Ogilvie Avenue Echuca Victoria Trust 12 October 2018 100 100
7-21 Shakespeare Street Traralgon Victoria Trust 12 October 2018 100 100
120-124 Goldring Street Richmond Queensland Trust 12 October 2018 100 100
6-8 Mackay Avenue Griffith New South Wales Trust 12 October 2018 100 100
5 Princes Highway Moruya New South Wales Trust 12 October 2018 100 100
10805 Brand Highway Cataby Western Australia Trust 22 March 2019 100 -
55 Broad Street Sarina Queensland Trust 22 March 2019 100 -
112 Shute Harbour Road Cannonvale Queensland Trust 22 March 2019 100 -
Ranford Road Canning Vale Western Australia Trust
14 May 2019 100 -
Corner Ranford Road and Balfour Street Southern River Western Australia Trust
14 May 2019 100 -
1L Mitchell Highway Dubbo New South Wales Trust 12 June 2019 100 -
51-55 Aerodrome Road Maroochydore Queensland Trust 12 June 2019 100 -

VIVA ENERGY REIT TRUST 31 DECEMBER 2019 FINANCIAL REPORT
32
Percentage of equity
interest held by the Trust
Date of
establishment 2019 2018
Name % %
1110 Abernethy Road High Wycombe Western Australia Trust
14 August 2019 100 -
Crn Great Eastern Highway & Bulong Avenue Redcliffe Western Australia Trust
15 August 2019 100 -
5-25 Hughes Road Little River Victoria Trust 15 August 2019 100 -
13 Lakes Road Greenfields Western Australia Trust 15 August 2019 100 -
20 Pousties Road Avalon Victoria Trust 9 September 2019 100 -
825 Mickleham Road Greenvale Victoria Trust 3 October 2019 100 -
24 Wills Road Emerald Queensland Trust 3 October 2019 100 -
18316 Warrego Highway Dalby West Queensland Trust 3 October 2019 100 -
Lot 50 Mandurah Road Meadow Springs Western Australia Trust
3 October 2019 100 -
Crn Childers Road & Airport Drive Bundaberg Queensland Trust
3 October 2019 100 -
62 Flinders Parade North Lakes Queensland Trust 3 October 2019 100 -
416 Princes Highway Colac West Victoria Trust 4 December 2019 100 -
All companies and trusts were incorporated or settled in Australia. The trusts formed during the year ended 31 December 2019 were formed by the Trust and own investment properties. 14. COMMITMENTS AND CONTINGENCIES Capital expenditure commitments
31 December
2019 31 December
2018
$’000 $’000
Within one year 35,459 12,500
After one year but not more than five year - -
35,459 12,500 At 31 December 2019, the Group has entered into contracts for the purchase of four investment properties for $25.4 million, of which $21.1 million remains unpaid at 31 December 2019. Settlement of three of these investment properties has occurred during January and February 2020. Further, the Group has committed to contracts for the construction of service stations on ten properties for an aggregate of $46.4 million, of which $14.3 million remains unpaid at 31 December 2019 and is expected to be paid as construction is completed during the next 12 months. Other than that noted above, there are no material outstanding contingent assets, liabilities or commitments as at 31 December 2019.

VIVA ENERGY REIT TRUST 31 DECEMBER 2019 FINANCIAL REPORT
33
15. EVENTS OCCURRING AFTER THE REPORTING PERIOD
Subsequent to the end of the financial year:
• The directors have confirmed the payment of a final distribution for the year ended 31 December 2019 of $56.0 million which is expected to be paid on 27 February 2020;
• On 8 January 2020 funds have been drawn down from one of the syndicated facilities for $56.0 million to fund this distribution;
• Three investment properties with a purchase price of $20.0 million which was contracted before 31 December 2018 have been settled during January and February 2020.
No other matter or circumstance has arisen since 31 December 2019 that has significantly affected, or may significantly affect:
• the operations of the Trust in future financial years; • the results of those operations in future financial years; or • the state of affairs of the Trust in future financial years.
16. RELATED PARTY INFORMATION (a) Controlled entities Interests in controlled entities are set out in note 13. (b) Transactions with related parties 2019 2018
$’000 $’000
The following transactions occurred with related parties:
Rental income and interest received from Viva Energy Australia Pty Limited and its associated entities
146,073
135,790
Reimbursement of costs incurred by VER Limited in relation to managing the Trust
4,239
2,293
Company fee expense incurred to Viva Energy REIT Limited 2,382 1,631
Responsible entity fee paid to VER Limited 50 -
Purchase of investment properties from an associated entity of Viva Energy Australia Pty Limited (Liberty Oil Holdings Pty Limited and its controlled entities)
31,480
25,000 Payments for construction and site development works to an associated entity of Viva Energy Australia Pty Limited (Liberty Oil Holdings Pty Limited and its controlled entities)
32,651
-
Amounts receivable:
Receivable from Viva Energy REIT Limited at the end of the period
9,216
5,223
Receivable from VER Custodian Pty Limited at the end of the period
795
157
Amounts payable:
Payable to VER Limited at the end of the period 2,750 549

VIVA ENERGY REIT TRUST 31 DECEMBER 2019 FINANCIAL REPORT
34
The Trust has acquired investment properties by the assignment to the Trust of a purchase right which was held by Viva Energy Australia Pty Limited. No fees were paid nor are payable by the Trust for this assignment of the purchase right. The purchase right allows for purchase of each investment property at equal to the best third party offer received by the previous owner. 17. REMUNERATION OF AUDITORS During the period the following fees were paid or payable for services provided by the auditor of the parent entity and its related practices.
2019 2018
$ $
PricewaterhouseCoopers Australia
Audit and review of financial statements 16,350 15,375
Total remuneration of auditors 16,350 15,375
18. SUMMARY OF SIGNIFICANT ACCOUNTING POLICIES This note provides a list of the significant accounting policies adopted in the preparation of these consolidated financial statements to the extent they have not already been disclosed in the other notes above. These policies have been consistently applied to all the years presented, unless otherwise stated. (a) Principles of consolidation (i) Subsidiaries Subsidiaries are all entities (including trusts) over which the Trust has control. The Trust controls an entity when the Trust is exposed to, or has rights to, variable returns from its involvement with the entity and has the ability to affect those returns through its power to direct the activities of the entity. Subsidiaries are fully consolidated from the date on which control is transferred to the Trust. They are deconsolidated from the date that control ceases. The acquisition method of accounting is used to account for business combinations by the Trust. Inter-entity transactions, balances and unrealised gains on transactions between Group entities are eliminated. Unrealised losses are also eliminated unless the transaction provides evidence of an impairment of the transferred asset. Accounting policies of subsidiaries have been changed where necessary to ensure consistency with the policies adopted by the Group. Non-controlling interests in the results and equity of subsidiaries are shown separately in the consolidated statement of comprehensive income, consolidated balance sheet and consolidated statement of changes in equity respectively. (b) Revenue (i) Rental income Rental income from operating leases is recognised as income on an accruals basis. Where a lease has a fixed annual increase, the total rent receivable over the operating lease is recognised as revenue on a straight-line basis over the lease term. This results in more income being recognised early in the lease term and less late in the lease term compared to the lease conditions (i.e. actual cash received). The difference between the lease income recognised and the actual lease payment received is shown within the fair value of the investment property on the consolidated balance sheet. (ii) Interest income Interest income is recognised as it accrues using the effective interest rate method. Interest income is included in finance income in the consolidated statement of profit or loss.

VIVA ENERGY REIT TRUST 31 DECEMBER 2019 FINANCIAL REPORT
35
All income is stated net of goods and services tax. (c) Expenses All expenses are recognised in the consolidated profit or loss on an accruals basis. (d) Management expenses The Trust reimburses the Manager for costs incurred in the management of Viva Energy REIT’s operations. (e) Employee benefits Viva Energy REIT Trust has no employees other than the directors. Management services are provided to Viva Energy REIT by VER Manager Pty Limited which is a subsidiary of Viva Energy Australia Pty Limited. The employees of Viva Energy Australia Pty Limited who are seconded to provide management services are employees of and paid directly by Viva Energy Australia Pty Limited, but they work exclusively for Viva Energy REIT. Incentives paid by Viva Energy Australia Pty Limited to staff seconded to VER Manager Pty Limited to provide these management services are based entirely on the performance of Viva Energy REIT. (f) Goods and services tax (‘GST’) Revenues, expenses and assets are recognised net of the amount of GST, unless the GST incurred is not recoverable from the taxation authority. In this case, it is recognised as part of the cost of acquisition of the asset or as part of the expense. Receivables and payables are stated inclusive of GST receivable or payable. The net amount of GST recoverable from, or payable to, the taxation authority is included with other current assets and trade and other payables in the consolidated balance sheet. Cash flows are presented on a gross basis. The GST components of cash flows arising from investing or financing activities which are recoverable from, or payable to, the taxation authority are presented as operating cash flows. (g) Receivables Trade and sundry debtors are initially recorded at fair value and subsequently accounted for at amortised cost. Collectability of trade debtors is reviewed regularly and bad debts are written off when identified. A specific provision for doubtful debts is made when there is objective evidence that Viva Energy REIT will not be able to collect the amounts due according to the original terms of the receivable. The amount of the impairment loss is the difference between the asset’s carrying amount and the present value of estimated future cash flows. (h) Financial instruments (i) Classification The Trust’s investments are classified as at fair value through profit or loss. They comprise:
• Financial instruments held for trading
Derivative financial instruments such as interest rate swaps are included under this classification.
• Financial instruments designated at fair value through profit or loss upon initial recognition
These include financial assets that are not held for trading purposes and which may be sold.
VIVA ENERGY REIT TRUST 31 DECEMBER 2019 FINANCIAL REPORT
36
Financial assets designated at fair value through profit or loss at inception are those that are managed and their performance evaluated on a fair value basis in accordance with the Group’s documented investment strategy. The Trust’s policy is for the Responsible Entity to evaluate the information about these financial instruments on a fair value basis together with other related financial information. (ii) Recognition/derecognition Financial assets and financial liabilities are recognised on the date the Group becomes party to the contractual agreement (trade date) and it recognises changes in fair value of the financial assets or financial liabilities from this date. Investments are derecognised when the right to receive cash flows from the investments has expired or the Trust has transferred substantially all risks and rewards of ownership. (iii) Measurement Financial assets and liabilities held at fair value through profit or loss At initial recognition, financial assets are recognised at fair value. Transaction costs of financial assets carried at fair value through profit or loss are expensed in profit or loss. The fair value of financial assets and liabilities traded in active markets is subsequently based on their quoted market prices at the end of the reporting period without any deduction for estimated future selling costs. The quoted market price used for financial assets held by the Group is the current bid price and the quoted market price for financial liabilities is the current asking price. The fair value of financial assets and liabilities that are not traded in an active market are determined using valuation techniques. Accordingly, there may be a difference between the fair value at initial recognition and amounts determined using a valuation technique. If such a difference exists, the Trust recognises the difference in profit or loss to reflect a change in factors, including time that market participants would consider in setting a price. Further detail on how the fair values of financial instruments are determined is disclosed in note 8. (iv) Loans and receivables Loan assets are measured initially at fair value plus transaction costs and subsequently amortised using the effective interest rate method, less impairment losses if any. Such assets are reviewed at the end of each reporting period to determine whether there is objective evidence of impairment. If evidence of impairment exists, an impairment loss is recognised in profit or loss as the difference between the asset’s carrying amount and the present value of estimated future cash flows discounted at the original effective interest rate. If in a subsequent period the amount of an impairment loss recognised on a financial asset carried at amortised cost decreases and the decrease can be linked objectively to an event occurring after the write-down, the write-down is reversed through profit or loss. (v) Offsetting financial instruments Financial assets and liabilities are offset and the net amount reported in the consolidated balance sheet when there is a legally enforceable right to offset the recognised amounts and there is an intention to settle on a net basis, or realise the asset and settle the liability simultaneously. (i) Provisions A provision is recognised when the Trust has a legal or constructive obligation as a result of past events, it is probable that an outflow of resources will be required to settle the obligation and the amount can be reliably estimated. Provisions are measured at the present value of the Trust’s

VIVA ENERGY REIT TRUST 31 DECEMBER 2019 FINANCIAL REPORT
37
best estimate of the expenditure required to settle the present obligation at the end of the reporting period. The discount rate used to determine the present value reflects current market assessments of the time value of money and the risks specific to the liability. (j) Rounding of amounts The Trust is an entity of a kind referred to in ASIC Legislative Instrument 2016/191, relating to the ‘rounding off’ of amounts in the financial statements. Amounts in the financial statements have been rounded to the nearest thousand dollars in accordance with that instrument, unless otherwise indicated. (k) New accounting standards and interpretations not yet adopted There are no issued standards that are not yet effective and that are expected to have a material impact on the entity in the current or future reporting periods and on foreseeable future transactions.

VIVA ENERGY REIT TRUST 31 DECEMBER 2019 FINANCIAL REPORT
38
DIRECTORS’ DECLARATION
In the Directors’ of the Responsible Entity’s opinion: (a) the financial statements and notes set out on pages 10 to 37 are in accordance with the
Corporations Act 2001, including:
(i) complying with Accounting Standards, the Corporations Regulations 2001 and other mandatory professional reporting requirements; and
(ii) giving a true and fair view of the Trust’s financial position as at 31 December 2019 and of its performance for the financial year ended on that date; and
(b) there are reasonable grounds to believe that the Trust will be able to pay its debts as and
when they become due and payable. Note 1(c) to the consolidated financial statements confirms that the financial statements also comply with International Financial Reporting Standards as issued by the International Accounting Standards Board. The Directors have been given the declarations of the Chief Executive Officer and Chief Financial Officer required by section 295A of the Corporations Act 2001. This declaration is made in accordance with a resolution of the Directors.
Laurence Brindle Chairman 20 February 2020

VIVA ENERGY REIT TRUST 31 DECEMBER 2019 FINANCIAL REPORT
39

VIVA ENERGY REIT TRUST 31 DECEMBER 2019 FINANCIAL REPORT
40

VIVA ENERGY REIT TRUST 31 DECEMBER 2019 FINANCIAL REPORT
41

VIVA ENERGY REIT TRUST 31 DECEMBER 2019 FINANCIAL REPORT
42
VIVA ENERGY REIT TRUST 31 DECEMBER 2019 FINANCIAL REPORT
43

VIVA ENERGY REIT TRUST 31 DECEMBER 2019 FINANCIAL REPORT
44
CORPORATE DIRECTORY Viva Energy REIT Trust ARSN 613 146 464
VER Limited ABN 43 609 868 000 AFSL 483795
Responsible Entity Registered office Level 16, 720 Bourke Street Docklands VIC 3008 Australia
www.vivaenergyreit.com.au Directors of VER Limited Laurence Brindle Georgina Lynch Stephen Newton Lachlan Pfeiffer Company Secretary Tina Mitas Auditor PricewaterhouseCoopers 2 Riverside Quay Southbank VIC 3006 Australia Security registry Link Market Services Limited Locked Bag A14 Sydney South NSW 1235 Australia Telephone: 1300 554 474 Investor enquiries and correspondence VER Manager Pty Limited Telephone: +61 2 9392 1400 Email: [email protected]