vladimir fonoberov (aimdyn inc, usa) igor mezic (uc santa barbara, usa)
TRANSCRIPT

Global Sensitivity-Based Calibration of Computer
ModelsVladimir Fonoberov (Aimdyn Inc, USA)
Igor Mezic (UC Santa Barbara, USA)

• Computer models of physical and biological systems
• Matching model outputs to known data• Global sensitivity• GoSUM software• Calibration of model of human
cardiovascular system• Conclusion
Outline
2

Complex models:• dynamical systems• 100s of parameters• 10s of outputs
Computer models of physical and biological systems
3

• Commonly, the cost function to be minimized is L2 norm of the difference between model outputs and real data
• For time-dependent outputs, both spectral and time domains can be matched, resulting in a better fit
Matching model outputs to known data
static model dynamic model
4

5
Global sensitivity• Global measure of importance of model
parameters for the outputs of interest• NOT local sensitivity, e.g. partial derivatives
around the nominal value• Global sensitivity allows us to find
parameters which are important over the entire range of interest of model parameters
• Very computationally intensive for very large models

6
Global sensitivity computation
• Derivative-based, e.g.
• First-order sensitivity index
• Total effect sensitivity index
Var f
Var(f )
i
i
ES
x
f ( )( )
i
dx
x
x x
Var(f ) Var f
Var(f )i
i
T
ES
x

7
Efficient way to compute sensitivity integrals• Direct evaluation of sensitivity integrals requires the
model executable to be available and has complexity of Nsamp Dimension model evaluations
• An analytical model representation can be created by “learning” the model (when dimension or model runtime is very large, this is the only way)
• We employ robust support vector regression (SVR) algorithms to learn the model
• The learning is based on maximizing predictive power of the analytical model representation

8
SVR for high-dimensional models
• Analytical model representation
where is kth input parameter sample• When the number of parameters D is large and the
number of samples N is comparable to or less than D, the analytical model representation may become over-smoothed
• This is because all parameters are considered equally important => model reduction is needed
2 2 20 0 01 1, 2 2, 3 3,
1
f ( ) exp ...N
k k k kk
C x X x X x X
x
0kX

9
Benefits of model reduction• Removing irrelevant parameters from the model
allows us to• Simplify the model• Find more accurate analytical model representation and
perform predictions• Identify important parameters and speed-up uncertainty
quantification, optimization, etc.

10
GoSUM software

11
Sample generation• Each of the D input parameters has a prescribed distribution (uniform,
Gaussian, exponential, discrete, etc.)• Depending on available time, one estimates the number of times N the
model executable can be run• GoSUM generates exactly N (D-dimensional) points that accurately
sample the joint probability distribution of input parameters using Latinized CVT (up to a few thousand samples) and DSample (any number of samples)
300 samples MC versus Latinized CVT
5,000 samples MC versus DSample
-4 -2 0 2 4-4
-2
0
2
4
-4 -2 0 2 4-4
-2
0
2
4
-4 -2 0 2 4-4
-2
0
2
4
-4 -2 0 2 4-4
-2
0
2
4

12
Model executable runs• Supported model executable formats
• Windows executable• MATLAB / Octave function• Simulink model• No executable (have model outputs)
• For every input sample, GoSUM evaluates the Model Executable in parallel (using a specified number of CPU cores)
• Model evaluations can be stopped by user
13
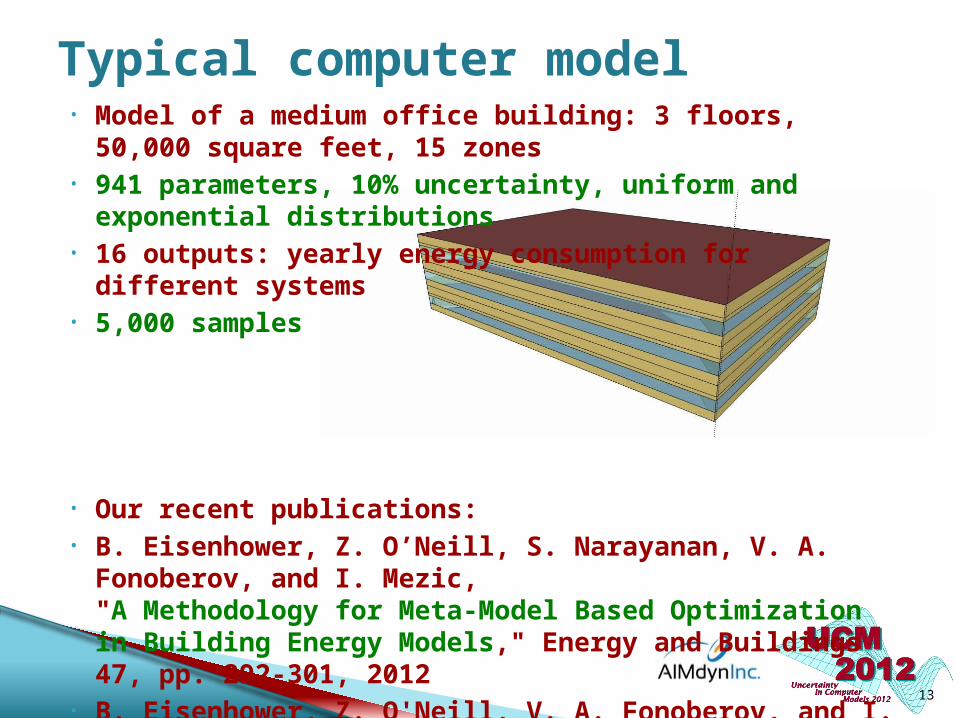
• Model of a medium office building: 3 floors, 50,000 square feet, 15 zones• 941 parameters, 10% uncertainty, uniform and exponential distributions• 16 outputs: yearly energy consumption for different systems• 5,000 samples
• Our recent publications:• B. Eisenhower, Z. O’Neill, S. Narayanan, V. A. Fonoberov, and I. Mezic,
"A Methodology for Meta-Model Based Optimization in Building Energy Models," Energy and Buildings 47, pp. 292-301, 2012
• B. Eisenhower, Z. O'Neill, V. A. Fonoberov, and I. Mezic, "Uncertainty and Sensitivity Decomposition of Building Energy Models," Journal of Building Performance Simulation 5, pp. 171-184, 2012
Typical computer model
14
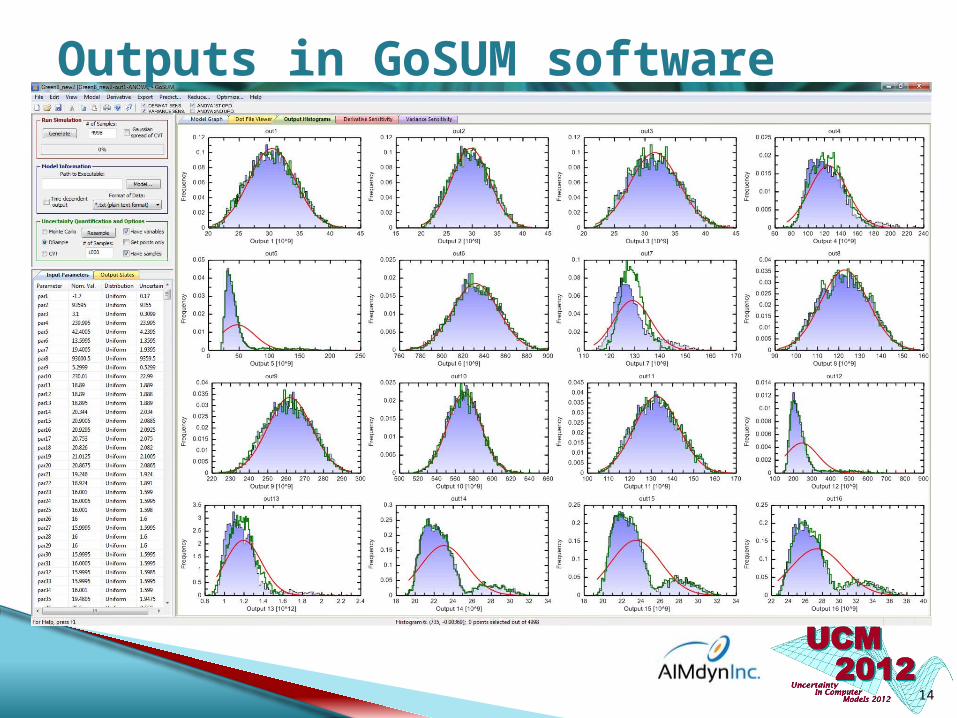
Outputs in GoSUM software

15
Learning analytical model representation
• GoSUM leans models using kernel-based support vector machine methods• With regularization of noisy data
• SVR (L2)• Epsilon-SVR (L1)• Nu-SVR (L1)
• Without noisy data regularization• RS (Response Surface)
• The learning is based on maximizing predictive power of analytical model representation
16
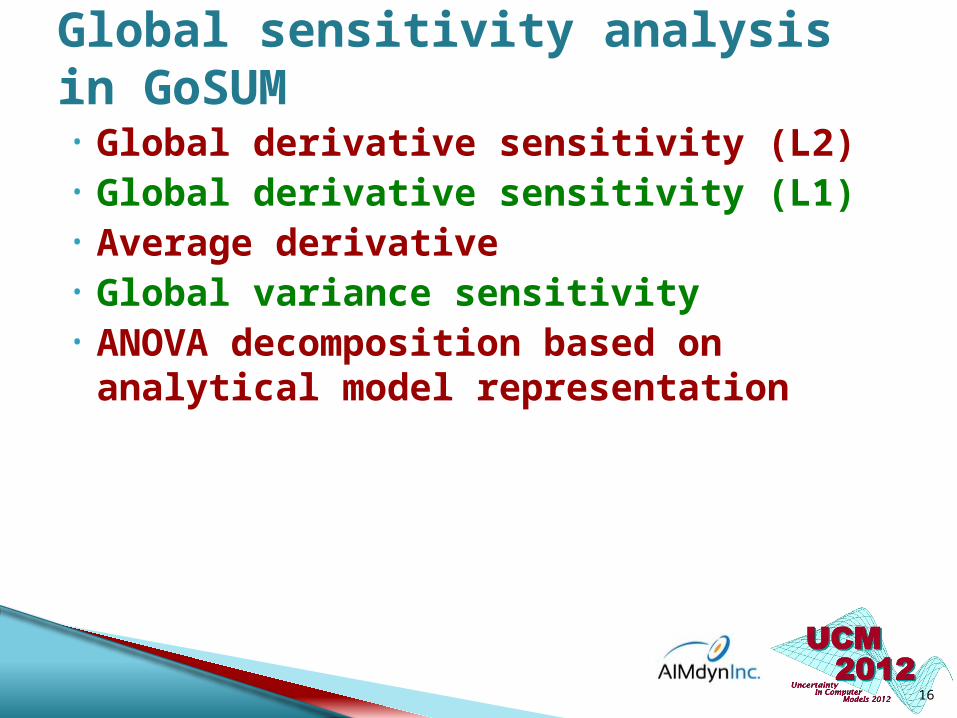
Global sensitivity analysis in GoSUM
• Global derivative sensitivity (L2)• Global derivative sensitivity (L1)• Average derivative• Global variance sensitivity• ANOVA decomposition based on analytical model
representation

17
Global sensitivity in GoSUM

18
Model reduction in GoSUM

19
Global optimization in GoSUM
• The problem is to minimize (or maximize) a function of model parameters and model outputsf(par1, par2, …, out1, out2, …)in a given range of parameters ai pari bi, i = 1, …, D and subject to arbitrary equality and/or inequality constrains
1000s of dimensions
global maximum

20
• Global stability option in GoSUM will perform global optimization off(par1, par2, …, out1, out2, …, unc1, unc2, …)in a given range of parameters ai pari bi, i = 1, …, D subject to arbitrary equality and/or inequality constrains and in the presence of uncertain parameters unc1, unc2, … with known distributions
Global stability optimization
requirement
level
operation point
out of specification
1000s of dimensions
functional regime

21
Optimization dialog

22
Optimization options

23
Correlated parameters in GoSUM
• When input samples are imported, arbitrary correlated distributions are automatically recognized
• Correlations are supported for all distributions types: continuous, discrete, categorical
• All correlations are regularized to reveal uncorrelated parameters
• Samples can be generated from arbitrary data-defined correlated distributions
• Optimization volume can be constrained by data boundaries
0
0.2
0.4
0.6
0.8
1
1.2
par1
1
1.5
2
2.5
3
3.5
4
1 1.5 2 2.5 3 3.5 4-2
-1
0
1
2
3
4
5
par1
par2
-2 -1 0 1 2 3 4 50
0.05
0.1
0.15
0.2
0.25
0.3
0.35
par2

Respi-ration
Vuev
Vusv
Vrv
Vlv
Emaxrv
Emaxlv
Heart Period
xTs xTv
Calibration of model of human cardiovascular system
B1, B2, 6P tasks300 seconds each
24
about 20 states and 100 parameters

Heart period time series and return maps
25

Heart period power spectral density (PSD)
26

27
Model calibration / parameterization• Define cost function to be minimized:
• Use GoSUM to analyze global sensitivity of cost function terms and identify the most important parameters
• Use GoSUM to minimize the cost function with respect to the most important parameters
• Use GoSUM to study sensitivity of the solution• Repeat the steps above for all subjects of interest
22222222
66666666
11111111
*15.0*15.0*5.1*5.1*75.0
*15.0*15.0*5.1*2.0*5.0*5.1
*15.0*15.0*5.1*5.1*75.0
BBBBBBBB
PPPPPPPP
BBBBBBBB
DAPTSAPTDAPSAPHPHPVHPHHLP
DAPTSAPTDAPSAPHPHPVHPHHLP
DAPTSAPTDAPSAPHPHPVHPHHLPC
HPL - relative difference (error) between power spectral density (PSD) of the calculated and experimental heart periods for low frequencies;HPH - heart period relative PSD error for high frequencies;HPV - heart period relative PSD error for very low frequencies;HP - relative error in mean heart period;SAP - relative error in mean systolic blood pressure;DAP - relative error in mean diastolic blood pressure;SAPT - systolic arterial pressure relative PSD error;DAPT - diastolic arterial pressure relative PSD error
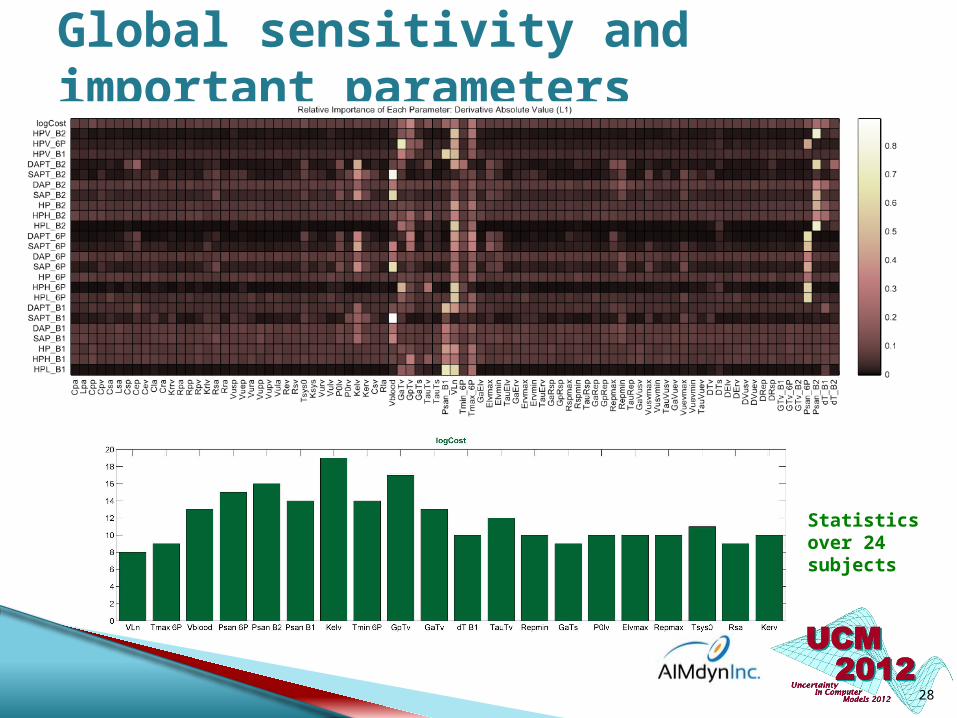
Global sensitivity and important parameters
Statistics over 24 subjects
28

Distribution of model parameters (24 subjects)
29
Model personalization is very important

30
Conclusion• A method for fast global sensitivity analysis of arbitrary high-
dimensional models is developed• A complex model of human cardiovascular system is studied
and calibrated for individual subjects• For the considered model, global-sensitivity based calibration
required optimization over only 25% of model parameters• All algorithms are implemented in our software GoSUM:
software documentation and online tutorials are available at http://aimdyn.com
• We would like to thank our sponsors and customers: Hamilton Sundstrand, Ford, Boeing, AFOSR, NIH, and DARPA