vlfv mrxuqdolv wkh2zqhu6rflhwlhv electronic …
TRANSCRIPT
Understanding the unconventional tautomerism in azacalixphyrins†:Electronic supporting information
Gabriel Marchand,∗,a Patrick Giraudeau,a,b Zhongrui Chen,c Mourad Elhabiri,d OlivierSiri∗,c and Denis Jacquemin∗a,b
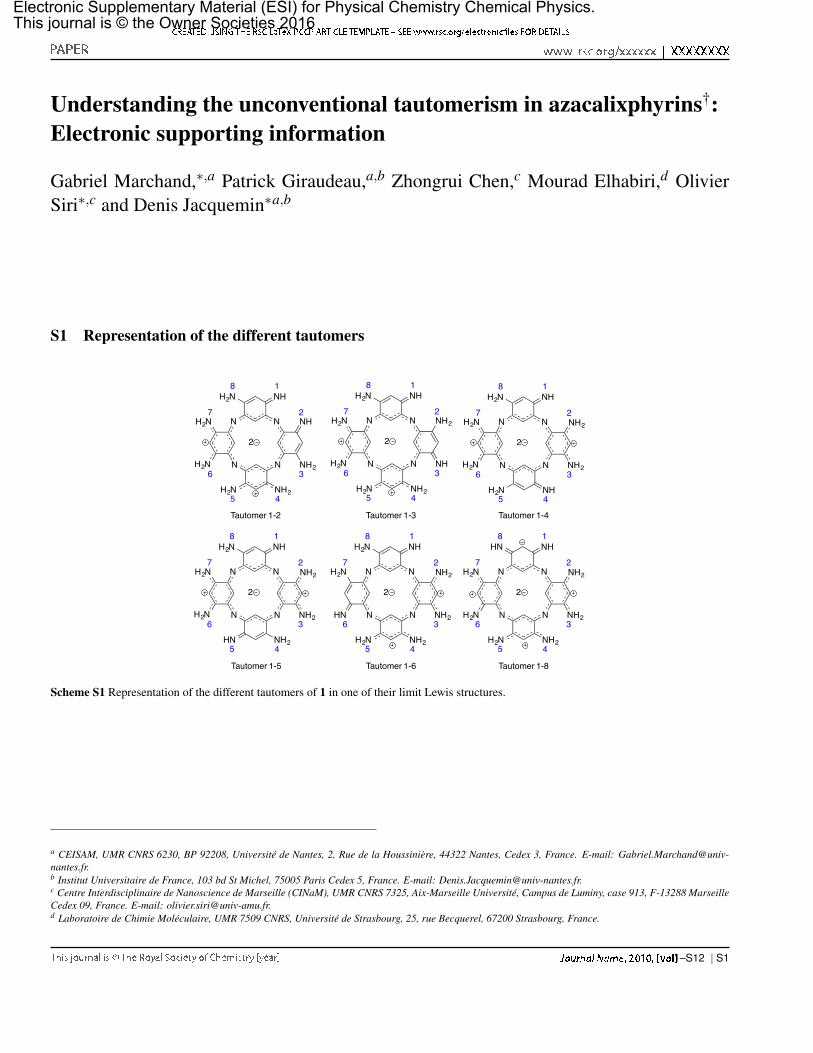
S1 Representation of the different tautomers
N
N N
NH2N
H2N
NH2
NH2
H2N NH
NH2HN
1
2
3
45
6
7
8
2
Tautomer 1-5
N
N N
NH2N
H2N
NH
NH2
H2N NH
NH2H2N
1
2
3
45
6
7
8
2
Tautomer 1-2
N
N N
NH2N
H2N
NH2
NH
H2N NH
NH2H2N
1
2
3
45
6
7
8
2
Tautomer 1-3
N
N N
NH2N
H2N
NH2
NH2
H2N NH
NHH2N
1
2
3
45
6
7
8
2
Tautomer 1-4
N
N N
NH2N
HN
NH2
NH2
H2N NH
NH2H2N
1
2
3
45
6
7
8
2
Tautomer 1-6
N
N N
NH2N
H2N
NH2
NH2
HN NH
NH2H2N
1
2
3
45
6
7
8
2
Tautomer 1-8
Scheme S1 Representation of the different tautomers of 1 in one of their limit Lewis structures.
a CEISAM, UMR CNRS 6230, BP 92208, Universite de Nantes, 2, Rue de la Houssiniere, 44322 Nantes, Cedex 3, France. E-mail: [email protected] Institut Universitaire de France, 103 bd St Michel, 75005 Paris Cedex 5, France. E-mail: [email protected] Centre Interdisciplinaire de Nanoscience de Marseille (CINaM), UMR CNRS 7325, Aix-Marseille Universite, Campus de Luminy, case 913, F-13288 MarseilleCedex 09, France. E-mail: [email protected] Laboratoire de Chimie Moleculaire, UMR 7509 CNRS, Universite de Strasbourg, 25, rue Becquerel, 67200 Strasbourg, France.
1–S12 | S1
Electronic Supplementary Material (ESI) for Physical Chemistry Chemical Physics.This journal is © the Owner Societies 2016

S2 Optical spectra and aromaticity
Table S1 Vertical S1 ← S0 excitation energy, ∆E, in eV, and oscillator strength, f , for the different tautomers. See caption of Table 2 in themain text for more details.
∆E/eVMethod 1-2 1-3 1-4 1-5 1-6 1-8
Gas (M06-2X) 1.56 1.47 1.45 1.31 1.55 0.72Water (PCM-B3LYP) 1.52 1.45 1.40 1.33 1.50 0.66
fMethod 1-2 1-3 1-4 1-5 1-6 1-8
Gas (M06-2X) 0.16 0.11 0.24 0.19 0.17 0.08Water (PCM-B3LYP) 0.12 0.09 0.22 0.15 0.15 0.06
Table S2 NICS(0), in ppm, at the centre of the macrocycle.
NICS/ppmMethod 1-2 1-3 1-4 1-5 1-6 1-8
Gas (M06-2X) -3.6 -4.1 -5.7 -7.8 -4.6 -2.8Water (PCM-B3LYP) -5.2 -5.3 -6.5 -7.6 -6.1 -6.2
Table S3 NICS(1), in ppm, determined at the PCM(water)-B3LYP level of theory.
NICS/ppm1-2 1-3 1-4 1-5 1-6 1-8-5.2 -5.2 -6.4 -7.4 -6.0 -6.5
S2 | 1–S12

S3 NMR spectra for 1
Fig. S1 1H NMR spectrum and signal integrations of 1 in DMSO-d6 with traces of H2O. The residual protonated DMSO (DMSO-d5) andwater signals are truncated. Experiments performed with presaturation of the water peak at 1×10⁻⁸ W (red) and 1×10⁻⁶ W (blue) arecompared to the spectrum recorded without presaturation (black). Spectra were recorded at 700 MHz and 303 K with a cryogenic probe (seeMethods). As observed for the protonated molecule 1.H++
2 , the NH2 signal of 1 is considerably attenuated upon presaturation due to the effectof chemical exchange with water, while the other signals are much less affected. The slight intensity decrease of some signals can beattributed to the cross-relaxation arising from dipolar interactions (see explanations in the body of the text).
1–S12 | S3

S4 Representation of the transition states
-1212.4 cm−1 -1593.3 cm−1 -1568.7 cm−1 -1211.1 cm−1
Fig. S2 Geometries of the transition states in the intramolecular tautomerisation mechanism in 1 (the minima are shown in Fig. 4a in the maintext). The arrows show the nuclear displacements along the vibrational mode with the imaginary frequency (in cm−1).
-486.1 cm−1 -551.0 cm−1 -914.4 cm−1 -559.8 cm−1
Fig. S3 Geometries of the transition states in the water-mediated tautomerisation mechanism in 1 (the minima are shown in Fig. 4b, maintext).
S4 | 1–S12

S5 Methodological impact (reaction paths of 1)
Fig. S4 Energies of the geometries of the minima and transition states in the intramolecular (left) and water-assisted (right) tautomerisationmechanisms, using the B3LYP or M06-2X DFT functionals, in gas phase and with the SMD (water) continuum solvation model.
1–S12 | S5

S6 Rotation of NH in 1 in the presence of explicit water molecules.
Fig. S5 Energies of the geometries of the minima and transition states obtained for the rotation of the imine (rate limiting step for theintramolecular tautomerism in 1) in the presence of two explicit water molecules. Results at theSMD(water)-B3LYP/6-311++G(d,p)//B3LYP/6-31G(d) level. Only the relevant part of the molecule is displayed for clarity.
S6 | 1–S12

S7 Water-assisted process: two shells of explicit water molecules
Fig. S6 Water-assisted 1-5 � 1-6 tautomerisation pathway of 1 with 20 surrounding water molecules. Results obtained at theSMD(water)-B3LYP/6-311++G(d,p)//B3LYP/6-31G(d) level.
1–S12 | S7

S8 Determination of the pKas of 1.H++2 in DMSO/H2O (80/20 v/v).
Distilled water was further purified by passing through a mixed bed of ion-exchanger (Bioblock Scientific R3-83002, M3-83006)and activated carbon (Bioblock Scientific ORC-83005). The distilled water and spectroscopic grade DMSO (Sigma, > 99.9%)were de-oxygenated using CO2- and O2-free argon prior to use (Sigma Oxiclear cartridge). The stock solutions were preparedby weighing the solid product using a Mettler Toledo XA Dual Range balance (precision 0.01 mg). The complete dissolution of1.H++
2 (chloride salt) in pure DMSO was achieved with the help of an ultrasonic bath. All physicochemical measurements werecarried out at 25.0 ± 0.2 oC.
2.5 mL of a stock solution of 1.H++2 in DMSO (4.42 × 10⁻⁴ M) were added to 40 mL of DMSO/water (80/20 v/v) con-
taining 0.1 M NaClO4 (NaClO4.H2O, Merck, p.a.; as supporting electrolyte for maintaining the ionic strength) in a jacketed cell(Metrohm) maintained at 25.0 ± 0.2 oC. The free hydrogen ion concentration was measured with a combined glass electrode(Metrohm 6.0234.500, Long Life) and an automatic titrator system 794 Basic Titrino (Metrohm). The Ag/AgCl reference glasselectrode was filled with 0.1 M DMSO/water (80:20 v/v) solution of NaClO4 (Fluka, p.a.) and calibrated as a hydrogen con-centration probe by titrating known amounts of freshly prepared perchloric acid (∼10-1 M from HClO4, PROLABO, normapur,70% min) with CO2-free sodium hydroxide solution (∼10−1 M from NaOH, BDH, AnalaR) prepared as well in DMSO/water(80:20 v/v).1 The GLEE program was applied for the glass electrode calibration and to check carbonate levels of the NaOHsolutions used (< 5%). The autodissociation constant pKw of the solvent was taken as 18.35.2 The initial pH of the 1.H++
2solution (2.47 × 10⁻⁵ M) was adjusted to ∼2.5 with HClO4, and the absorption spectrophotometric titrations versus pH (∼2.5< pH < ∼17) were carried out by addition of known volumes of NaOH solutions using the automatic titrator of the 794 BasicTitrino device. After each addition, an absorption spectra was repeatedly recorded using a Varian CARY 50 spectrophotometerfitted with Hellma optical fibers (Hellma, 041.002-UV) and an immersion probe made of quartz suprazil (Hellma, 661.500-QX)and interfaced (Cetrib) with the potentiometric unit. The absorption versus pH titration of 1.H++
2 was duplicated, and a goodagreement between the pKa values determined (see below).
The statistical processing of the spectrophotometric and potentiometric data sets was done with the Specfit program3–5
which adjusts the absorptivities and the stability constants of the species formed at equilibrium. Specfit uses factor analysis toreduce the absorbance matrix and to extract the eigenvalues prior to the multiwavelength fit of the reduced data set accordingto the Marquardt algorithm.6,7 Two pKa values were evidenced and are given below (the value in parentheses correspond to theduplicated titration).
1.H++2 ⇔ 1.H++H+; pKa1 = 12.50±0.05(12.05±0.08)
1.H+⇔ 1+H+; pKa2 = 15.21±0.03(14.86±0.08)
400 500 600 700 8000.0
0.2
0.4
0.6
0.8
2Abso
rban
ce
λ(nm)
1
400 500 600 700 8000
1
2
3
11H +
ε(x104
M-1cm
-1)
λ(nm)
1H2
++
4 6 8 10 12 14 16
0
20
40
60
80
100
1H+
11H2
++
%S
pec
ies
pH
Fig. S7 Left: UV-Vis. absorption spectrophotometric titration of the azacalixphyrin 1.H++2 (chloride salt) as a function of pH. Solvent:
DMSO/water (80:20 v/v); I = 0.1 M (NaClO4); T = 25.0(1) oC; [1.H++2 ]0 = 2.47 × 10⁻⁵ M; (1) pH = 2.70; (2) pH = 16.79. The absorption
spectra are not corrected from dilution effects. Centre: Absorption electronic spectra of the azacalixphyrin 1 and its protonated species 1.H+
and 1.H++2 . Solvent: DMSO/water (80:20 v/v); I = 0.1 M (NaClO4); T = 25.0(1) oC. Right: Distribution diagrams of the protonated species
of the azacalixphyrin 1 as a function of pH. Solvent: DMSO/water (80:20 v/v); I = 0.1 M (NaClO4); T = 25.0(1) oC.
S8 | 1–S12

S9 Rotation of the NH2 in 1
Fig. S8 Energy profiles for the rotation of non-equivalent NH2 (and NH) in 1. All results at theSMD(water)-B3LYP/6-311++G(d,p)//B3LYP/6-31G(d) level.
1–S12 | S9

S10 Chemical exchange in 1.H++2
Fig. S9 Energy profile for the exchange of proton in one amine/iminium function of 1.H++2 . The starting and final macrocycle have the same
protonation state, but one proton has been exchanged (brown/green) with the surrounding solvent molecules. For clarity, only the relevant partof the molecule is displayed. All results obtained at the SMD(water)-B3LYP level.
S10 | 1–S12

S11 Reaction profile for H-exchange with CH
Fig. S10 Geometries and energies of the minima and transition state for the passage from a non-protonated CH group located in between twoNH2 (left) to a protonated CH+
2 group located in between one NH2 and one NH (right).
1–S12 | S11

References
1 P. Gans and B. O’Sullivan, Talanta, 2000, 51, 33–37.2 R. Salvio, A. Casnati, L. Mandolini, F. Sansone and R. Ungaro, Org. Biomol. Chem., 2012, 10, 8941–8943.3 H. Gampp, M. Maeder, C. J. Meyer and A. D. Zuberbuhler, Talanta, 1985, 32, 95–101.4 H. Gampp, M. Maeder, C. J. Meyer and A. D. Zuberbuhler, Talanta, 1985, 32, 257–264.5 H. Gampp, M. Maeder, C. J. Meyer and A. D. Zuberbuhler, Talanta, 1986, 33, 943–951.6 D. W. Marquardt, J. Soc. Ind. Appl. Math., 1963, 11, 431–441.7 M. Maeder and A. D. Zuberbuehler, Anal. Chem., 1990, 62, 2220–2224.
S12 | 1–S12