vlsuo-vestibular interactions in the generation … · vlsuo-vestibular interactions in the...
TRANSCRIPT

VlSUO-VESTIBULAR INTERACTIONS
IN THE GENERATION OF RAPID
EYE MOVEMENTS
Marc van Wanrooij
Supervisors: drs. A. D. Van Beuzekomdr. J.A.M. Van Gisbergen
September 1999
Department of Medical Physics and BiophysicsUniversity of Nijmegen

Contents
1 Introduction
1.1 Common mechanisms for generation of saccades and quick phases
1.2 Shift in beating field and decay in slow phase velocity
1.3 Accuracy of memory-guided saccades in the presence of nystagmus
2 Methods
2.1 Subjects ..... . . . . .
2.2 Experimental setup . . . .......
2.3 Tasks and paradigms . . ......
2.4 Data analysis .... ...
3 Results
3.1 Vestibular nystagmus: shift of beating field and exponential decay . .
3.2 Visually-guided eye movements ...... ............
3.3 Temporal interactions between quick phases and the visually guided saccades
3.4 Temporal-spatial interactions
3.5 Spatial interactions: compensation for intervening eye movements
3
3
12
13
15
15
15
17
18
21
21
26
28
32
35
4 Discussion
4.1 Interaction of visual and vestibular signals ... . . . 47
4.2 Neurophysiological aspects regarding convergence of visual and vestibular signals. 53
References
A Memory-guided saccades after roll-rotation
A.l Introduction .....
A.2 Methods
55
61
61
61
1

CONTENTS
A. 3 Results and discussion
A.4 References
B Matlab-files
63
67
68

Chapter 1
Introduction
In the broadest sense, this study is about the convergence of visual and vestibular signals. It
reports about three experiments, whose scientific background will be discussed in the followingthree sections. The first section will describe the neurophysiological and behavioural data that
led to the idea that quick phases may influence the timing and metrics of visually-guided sac-
cades. The second section will explain a model of quick phase generation, which describes the
shift in the beating field during nystagmus. The final section reviews existing data regarding
the effects of intervening head and eye movements on the accuracy of targeting movements to a
remembered target.
1.1 Common mechanisms for generation of saccades and quick
phases
In primates, high-acuity vision is confined to only a small part of the retina, the fovea. In order
to move the fovea to a peripheral image of interest in the external world, a redirection of the
visual axis is required. However, by moving the eye in space, which is called a gaze shift, vision
becomes blurred because of the relatively slow retinal receptors. The solution to the problem
of moving the eye to another part of the visual field without disrupting vision, is to make the
gaze-shifting movements as fast as possible. Disruption of vision increases as a result, but the
period of time for which it occurs is decreased correspondingly.
Saccades are one type of these so-called rapid eye movements. They are essentially voluntary
and goal-directed. Visual stimuli are common as targets for these eye movements, but auditory
and tactile stimuli can also serve as goals. Another type of rapid eye movements are quick phases

CHAPTER 1. INTRODUCTION
of the vestibular ocular reflex, which is necessary for optimal perception of a visual image when
retinal slip is generated by head movements. During the slow phases, the vestibulo-ocularsystem produces rotations of the eyes that oppose rotations of the head, by using input from thesemicircular canals to match the velocity of the eyes with head velocity. These relatively slow
eye movements are interrupted by fast eye movements, the anti-compensatory quick phases, thatquickly reset the eye.
It is generally proposed that the generation of these rapid eye movements is provided by afinal common premotor mechanism. The supposition that these eye movements have a common
neuronal circuitry was already proposed in the early 1970s when it became evident that the
main sequence relations of these rapid eye movements were similar; both showed characteristicand comparable amplitude-duration and amplitude-peak velocity relations (Ron et al. 1972).Neurophysiological data support this idea, as will be shown in the following subsections.
This idea of commonality is the basis of this study, in which the effect of potential convergence
of vestibular and visual signals on the behaviour of rapid eye movements will be investigated.
For, if there is a common rapid eye movement generator, it is reasonable to assume that there
might be interactions between signals of vestibular and visual origin. Specific hypothetical pre-dictions about possible interactions will be detailed after the common components of the neuralcircuitry have been explained, in order to clarify the rationale behind our experiments.
Brainstem reticular formation
One site where saccade and quick phase signals have converged can be located in the brainstem
reticular formation, where premotor burst neurons and omnipause neurons (OPNs) are situ-ated. The former exhibit a burst of spikes in association with rapid eye movements, both for
saccades and vestibular quick phases, indicating that either at this or a higher level in the brain
convergence must occur. The premotor burst neurons are direction specific, discharging mostvigorously for rapid eye movements in a particular direction (on-direction). The burst of thesecells contains spatial information for the on-direction of these eye movements: the number ofspikes in a burst correlates with the amplitude, the intra-burst firing rate with the velocity, andthe burst duration with the duration of the eye movement (Cohen and Henn 1972; Keller 1974;
Luschei and Fuchs 1972).
Two types of premotor burst neurons exist: excitatory and inhibitory burst neurons (EBNsand IBNs, respectively). EBNs, located in the pontine paramedian reticular formation, are
active for horizontal components of rapid eye movements and other EBNs, located in the rostral

CHAPTER 1 INTRODUCTION
interstitial nucleus of the medial longitudinal fasciculus, fire for vertical or torsional components
of rapid eye movements. They have monosynaptic connections with ocular moto-neurons ofthe agonist muscle and act in unison with IBNs, which are located in the medullary reticularformation and inhibit the moto-neurons of the antagonist muscle. The result of the combined
signals of EBNs and IBNs is a conjugate rapid eye movement directed to the ipsilateral side.
sc
^iQEBN Eye
Figure 1.1 Convergence of visual and vestibular signals in burster-driving neu-
rons. This scheme suggests that burster-driving neurons (BDNs) receive excitatory informa-
tion from the superior colliculus (SC, neuronal connections between BDN and SC have not
been identified yet, and are therefore indicated by intercalated lines), a visual brain centre,
and the horizontal canals (HC) via type I vestibular nucleus neurons (VNs). Contralateral
rotation will increase the activity of BDNs, and in this way activation by the SC will be fa-
cilitated. BDNs will, because of their connections to excitatory burst neurons (EBNs), thus
have an head-velocity-related intermediate effect on saccades. AbMN, abducens motoneu-
rons; Type II VN, type II vestibular nucleus neuron. Excitatory neurons are indicated by
open circles, inhibitory neurons by filled circles. Figure adapted from Kitama and coworkers
(1995).

CHAPTER 1 INTRODUCTION
The convergence of the visual and vestibular signals at this level may be mediated by the
activity of burster-driving neurons (BDNs, Fig. 1.1, Ohki et al. 1988). These cells are locatedwithin and immediately below the prepositus hypoglossi nucleus (PHN). They have neuronal
projections to premotor burst neurons, and receive information from the vestibular nucleus(VN) and the superior colliculus (SC, pathway not yet identified). These cells are excited bycontralateral head rotation and exhibit a burst of spikes associated with contralateral quick
phases and saccades. The BDNs are hypothesised to be a site of interaction between saccadicand vestibular signals, because excitation of BDNs produced by stimulation of the ipsilateral
SC is facilitated by contralateral horizontal head rotation (Kitama et al. 1995).Other important neurons in the brainstem reticular formation are the OPNs. Like burst cells,
these neurons also show a change in activity correlated with both saccades and quick phases
(Cohen and Henn 1972; Evinger et al. 1982; Keller 1974; Luschei and Fuchs 1972). But whereasburst neurons give a burst of activity before and during rapid eye movements, the OPNs ceaseor decrease their activity during this period. During fixation and slow eye movements these
neurons, located in the nucleus raphe interpositus of the caudal pontine reticular formation
(Biittner-Ennever et al. 1982), discharge tonically, thereby inhibiting the burst generator towhich they project (for projections see: Curthoys et al. 1984; Langer and Kaneko 1983; Nakaoet al. 1980; Ohgaki et al. 1987; Strassman et al. 1987; for duration control see: Keller 1974;
Robinson 1975).
Their importance lies in the fact that they receive input from several sources, including theSC, PHN, VN and IBNs (Fig. 1.2), indicating the convergence and interaction of several signals,
including visual (SC) and vestibular (VN) information. The visual signal is a fixation signalwhich is most likely derived from fixation cells in the SC (for cat: Pare and Guitton 1994; formonkey: Munoz and Wurtz 1993). When this excitatory signal dies out, the activity of theOPNs ceases or decreases and by the consequent disinhibition of the premotor burst neurons a
saccadic eye movement can be produced. Note that the OPNs are not direction-specific; they
pause during rapid eye movements in all directions.

CHAPTER 1 INTRODUCTION
Prepositus Hypoglossi Nucleuseye position agnal?
bias
Superior Colliculusfixation signal?
Vestibular Nucleushead velocity signal?
"^Burst Generator
Inhibitory Burst Neuronslatch
Figure 1.2 Convergence of visual and vestibular inputs to the OPNs. OPNs
receive a bias input to insure their tonic activity during intersaccadic intervals (Scudder
1988), thereby inhibiting the burst generator (Biittner-Ennever and Buttner 1978; Curthoys
et al. 1984; Furuya and Markham 1982; Horn et al. 1994; Langer and Kaneko 1983; Nakao
et al. 1980, 1988; Ohgaki et al. 1987, 1989; Strassman et al. 1987), including the inhibitory
burst neurons. A visually guided saccade can be made only if the signal from the SC
fixation neurons fades (Pare and Guitton 1994). The OPNs will then pause, and the burst
generator will be disinhibited. The generation of the vestibular quick phases are assumed
to be mediated by signals form the vestibular nucleus (Ito et al. 1986) and the prepositus
hypoglossi nucleus (Ito et al. 1984; Langer and Kaneko 1984, 1990). The head-velocity
signals will initiate the pause in activity of OPNs, while the eye position signal will end
it, thereby marking the beginning and end of quick phases. The inhibitory burst neurons
inhibit the OPNs during saccades. Figure obtained from Pare and Guitton (1998).
For the generation of quick phases at OPN-level the PHN and the VN are important struc-
tures. From the PHN excitatory unilateral eye position signals are released (Ito et al. 1984;
Langer and Kaneko 1984, 1990), while OPNs are inhibited by the bilateral head-velocity signals
from the VN (Ito et al. 1986). At a constant head velocity, the OPNs are inhibited, thereby
7

CHAPTER 1. INTRODUCTION
enabling the generation of quick phases. During the quick phase the eye position signal will
increase until it is stronger than the head velocity signal. At this time the OPNs will be active
again, and a subsequent slow phase can be made.
A possible effect of all these signals working on these cells, could be that they facilitate each
other. Take for example the visual fixation signal and the vestibular signal from the VN. The
tonic activity of the OPNs is increased by the fixation signal, but is inhibited by the vestibular
signal. So, during rotation, the activity of the OPNs is reduced during quick phases.
All in all, neurophysiological data of the brainstem reticular formation indicate that vestibu-
lar and visual signals can converge and interact with each other. This could lead to several
interactions which effect the behaviour of eye movements. Other centres in the brain where
vestibular and visual information converge shall now also be described.
Superior Colliculus
One of these other possible sites of convergence is the SC. The SC is an important structure that
is involved in the control of saccadic eye movements. This structure, located in the midbrain,
has several layers, which can be identified anatomically and physiologically. The superficial
layers contain neurons which respond to visual stimuli that are located in a limited area of the
visual surroundings: the visual receptive field. These neurons are not scattered randomly across
the SC, but are organised in a retinotopic map : SC neurons with adjacent visual receptive
fields are located closely to each other (Cynader and Berman 1972). This map is therefore
a topographical representation of the retina and thus of the visual field. It is not linear in
that more central parts of the retina have an expanded representation on the collicular surface.
This retinotopically coded visual map corresponds closely with the retinotopically coded motor
map located in the intermediate layers of the SC (Robinson 1972). Several different types ofneurons are situated in this part of the SC, of which three shall be described further in relation
to visual-vestibular-convergence: saccade-related burst neurons, fixation neurons and build-up
neurons.
Saccade-related burst neurons in the SC discharge in relation to saccades (Schiller and Ko-
erner 1971; Sparks, 1978; Sparks et al. 1976; Wurtz and Goldberg 1971, 1972), as well as
responding to the onset of visual stimuli. This increase in activity is also present before the
onset of quick phases ofvestibular and optokinetic nystagmus (Schiller and Stryker 1972). The
burst neurons have so-called movement fields: the increase in activity is temporally related to
the onset of rapid eye movements with a limited range in amplitude and direction. In fact, the
CHAPTER 1 INTRODUCTION
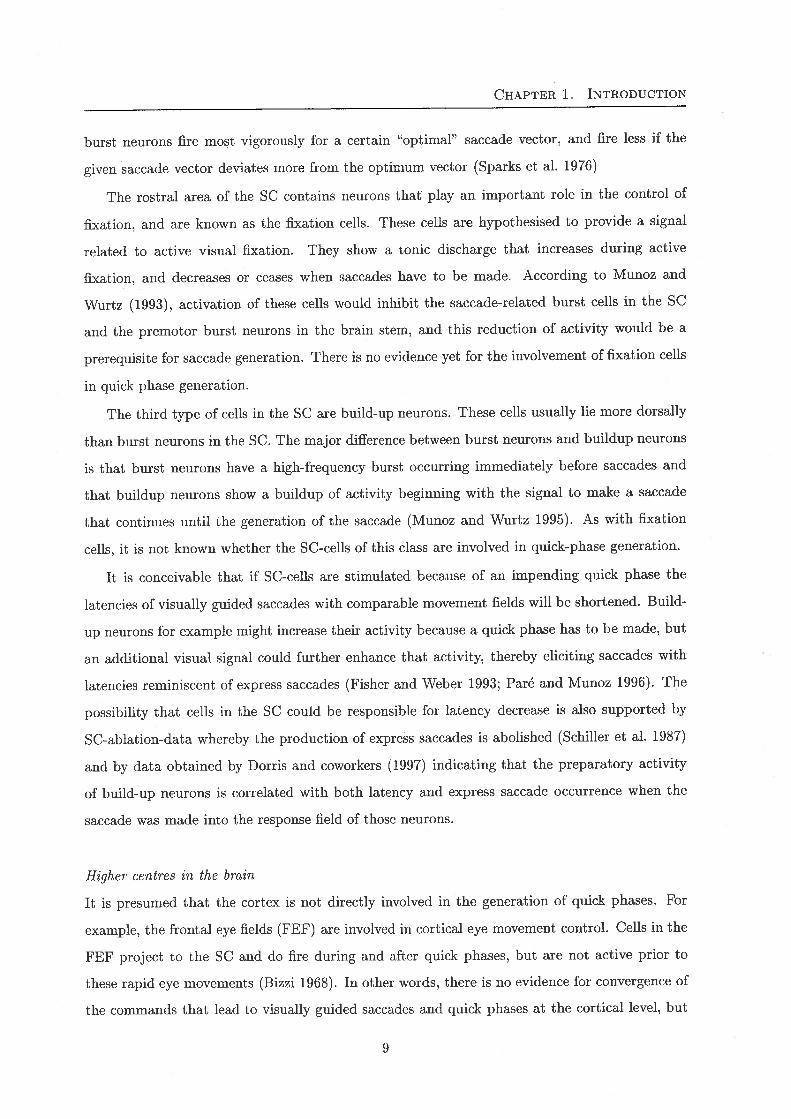
burst neurons fire most vigorously for a certain "optimal" saccade vector, and fire less if the
given saccade vector deviates more from the optimum vector (Sparks et al. 1976)The rostral area of the SC contains neurons that play an important role in the control of
fixation, and are known as the fixation cells. These cells are hypothesised to provide a signal
related to active visual fixation. They show a tonic discharge that increases during active
fixation, and decreases or ceases when saccades have to be made. According to Munoz and
Wurtz (1993), activation of these cells would inhibit the saccade-related burst cells in the SC
and the premotor burst neurons in the brain stem, and this reduction of activity would be a
prerequisite for saccade generation. There is no evidence yet for the involvement of fixation cells
in quick phase generation.
The third type of cells in the SC are build-up neurons. These cells usually lie more dorsally
than burst neurons in the SC. The major difference between burst neurons and buildup neurons
is that burst neurons have a high-frequency burst occurring immediately before saccades and
that buildup neurons show a buildup of activity beginning with the signal to make a saccade
that continues until the generation of the saccade (Munoz and Wurtz 1995). As with fixation
cells, it is not known whether the SC-cells of this class are involved in quick-phase generation.
It is conceivable that if SC-cells are stimulated because of an impending quick phase the
latencies of visually guided saccades with comparable movement fields will be shortened. Build-
up neurons for example might increase their activity because a quick phase has to be made, but
an additional visual signal could further enhance that activity, thereby eliciting saccades with
latencies reminiscent of express saccades (Fisher and Weber 1993; Pare and Munoz 1996). The
possibility that cells in the SC could be responsible for latency decrease is also supported by
SC-ablation-data whereby the production of express saccades is abolished (Schiller et al. 1987)
and by data obtained by Dorris and coworkers (1997) indicating that the preparatory activity
of build-up neurons is correlated with both latency and express saccade occurrence when the
saccade was made into the response field of those neurons.
Higher centres in the brain
It is presumed that the cortex is not directly involved in the generation of quick phases. For
example, the frontal eye fields (FEF) are involved in cortical eye movement control. Cells in the
FEF project to the SC and do fire during and after quick phases, but are not active prior to
these rapid eye movements (Bizzi 1968). In other words, there is no evidence for convergence of
the commands that lead to visually guided saccades and quick phases at the cortical level, but
9

CHAPTER 1. INTRODUCTION
it does occur in brainstem areas, and probably also in the SC.
Visual-vestibular convergence experiments
In this series of experiments we investigated whether any convergence did actually occur. The
main questions are whether the vestibular and visual signals can interact with each other with
respect to: 1) the timing of saccades to a visual target and 2) the metrics of rapid eye move-
ments. As stated before, it could be expected on the basis of neurophysiological data of the
SC that latency will become shorter if both inputs are preparing a rapid eye movement in thesame direction. Earlier behavioural data is limited (Judge 1973, Niemann and Hoffmann 1997),
but suggests the opposite: visually guided saccades show longer latencies during nystagmus
than in the absence of nystagmus. Judge, however, studied only the effects of quick phases on
oppositely-directed saccades. Since, as stated before, it is expected that only saccades with sim-
ilar movement fields as the vestibular quick phases are facilitated, this study should be regarded
as inconclusive. The increase in latency found by Niemann and Hoffman was obtained during
optokinetic nystagmus, and thus there was no vestibular component that could influence the
visual signals. In the present experiments we hoped to clarify more of the nature of interactionsbetween visually guided and vestibular induced rapid eye movements and their effects on latency.
Regarding the metrics of saccades, Worfolk and Abadi (1991) concluded that patients with
congenital nystagmus have a transition phase showing an averaging response between quickphases of congenital nystagmus and visually guided saccades before they make a correct saccade
to a visual target (see Fig. 1.3). This response is similar to data collected from normal subjectsresponding to double-step staircase stimuli (Becker and Jiirgens 1979; Ottes et al. 1984). End
positions of rapid eye movements between 90 and 180 ms after the stimulus were directed to
an average of the spatial locations of the initial and final target positions, depending on thedelay. Rapid eye movements occurring before 90 ms after visual target onset can be considered
as quick phases, while rapid eye movements during the transition phase are increasingly more
like visually guided saccades on the basis of their end positions. These results would also suggest
an interesting interaction between visual and vestibular signals on metrics. These experiments
will therefore also take this potential kind of interaction in consideration.
10

I I D- <0
t0
r ^ff. 6
^ II
3 ^ g IT t ^ ^ w I 2,
0 II ^ i I
i r I s y
& ^
I I z 0 I en § & § v ^ 3.
£-
to I sI I ^ -s s t I I & I s
-
g &
r i. &-
I
'3 .0
1 s
.
^ ?5. I
I § I g r g I I (N £"
^ < I £-
s-
^ I 00
~^I
i i. ^ I 0°
00 ^
R-
^
Q. ^r g- I .§
§ t Ir I i i I c+ I ^
I §I
3 ^ >
^? i
^ s
j ^ 1
a
^ ff-
Is y (D
t-t-i C
O £". I I I &-r !A I i i5-
^ I I §i -§ ^ I I I 1 § » '^
.s S
d) en
! 09 8 S9 I. I § i %
^ t w j I 0- i i I
kE
nd P
ositi
on (
%)
ro
S 8
S5
81
I I ?_
.(y
I
81
g 8
- i
^
§J
:^'::
^ +
!5
8
s s 0>
.
r t s* a s ro t
^++
End
Pos
ition
(%
)
SS
8 8
sL
:...-.
^
0 ? tD i z H I I

CHAPTER 1 INTRODUCTION
1.2 Shift in beating field and decay in slow phase velocity
When subjects are vestibulariy stimulated they produce vestibular nystagmus, a sequence of
vestibularly induced alternating quick and slow eye movements. The slow phases prevent retinal
slip that would be caused if no compensation was to take place and the quick phases counteract
the slow eye movements. However, the quick phases do not simply return the eye to the center
of the orbit. When subjects are rotated, the quick phases take the eye beyond the center of the
orbit in the anti-compensatory direction. Because of this, the field in space containing the quick
and slow phases, the beating field of nystagmus, will shift from straight ahead to a point in the
anti-compensatory direction. Chun and Robinson (1978) have proposed a model, based on data
from a single cat, to explain this phenomenon (Fig. 1.4).
This model includes two concepts: 1) a 'center of interest' for rapid eye movements and 2)
a triggering mechanism which monitors the difference between the center of interest and the
actual instantaneous eye position. The center of interest is a point in space at time t, C(t),
measured with respect to the head, which is of immediate interest for the visual system. It can
be influenced by the vestibular system in such a way that, if the head is turned to the left, the
center is also gradually shifted to the left. So, whenever a quick phase is generated it will be
aimed at this point C(t). The idea of a center of interest is of importance to this study since
it is dependent on both visual and vestibular signals, and might perhaps give an explanation of
the results ofWorfolk and Abadi (1991), in which quick phases end positions are influenced by
a visual target (see section 1.1).
The second concept, the triggering mechanism, will come into effect when a slow phase carries
the eye a fixed distance Q from C(t) at which time the next quick phase will be generated.
Because Q is a fixed measure (albeit dependent on head velocity), the shift in the center of
interest during rotations will cause a shift in the beating field. This shift in the beating field
occurs at the start of rotation, until C(t) reaches a steady state. The beating field will then
remain constant. It might be noted that this conceptual model has striking similarities with the
ideas on the role of OPNs, described by Pare and Guitton (1998).
12

CHAPTER 1. INTRODUCTION
Figure 1.4 Idealised eye position in response to a step of head velocity. E, eye
position; C, center of interest, the position in space to which the quick phases are directed;
Q, the difference between the end and beginning of quick phases. Figure adapted from Chun
and Robinson (1978).
1.3 Accuracy of memory-guided saccades in the presence of nys-
tagmus
This last section of the introduction will consider the effects of intervening movements on per-
formances in the remembered-target paradigm. Primates perform accurately when they have to
make memory-guided saccades in the dark to a position of a previously flashed target (Becker
and Fuchs 1969). This still holds true even when between the disappearance of the stimulus
and the onset of a saccade another intervening saccade was present, that was either voluntary
(Hallet and Lightstone 1976) or electrically stimulated (Sparks and Mays 1983). Intervening
smooth pursuit (Schlag et al. 1990) can also be compensated for, just as intervening gaze shifts
(Herter and Guitton 1998) and intervening head-in-space movements with no concurrent eye-
in-head movements (Israel and Berthoz 1989; Israel et al. 1993). All these data suggest that
the oculomotor system not only has access to retinal eye displacement information, but also
to extraretinal information. Programming of visually guided saccadic eye movements is there-
fore uot just based on a retinotopic model in which the direction and amplitude of saccades
13

CHAPTER 1. INTRODUCTION
is determined only by the "retinal error", i.e. the location of a target on the retina relative to
the fovea (Schiller and Koerner, 1971). Instead, extra-retinal information about intervening eye
movements can be added to the initial retinal error to yield accurate visually guided saccades.
Although much is known about the compensation of intervening eye and/or head movements,
there is no data for the compensation of intervening vestibular nystagmus. Since intervening
slow eye movements, such as smooth pursuit and VOR, and saccades can be compensated, one
could also expect this to be true for the combination of slow and quick phases of vestibular
nystagmus. To investigate this, nystagmus was elicited in the dark by rotating subjects around
their yaw-axis and asking them to perform a memory-guided saccade to a flashed target during
the rotation.
Chapter 2
Methods
2.1 Subjects
Seven male subjects, ranging in age from 21 to 54 years, participated in this study (AB, BB,
JG, MB, MW, MZ, VC). The subjects, all students or employees of the department, did not
have any known uncorrected visual, ocular-motor or vestibular abnormalities.
2.2 Experimental setup
Types of experiments
As mentioned earlier (see Introduction), this study is concerned with the effects of vestibularstimulation on visually guided saccades. Three types of experiments were done to investigate
this. The first experiment is to see whether any convergence between visual and vestibular signals
occurs during the generation of rapid eye movements (see section 1.1). The second experiment
deals with the shift of the beating field of nystagmus (section 1.2) and the last experiment deals
with the degree of compensation for intervening eye and/or head movements occurring beforememory-guided saccades (section 1.3). All of these experiments made use of the same basic
experimental setup: the subject was rotated about their yaw-axis in the dark by means of avestibular stimulator and had to look to visual targets. The specifics of the experimental setup
will be detailed first, and the differences between the paradigms will be explained in the next
section (section 2.3).
Vestibular stimulation
In order to examine the effects of vestibular stimulation on saccades which were directed towards
15

CHAPTER 2 METHODS
visual or remembered targets, the subject was rotated about his yaw-axis, using a motor-driven
vestibular stimulator which was constructed at the mechanical workshop of the Nijmegen Uni-
versity Science Faculty.
This apparatus consisted of three rotatable, nested frames which made it possible to rotate
the subject about any axis in space, by choosing the appropriate arrangement of the frames.
The outer ring could be adjusted manually about an earth-horizontal axis. It had a rotatable
connection with the middle ring, which was motor-driven and rotated about an axis perpen-
dicular to the plane of the outer ring. The inner ring could be turned by hand about an axis
perpendicular to the middle ring. Thus, the axis of rotation of each segment depended on the
positions of the outer segments. Rotation of the motor-driven middle ring was controlled by a
PC, which could impose any desired change in position using a constant rotational velocity of
up to 100 deg.s-l. The position of the middle ring was recorded using a digital position encoder
with an angular resolution of 0.04 deg.
The subject's seat and the coils that generated the magnetic fields, necessary for the eye-
position measurements (see below), were attached to the inner ring of the stimulator. The seat
was adjustable in height, in order to position the subject such that his cyclopean eye coincided
with the center of the magnetic field and with the axis of rotation.
The subject's head was stabilised firmly using an adjustable padded helmet attached to the
seat. This restriction of head movements did not cause any discomfort. During rotation, seat
belts and adjustable shoulder and hip supports minimised body movements with respect to the
seat. This assured the safety of the subject, and means that rotations can be considered as
whole-body rotations.
Visual targets
The visual display consisted of a row of 17 red Ught-emitting diodes (LEDs). They were mounted
equally spaced on a bar such that two neighbouring LEDs were ~5 deg apart. The bar was
attached to the magnetic field with the center LED in front of the subject's cyclopean eye, so
that the visual targets always moved with the subject. The bar could be placed horizontally
at eye-level or it could be positioned vertically in the mid-sagittal plane of the subject. The
distance between the subject and the LED-bar was ~0.35 m, resulting in a 0.5 - 0.8 deg visual
angle for each LED. The luminance of the visual targets was well above threshold, but did not
lead to any after-images. The target was sometimes seen as a blur, especially during rapid
nystagmus. The timing of the LEDs was controlled via a PC.
16

CHAPTER 2 METHODS
In order to obtain the exact positions of the LEDs on the display that was used, sessions
included a run in which all 16 peripheral LEDs were presented. The subject was instructed to
make an accurate saccade from the center LED to the peripheral target and maintain fixation
as long as the target was visible.
Eye movement measurements
Eye position was measured by applying the two-dimensional scleral magnetic induction searchcoil technique (Robinson 1963; Collewijn et al. 1975). The eye coil (Skalar, Delft) was placed
on the anesthetised right eye (OxybuprocaineHCl 0.4 %, Bournonville-Pharma b.v., Breda).
The two sets of coils (0.77 x 0.77 m) that generated the magnetic fields (see above) were
attached to the seat. They were positioned perpendicular to each other: one produced a hori-
zontal magnetic field, which oscillated at 38 kHz, the other a vertical field, which oscillated at
52 kHz. The voltage generated in the eye coil, which was a sine function of the angle of the
eye relative to the magnetic field, was amplified and demodulated in lock-in amplifiers (PAR
128A). Subsequently, the search coil signal was low-pass filtered (-3 dB at 200 Hz; 4th order
Bessel filter). The data were sampled with 12 bit resolution at a rate of 500 Hz per channel,
and stored on hard disk for off-line analysis.
2.3 Tasks and paradigms
Convergence of visual and vestibular signals during generation of rapid eye movements
To study the effects of possible convergence, both vestibular and visual stimuli had to be used.
In order to elicit vestibular nystagmus and a subsequent after-nystagmus response, the subject
was rotated in the dark about the yaw-axis. During a period of 61 s the chair was rotated at a
constant velocity of 100 deg.s-l, and then stopped abruptly. To study the effects of this vestibu-
lar stimulation on visually guided saccades, several visual targets were presented: in each run 32
targets were shown, 16 during rotation and 16 after rotation. Targets were presented at a singleeccentricity during each session; the two targets that were shown were spaced symmetrically
around the center LED. Two different eccentricities were used: during a given session it was
either ~8 or ~22 deg relative to straight-ahead. The smaller target-eccentricity of 8 deg was
chosen since it matched the size of many quick phases. Target direction (left or right) was ran-
demised so that the subject could not predict the required saccade direction. The targets were
17
CHAPTER 2. METHODS
presented at random intervals between two succeeding targets yielding time intervals between
2250 and 3750 ms. A target was lit for 500 ms, which meant that the target was still visible
when the saccade started.
The subject was instructed to shift his gaze to the presented target as quickly as possible,
fixate the target position and then return his gaze to straight ahead, until a new visual target
appeared. The vestibular rotation was repeated several times in each session, so that in each
session about 300 visually guided saccades were elicited. Between each run a pause was inserted
during which room-lights were turned on. The direction of rotation of the chair during each run
was opposite to the one in the run that preceded it.
As a control, the same sequence of visual targets was repeated in a condition where the
subject was stationary.
Shift of the beating field
To examine the shift in the beating field and the decay of slow-phase velocity, the paradigm was
essentially the same as the one described for the convergence-experiment (see above), except
that during some runs no visual targets were presented. In this way the effect of visual stimuli
on the time-course of the shift was investigated.
Memory-guided saccades during yaw-rotation
In these experiments the subject had to make a remembered target saccade to a flashed target
during ongoing yaw-rotation. The paradigm was similar to the one described above, except forthe duration of the visual stimulus: it was now 20 instead of 500 ms in order to exclude visual
feedback.
2.4 Data analysis
Calibration
Eye-position data for the calibration procedure were obtained by instructing the subject to make
saccades to 37 targets provided by red LEDs (0.1 - 0.2 deg in diameter) on a visual display with
known angular distances and directions. The center LED was aligned with the subject's naso-
occipital roll-axis, while the other LEDs were mounted on the cross sections of three concentric
circles with radii of 11, 22 and 31 deg and meridians every 30 deg. The subject was seated in
the stationary vestibular stimulator and looked at targets provided by the visual display. The
18
CHAPTER 2. METHODS
subject had to fixate the center LED, and, when a peripheral target appeared, had to make a
rapid and accurate eye movement to that LED and maintain fixation as long as the target was
visible. The responses during this run were used to train two three-layer back-propagation neu-
ral networks: one for the horizontal eye position signals, the other for the vertical eye position
signals. These trained neural networks, each containing three hidden units, were used to map
the raw data signals to calibrated eye-position signals.
Saccade detection
Rapid eye movements were detected by scanning the calibrated eye movement signals for threshold-
values of several parameters, which consisted of velocity and acceleration/deceleration for both
saccade onset and offset. This automatic detection was visually checked by the experimenter,
and could be adjusted manually if necessary.
After the onset and offset times had been determined by means of this detection-procedure,
the eye position data were combined with chair position data and stimulus conditions to com-
pute several eye movement parameters, like amplitude, direction and latency.
Saccade selection
During the visual-vestibular convergence-experiments (see section 2.3), the subject made bothvisually-guided saccades and quick phases of vestibular nystagmus. For later analysis, the visual
saccades sometimes had to be selected from all detected rapid eye movements on the basis of
visual latency, and their horizontal and vertical end position (see also Results,to know when the
selection-procedure was used). Rapid eye movements had to start within 50 to 500 ms after
target onset to be considered as a potential visual saccade. Furthermore, the horizontal andthe vertical end positions had to be within a square surrounding the target: approximately
6 deg of variation in either direction was allowed. This criterion could be adjusted per subject
if necessary, but the range was never more than 8 deg and never less than 2 deg.
The selection procedure was easier for some saccades than for others. To clarify this, a
description of the possible responses shall be given. First of all, since the subject was rotated
around the earth-vertical axis during the interaction-experiments and the LED-bar could be
positioned horizontally or vertically, the targets were either in the same plane as or in the plane
perpendicular to the nystagmus. Saccades perpendicular to the nystagmus were very easy to
distinguish from the quick phases, because they had clearly different end positions. "Large-
amplitude" saccades , those whose amplitude was ~22 deg, also had this advantage: their
19

CHAPTER 2 METHODS
amplitude was clearly larger than the size of the quick phases. Selection problems arose forsome of the saccades of ~8 deg, but not all. Several of these " small-amplitude" saccades did
not have end positions comparable to those of the quick phases, which facilitated their correct
selection.
It is useful to make a distinction between two types of responses: one in which the horizontal
component of the saccade had the same direction as the quick phase of the nystagmus, the
other in which the horizontal component of the saccade had the opposite direction. These
latter saccades were always easily selected. For later analysis, the term "with the beat" (WTB)
shall be used to describe saccades whose horizontal components are made with the beat of the
nystagmus, the label "against the beat" (ATB) shall be applied to saccades whose horizontal
components had the opposite direction of the quick phases.
For the small-amplitude WTB-saccades, made in the same plane as the nystagmus, latency
was the best parameter that could be used for this selection procedure. Usually, this meant that
saccades could be easily identified; if another rapid eye movement than the one selected were the
visually-guided saccade, latency would be too small (below 50 ms) or too large (above 500 ms)
compared to other visually-guided saccades.
20

Chapter 3
Results
3.1 Vestibular nystagmus: shift of beating field and exponential
decay
Shift of beating field
In order to investigate the interaction of visual and vestibular signals in the generation of rapid
eye movements, vestibular nystagmus was elicited by yaw-rotation. Using the stimulus shown inFig. 3.1 a head velocity of 100 °/s was reached after about 400 msec. Head velocity remained ata constant level from then on but the resulting nystagmus was non-stationary. In the subsection
that follows (subsection Exponential decay of slow-phase velocity) attention is paid to the well-
known decay in slow phase velocity. A less well-known phenomenon concerning the end position
of quick phases will be described here.
The beating field ofvestibular nystagmus rapidly shifted in the direction of perceived rotation
after passive whole-body rotation started. That is, the quick phases did not simply return the
eye to the center of the orbit, but they reset the eye beyond this position. A typical example ofthis phenomenon is shown in Fig. 3.1. This finding is similar to the one observed by Chun andRobinson (1978), who found that the end positions of quick phases also shifted in the directionof what they called the center of interest, C.
The maximum shift in the beating field, which will be defined as the maximum differ-
ence between half-amplitude values of slow phases and straight-ahead angular eye position (see
Fig. 3.1) during vestibular nystagmus or after-nystagmus before any visual targets were pre-
sented (time of presentation after start and stop of rotation was at least 1 s), was at all timesin the quick phase direction. When the data were pooled for subjects AB, JG and MW, the
21

CHAPTER 3. RESULTS
maximum shift in the beating field was 8.11 ± 5.92° during rotation. This was significantly
smaller (p = 0.02, t = -2.36) than the beat-shift of 11.1 ± 6.54° during after-nystagmus. This
is consistent with the notion that the deceleration was perceived by the subjects as being more
abrupt than the acceleration.
2000
500 1000Time (ms)
1500 2000
Figure 3.1 Shift of the beating field. A typical example of the shift of the beating field
is shown. Top: At 0 ms the rotation starts , which reaches a maximum velocity of 100°/s
after about 400 ms. Bottom: The quick phases drive the eye to the anti-compensatory
direction beyond the center of the orbit (dashed line). The dotted line connects the average
eye positions between slow phase onset and offset, indicating a shift in the beating field;
QP, quick phase; SP, slow phase; SHIFT, at this moment the shift of the beating field was
defined as maximal, 12° in this example as indicated by the arrow; TGT, visual target is
presented at this moment, subject: MW
22

ls3
w
3 y E"
ec
^ i ^ x I y I .1 << £- I £ t § ? t I I
I § I I os
r
I I. I IS
. 0
I (& I r ? s. § 3 I ec I c^-
ir
0 r
IS li it li 11II
I s
p-
H s t-
il <D Ec'
E"
r I t m I g
^ I r & I E" I I I Q g i I
EC
^ ^ ^ cr
?0 ! dq ^ I I § I
OT
^ t I I p
I § I I I ^ p g.
JT Q r I ^ §
^ 3
. §
. £
--I
00* mI
M 01
CL
^ (0
^l
5- H &r I ? I I
9 I9
? £ i I ^ I I § r
s ^ 01 ^ 3 § 5- I I ? I. s ? I I r I § I ^
r r i
3 § § r (& I I ^ ^ ^ f i i r §
I I r3. "? 3
I- p-
I §3
. " %
.I § I w § s:
I 3 r s
S I.
2. ?*.'
I en I
g I i r I
? ^
:0 0 I I g
i w M i I i I .a y I s- .a s § H §-
Offs
et p
ositi
on o
f qui
ck p
hase
(de
g)ro 0
1s
I yi
I -A
.
0on
01
01
gK
i § g
L
I Cd t w
CHAPTER 3. RESULTS
why Chun and Robinson did not address the slow decay of quick-phase end position. The time-
constant, Tgp, of the decay of quick-phase end position during runs without visual stimuli has avalue of 27.8 ± 14'.6 ms (mean ± sd, data pooled from subjects MB, N=2 runs, and MW, N=3
runs), while those with visual stimuli do not have systematic variations in quick-phase offset
positions. We observed that the decay of the quick phase end positions was strongly relatedto the decay of slow-phase velocity which is described in the following subsection (subsection
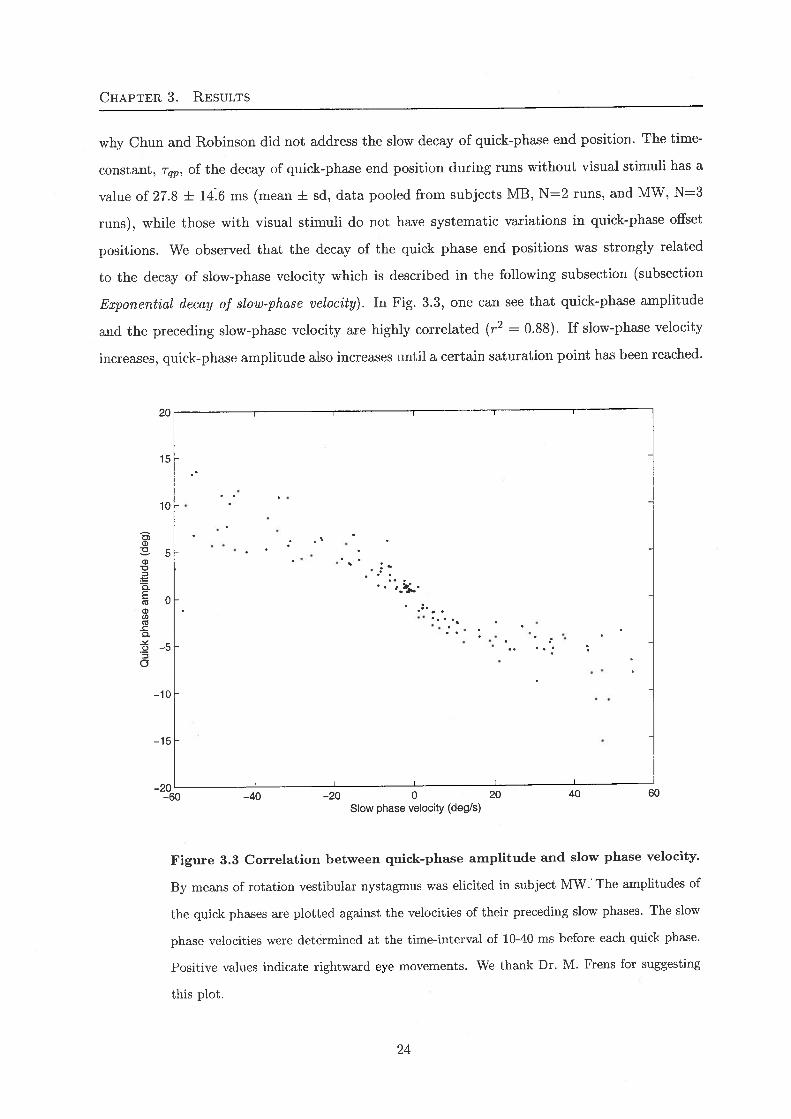
Exponential decay of slow-phase velocity). In Fig. 3.3, one can see that quick-phase amplitudeand the preceding slow-phase velocity are highly correlated (r2 = 0.88). If slow-phase velocity
increases, quick-phase amplitude also increases until a certain saturation point has been reached.
-2CL'--60 -40 -20 0 20
Slow phase velocity (deg/s)40
Figure 3.3 Correlation between quick-phase amplitude and slow phase velocity.
By means of rotation vestibular nystagmus was elicited in subject MW.' The amplitudes of
the quick phases are plotted against the velocities of their preceding slow phases. The slow
phase velocities were determined at the time-interval of 10-40 ms before each quick phase.
Positive values indicate rightward eye movements. We thank Dr. M. Frens for suggesting
this plot.
24
CHAPTER 3. RESULTS
The decay leads eventually to quick phases of which the end positions are on the opposite sideof straight-ahead position (Fig. 3.2). This occurs because of two reasons: the beating field shiftsin the compensatory direction and because the quick-phase direction (and thus the nystagmus)is reversed at the end of the rotation. A reversal in the sensation of ego-motion was also present
at this moment. The after-nystagmus induced by the abrupt stop showed a similar increase
and subsequent decrease of quick-phase end positions, except that this time the direction of the
quick phases is opposite to the previous ones during rotation.
60 r
.."'7--»-^
40Time (s)
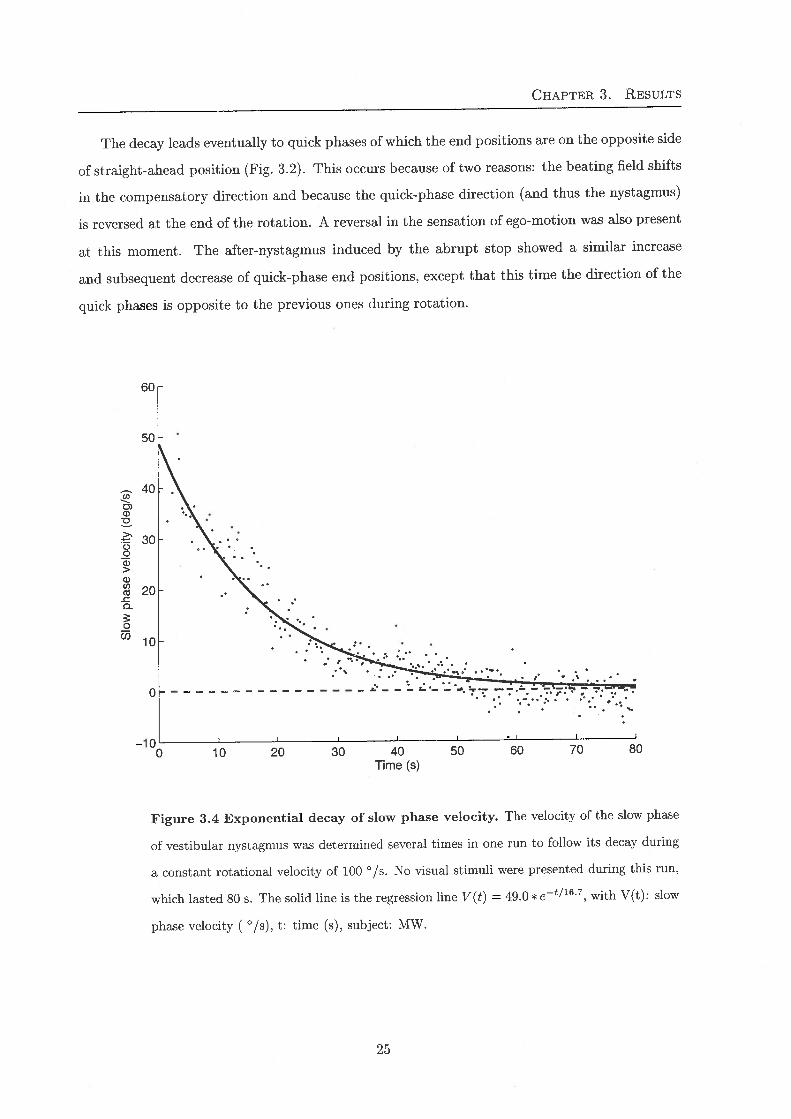
Figure 3.4 Exponential decay of slow phase velocity. The velocity of the slow phase
of vestibular nystagmus was determined several times in one run to follow its decay during
a constant rotational velocity of 100 °/s. No visual stimuli were presented during this run,
which lasted 80 s. The solid line is the regression line V(t} = 49.0 * e-t/16'7, with V(t): slow
phase velocity ( °/s), t: time (s), subject: MW.
25

CHAPTER 3. RESULTS
Exponential decay of slow-phase velocity
Because of the dynamics of the semicircular canals, the VOR-slow-phase velocity decays expo-
nentially, when a subject is exposed to a constant rotational velocity. Fig. 3.4 shows a typical
decrease of slow phase velocity during a rotation when no targets were presented to the subject,
indicating a maximum VOR gain of 0.49, and a time-constant T-sp of 16.7 s. The gain was smallerwhen visual targets (moving with the subject) were presented during the rotation (not shown).Nonetheless, ample quick phases were generated and the gain of the VOR was such that the
nystagmus had a considerable effect on eye position during the time between the offset of the
target and the onset of the saccade (see section 3.5).
During the rotation all subjects experienced a sensation of ego-motion, which, accompanying
the decay of slow-phase velocity, gradually declined. And even though the subjects could hear
the motor rotating the chair and feel the air-flow, the decline of this sensation was strong due
to the lack of optokinetic stimulation and the decline in vestibular perception. Some subjects
(JG, MW) noticed a reversal of the sensation after approximately 45 seconds of rotation. The
nystagmus also reversed at this point. At the time the rotation ended the subjects felt a motion
after effect, which had the opposite direction of the previous movement.
3.2 Visually-guided eye movements
The elicited visually guided saccades were embedded within the vestibular nystagmus during
the experiments, as can be seen in Fig. 3.5. Following stimuli in the quick phase direction (i.e.
with the beat, WTB), a saccadic response directed gaze towards the target. A slow phase and
sometimes also a quick phase could preceed this saccade. These WTB-saccades were hard to
differentiate from the quick phases, when the position of the visual target corresponded with
the end position of many quick phases. However, when these saccades were large or vertical, the
selection was straight forward (see Fig. 3.5 left-hand column).
The ATB-saccades were always easily detected (see Fig. 3.5 middle column). However, there
were also non-saccadic ATB-responses (see Fig. 3.5 right-hand column). In these cases an ATB-
saccade would be expected, but did not occur. Instead, a non-rapid eye movement directs gaze
towards the visual target. This kind of non-saccadic re-orientation of gaze was only made by
subject MB in 10 out of 50 ATB-trials, when target eccentricity was small ( ± 9 °). Other
researchers have already described this phenomenon, and stated that it occurs more often in
subjects with high intensity nystagmus (Collewijn et al. 1985).
26

CHAPTER 3. RESULTS
WTB ATB - saccadic ATB - nonsaccadic
^v\^/\\^AAA/\/
S^SN^fsJV
Time
Figure 3.5 Saccadic and non-saccadic responses to WTB- and ATB-stimuli. Each
example shown here is derived from a 3 s trial. Range of the eye position is 45°. The dash
indicates the position and the duration of the visual target. Left: WTB-saccades. When the
WTB-saccades are large, they are easily distinguished from the quick phases (top). This is
not the case when WTB-saccade and quick-phase amplitude are similar (middle). Bottom-
left: a vertical (V) saccade is required, and the target is a flash-stimulus. H: horizontal eye
position trace. Middle: ATB-saccades. These ATB-saccades are always easily distinguished.
Right: Subject MB not only made saccadic responses to ATB-stimuli, non-saccadic responses
were also elicited. For each shown trial, the subject is mentioned in the top-left corner of
the picture.
27
CHAPTER 3. RESULTS
3.3 Temporal interactions between quick phases and the visu-
ally guided saccades
The next sections will address the influence of the visual-saccade task on vestibular nystagmus
and vice versa. Frequency histograms of saccade latency and quick phase onset are given in
Fig. 3.6 for trials in which the eccentricity of the visual target, relative to straight ahead, wassmall ( ± 9 °). In this condition the amplitude of the saccades and the amplitude of the quick
phases were about equal during WTB-trials; amplitudes were ± 5 °, which is less than the
eccentricity of the visual target. This is related to the shift of the beating field; subjects were
already looking in the direction of the target before it appeared.
In the control experiments, the latency of the saccades was 181 ± 37.9 ms. Since the
distinction between WTB-saccades and quick phases was not always clear (see also section 2.4
and 3.2), it was nigh impossible to determine the latency of these saccades. For subject MW
there is an increase in rapid eye movements 170 ms after target presentation, indicating that
visually-guided saccades are made mostly then. For subject MB, however, a clear starting point
of visually guided eye movements could not be detected. So, it is not clear whether WTB-
saccades are facilitated or not, because of the impossibility of differentiating between saccades
and quick phases in these situations.
The latency of the ATB-saccades was significantly longer than control latencies (269 ± 58.6,
p<0.001, t=13.4). It seems to be harder for subjects to make ATB-saccades while exhibiting
vestibular nystagmus. Furthermore, for subject MW an indication of a dip in quick phases can
be seen before the onset of ATB-saccades. A dip in the occurrence of rapid eye movements is
also indicated in the ATB-trials of subject MB, but it cannot be observed during the WTB-trials
of either subject.
In Fig. 3.7, the cumulative latency distribution is shown for runs in which the WTB-saccades
could be easily identified: the visually-guided saccades were large ( ± 20 °) and/or vertical and
were therefore conspicuous among the quick phases. Horizontal saccades have longer latencies
during vestibular nystagmus than during control experiments (p<0.001, t-test), the difference in
latency being 70 ms. This large difference is somewhat diminished during vertical saccades when
the target is shown for the long period of 500 ms, but is still significant for saccades made by MW
(a difference of 40 ms, p«0.001, t-test), and for ATB-saccades made by JG (p<0.05, t-test).However, for this subject's WTB-saccades the difference with control saccades is nonsignificant
(p>0.05, t-test). There is also no significant difference when the target is shown for just 20 ms
28

CHAPTER 3. RESULTS
(p>0.05, t-test). This diminishing difference seems to be, for subject JG, not because of shorterWTB- and ATB-saccade latency, but because of a longer control saccade latency. In no case
is there any facilitation of visually-guided saccades in such a way that latency is shortened
compared to control saccades.
Subject: MW Subject: MB60
40
20
20
I 15I"(0
CONTROL60
40
20
CONTROL
100 200 300 400
10
S 5
20
15
10
5
500 020 r
100 200 300 400 500
WTB WTB
100 200 300 400
15
10
s
500 '020 r
100 200 300 400 500
ATB15
10
5
ATB
I100 200 300
Latency (ms)400 500 100 200 300 400
Latency (ms)500
Figure 3.6 Latency histograms of first saccades and quick phases. Two subjects
were asked to make saccades to visual targets (duration of stimulus: 500 ms) during ongoing
vestibular nystagmus. The amplitude of the saccades was small (± 5 °), so that WTB-
saccade and quick phase amplitude were in the same range. Left: subject MW; right: subject
MB; top: control (no vestibular nystagmus); middle: trials containing WTB-saccades; bot-
torn: trials containing ATB-saccades. Grey bars contain all rapid eye movements. Selected
ATB-saccades are indicated by black bars. Note that ATB-saccades are more easily spotted
among the quick phases than WTB-saccades. Non-saccadic rapid eye movements made in
the same time period as visually guided saccades consist of both quick phases and corrective
saccades.
29

CHAPTER 3. RESULTS
100
50Subject: BB
20 . horizontal
500 ms
100
50
"0 200 400
g
100
50U)-0
1
E30
600 0100r
Subject: MW5 , vertical
500ms
50
<B-
Subject: JG
25 . horizontal
500 ms
400 600
/.
Subject: JG
20 , vertical
500ms
20000
50
400-^
600 0100[
200
Subject: MW20 , vertical
20ms
50
600
Subject: JG
20 , vertical
20ms
200 400Latency (ms)
600 200 400Latency (ms)
600
Figure 3.7 Cumulative distribution ofsaccade latency. Subjects were asked to make
saccades during vestibular nystagmus to several different visual stimuli. The visual target
had a horizontal or vertical eccentricity of 5, 20 or 25°, and was lit for either 500 or 20 ms, as
shown in the boxes. The flash-stimulus of 20 ms was used for the compensation-experiments
(see section 3.5), and is not explicitly needed for these convergence-experiments. These
saccades were all easily selected, contrary to the saccades in Fig. 3.6, because of their
amplitude and/or direction. Small dots: control saccades, o: WTB-saccades, .: ATB-
saccades.
The latency of the saccades is not dependent on the onset time during the run (Fig. 3.8 Top).In other words, the vehemence of the nystagmus is not responsible for the latency delay. This
is further corroborated by the independence of saccade latency on the time since previous quick
phase offset (Fig. 3.8 Bottom).
30

co
0 £L
C+
- ^
1.
Late
ncy
(m
s)ro
y -&
.y o>
8 8L
ate
ncy
(m
s)^ ^ § § §
0000
0)
n I w y B w I

CHAPTER 3. RESULTS
3.4 Temporal-spatial interactions
To investigate any possible temporal-spatial interactions, scatterplots were constructed by plot-
ting the end position of the rapid eye movements against its latency, irrespective of whether itis a quick phase or saccade. The end position was expressed by a percentage; 100 % represented
a rapid eye movement which ended at the visual target position, and 0 % represented the eye
position at the onset of the rapid eye movement. In Fig. 3.9, the end position scatterplots oftwo subjects (BB and JG) are shown. The eccentricity of the visual target was large (25-30°)in order to induce visually guided saccades whose end positions were clearly larger than the end
positions of the quick phases before target onset.
In these experiments, both subjects showed a clear distinction between quick phases and
visually guided saccades. Quick phases continued for some time after the onset of the visual
target, but their end position was not modified by the visual target. There was no transition
region showing an averaging response. The saccades started to occur at about 200 ms, whereas
the quick phases could end before this time (subject BB) or could overlap with the same time
period as the saccades (subject JG). Similar results are obtained (Fig. 3.10) from experimentswhere the direction is orthogonal to the direction of the quick phase; vestibular nystagmus is
induced in the horizontal plane and the visual target is presented in the vertical plane (see also
section 3.5).
32

End
Pos
ition
(%
)E
nd P
ositi
on (
%)
u~
g- I I I C-l
a
w w
I E" r 0 ^ g cr
a I r r I Oq i? s t M CT
I I §.
3 ^ I i ^.I 0
-
en I I I g ^ i g-
^ I. ^ ^ I
I £.
% I
! .§ ^3. I i ^ ^ I 1
5-
n 0'
^ I I s-
i ^
i i ^
0 S
.
s:
^.
a
^ ^ £
"&
-
1 § s,
<yx §
r
I !'
% ^
I ?
1 ^
2.
^ g CL
x
s a
I tCr
I 0- r I 1 r I i I V &? I
I 'SL
§ ^
^ §
:S
T.
i I § rS
. ec
ff-
E?
0 B
5 '-+ IT I
&. .?
. -2
a. & i i I I &-
I § I I v § EZ
-
I i 5 ^ ^ ^
.
! w <0 I 0- .a 0 § I I n i I s. 3'
Ul I s' I I I
0 I M i m ^

CHAPTER 3. RESULTS
20 ms visual stimulus-»-
500 ms visual stimulus
tfft»Aog --o---cr---
100 200 300 400 500
o^>-<8V °«>
100 200 300 400 500Latency (ms)
100 200 300Latency (ms)
400 500
Figure 3.10 End position scatterplots collected from subjects responding to ver-
tical visual stimuli. In these plots, the vertical end position of the rapid eye movements
after visual target presentation is shown as a function of latency. This time, the stimulus,
to which the eye had to move, had a duration of either 20 or 500 ms and had a large vertical
eccentricity (25-30 °), except for subject MW during the 500 ms stimulus (5 °). Open dots
represent quick phases of vestibular nystagmus and closed dots have been used to indicate
visually guided saccades. Averaging does not occur: only one visually-guided saccade occurs
at 50 % for subject JG under flash-conditions.
34

CHAPTER 3. RESULTS
3.5 Spatial interactions: compensation for intervening eye move-
ments
Another interesting question, studied in remembered target-experiments, is whether eye move-
ments induced by the vestibular stimulation between target offset and saccade onset are com-
pensated. In Fig. 3.11 an example of horizontal and vertical eye position traces is shown. Notethat the vestibular nystagmus is still present in the time-interval between target offset and the
start of visually guided saccades. If there were no compensation, these intervening eye move-
ments, consisting of slow phases and quick phases in the horizontal plane, would yield errors in
horizontal saccade performance. Therefore, even though in these experiments the saccades are
mainly vertical, errors made in the horizontal plane are the most interesting.
TGT,
-TGT,
Figure 3.11 Saccade performed during horizontal vestibular nystagmus. Shown
here are the horizontal {Eh) and vertical (£'") eye positions and the horizontal (TGTh) and
vertical (TGTv) target position. Nystagmus is predominant only in the horizontal plane, and
virtually absent in the vertical eye position trace. The three vertical dotted lines indicate
the moment of target offset (Ti), saccade onset (T-^,) and saccade offset (Ts). Target onset
is 20 ms before Ti. Note that, despite a total intervening horizontal eye movement of about
6 deg, the saccade reaches the flashed target almost perfectly. Subject: MW.
35

CHAPTER 3. RESULTS
The saccadic eye movement shown in Fig. 3.11 did reach the visual target accurately, but
there were also saccades which were not as accurate (Fig. 3.12). In this case, the intervening eye
movement, which only consists of a slow phase, seems to be responsible for the faulty saccade.
These two illustrations demonstrate two extremes; in one there is no compensation, in the
other there is total compensation. Many saccades, however, are not very accurate, but they
are also not completely ofi-target. In this section, the accuracy of the elicited saccades and
the required amount of compensation will be analysed in a more quantitive fashion. The main
question is whether subjects are encoding their visually-guided eye movements in a retinotopic
(no compensation) or a craniotopic (total compensation) frame of reference.
-TGT,
-TGT.
Figure 3.12 Another example of a saccade performed during horizontal vestibu-
lar nystagmus. The definitions are the same as in Fig. 3.11. This time the horizontal
component of the saccade is 4 deg off-target, with an intervening slow phase of about 6 deg.
Subject: MW.
36

CHAPTER 3. RESULTS
Theoretically, the elicited saccades could vary anywhere between completely accurate or
completely off-target. A completely accurate saccade would reach its goal perfectly. However,
this almost never occurs because of the properties of the oculomotor-system. Saccades are
usually somewhat smaller than necessary to reach the intended target, a phenomenon known as
'undershoot'. This undershoot is not constant forall saccades, but has a certain variation. So,
even when no intervening eye movements are present, completely accurate saccades are unlikely.
Completely ofF-target means that no compensation would be present and the errors in saccadic
performance would depend on the intervening nystagmus in such a way that horizontal error-amplitude equals the horizontal amplitude of the intervening eye movements. If this were the
case, saccades would be made in a retinotopic frame of reference.
The error distribution for saccades to remembered targets and the influence of intervening
slow phases are shown for subject MW in Fig 3.13. During control experiments, when no
nystagmus was elicited (Fig. 3.13 A), the errors scatter round zero. When the subject was
rotated, the distribution is similar to the control-experiments except that the variation in the
errors has become larger (Fig. 3.13 B). It is clearly harder for the subject to make accurate
saccades. However, this result may still be compatible with partial compensation.
In Fig. 3.13 C, the distribution of the intervening-slow-phase-amplitudes is shown. Actually,the distribution can be divided into two groups: intervening slow phases directed to the right and
those directed to the left. If these movements were not taken into account, the error distribution
during rotation would be similar to this amplitude distribution. This is clearly not the case.
During rotation the errors are not divided into two groups and the actual errors are certainly
not as large as the intervening slow phases. This implies that this subject shows at least some
(partial) compensation for intervening eye movements.
Quick phases were also present in several trials, which always contained slow phases as well.
In Fig. 3.14 B, the actual error distribution for these trials are shown. This distribution has
a larger variance than the one during control experiments (Fig. 3.14 A). Since quick phases
are directed opposite to slow phases, the cumulative amplitudes of both types of intervening
eye movements are somewhat smaller than the amplitudes for intervening slow phases discussed
above, as can be seen in Fig. 3.14 C. Because of this no difference in performance can be observed
between actual error distribution during rotation and the predicted amplitude distribution. In
other words, it seems as if no compensation is present when quick phases occur between target-
offset and saccade-onset.
37

CHAPTER 3. RESULTS
-15Errors (deg)
Figure 3.13 Influence of intervening slow phases on error distributions of re-
membered saccades. Subject had to make saccades to briefly flashed targets (stimulus
duration 20 ms). A: Errors during control-experiments without vestibular nystagmus. B:
Errors during rotation when slow phases were present between target offset and saccade
onset. C; Intervening slow phase amplitudes. All distributions scatter round zero. Errors
and amplitudes are defined only in the horizontal plane, because this is the plane in which
the involuntary eye movements are predominantly produced. Trials with intervening quick
phases were not included. Subject: MW.
38

CHAPTER 3. RESULTS
0
Actual
-L
-15
Wr-r-
-10 -5 10 15
T
Predicted
-15 -10 -5 10 15Errors (deg)
Figure 3.14 Influence of intervening eye movements on error distribution
of remembered saccades. A: Errors during control-experiments in which there
were no intervening eye movements. B: Errors during rotation when both slow
phases and quick phases of vestibular nystagmus were present between target offset
and saccade onset. C: Distribution of the cumulative amplitude of the intervening
eye movements. All errors and amplitudes scatter round zero. The errors and
amplitudes are defined only in the horizontal plane, because this is the plane in
which the involuntary eye movements are produced. Note that the amplitudes of
intervening eye movements are not divided into two clearly distinct groups as in
Fig.3.13. Subject: MW.
39

CHAPTER 3. RESULTS
Regression analysis
To answer the question, to what extent the subjects can compensate for these intervening eye
movements, we analysed the data using a multiple linear regression. Therefore, several parame-
ters that are important with regard to this problem will now be defined (see Fig. 3.15). Retinal
error (R) is defined as the position of the target relative to the eye at the time the target disap-
peared (To). If there were no intervening eye movements, a saccade equal to the retinal error willend on target. However, in our experiments, the eye moved during the time-interval between
target offset and saccade onset (E). So the required movement at the time of saccade start (Th),the motor error (M), does not equal the retinal error, but deviates from it by the intervening
eye movements: M = R- E. We tested whether saccades were made according to the retinalerror (retinotopic coordinates) or whether they were related to M because intervening eye move-
ments were taken into account (craniotopic frame of reference). For the analysis of the effect
of intervening slow phases on the horizontal saccade component (H) in absence of intervening
quick phases, two different equations were fitted:
H = aR+d
H = aR+bS+d.
(3.1)
(3.2)
The first equation corresponds to a strict retinotopic model if a = 1 and d = 0; Retinal
error would be fully accounted for, but intervening slow phases will cause discrepancies. The
coefficient d is the horizontal bias of the subject when performing vertical saccades (see also
below). The strict craniotopic model would apply if the second equation would yield a = 1,b = -1, and d = 0; Retinal error would still be taken fully into account, and bias, d, would still
be expected to be 0, the difference with the retinotopic model is that intervening slow phases
would be compensated for in saccade generation.
In Fig. 3.16, actual saccade amplitude is plotted against the retinal error (left-hand column)and the motor error (right-hand column) for one subject (MW) for trials devoid of intervening
quick phases. It is clear, that the motor error fits better with the actual saccade amplitude,and the regression line corresponds better with the unity-line. So, saccades seem to be executed
according to motor error, and it appears the subject uses a craniotopic frame of reference to
guide his eye movements.
40
CHAPTER 3. RESULTS
TGT
TGT
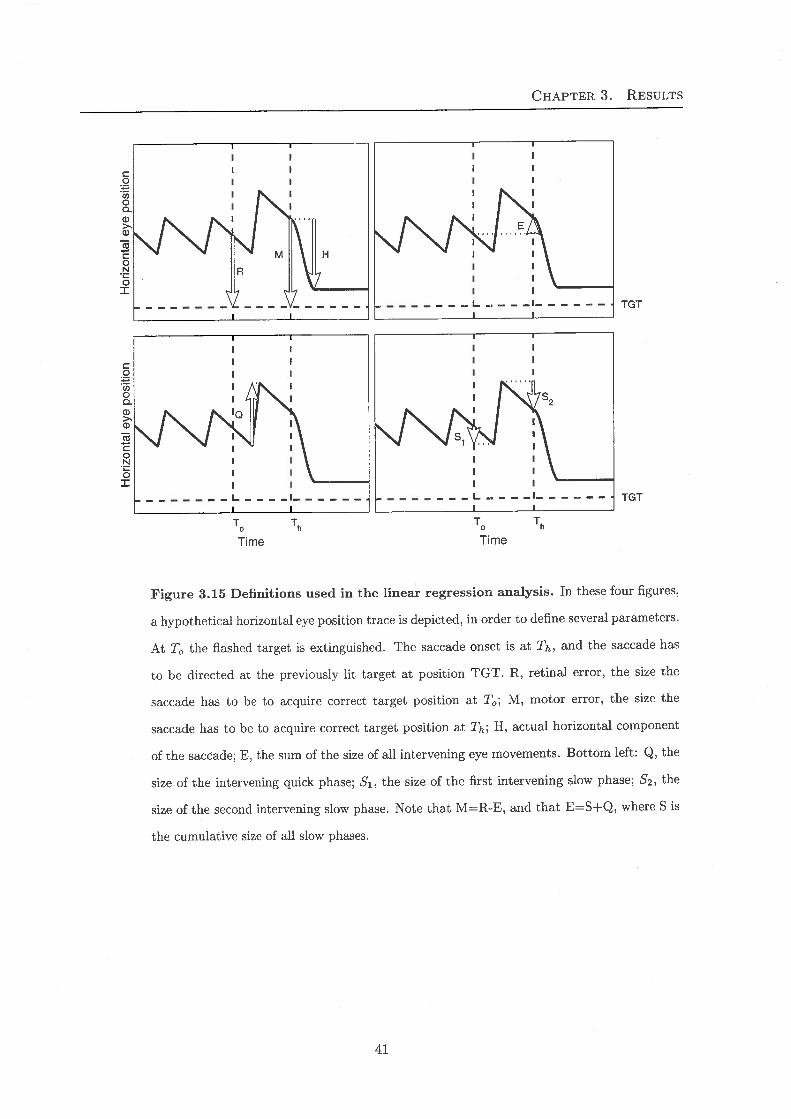
Figure 3.15 Definitions used in the linear regression analysis. In these four figures,
a hypothetical horizontal eye position trace is depicted, in order to define several parameters.
At To the flashed target is extinguished. The saccade onset is at Th, and the saccade has
to be directed at the previously lit target at position TGT. R, retinal error, the size the
saccade has to be to acquire correct target position at To; M, motor error, the size the
saccade has to be to acquire correct target position at TH; H, actual horizontal component
of the saccade; E, the sum of the size of all intervening eye movements. Bottom left: Q, the
size of the intervening quick phase; S'i, the size of the first intervening slow phase; 62, the
size of the second intervening slow phase. Note that M=R-E, and that E=S+Q, where S is
the cumulative size of all slow phases.
41

Im&C<
1
IfcIu(B
ep) apnt!|dujB oipeooes
0 10
f ^ oi
A .J.
I£.s10h
0<0
r-1
nIbe
h
i ^
>.
I
& i
I i
1IsIill
c5
-S N
i! I
0 -
S -
Q
§-
^
tt-s w1
I
11
2I&sI8I
IIIIIIs§
1IiQ2
Iec
CL>
II42Im^1IMsII^
-1I&s^I&
-
^1.II§
It
§
11Ii^I
coa;
'S 0
'&,
IM
.S
1s§IIII^
Icl=
!
'II1u
&b.^ <
u
§5
I -s2
II ^
aI
(D<is
II^
1!sIm"0
;aJ{I ISi^"30
1s00
00
IISb
1ec
1 J
s ^
^
Io3
I^?s
vw
0 ^
<3 c
6
J!
gtI<"
I^ri
0^con00
10
sIs-i I1
II I
2 ?
< -^
cri
IJSIII^I i
CO
V-9
ai .:
Ig-
1II;£ii-1
9
CHAPTER 3. RESULTS
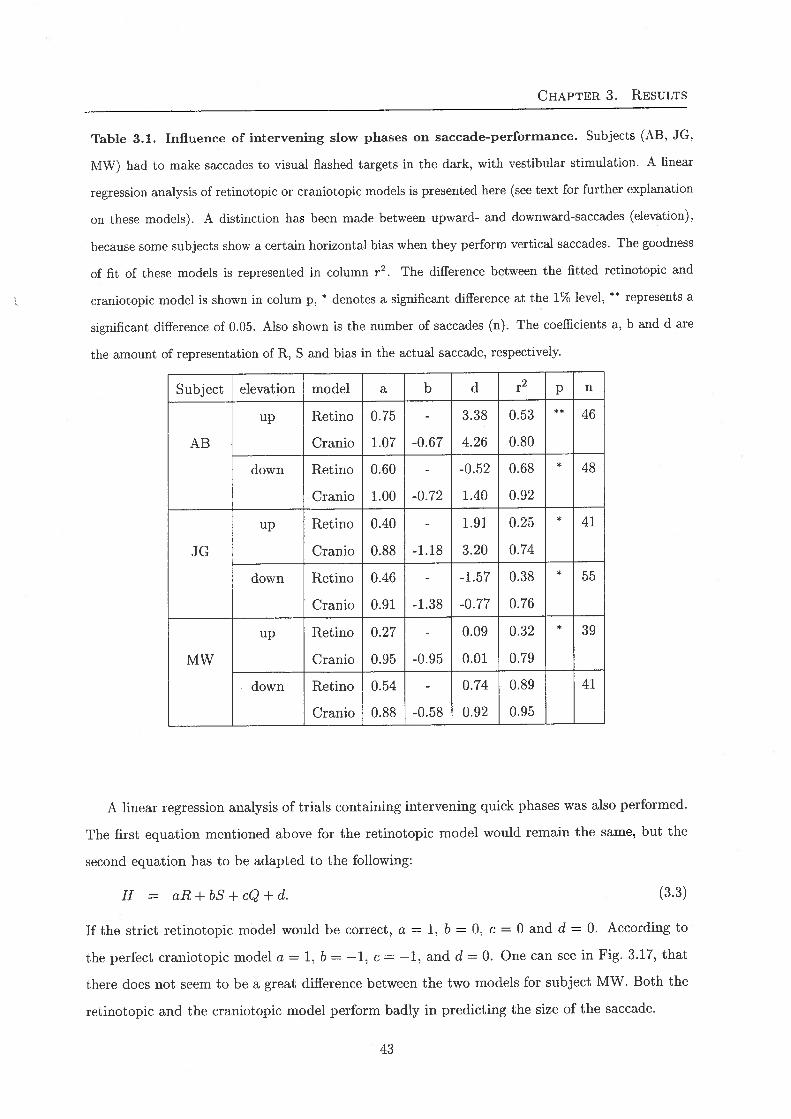
Table 3.1. Influence of intervening slow phases on saccade-performance. Subjects (AB, JG,
MW) had to make saccades to visual flashed targets in the dark, with vestibular stimulation. A linear
regression analysis of retinotopic or craniotopic models is presented here (see text for further explanation
on these models). A distinction has been made between upward- and downward-saccades (elevation),
because some subjects show a certain horizontal bias when they perform vertical saccades. The goodness
of fit of these models is represented in column r2. The difference between the fitted retinotopic and
craniotopic model is shown in colum p, * denotes a significant difference at the 1% level, ** represents a
significant difference of 0.05. Also shown is the number of saccades (n). The coefficients a, b and d are
the amount of representation of R, S and bias in the actual saccade, respectively.
Subject
AB
JG
MW
elevation
up
down
up
down
up
down
model
Retino
Cranio
Retino
Cranio
Retino
Cranio
Retino
Cranio
Retino
Cranio
Retino
Cranio
0.75
1.07
0.60
1.00
0.40
0.88
0.46
0.91
0.27
0.95
0.54
0.88
-0.67
-0.72
-1.18
-1.38
-0.95
-0.58
3.38
4.26
-0.52
1.40
1.91
3.20
-1.57
-0.77
0.09
0.01
0.74
0.92
0.53
0.80
0.68
0.92
0.25
0.74
0.38
0.76
0.32
0.79
0.89
0.95
n
46
48
41
55
39
41
A linear regression analysis of trials containing intervening quick phases was also performed.
The first equation mentioned above for the retinotopic model would remain the same, but the
second equation has to be adapted to the following:
H = aR+bS+cQ+d. (3.3)
If the strict retinotopic model would be correct, a=l,6=0,c=0 and d = 0. According to
the perfect craniotopic model a = 1, 6 = -1, c = -1, and d = 0. One can see in Fig. 3.17, that
there does not seem to be a great difference between the two models for subject MW. Both the
retinotopic and the craniotopic model perform badly in predicting the size of the saccade.
43
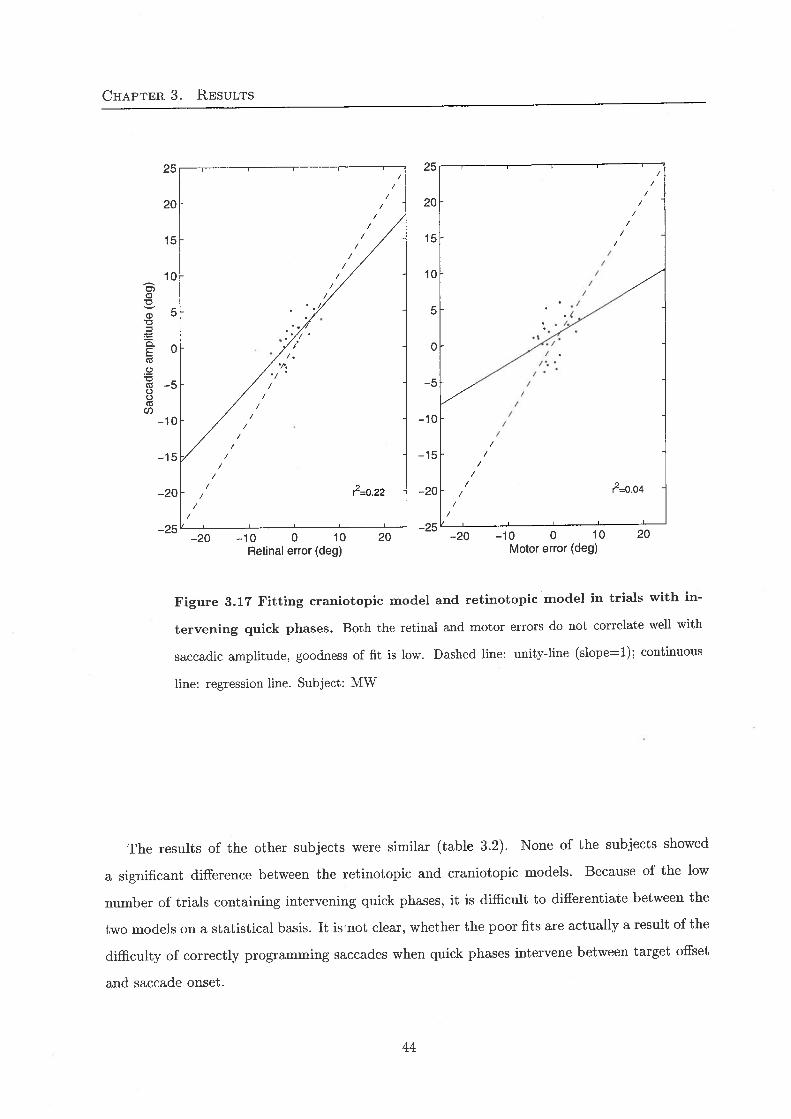
>^
rf^
&- II I § y s-
Ec I
I s,
C-h
2.
£L
co I 0
? O
T1.
1s
I.&
s."
5"g
m?
^
£-
£.
^ ^
-^ i I
^. ? If I I? en i I I ^ £U I Q
t 1 I
s co r c+
-
s CL I I I! c
r I s s I ^ I Q & i I i £»
^ iy. co
rt- f+
r ^
r I
s,
(-+
-
r I .1
£t ^
5" E
.
I s^ I w IS
? I ^ I !
g (Q § N I s ^
'<1 g I I
I r ^ ^ s ^ g"
I
I °-
0. g
11
I u q^ ^
& g 8 I
^ i I I I I ! I
I i I I 5-
m ?± '»
.
Sac
cadi
c am
plitu
de (
deg)
^ ^
Ui 0
0 I GO I I w
CHAPTER 3. RESULTS
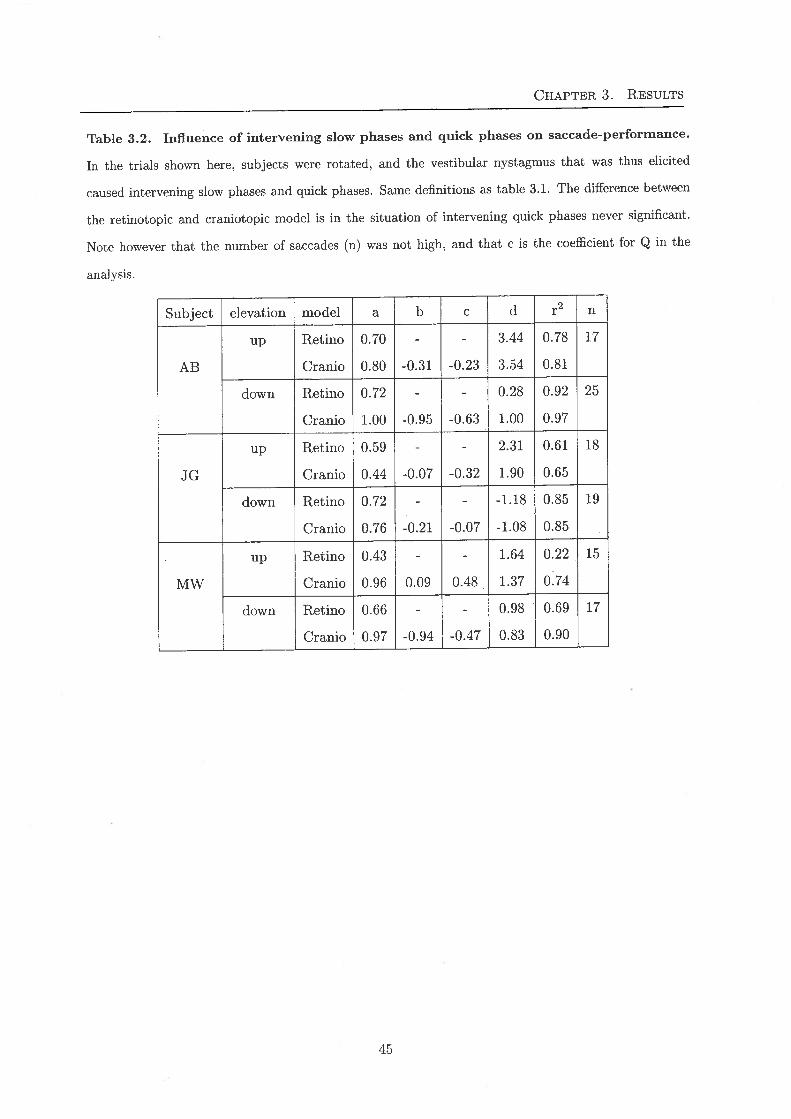
Table 3.2. Influence of intervening slow phases and quick phases on saccade-performance.
In the trials shown here, subjects were rotated, and the vestibular nystagmus that was thus elicited
caused intervening slow phases and quick phases. Same definitions as table 3.1. The difference between
the retinotopic and craniotopic model is in the situation of intervening quick phases never significant.
Note however that the number of saccades (n) was not high, and that c is the coefficient for Q in the
analysis.
Subject
AB
JG
MW
elevation
up
down
up
down
up
down
model
Retino
Cranio
Retino
Cranio
Retino
Cranio
Retino
Cranio
Retino
Cranio
Retino
Cranio
0.70
0.80
0.72
1.00
0.59
0.44
0.72
0.76
0.43
0.96
0.66
0.97
-0.31
-0.95
-0.07
-0.21
0.09
-0.94
-0.23
-0.63
-0.32
-0.07
0.48
-0.47
3.44
3.54
0.28
1.00
2.31
1.90
-1.18
-1.08
1.64
1.37
0.98
0.83
0.78
0.81
0.92
0.97
0.61
0.65
0.85
0.85
0.22
0.74
0.69
0.90
n
17
25
18
19
15
17
45

CHAPTER 3. RESULTS
46

Chapter 4
Discussion
We studied whether visual and vestibular signals interact when rapid eye movements are gener-
ated. More specifically, we asked ourselves the following questions:
a) Can vestibular signals influence the timing of a visually-guided saccade?
b) Can visual signals modify the metrics of the vestibularly-induced quick phase?
c) Is there any compensation of vestibularly-induced intervening eye movements in the remembered-
target task?
To put it briefly, we found that during vestibular stimulation there is an increase in saccadic
latencies as compared to control saccades in the absence of nystagmus, that end positions of
vestibularly-induced quick phases are not influenced by a visual stimulus (no averaging), and
that intervening slow phases are compensated at least partially.
A well-known phenomenon is the decrease of nystagmic vehemence during prolonged con-
stant rotations. The slow-phase velocity will decay because of the dynamics of the cupula in
the semicircular canals; cupular deviation will be lessened the longer a rotation is at constant
angular velocity. This study showed that the anti-compensatory shift in the beating field and
the decay of slow phase velocity during constant rotation are related: the shift in the beating
field also decreases gradually if a constant rotational velocity is applied.
4.1 Interaction of visual and vestibular signals
Timing
In the present study, if the induced vestibular nystagmus has any effect, it always resulted
in an increase in saccadic latency. The potential facilitation of saccadic reaction times (see
47

CHAPTER 4. DISCUSSION
Introduction) could occur did not turn out in the observed results. This expectation has been
based on a number of studies, including several that have been directed towards the facilitation of
saccadic reaction times caused by the gap-efFect. Three factors are believed to be of importance
for the decreased saccadic latencies in gap-experiments, in which there is a time-interval between
fixation offset and target onset. The first is a diminishing activity of fixation cells in the SC
during the gap due to the offset of the fixation light (Dorris and Munoz, 1995). The concurrentdisinhibition of saccade-related burst neurons is assumed to lead to a facilitation of saccadic
signals in such a way that saccadic latencies are reduced. The second event is the offset ofthe fixation-light, which induces the creation of a warning signal (Walker et al. 1995). And
thirdly, it is suggested that the gap allows the build-up of an anticipation-signal (Dorris et
al. 1997). According to this scheme, build-up neurons will increase their activity steadily after
the extinction of the fixation-light, building up an anticipation signal, and as soon as the visual
target is shown, a saccade will be produced with a reduced saccadic reaction time.
The absence of a fixation-light and a gap in our study could be one explanation for the
absence of facilitation. The decreasing activity of fixation cells, the warning and the build-up-
signal will not occur. However, despite the lack of a fixation-light offset, a preparatory activity
of a 'build-up' signal might still be present. This 'build-up'-signal is the vestibular signal that
will lead, if unabated, to a quick phase, and will effectively replace the visual (warning and
build-up) signals needed for facilitation if a saccadic signal arrives.
It is important to note that the hypothetical proposed mechanism for facilitation is based onthe following assumptions. First, saccades and quick phases are elicited only after a thresholdlevel of activation is surpassed (Anastasio 1996; Schiller and Stryker 1972). Second, saccades
and quick phases are generated using a common neural structure. And finally, its activity has to
be represented in a topographically organised map, of which a certain area of neurons will have
increased activity before and during a rapid eye movement of a given size and direction. The
neural substrate subserving this model could well be the SC, since it possesses these required
qualities and studies have shown the importance of the SC regarding saccadic reaction times
(Schiller et al. 1987; Dorris et al. 1997).
Fig. 4.1 illustrates the hypothetical mechanism for facilitation. A saccade will be initiated,
only if the visual signal induces sufficient activity in the neural structure. The same applies
to quick phases. During vestibular nystagmus, the signal for quick-phase generation will be
prepared, and at threshold-level the quick phase will be produced. If, however, a visual target
is presented before this event, the preparatory activity of the vestibularly-induced rapid eye
48

.^
tO
II1
^
^ i.
^ ^ i I
p^
!=!
c^ lr il .'t (0
r < I £L ^'
C/2 I i £, ^ '<!'
H M I I I
^ iS
I1
1
I H r I I ec0 I I:
I ^
5-
^
I! ^ ^
v ^
s- I
EU
^
II
^ s-
en
y N
m B
11 !1 11 it
I s"
<!
^ ^
I i
I i
tl.
3. ^
m-
»r ^
ll I i
s g
-
I I c§ £-
co
p3 i &. 3 f I { I I y?
SO
(0
IT v &'
^
^ s r ^ g
-
c§ 9S.
?
S i I co ^ I I (D
11
r
§" I. I £fr I
Is- I ^
^
p-
(D
°<
i ^- B
- I I r I co I ! I g ec I I K- I &
I I s, I ? i ^ r I p s ^ I s > s.
I. £.
Ul 1 i
II ^ I I Is ^ ff
i2
11
.£»
<
I I
^ I t I I i r
^ 9 I aL
? 2
It
2,
1 I (I I 0- I i §-
m *>.
^ I.1
= 3
^ £ s 2
, I I es t< § I3
3 I! I eni 1 i ? ? 1
Act
ivity
leve
l
I I i. 0 I i < I w.
§ <a
(D
Act
ivity
leve
l
3'iD
'P^(B
Cdi
UX
Din ys
Ill
iil.
li§
Act
ivity
leve
l
.I 'I;^ Ill
0 E i-3 i rf^
0 I w I

CHAPTER 4. DISCUSSION
both in time and space (i.e. the quick phase and the saccade should be similar in timing and in
size, Fig. 4.2).
If these signals do overlap temporally and spatially, an overlap of activity, in for example theSC, caused by an impending quick phase with the one induced by the impending visually guidedsaccade, could take place. And this convergence could lead to facilitation; the saccadic signal
uses the activity built up by the quick phase signal to generate a saccade. Another explanation
for the absence of facilitation, besides the absence of a fixation-light, could therefore be the
absence of overlap. Temporally it is difficult to produce an overlap of a visually guided saccade
with a quick phase. The generation of quick phases contains a certain random element; the exactoccurrence of a quick phase after another cannot be predicted. Furthermore, saccadic reaction
times also vary somewhat randomly. Facilitation would in this case not be seen because theoccurrence of a simultaneous saccade and quick phase was low. More measurements need to be
taken, to see if the saccades with reduced latencies would become more obvious. Adjustment
of the timing of the visual target to the occurrence of quick phases in order to increase the
possibility of simultaneous occurrence would also be recommended.
Of course, a third explanation might also be that fusion between vestibular and visual signals
is neurally impossible, since the system is either preparing a saccade or a quick phase. In this
case, switching, as opposed to addition, between vestibular and visual signals would be a better
description of what is happening. If the visual signal wants to produce a saccade, the vestibularsignal, that is preparing a quick phase, needs to be erased first. In fact, this explanation(switching) for the absence of facilitation seems a rather compelling one. It would take time toreduce the vestibular signal, meaning that latencies would be prolonged. This enlarged latency
is present in our data, although not always.
Dorris and coworkers (1999) observed increased saccadic latencies for saccades elicited aftera saccade that was similar in size and direction. They explained this by assuming that the active
area in the topologically-coded neural structure responsible for the saccade would be inhibitedafter the rapid eye movement. These observed results are different from our results, in thatsaccades with similar size and direction as previous quick phases, WTB-responses, did not seem
to have longer latencies than ATB-responses. The interaction between two succeeding saccadicsignals appear to be different than interaction between a quick phase signal and a succeedingsaccadic signal.
50

CJi
i 9-
^ s I r
3.
I ? I i. s 1 CT
-(C £
-G
.
I
t j
^ ^. 0 E
o'
I ?
I0
^ ^ ^ I I?
. ^
I ^ I
^r i
^ §
1I I i
^ ° 0'
^ fr
OT
1. i §
t 1
I 3.
s' I eg > I t 1 s.
I -3
I I
^ ^ !I&
-v
I
I I ir i I i' en I I I 2.I g
-
r
s-
I<
t s r
2- -
1. I
^ §
en I .g ^
Ver
tical
eye
pos
ition
Ver
tical
eye
pos
ition
1 M ? Ul
Ul
D s I I s i I 0- rt-
0 v I i I <<
i I I .§
I I I
Q I § I I

CHAPTER 4. DISCUSSION
Metrics
Regarding the metrics of the rapid eye movements, there was an absence of averaging between
the vestibular quick phases and the visually guided saccade. Averaging did occur in other
studies (for saccades: Becker and Jurgens 1979; Findlay and Harris 1984; Ottes et al. 1984; for
congenital nystagmus: Worfolk and Abadi 1990). Double-step saccades showed an averaging
response, and resembled the response obtained from patients with congenital nystagmus. Inthese studies it was also shown that the averaging response was only found if the saccades
corresponding to each stimulus were not too far apart. If the two visual stimuli in the double-
step-paradigm are too disparate, the response would exhibit bi-stable behaviour: a response to
either one of the two visual stimuli would be produced, and averaging would not be present.
Quick phases of congenital nystagmus did not exhibit a progression to a visually-guided saccadeif the visual stimulus was in the opposite direction of the beat of nystagmus.
The difference used in our experiments (quick phase amplitude, 7°; visual target eccentricity,
20°) could be so large that convergence was indeed out of the question. In the experiments wherevertical saccades were elicited the similarity needed for fusion of the visual and vestibular signals
was probably also absent (because of the 90° difference in direction), so an averaging response
would also not be produced. Although target eccentricities of 8°were used in some experiments,
they were not satisfactory in determining whether averaging occurred: an averaging response
would resemble a non-averaging response.
A recent neurophysiological study has revealed averaging between an electrically induced
activity in the SC and a visually induced activity (Chaturvedi and Van Gisbergen 1999). While
a monkey was preparing a visually guided saccade with a clear vergence component, an electricalstimulation of the SC was applied. The electrical response was modulated by the activity of
the impending visual saccade in such a way that later application of an electrical stimulus in a
trial caused the electrical response to be more influenced by the visual activity; the electrical
response showed a greater vergence component. Similar results in the frontal plane (saccades)were found by Sparks and Mays (1983). Chaturvedi and Van Gisbergen showed that the actual
combined response was probably an averaging response of the electrical stimulus and the visual
activity, that was being built up. Since the colliculus is also active before and during quick
phases, similar results might be obtained if the electrical stimulus was presented before and
during a vestibularly induced quick phase instead of a visually guided saccade; for example, anelectrical stimulus, which would by itself induce a saccade with a vertical component, might be
52

CHAPTER 4. DISCUSSION
modified by a quick phase in the horizontal plane such that the electrical response would have a
smaller vertical component. This would be similar to the idea of an averaging response between
a vestibular and a visual signal as shown in Fig. 4.2.
Compensation
We found clear evidence that intervening slow phases of vestibular nystagmus are compensated
for. Saccades are relatively precise. Since compensation occurs, averaging, which would elicit
an incorrect response, would be unfavourable. Indirectly, this suggests that switching might be
more likely than addition of quick-phase and saccade signals, which can lead to averaging.
To conclude that there was or was no compensation for intervening quick phases would
be premature. Differences between the retinotopic and craniotopic model are not significant,
probably due to the low number of trials containing intervening quick phases. However, since
other intervening rapid eye movements can be compensated (Hallet and Lightstone 1976; Sparks
and Mays 1983), it would be unexpected if quick phases could not. Again more measurements
are be desirable.
In addition to a greater number of measurements, subjects could be instructed to remember
the target, and a longer period of time could be introduced before the saccade may be initiated,
to obtain more quick phases between the flash and saccade onset. Subjects might be instructed
to wait with their response to the flash, until another stimuli has been presented to them, such
as an auditory signal.
4.2 Neurophysiological aspects regarding convergence of visual
and vestibular signals.
Build-up neurons
As mentioned before (see section 1.1 and section 4.1), build-up neurons in the SC show an in-
creased preparatory activity that may allow visually guided saccades to have a shorter latency
during gap-experiments (Dorris et al. 1997). In line with the idea of overlap, an interesting
question would be what these cells would do if a quick phase is generated in their large open-
ended movement fields. If these cells would show activity before and during quick phases as
with saccades, would the presentation of a visual signal lead to addition of the two signals or
can only one of the two signals persist at any one time (switching)?
53

CHAPTER 4. DISCUSSION
Modulation of colliculus-induced saccades by vestibular stimulation
The horizontal amplitude of saccades produced by electrical stimulation of the SC is modulated
by head rotation according to Kitama and coworkers (1992). Collicular stimulation during
ipsilateral vestibular stimulation produces saccades with a smaller horizontal component thanwithout rotation, and during contralateral stimulation the horizontal component of the responses
is larger. The saccades with intervening slow phases in our experiments also had to be modulatedin this way to produce accurate saccades: saccades with the same horizontal direction as the
slow phases had to be smaller and oppositely directed saccades warranted larger amplitudes.
The main difference between the modulation of those two kinds of saccades is the latency of the
saccades. Collicular-induced saccades show reaction times of about 20 ms, and therefore the
amplitude of intervening eye movements will be small. It should be noted, that the modulation
of collicular-induced saccades is not equivalent to compensation. Compensation depends on the
intervening slow phase velocity and the time-interval between target offset and saccade onset,
while modulation seems to be associated only with rotational velocity.
Kitama and colleagues (1992, 1995) state that this convergence of visual and vestibular
signals occurs probably downstream of the SC, in the BDNs. This is corroborated by thefact that excitation of BDNs by electrical stimulation of the SC is facilitated by contralateral
rotation and suppressed during ipsilateral rotation. However, it would be interesting to see this
SC-stimulation effect already taking place in the SC itself. In this case, the SC would have to
receive information about the slow phase, it should be possible to measure slow phase activity
in the SC and the SC might play a role in the compensation of intervening slow phases.
A further statement made by Kitama and colleagues is that head velocity is the important
factor for the modulation. However, they have used sinusoidal rotations, in which slow phase
velocity matches head velocity, and could not determine whether head velocity or slow phase
velocity was the determining factor. If steps in rotation would be used, in which the slow phase
velocity would differ increasingly from head velocity, this distinction could be made.
54

References
1. ANASTASIO, T.J. A random walk model of fast-phase timing during optokinetic nystag-
mus. Biol. Cybern. 75: 1-9, 1996.
2. BECKER, W. AND FUCHS, A.F. Further properties of the human saccadic system: eye
movements and correction saccades with and without visual fixation points. Vision Res.
9: 1247-1258, 1969.
3. BECKER, W. AND JURGENS, R. An analysis of the saccadic system by means of double
step stimuli. Vision Res. 19: 967-983, 1979.
4. BIZZI, E. Discharge of frontal eye field neurons during saccadic and following eye move-
ments in unanesthetized monkeys. Exp. Brain Res. 6: 69-80, 1968.
5. BUTTNER-ENNEVER, J.A. AND BUTTNER, U. A cell group associated with vertical eye
movements in the rostral mesencephalic reticular formation of the monkey. Brain Res.
151: 31-47, 1978.
6. BUTTNER-ENNEVER, J.A., COHEN, B., PAUSE, M., AND FRIES, W. Raphe nucleus of
the pans containing omnipause neurons of the oculomotor system in the monkey, and its
homologue in man. J. Comp. Neurol. 267: 307-321, 1982.
7 CHATURVEDI, V. AND VAN GISBERGEN, J.A.M. Perturbation of combined saccade-
vergence movements by microstimulation in monkey superior colliculus. J. Neurophysiol.
81: 2279-2296, 1999.
8. CHUN, K.S. AND ROBINSON, D.A. A model of quick phase generation in the vestibular
ocular reflex. Biol. Cyber. 28: 209-221, 1978.
9. COHEN, B. AND HENN, V. Unit activity in the pontine reticular formation associated
with eye movements. Brain Res. 46: 403-410, 1972.
55

REFERENCES
10. COLLEWUN, H., APKARIAN, P., AND SPEKREUSE, H. The OCulomotor behaviour of
albinos. Brain 108: 1-28, 1985.
11. COLLEWUN, H., VAN DER MARK, F., JANSEN, T.C. Precise recording of human eye
movements. Vision Res. 15(3): 447-450, 1975.
12. CURTHOYS, I.S., MARKHAM, C.H., AND FURUYA, N. Direct projection of pause neurons
to nystagmus-related excitatory burst neurons in the cat pontine reticular formation. Exp.
Neurol. 83: 414-422, 1984.
13. CYNADER, M. AND BERMAN, N. Receptive field organization of monkey superior collicu-
lus. J. Neurophysiol. 35: 187-201, 1972.
4. DORRIS, M.C. AND MUNOZ, D. P. A neural correlate for the gap effect on saccadic reaction
times in monkey. J. Neurophysiol. 73(6): 2558-2562, 1995.
15. DORRIS, M.C., PARE, M., MUNOZ, D.P. Neuronal activity in monkey superior colliculusrelated to the initiation of saccadic eye movements. J.Neurosci. 17(21): 8566-8579, 1997.
16. DORRIS, M.C., TAYLOR, T.L, KLEIN, R.M., AND MUNOZ, D.P. Influence of previousvisual stimulus or saccade on saccadic reaction times in monkey. J. Neurophysiol. 81: 2429-
2436, 1999.
17 EVINGER, C., KANEKO, C.R.S., AND FUCHS, A.F. The activity ofomnipause neurons in
alert cats during saccadic eye movements and visual stimuli. J. Neurophysiol. 47: 827-844,
1982.
18. FISHER, B AND WEBER, H. Express saccades and visual attention. Behav Brain Sci.
16: 553-610, 1993.
19. FURUYA, N. AND MARKHAM, C.H. Direct inhibitory synaptic linkage of pause neurons
with burst inhibitory neurons. Brain Res. 245: 139-143, 1982.
20. HALLETT, P.E. AND LlGHTSTONE, A.D. Saccadic eye movements to stimuli triggered by
prior saccades. Vision Res. 16: 99-106,1976????.
21. HERTER, T.M. AND GUITTON, D. Human head-free gaze saccades to targets flashed
before gaze-pursuit are spatially accurate. J. Neurophysiol. 80: 2785-2789, 1998.
56

REFERENCES
22. HORN, A.K., BUTTNER-ENNEVER, J.A., WAHLE, P., AND REICHENBERGER, I. Neuro-
transmitter profile of saccadic omnipause neurons in nucleus raphe interpositus. J. Neurosci.
14: 2032-2046, 1994.
23. ISRAEL, I. AND BERTHOZ, A. Contribution of the otoliths to the calculation of linear
displacement. J. Neurophysiol. 42: 247-263, 1989.
24. ISRAEL, I., FETTER, M., AND KOENIG, E. Vestibular perception of passive whole-body
rotation about horizontal and vertical axes in humans: goal-directed vestibulo-ocular reflex
and vestibular memory-contingent saccades. Exp. Brain Res. 96: 335-346, 1993.
25. ITO, J., MARKHAM, C.H., AND CURTHOYS, I.S. Projections to eye movement-related
pause neuron region in cat using HRP. Exp. Brain Res. 86: 93-104, 1984.
26. ITO, J., MARKHAM, C.H., CURTHOYS, I.S. Direct projection of type II vestibular neurons
to eye movement-related pause neurons in the cat pontine reticular formation. Exp.Neurol.
91: 331-342, 1986.
27. JUDGE, S.J. Temporal interaction between human voluntary saccades and rapid phases
of optokinetic nystagmus. Exp. Brain Res. 18: 114-118, 1973.
28. KELLER, E.L. Participation of medial pontine reticular formation in eye movement gen-
eration in monkey. J. Neurophysiol. 37: 316-332, 1974.
29. KlTAMA, T., SHIMAZU, H., TANAKA, M., AND YOSHIDA, K. Vestibular and visual
interaction in generation of rapid eye movements. Ann. N.Y. Acad. Sci. 656: 396-407, 1992.
30. KlTAMA, T., OHKI, Y., SHIMAZU, H., TANAKA, M., AND YOSHIDA, K. Site ofinterac-
tion between saccade signals and vestibular signals induced by head rotation in the alert
cat: functional properties and afferent organization of burster driving neurons. J. Neuro-
physiol. 74(1): 273-287, 1995.
31. LANGER, T.P. AND KANEKO, C.R.S. Efferent projections of the cat oculomotor omni-
pause neuron region: an autoradiographic study. J.Comp.Neurol. 217: 288-306, 1983.
32. LANGER, T.P. AND KANEKO, C.R.S. Brainstem afferents to the omnipause region in the
cat: a horseradish peroxidase study. J. Comp. Neurol. 230: 444-458, 1984.
33. LANGER, T.P. AND KANEKO, C.R.S. Brainstem afFerents to the oculomotor omnipause
neurons in monkey. J.Comp.Neurol. 295: 413-427, 1990.
57

REFERENCES
34. LUSCHEI, E.S. AND FUCHS, A.F. Activity of brain stem neurons during eye movements
of alert monkeys. J. Neurophysiol. 35: 445-461, 1972.
35. MUNOZ, D.P. AND WURTZ, H.W. Fixation cells in monkey superior colliculus I. Char-
acteristics of cell discharge. J. Neurophysiol. 70(2): 559-589, 1993.
36. MUNOZ, D.P. AND WURTZ, H.W. Saccade-related activity in monkey superior colliculus
I. Characteristics of burst and build-up cells. J. Neurophysiol. 73(6): 2313-2333, 1995.
37. NAKAO, S., CURTHOYS, I.S., AND MARKHAM, C.H. Direct inhibitory projection of pause
neurons to nystagmus-related pontomedullary reticular burst neurons in the cat. Exp. Brain
Res. 40: 283-293, 1980.
38. NAKAO, S., SHIRAISHI, Y., ODA, H., AND INAGAKI, M. Direct inhibitory projection of
pontine omnipause neurons to burst neurons in the Forel's field H controlling vertical eye
movement-related motoneurons in the cat. Exp. Brain Res. 70: 632-636, 1988.
39. NlEMANN, T. AND HOFFMANN, K.P. Motion processing for saccadic eye movements
during the visually induced sensation of egomotion in humans. Vision Res. 22: 3163-3170,1997.
40. OHGAKI,T., CURTHOYS, I.S., AND MARKHAM, C.H. Anatomy of physiologically iden-
tified eye-movement-related pause neurons in the cat: pontomedullary region. J. Comp.
Neurol. 266: 56-72, 1987.
41. OHGAKI, T., MARKHAM, C.H., SCHNEIDER, J.S. AND CURTHOYS, I.S. Anatomical
evidence of the projection of pontine omnipause neurons to midbrain regions controlling
vertical eye movements. J. Comp. Neurol. 289: 610-625, 1989.
42. OHKI, Y., SHIMAZU, H., AND SUZUKI, I. Excitatory input to burst neurons from the
labyrinth and its mediating pathway in the cat: location and functional characteristics ofbuster driving neurons. Exp. Brain Res. 72: 457-472, 1988.
43. OTTES, F.P., VAN GlSBERGEN, J.A.M., AND EGGERMONT, J.J. Metrics of saccade
responses to visual double stimuli: Two different modes. Vision Res. 24: 1169-1179, 1984.
44. PARE, M. AND GUITTON, D. The fixation area of the cat superior colliculus: effects of
electrical stimulation and direct connection with brainstem omnipause neurons. Exp. Brain
Res. 101: 109-122, 1994.
58

REFERENCES
45. PARE, M. AND GUITTON, D. Brain stem omnipause neurons and the control of combined
eye-head gaze saccades in the alert cat. J. Neurophysiol. 79: 3060-3076, 1998.
46. PARE, M. AND MUNOZ, D.P. Saccadic reaction time in the monkey: advanced prepa-
ration of oculomotor programs is primarily responsible for express saccades occurrence.
J. Neurophysiol. 76: 3666-3681, 1996.
47. ROBINSON D.A. A method of measuring eye movement using a scleral search coil in a
magnetic field. IEEE Transactions in Biomedical Engineering 10: 137-145, 1963.
48. ROBINSON, D. A. Eye movements evoked by collicular stimulation in the alert monkey
Vision Res. 12: 1975-1808, 1972.
49. ROBINSON, D.A. Oculomotor control signals. In: Basic mechanisms of ocular motility and their
clinical implications. G. Lennestrand and P. Bach-y-Rita (eds). New York: Pergamon, pp
337-374, (1975).
50. RON, S., ROBINSON, D.A., AND SKAVENSKI, A.A. Saccades and the quick phase of
nystagmus. J. Neurophysiol. 12: 2015-2022, 1972.
51. SCHILLER, P.H. AND KOERNER, F. Discharge characteristics of single units in superior
colliculus of the alert rhesus monkey. J. Neurophysiol. 34: 920-936, 1971.
52. SCHILLER, P.H., SANDBLL, J.H., AND MAUNSELL, J.H. The effect of frontal eye field
and superior colliculus lesions on saccadic latencies in the rhesus monkey. J. Neurophysiol.
57: 1033-1049, 1987.
53. SCHILLER, P.H. AND STRYKER, M. Single-unit recording and stimulation in superior
colliculus of the alert rhesus monkey. -/. Neurophysiol. 35: 915-924, 1972.
54. SCHLAG, J., SCHLAG-REY, M., AND DASSONVILLE, P. Saccades can be aimed at the
spatial location of targets flashed during pursuit. J. Neurophysiol. 34: 575-581, 1990.
55. SCUDDER, C.A. A new local feedback model of the saccadic burst generator.. J. Neuro-
physiol. 59: 1455-1475, 1988.
56. SPARKS, D.L. Functional properties of neurons in the monkey superior colliculus: coupling
of neuronal activity and saccade onset. Brain Res. 156: 1-16, 1978.
59
REFERENCES
57. SPARKS, D.L., HOLLAND, R., GUTHRIE, B.L. Size and distribution of movement fields
in the monkey superior colliculus. Brain Res. 113: 21-34, 1976.
58. SPARKS, D.L. AND MAYS, L.E. Spatial localization of saccade targets. I. Compensation
for stimulation-induced perturbations in eye position.. J. Neurophysiol. 49(1): 45-63, 1983.
59. STRASSMAN, A., EVINGER, C., McCREA, R.A., BAKER, R.G., AND HlGHSTEIN, S.M.
Anatomy and physiology of intracellularly labeled omnipause neurons in the cat and squir-
rel monkey. Exp. Brain Res. 67: 436-440, 1987.
60. WORFOLK, R. AND ABADI, R.V. Quick phase programming and saccadic re-orientation
in congenital nystagmus. V/s/'on Res. 31: 1819-1830, 1991.
61. WURTZ, R.H. AND GOLDBERG, M.E. Superior colliculus cell responses related to eye
movements in awake monkeys. Science Wash. DC 171: 82-84, 1971.
62. WURTZ, R.H. AND GOLDBERG, M.E. Activity of superior colliculus in behaving monkey.
III. cells discharging before eye movements. J. Neurophysiol. 35: 575-586, 1972.
60

Appendix A
Memory-guided saccades after
roll-rotation
A.l Introduction
In this appendix, another series of experiments will be briefly addressed. These pilot experiments
were performed to investigate whether compensation also occurred for memory-guided saccades,after the subject was rotated around his roll-axis. In addition to the torsional nystagmus that willoccur because of the rotation, another phenomenon may influence the accuracy of the saccades:
subjects who are rotated around their roll-axis have systematic difficulties estimating the earth-bound horizontal and vertical during luminous line experiments (for review, see Howard, 1982).
This visual discrepancy may have disturbing effects on the accuracy of memory-guided saccades
in the roll experiments.
A.2 Methods
The visual targets in this experiment were provided by a screen with 37 red LEDs (0.1 - 0.2°indiameter) in a polar coordinate arrangement. The screen was positioned in front of the subjectat a distance of 1.15 m. The center LED was aligned with the subject's naso-occipital roll-axis,
while the other LEDs were mounted on the cross sections of three concentric circles with radii
of 11, 22 and 31°and meridians every 30°
61

APPENDIX A. MEMORY-GUIDED SACCADES AFTER ROLL-ROTATION
p2
CHAIR
p1
TGT
FIX
EYE
Figure A.l Remembered target paradigm. The chair (CHAIR) started in a random
roll-position /?i and a fixation light (FIX) was provided. A visual target was shown to the
subjects for 1.5 s (TGT). The chair moved to a new position (,32) and, after the fixation
light was extinguished, the subject had to make a saccade to the remembered target (EYE).The time-interval between offset of the visual target and offset of the fixation light was 7 s.
Trials during the roll-rotation experiments (Fig. A.l) started in a random roll-position (pi).
The subject was instructed to remember the spatial location (either in earth or body coordinates,
see below) of a briefly presented visual target and, after being rotated to a new roll position, to
make a saccade in the remembered direction of the target.
The initial body tilt angle (pi) varied between -90 and 90°with intervals of 10°. Upright
body position is defined as p = 0°, positive p < is defined as the roll angle in which the subject's
right ear is down. The center LED of the visual display was used as a fixation light. Whenin the initial tilted position the subject was asked to remember the direction of a visual target
which was presented for 1.5 s. The eccentricity (R) of the target was 20°. The angle of direction
of the target (<^) could change between 0 and 180°with intervals of 30°, where <f) = 0°was definedas the direction to the right of the subject and ^ = 90°was upwards in body-coordinates. The
(f) of the target was randomly varied between trials.
The subject was not allowed to look immediately to the target, but had to maintain fixation
of the center LED. Subsequently, the subject was rotated to a new position (,92). This p2 could
also vary randomly like pi , but the sign of the new roll angle depended on the initial p. If p\ was
62

APPENDIX A. MEMORY-GUIDED SACCADES AFTER ROLL-ROTATION
positive, p2 would be negative, and vice versa. This resulted in the absolute difference between
pl and p2 (absolute A p) always being larger than absolute p\.
The velocity of the vestibular chair depended on the required roll rotation, since the time
of rotation remained constant at 4.5 s, yielding velocities between 10 and 180° .s-1. In this way
the time between the offset of the remembered target and the offset of the fixation light did
not change: differences in performance of the task could not be attributed to different times of
having to remember a visual target.
In the new position the subjects had to make a saccade to the remembered target, when
the fixation LED was extinguished, 7 s after the offset of the visual target. Remembering the
position of the target was required either in body coordinates or in world-coordinates. In thebody-task, the remembered direction of the target did not change with respect to the subject'sbody in spite of any rotation, but in the world-task the remembered target was related toworld-fixed coordinates, so subjects did have to compensate for any intervening chair rotation.
A session typically consisted of 10 runs, each containing 6 trials, yielding ~60 saccades to
remembered targets per session. In control-experiments the subject was not rotated after the
target was presented (A p = 0), but the initial p still varied as described above.
A. 3 Results and discussion
To study the effects of intervening roll-rotation on memory-guided saccades, first the effects of
body-tilt without intervening rotation was determined (Fig. A.2). The tilt seems to induce a
systematic error in performance, but because of a limited number of measurements, the pictureis not clear.
The intervening rotation during the body-task seems to have a linear effect on the perfor-
mance of the memory-guided saccades (Fig. A.2). If the intervening rotation increases, the
subject errs more during the determination of the saccade direction. The saccade is directed
oppositely to the rotation relative to the required direction of the saccade (Fig. A.4). This couldbe considered odd, since the subject does not have to take the rotation into account; it is pos-
sible for the subject to relate the direction of the target to his body. Instead, the subject seems
to produce a response that corresponds with an underestimation of the change in tilt, as if the
subject were to remember the direction in world-coordinates and to adjust for the intervening
rotation afterwards.
63

APPENDIX A. MEMORY-GUIDED SACCADES AFTER ROLL-ROTATION
.100 0 100Initial tilt (deg)
100 0 100Change in tilt (deg)
.100 0 100
Final tilt (deg)
Figure A.2 Errors in remembered target direction caused by roll-rotation during
body-task. The subject (JG) was asked to perform a memory-guided saccade after roll-
rotation in body-coordinates. Top left: Memory-guided saccades without intervening roll-
rotation, but with a roll-tilt did not reveal any large errors as occurring during the roll-
experiments. Due to low number of various different measurements, any potential remarkable
systematic errors were not brought forward. Top right: Systematic errors in performance
were produced in the opposite direction of the previous rotation, terror = 0-23 * Ap + 0.38
(deg), r2 = 0.65, p<0.001. Bottom: A correlation between initial tilt or final tilt and error
in response existed, but this may merely be because of the correlation between initial tilt
(left) or final tilt (right) and change in tilt (r2 = 0.86, p<0.001 and r2 = 0.85, p<0.001,
respectively). Still, the regression lines are given: terror = -0.39 * pzniUai - 1-50 (deg),
r2 =0.39, p<0.001, (left); ^rror = 0.38 * pfinal + 2.04 (deg), r2 = 0.52 (right), p<0.01.
Dashed line: nill-line (slope = 0); Regression lines are also shown (continuous line); terror =
factual - ^required, error in target direction; pinitial= initial body position; pfinai^ final
body position; ^P=P final - Pinitial, change in body position; number of saccades during
roll-rotation experiments, N=56.
64

APPENDIX A. MEMORY-GUIDED SACCADES AFTER ROLL-ROTATION
-80-100 0 100
Change in tilt (deg)
-100 0 100
Initial tilt (deg)-100 0 100
Final tilt (deg)
Figure A.3 Errors in remembered target direction caused by roll-rotation during
world-task. Similar to the procedure described in Fig. A.2, the subject (JG) was yet
again asked to perform a memory-guided saccade after roll-rotation, but this time in world-
coordinates. Definitions are the same as those used in the previous figure, except that 4> is
defined in world-coordinates. Number of saccades during roll-rotation experiments,N=30.
Top left: Control experiments with no change in body position. Top right: Change of body
position leads to systematic errors, but the exact consistency of errors cannot be determined
because of the relatively few different changes in body position. For the changes in body
position that were presented, the errors seem to vary somewhat similar to the errors during
the body-task, although in opposite direction. Bottom: Again, initial (left) and final (right)
tilt are related to the rotation, thereby causing a perceived correlation between the initial
or final tilt and the errors.
65

APPENDIX A. MEMORY-GUIDED SACCADES AFTER ROLL-ROTATION
Final tilt Required
Actual
BODY
Final tilt,
Actual
Required
WORLD
Figure A.4 Effects of intervening roll rotation. In these examples, the tilt and the
direction of the visual target are all presented in world-coordinates. Top left: During the
body-task the subject has to remember the target in body-coordinates, when he is tilted
around his roll-axis (initial tilt). Top right: Although the subject does not have to take the
rotation in account, since he can relate the position of the target to his body, errors correlated
to the change in body-position are still produced. The actual direction of the memory-guided
saccade shifts in the opposite direction of the rotation relative to the required direction. In
essence, this appears to be an underestimation of the change in tilt. Bottom: During the
world-task the change from initial tilt to final tilt, also produces systematic errors. In this
example, the change of 120°leads to a shift in actual direction from required direction of
50°: yet again, a possible underestimation of change in tilt.
66

APPENDIX A. MEMORY-GUIDED SACCADES AFTER ROLL-ROTATION
The change in tilt was correlated with the initial and final tilt. Therefore, the errors were
also related to these tilt-positions (Fig. A.2). To determine which of the three tilt-factors is the
cause of the systematic errors, the change in tilt should be uncorrelated with initial and final
tilt. Note, that all rotations lasted for 4.5 s independent of the size of the rotation, so rotational
velocity increases linearly with the change in body-tilt. Rotational velocity is therefore also
related to the change in saccade performance.
The world-task (Fig. A.3) also suffered from these problems: the correlation between initial
and final tilt and change in tilt and the correlation between the intervening rotation and the
rotational velocity. Despite these problems, and the few number of measurements with different
changes in tilt, the errors are different from the errors during the body-task: a rotation elicitssaccades that are too small in direction. However, the results from both body- and world-
task can be explained by assuming that subjects perform both tasks in world-coordinates and
underestimate the change in tilt (Fig. A.4).
Blouin and coworkers (1997, 1998) also found underestimation of body-rotation during the
localisation of a remembered target in world-coordinates after passive whole-body yaw-rotations.
They explained this by suggesting that the vestibular signal could indeed be integrated over time
to achieve accurate estimations of body rotations, but that this signal is not processed by the
visual object localisation systems.
A.4 References
1. HOWARD, I.P. Human visual orientation. New York: Wiley, 1982.
2. BLOUIN, J., GAUTHIER, G.M., AND VERCHER, J.L. Visual object localization through
vestibular and neck inputs. 2: updating off-mid-sagittal-plane target positions. J. Ves. Res.
7: 137-143, 1997.
3. BLOUIN, J., LABROUSSE, L., SlMONEAU, M., VERCHER, J.L., AND GAUTHIER, G.M.
Updating visual space during passive and voluntary head-in-space movements. Exp. Brain
Res. 122(1): 93-100, 1998.
67

Appendix B
Matlab-files
Figure | File
3.1 I beatshift.m
3.2 qpshift.m
3.3 ] spvsqp.m
3.4 | dkfig.m
3.5 | respfig.m
3.6 | latfig.m
3.7 ] latfig2.m
3.8 indtimefig.m
3.9 | atffig.m
3.10 atfverfig.m
3.11 [ examplecompl.m
3.12 | examplecomp2.m
3.15 | hypocompfigall.m
3.16 | compfig.m
3.17 | compfig2.m
4.1 | buildupmechfig.m
4.2 | visvessignal.m
A.l | figrem.m
A.2 [ bodyfig.m
A.3 worldfig.m
A.4 | rlbodyfig.m
68