vmware workbench getting started guide
TRANSCRIPT

VMware Workbench Getting StartedGuide
VMware Workbench 3.5.3
This document supports the version of each product listed andsupports all subsequent versions until the document is replacedby a new edition. To check for more recent editions of thisdocument, see http://www.vmware.com/support/pubs.
EN-049-VMWB-3Q15
VMware, Inc.3401 Hillview Ave.Palo Alto, CA 94304www.vmware.com
2 VMware, Inc.
VMware Workbench Getting Started Guide
You can find the most up-to-date technical documentation on the VMware Web site at:
http://www.vmware.com/support/
The VMware Web site also provides the latest product updates.
If you have comments about this documentation, submit your feedback to:
Copyright © 2009–2015 VMware, Inc. All rights reserved. This product is protected by U.S. and international copyright and intellectual property laws. VMware products are covered by one or more patents listed at http://www.vmware.com/go/patents.
VMware is a registered trademark or trademark of VMware, Inc. in the United States and/or other jurisdictions. All other marks and names mentioned herein may be trademarks of their respective companies.
VMware, Inc. 3
Contents
About This Book 7
1 Introduction to VMware Workbench 9Installing VMware Workbench 9
Hardware Requirements 9
Download and Install VMware Workbench 9
VMware Workbench 3.5 is 64‐bit 9
Before You Report a Problem to VMware 10
Configuring VMware Workbench 10
Start VMware Workbench Remotely Using X Forwarding 11
Using VMware Workbench Remotely from a Linux Desktop 11
Using VMware Workbench Remotely from a Windows Desktop 11
Start VMware Workbench Directly in the Virtual Appliance 11
Logging in to Linux 12
Create a workspace 12
Adding and Configuring a New User Account 12
Setting Network Proxies 12
Setting Proxies for the Linux System in the Virtual Appliance 13
Configuring Static IP for the Virtual Appliance 13
Accessing Help Resources 13
Navigating the Workbench UI with the Dashboard 14
Command Line Usage 14
2 The VMware Workbench Dashboard 15Signing In to See Content 15
Login Troubleshooting 15
Workbench Panel 16
Getting Started 16
News 16
Installed Packages 16
Certifications Panel 16
Certifications 16
Compatibility Tools 16
On‐Demand Questionnaire Certifications 17
Global Certification Waivers 17
Global Waivers for Internet Connected Computers 17
Global Waivers for Non‐Internet Connected Computers 17
Certification Submission and Status 18
Manually Upload a Saved Submission Bundle 18
Available SR Incidents 19
Submission Status 19
Certification Submission Status 19
Add Transaction Ids 19
VCG Preview 20
Development Panel 20
SDKs 20
Debug Symbols for VMkernel Updates 20

VMware Workbench Getting Started Guide
4 VMware, Inc.
3 Installing Software Packages 21Simplified Installation Instructions from the Dashboard 21
Install New Software Instructions 22
Specifying Available Software Sites 22
Installing New VMware Workbench Software Packages 22
Installing Packages Offline (Sneaker‐Net) 24
Fixing Proxy Issues 25
Uninstalling Software 25
4 Running Test Manager 27Tests Dashboard 28
Viewing the Test Manager Dashboard 28
Scheduling Test Sessions Using the Test Manager Dashboard 28
Viewing the Test Session Web Report 29
Starting a New Test Session 29
Setting Up and Running the New Test Session 30
Running an Existing Test Session 33
Generating a Results Package 34
Submitting the Test Results Immediately 35
Filing a Service Request (SR) with the Certification Submission Wizard 35
Submitting Results at a Later Time 36
Off‐Line Submission for Certification 36
Entering or Modifying a VMware Waiver Approval ID 37
Email Notifications 37
Test Manager Command‐Line Interface 38
Running a Recorded Test Session 38
Running Multiple Recorded Test Sessions Simultaneously 38
Other Use Cases 38
Create a New Test Session 39
Run a Recorded Test Session 39
User Prompted when a Dependency Noticed 39
User Not Prompted when a Failure Noticed (use of ‐f) 39
Test Manager Command‐Line Interface Reference 39
Test Manager Web Client 40
Importing and Exporting Parameters from a File 41
Enabling Prefilling from the Parameter Cache 41
Importing a Parameter Cache from Another Workspace 41
Time Management Help for Long Running Tests 42
Splitting Certification Tests into Multiple Sessions 42
Merging Split Sessions into One New Merged Session 43
Recreating a Test Session by Importing Test Results from Previous Run 43
Verifying Remote Installation Before You Submit Your VIB to VMware 44
Adding A Custom Test 45
5 Working with Projects in VMware Workbench 49Creating Projects in the VMware Workbench 49
Using the VIB Editor 51
For CIM PDK 51
For Host Extensions 52
For KMDK‐Based Development Kits (PSA and VDS) 52
Tips for VIB Fields 52
Specifying Dependencies in the VIB Editor 53
Installing a VIB on a Target ESXi Machine 54

VMware, Inc. 5
Contents
For Userworld Applications Only: VIBs Developed for Live Install/Upgrade 55
Creating Offline Bundles 55
Exporting Project Files 55
Project Auto Deploy Settings 56
6 Using the Remote System Explorer 59RSE Functions 59
Configuring SSH on Your Target Machine 59
Accessing the RSE 60
Connecting to Windows Machines and Virtual Centers 60
Connecting to an ESXi Server 60
Add an ESXi Server 60
Start the SSH daemon on your remote system 61
Connect to an ESXi server 61
Disconnect from an ESXi Server 61
Properties and Details For ESXi Servers 61
Remote Systems Navigation Tree 61
Remote Systems Properties 62
Remote Systems Details 62
Resource Explorer 62
Resource Types 62
Resources 63
Launching SSH Terminals 65
Configuring SSH Services on an ESXi Host 65
Managing Packages on an ESXi Host 66
Monitoring Server Logs 67
Installing VIB Packages on the Remote System 67
Managing Passwords 67
7 Debugging Your Module with GDB 69Live Debugging Using VMware Workbench 69
Setting Up the Debugging Environment 69
Setting Up the VMware Workbench Virtual Appliance 69
Setting Up the ESXi Test Machine 70
Testing the Serial Connection 70
Debugging a Live Kernel Module 70
Preparing for a Live Debugging Session 71
Setting up a Live Debugging Session 71
Debugging a Live Host Extensions Module 76
Debugging a Userworld Application in Workbench 79
Installing the C/C++ Remote Launch Feature 81
Debugging a Userworld Application Core Dump 82
Debugging a Kernel Module Core Dump 83
8 Signing VIBs for Test and Production 87Test Keys and Certificates 87
Installing Test Certificates 87
Signing Your Test VIB 88
Signing a VIB Using the Workbench UI 88
Signing a VIB in the Command Line 89
Selecting an Acceptance Level in the descriptor.xml File 90
Set the Acceptance Level on Your Test ESXi 90
Installing Your Test VIB on a Test ESXi Host 90

VMware Workbench Getting Started Guide
6 VMware, Inc.
Installing a VIB Using the Workbench UI 91
Installing a Signed VIB Using the Command Line 91
Installing an Unsigned VIB Using the Command Line 91
Signing Your VIB for Production and Distribution 92
Verifying Remote Installation 92
9 Using the Workbench Log Browser 93Loading Log Files into Workbench 93
Tour of the Workbench Log Browser 94
Opening an Existing Log Project 94
Enhanced Search with Named Filters 94
Copying Log Entries to Clipboard 94
Finding and Synchronizing Time Stamps 94
Refreshing a Log 95
Cheat Sheets 95
Recording a Log Browser Session 95
Displaying and Using the Activity Graph 95
More About the Log Browser UI 97
Log Browser Command Line 99Command‐Line Client Use Cases 99
Where to Find the Command‐Line Client‐Server 100
Workbench Log Browser Update Site Plug‐in for the Workbench Appliance 100
Workbench Log Browser Native Eclipse IDE 100
Using the Command‐Line with the Workbench GUI 100
Using the Command‐Line Client with the Standalone Server 101
Permission Issues when Retrieving a Recorded Log Browser Session 101
Command‐Line API Reference 102
Command Syntax 102
Getting the List of Available Commands 102
Getting Help on a Particular Command 102
Use Case Examples 102
Printing Log Entries to the Console 103
Downloading Log Files from a Remote Host for Analysis 103
Discovering Logs on a Host 104
Downloading All Logs for a Host 104
Getting the Count of the Total Number of Visible Log Entries 104
Printing Log Entries to stdout 104
Applying a Simple Filter 104
Exporting Entries to a File 105
stdout Redirection 105
The ‐‐outfile Option 105
Finding Particular Entries and Printing Them 106
Finding Particular Entries and Failing if the Count is Not What You Expect 106
Printing the Contents of a Local Log Bundle File 106
Loading Log Types from a Log Bundle 107
Known issues/Limitations 107
Advanced Use Cases 107
Index 109

VMware, Inc. 7
About This Book
This book, the VMware® Workbench Getting Started Guide, provides information about VMware Workbench and
its extensions to the Eclipse IDE.
Revision HistoryA revision of this book occurs with each release of the product, or as needed. A revised version can contain
minor or major changes. Table 1 lists the revision history of this book.
Intended AudienceThis book is for VMware customers partners who develop and certify products using VMware Workbench.
VMware Technical Publications GlossaryVMware Technical Publications provides a glossary of terms that might be unfamiliar to you. For definitions
of terms as they are used in VMware technical documentation, go to http://www.vmware.com/support/pubs.
Documentation ResourcesEach Workbench plug‐in contains its own help documentation that displays in the Help > Help Contents
window. PDF copies of these documents may be available on the VMware Developer Center Web site.
Documentation FeedbackPlease send feedback to this documentation through your VMware partners representative.
VMware also welcomes your suggestions for improving our other VMware API and SDK documentation.
Send your feedback to: [email protected].
Technical Support and Education ResourcesFor all questions relating specifically to the VMware Workbench, see the VMware partner co‐dev web site:
http://www.vmware.com/partners/alliances/programs/co‐dev/iovp.htm
About This Book
Table 1. Revision History
Revision Description
10 September 2015 vSphere 6.0 U1 GA – Workbench 3.5.3 GA
12 March 2015 vSphere 6.0 GA – Workbench 3.5.1 GA
29 Sept 2014 vSphere 6.0 RC – Workbench 3.5 GA
30 June 2014 vSphere 6.0 Beta 2 – Workbench 3.5 Beta
VMware Workbench Getting Started Guide
8 VMware, Inc.
The following sections describe VMware technical support and educational resources available to you.
Online Support and Telephone Support
To use online support to submit technical support requests, view your product and contract information, and
register your products, go to http://www.vmware.com/support.
Support Offerings
To find out how VMware support offerings can help meet your business needs, go to:
http://www.vmware.com/support/services
VMware Professional Services
VMware Education Services courses offer extensive hands‐on labs, case study examples, and course materials
designed to be used as on‐the‐job reference tools. Courses are available onsite, in the classroom, and live
online. For onsite pilot programs and implementation best practices, VMware Consulting Services provides
offerings to help you assess, plan, build, and manage your virtual environment. To access information about
education classes, certification programs, and consulting services, go to http://www.vmware.com/services.
VMware, Inc. 9
1
VMware Workbench is an Eclipse‐based development environment. The user interface retains the look and
feel of Eclipse, but with VMware‐specific extensions.
Installing VMware WorkbenchThe following sections cover prerequisites and how to install the VMware Workbench virtual appliance.
Hardware Requirements
In Workbench 3.5, the default memory for the Workbench virtual appliance is 3GB. To accommodate this
default and maintain satisfactory performance, the physical machine that provides the virtual infrastructure
for the Workbench virtual appliance should meet the following requirements:
64‐bit dual core processor
4 GB RAM
40 GB of free HDD space
Download and Install VMware Workbench
In the VMware Developer Center, find the introduction page for the VMware Workbench VM. At the bottom
of the page are a number of files for download.
For vSphere, download the OVA file, an Open Virtualization Format (OVF) archive.
For VMware Fusion, Workstation, or Player, download the ZIP file.
To run the Workbench virtual appliance on vSphere, place the OVA file on a network server or on your local
machine, and use the vSphere Web Client to Deploy OVF Template. Answer questions in the dialog boxes.
When finished, power on the Workbench virtual appliance.
To run the Workbench virtual appliance on VMware Fusion, Workstation, or Player, unzip the ZIP file into its
own subdirectory of your Virtual Machines folder. In the VMware software, click File > Open. Navigate to the
subdirectory, open the *.vmx file, and power on the Workbench virtual appliance.
In both cases, look at the console of the virtual appliance as it boots. Agree to the EULA by typing yes at the
prompt. Optionally type y to have Eclipse auto‐start. Press Enter to display the Linux login window.
VMware Workbench 3.5 is 64-bit
The physical host running your virtualization platform (VMware Workstation, VMware Fusion or ESXi) must
support 64‐bit code execution. Some servers include CPUs with support for Virtualization Technology (VT)
but ship with VT disabled by default. If this is the case for your computer, you must enable it manually.
Introduction to VMware Workbench 1
NOTE If you want to use the CLI to work with development kits, see “Command Line Usage” on page 14.
VMware Workbench Getting Started Guide
10 VMware, Inc.
If you cannot boot VMware Workbench 3.5 after installation, try the following workaround:
To manually enable VT:
1 During the boot process, press F12 to enter System Setup.
2 Select check box Virtualization Support > Virtualization > Enable Intel Virtualization Technology.
3 Select check box Virtualization Support > VT for Direct I/O > Enable Intel VT for Direct I/O.
4 Click Apply and click Exit to reboot.
Before You Report a Problem to VMware
When you encounter an error or problem with Workbench, a development kit, or a certification, and you want
to report it to VMware, use the Create Workbench Support Bundle feature to create a ZIP file with much of
the information support technicians need, including the following information:
The full Workbench system environment.
Information about all Eclipse plug‐ins and features on your system.
All Workbench log files, and the Eclipse log file.
For Linux systems, some amount of /proc information.
Using this tool will expedite your support request because the technician will not have to ask you to gather the
information before work can start on the issue.
To create the Workbench support bundle
To create the file while in the Workbench UI, perform the following steps:
1 In the Workbench Eclipse UI, click the VMware menu item and then Create Workbench Support Bundle.
2 In the VMware Support Bundle Creator pop‐up window, accept the directory suggested for the file, or
click Browse to select a different directory.
3 Enter a description of the error or problem, including how to recreate it (this is very important).
4 Click OK.
5 Attach this file to your DCPN case or initial email request for support.
Configuring VMware WorkbenchBefore you start work on certification or development, you may want to perform some of these set‐up tasks:
Configure VMware Workbench to run remotely, or run it directly in the virtual appliance:
“Start VMware Workbench Remotely Using X Forwarding” on page 11.
“Start VMware Workbench Directly in the Virtual Appliance” on page 11.
Log in to Linux. See “Logging in to Linux” on page 12.
If you have a firewall, set HTTP and HTTPS proxies. See “Setting Network Proxies” on page 12.
If DHCP was selected, reconfigure the Workbench appliance to use a static IP address.
See “Configuring Static IP for the Virtual Appliance” on page 13.
Install software plug‐ins for your development kit or certification tests from the update site.
See “Install New Software Instructions” on page 22.
Restart Workbench. After you install any or all of the software packages you need, click Restart Now.
See “Installing New VMware Workbench Software Packages” on page 22.

VMware, Inc. 11
Chapter 1 Introduction to VMware Workbench
Start VMware Workbench Remotely Using X Forwarding
You can set up Windows or Linux to display VMware Workstation remotely with X11 forwarding.
Using VMware Workbench Remotely from a Linux Desktop
To invoke the VMware Workbench remotely, open a terminal window on your Linux desktop and run the SSH
command, enabling the X forwarding option. Root or superuser access is not required.
For example, use the following command after the shell prompt ($):
$ ssh -X -l vmware <vmwb-host> vmwb
For vmwb‐host, substitute the host name or the IP address of the VMware Workbench virtual appliance.
The default password for the vmware login is vmware.
Using VMware Workbench Remotely from a Windows Desktop
Use XMing and PuTTY to do X forwarding and open a remote client. You must start XMing first, then PuTTY.
To start XMing and set additional parameters
1 From a Windows desktop, click Start > Programs > XMing > XLaunch.
2 Select Multiple Windows and click Next.
3 Select Start no client and click Next.
The Additional parameters dialog displays.
4 To enable cut and paste operations from Windows to the Workbench interface, type -clipboard in the Additional parameters for XMing text box.
5 (Recommended) Set the font size. Choosing 96 DPI for the font size dramatically improves readability for
many users. To size the font in Workbench, type the DPI number in the Additional parameters for XMing
text box, for example:
-dpi 96
6 Click Finish.
To start PuTTY and log in to VMware Workbench
1 Start PuTTY and create a new session by typing the IP address of the Workbench virtual appliance.
Save the session by typing a name in the Saved Sessions text box and clicking Save.
2 Select X11 under Connection > SSH.
3 For Options controlling SSH X11 forwarding, select Enable X11 forwarding and click Open.
4 Log in as vmware with password vmware.
5 Type vmwb to start VMware Workbench.
Start VMware Workbench Directly in the Virtual Appliance
While installing the Workbench virtual appliance, you are queried about opening the UI automatically upon
startup. If you reply yes, VMware Workbench will open when installation completes and whenever the virtual
appliance starts. Otherwise you can start Workbench whenever you want.
You can log into the Linux virtual appliance and start Workbench from the command line.
NOTE Download and install XMing from the following location:
http://www.sourceforge.net/projects/xming/
Download and install PuTTY from the following location:
http://www.putty.org/

VMware Workbench Getting Started Guide
12 VMware, Inc.
Logging in to Linux
The VMware Workbench UI is delivered as a Linux virtual appliance. To log into Linux, you can use the default
user account vmware, or root. The default password for both vmware and root is vmware.
If the Workbench did not open, click the VMware Workbench icon on the virtual appliance desktop:
Or, launch a terminal in the virtual appliance (Applications > Accessories > Terminal) and type vmwb.
After you log in to Linux, create a workspace. You can also create a new user account after logging in.
Create a workspace
Create a workspace by typing in a workspace name, or accept the default presented to you.
Adding and Configuring a New User Account
You can add new users with the standard adduser utility, but check with your system administrator to ensure
that users on this virtual appliance will interact correctly with users on other machines at your site.
Setting Network Proxies
The first time you start VMware Workbench, if you are behind a firewall you probably need to set proxies for
HTTP and HTTPS, as well as proxy by‐passes for local machines that you will connect to.
At first start up, a dialog displays that allows you to configure proxy settings.
In subsequent start ups, you can reach the proxy setting screen by selecting Window > Preferences. Expand
the General preferences and click Network Connections.
To set HTTP proxies
1 Select Manual proxy configuration in the Active Provider drop‐down menu.
2 Highlight HTTP and click Edit.
Verify the proxy server name and port number are correct, or type the correct proxy and port number.
3 Select HTTPS and click Edit.
Verify the proxy server name and port number are correct, or type the correct proxy and port number.
4 In the Proxy bypass list, add systems on your local network (Intranet) that you want Eclipse to find.
The following example shows various types of entries you might want to add:
10.**.example.com127.0.0.1localhost
Wildcards can be used for IP addresses and domain names. Domain names can have only three parts.
5 Click Apply to save changes, and click OK.
You are now ready to install development kits and certification tests.
NOTE While Linux is booting, you will be asked to agree to the EULA. You must respond by typing yes for
the boot process to continue. You will also be asked if you want to start VMware Workbench automatically
after Linux reboots.
CAUTION Do not edit the SOCKS (socket secure) proxy and authentication. Doing so may cause
errors. Leave it unset.
VMware, Inc. 13
Chapter 1 Introduction to VMware Workbench
Setting Proxies for the Linux System in the Virtual Appliance
The proxy setting in Eclipse is independent from the proxy settings for the Linux system. If you want to access
the Internet with a browser outside of Workbench, use the following procedure.
To configure Linux for Internet access
1 Select Computer at the bottom of your virtual appliance console.
2 In the right pane of the Computer window, select Control Center.
3 In the left pane of the Control Center window, under Groups, select System.
4 In the System pane, select Network Proxy.
5 In the Network Proxy Preferences dialog, select the Manual Proxy Configuration radio button.
6 Select the Use the same proxy for all protocols check box.
7 In the HTTP proxy field, type the proxy value for your company, such as proxy.examplecompany.com and enter or use the arrow to change the Port value to the standard port for your company. You should
see the values populated to all of the proxy boxes.
8 Click Close and close the Control Center window.
Click Computer again and choose an Internet browser, for example, Firefox.
Configuring Static IP for the Virtual Appliance
The VMware Workbench virtual appliance is initially configured for DHCP. From a terminal on the Linux
console, you can change it to have a static IP address.
(Optional) Configure static IP
1 Access the virtual appliance (console view on Workstation, launch console in vSphere Web Client).
2 Log in as root, password vmware. If you log in as another user, you can sudo to run commands.
3 In the lower left corner, click Computer > Control Center > Network Settings.
4 In the Overview tab, select the primary network card and click Edit.
5 Select the radio button for Statically assigned IP Address instead of DHCP.
6 Type the IP Address, Subnet Mask, and Hostname that your network administrator assigned.
7 Click Next. Proceed to the Hostname/DNS tab.
8 Set your DNS (Name Servers) 1 and 2 and click OK. The network service will restart.
Accessing Help Resources
Kit‐specific, Workbench‐specific and general Eclipse help topics are available from the Help menu by selecting
Help Contents. The Help browser displays a list of available help libraries. You can search all topics or narrow
the scope using the search tool. Tabs at the bottom of the left pane allow you to view the following items:
Table of contents for any document
Consolidated index of all topics
Search results
Bookmarks you have set in the help topics

VMware Workbench Getting Started Guide
14 VMware, Inc.
Navigating the Workbench UI with the DashboardTo start working with the VMware Workbench UI, use the Dashboard. This feature is the first screen presented
to you upon logging in for the first time. You can access this page from anywhere in the VMware Workbench
UI by selecting VMware > Dashboard from the menu bar.
From the Dashboard, the following information and actions are available:
Information and instructions for common Getting Started tasks and problems
Download and install development kits
Download and install certification plug‐ins
View a list of the plug‐ins already installed
Download and install current debug symbols
Preview documentation before installing a plug‐in
Check on the status of submitted certifications
Preview your certification entry in the VMware Compatibility Guide
View VMware partner news items
For instructions on how to use the Dashboard, see “The VMware Workbench Dashboard” on page 15.
Command Line UsageIf you prefer using the command line for editing, compiling, or debugging, use the Linux command line from
inside the Workbench virtual appliance. The Linux command prompt has all the required toolchain and
environment variables already set up for you.
Run package-extract from VMware Workbench
1 Download the development kit ZIP file to the appliance.
2 Run package-extract. For example:
$ package-extract -z <path> -d <dir>
The <path> is the file location of the ZIP file, and <dir> is the directory location where you want to output
the development kit packages.

VMware, Inc. 15
2
The VMware Workbench Dashboard contains active links to assist your development kit and certification suite
workflow. The Dashboard appears when you initially start VMware Workbench. Some links on the Dashboard
are inactive or hidden until you sign in. If you dismiss the Dashboard, you can return to it later by selecting
VMware > Dashboard from the menu bar.
This chapter covers the following Dashboard topics:
“Signing In to See Content” on page 15
“Workbench Panel” on page 16
“Certifications Panel” on page 16
“Development Panel” on page 20
Signing In to See ContentLocate and click the blue Sign In button on upper right. Usually your sign‐in ID is your company email
address. You can choose whether to use your My VMware or Partner Central password. Some items are
viewable only with Partner Central credentials.
After you sign in, your email address appears to the left of the Sign In button, and you can access content for
all links on the left. Navigation bread crumbs will appear near the top, starting with Home.
Login Troubleshooting
If you fail to log in successfully, you will see one of the following error messages:
The account or password entered was incorrect.Failed to connect through Dashboard.
Try the following remedies to fix the problem:
Make sure you have configured network proxies correctly. See “Setting Network Proxies” on page 12 of
this document.
Make sure that the virtual appliance is connected to the network. For instance, verify that the Connected
check box on the VM > Settings > Network Adapter page is selected.
Verify that your VMware Workbench can access VMware Developer Center Repository by opening the
web browser view (Window > Show View > Other > General > Internal Web Browser) and type the
following URL for the VMware Developer Center Repository:
https://vdc-repo.vmware.com/api
You should see the date and time on the vdc‐repo server. If this does not appear, ask your IT department
to verify that you have access to the VMware Developer Center Repository site.
The VMware Workbench Dashboard 2
VMware Workbench Getting Started Guide
16 VMware, Inc.
Workbench PanelThe top section on the left side provides information about VMware Workbench.
Getting Started
This line is selected initially, with helpful information displayed to the right. If you select another line, new
information replaces the getting started instructions summarized below.
First‐time user? – Instructions for configuring the network proxy.
Common issues and troubleshooting – Suggestions for solving common issues.
Still have questions? – An email contact for getting questions answered.
News
VMware partner news and announcements about Workbench. Clicking a link opens a browser panel inside
Workbench and displays the news or announcement.
Installed Packages
A list showing the VMware Test Manager and any certification suites or development kits already installed.
Clicking a link leads you to start the Test Manager or to start a project for your development kit.
Certifications PanelThe middle section on the left side provides information about VMware certifications.
Certifications
Click the Certifications link to see a list of the certification kits available to you. If a message appears saying
“you must log in to access available Certifications” then sign in with your company email address and your
password for either My VMware or Partner Central.
After the list of Certifications appears, you can click on any certification kit that you are interested in. The
Package Details pane appears with information about the certification, including a short description, links to
install or download the package, a documentation link, the platform type, vSphere version, package version,
and dependencies.
You can preview documentation before installing a package by clicking the link to view it on‐line.
You can download a package to your local file system for installation on a machine not connected to the
Internet. Specify download location. The file name is prefilled for you. For complete installation
instructions, see “Installing Software Packages” on page 21.
You can install a package to the machine you are working on. The installation wizard starts when you
click to install the package. Update Site (Work with) is prefilled for you, so you need not cut and paste the
Update Site from another location.
During install the Contact all update sites during install to find required software check box is selected
to pick up any dependent packages. Non‐VMware update sites are disabled to avoid changing
Workbench by installing incompatible software. If you want to install extra software, you must do it
before installing any plug‐ins. Click Window > Preferences > VMware > Dashboard and uncheck
Disable non‐VMware Update Sites when installing VMware plug‐ins.
From the Package Details pane, you can navigate back to any previous page by clicking breadcrumbs, or
click Certifications to see the list of available packages again.
Compatibility Tools
There are three types of compatibility tools: (1) Certificaiton ID tools, (2) Server Certification Equivalency Tools
(SCET), and (3) Compatibility Analysis Tools (CAT).
VMware, Inc. 17
Chapter 2 The VMware Workbench Dashboard
SCET and CAT are tools already available on Developer Center, but are now accessible through Workbench,
after users sign in with their Partner Central credentials to see them.
Click the Compatibility Tools link to see a list of certification ID generators, and possibly other tools, to help
with compatibility certification. After your organization joins a development program, you can use Cert ID
tools to generate a certification ID for each device or module. You use this ID when submitting a certification.
Cert ID tools are available for NetX, I/O devices, SRM, Server Storage, VASA, VVol vRO, vRealize, and others.
On-Demand Questionnaire Certifications
On‐demand certification was added recently to the Dashboard. They are like traditional certifications but you
fill out a questionnaire on the Web. To get started, click On Demand Questionnaire Certifications. A list of
certification questionnaires will be downloaded. Click the questionnaire certification you want, and in the
Package Details pane, Click here to access the certification. On the Questionnaire Certification pane, click
Create new request. Answer questions on the Certification page. Click Next to reach subsequent pages.
Global Certification Waivers
If the computer you are using for certifications is not connected to the Web, not even through a proxy, see
“Global Waivers for Non‐Internet Connected Computers” on page 17.
Global Waivers for Internet Connected Computers
If the computer you are using for certifications is connected to the Web, click the Global Certification Waivers
link to see a list of Product Types for which waivers are available.
Click Download to obtain the current list of Global Waivers. The global certification waivers list gets
downloaded to /opt/vmware/waivers/waivers.xml by default, and soon an expandable list appears in the
Global Certification Waivers > Product Types pane. You can refresh this list by downloading again.
In the Global Certification Waivers > Product Types pane, waivers are categorized: IO Devices, SRA (storage
replication adapter), (ESXi) Server, Storage Array, VASA, and possibly others. Click one of the types to view
the Waiver Details for that type.
The Waiver Details pane contains a list of the waiver IDs and a description of each. Clicking the waiver ID
displays all available information about that waiver, including a short description, a detailed summary of the
waiver, the list of waived tests, and the list of waived releases.
Some of the Product Type categories have a large number of waivers related to them. You can use the search
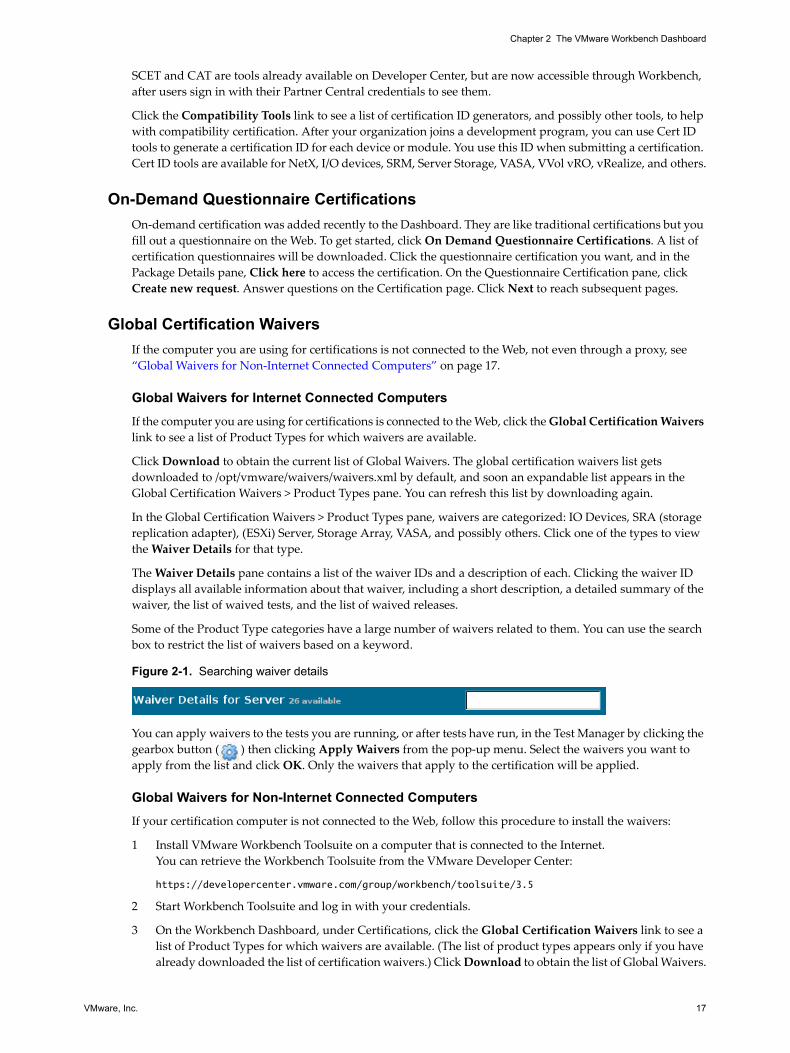
box to restrict the list of waivers based on a keyword.
Figure 2-1. Searching waiver details
You can apply waivers to the tests you are running, or after tests have run, in the Test Manager by clicking the
gearbox button ( ) then clicking Apply Waivers from the pop‐up menu. Select the waivers you want to
apply from the list and click OK. Only the waivers that apply to the certification will be applied.
Global Waivers for Non-Internet Connected Computers
If your certification computer is not connected to the Web, follow this procedure to install the waivers:
1 Install VMware Workbench Toolsuite on a computer that is connected to the Internet.
You can retrieve the Workbench Toolsuite from the VMware Developer Center:
https://developercenter.vmware.com/group/workbench/toolsuite/3.5
2 Start Workbench Toolsuite and log in with your credentials.
3 On the Workbench Dashboard, under Certifications, click the Global Certification Waivers link to see a
list of Product Types for which waivers are available. (The list of product types appears only if you have
already downloaded the list of certification waivers.) Click Download to obtain the list of Global Waivers.

VMware Workbench Getting Started Guide
18 VMware, Inc.
4 Specify a place on your hard drive for the waivers.xml file, for example C:\temp. Click OK and the waivers.xml file will be downloaded to the location you specified.
5 Copy the file to portable media and take the media to the non‐Internet connected computer where your
certification setup is run. On your certification computer where the VMware Workbench virtual appliance
is installed, copy the waivers.xml file to the /opt/vmware/waivers/ directory.
6 Start Workbench and open the certification session.
7 You can apply waivers to the tests you are running, or after tests have run, in the Test Manager by clicking
the gearbox button ( ) then clicking Apply Waivers from the pop‐up menu. Select the waivers you
want to apply from the list and click OK. Only the waivers that apply to the certification will be applied
Certification Submission and Status
To upload certification submission bundles, check the status of your submission, and view SR incident status,
click the Certification Details and Submission Status link.
Figure 2-2. Managing your certification submission
Manually Upload a Saved Submission Bundle
If you saved a submission bundle that you want to upload, click the top link Click here to manually upload
a saved certification submission bundle. In the resulting Upload Certification Submission Bundle dialog,
browse to locate your *.zip or *.gzip certification submission bundle, click Upload, and click Finish.
The resulting submissions upload properties will become visible in the Project Explorer view. If not already
created, a new folder called manual_uploads will be created that contains Submission.prop and *.zip or *.gzip files in folders labeled by submission date, as shown in Figure 2‐3.
Figure 2-3. Project Explorer Submission.prop file
Click the Submission.prop file to open it in an editor for viewing. Further submission status can be accessed
in the Dashboard, as shown in Figure 2‐4.

VMware, Inc. 19
Chapter 2 The VMware Workbench Dashboard
Available SR Incidents
To see all of the SR (service request) incident reports that you have filed, click the second link Click here to list
available SR incidents. The resulting Certification Details and Submission Status pane contains your account
information, a summary of SR incidents, and details of your SR incident reports.
Submission Status
All your current certification sessions are listed. To refresh the list, click the Refresh icon. To view the
Certification Submission and Status details page, click Click here.
Certification Submission Status
To check status of your certification submission, click the third link Click here for more certification and
submission status details. The resulting Certification Submission Status pane contains a list of your cert
submissions with Cert Name, Cert Type, Transaction Id, Submission Status, and Cert Detail.
If you wish to export the submission status of your certifications in comma‐separated variable (CSV) format,
click the Export link. A dialog allows you to name the .csv file and choose where to store it.
If your certification submission status looks out of date, click the Refresh link and icon to update the status of
your certification sessions.
Figure 2-4. Certification Submission and Status Detail Page
Once your submission has started the VMware review process, a clickable link appears under Cert Details.
The Cert Details page contains product and certification details and lists compatible or equivalent products.
Add Transaction Ids
This section list submission status of certifications by a given transaction ID. If you know the transaction ID of
a certification that was submitted on a different instance of VMware Workbench, you can add it by clicking
Add status by Transaction Id, and keying in the ID. All columns, except the certification name, are populated
with information about that transaction ID. You can delete the entry for an added transaction ID by clicking
the X icon next to the entry.

VMware Workbench Getting Started Guide
20 VMware, Inc.
VCG Preview
If you would like to see a preview of how your certifications will look in the VMware Compatibility Guide
(VCG), you must have signed in using your VMware partner credentials. The page lists the ESXi versions you
have certifications for, and product types for each version. Click the appropriate product type to see how your
certifications will be listed in the VCG. If you find any errors in the entry for your product(s), notify VMware
to have it corrected.
Development PanelThe Development section appears at bottom left of the Dashboard. You might need to scroll down to see it.
SDKs
Click the SDKs link to see a list of development kits available to you. If a message appears saying “you must
log in to access available SDKs” then sign in with your company email address and either your My VMware
or Partner Central password. After sign in, you can do the following tasks at this link:
View the list of available uninstalled packages.
Click the link for an available development kit to see Package Details.
The Package Details pane provides information about a development kit, including short description,
links to install or download the package, a link to documentation, platform, programming language,
vSphere version, and dependencies.
You can preview the manual for a development kit before you install the package, by clicking the link
to view on‐line documentation.
You can download a package to a local file system for installation on a machine not connected to the
Internet. Specify the download location. The file name is prefilled for you. For complete installation
instructions, see “Installing Software Packages” on page 21.
You can install a package to the machine you are working on. The installation wizard starts when
you click to install the package. Update Site is automatically filled in for you, saving you from having
to cut and paste the Update Site from another location.
From the Package Details pane, you can navigate back to any previous page by clicking breadcrumbs, or
click SDKs to see the list of available packages again.
Debug Symbols for VMkernel Updates
If you have not already done so, sign in to access the Debug Symbols repository. For debugging, you will need
to update Workbench’s debug symbols to match the version of ESXi host that is being tested.
To see a list of the available debug symbol files, click the Debug Symbols for VMkernel Updates link. To
download a debug symbol file, click the link(s) of the build number(s) matching the ESXi build number for
your host(s) under test, optionally change the save folder, and click OK.
NOTE During install the Contact all update sites during install to find required software check box
is selected to pick up any dependent packages. Non‐VMware update sites are disabled to avoid
changing Workbench by installing incompatible software. If you want to install extra software, you
must do it before installing any plug‐ins. Click Window > Preferences > VMware > Dashboard and
uncheck Disable non‐VMware Update Sites when installing VMware plug‐ins.
VMware, Inc. 21
3
You can install software packages (plug‐ins) from inside an Internet‐connected Workbench virtual appliance,
or download them to portable media (sneaker‐net) and install them on a Workbench virtual appliance that is
not connected to the Internet. One way to download development kits and certification suites is to use the
Dashboard. Another way is Eclipse’s Install New Software feature to download and install plug‐ins.
This chapter contains the following topics:
“Simplified Installation Instructions from the Dashboard” on page 21
“Install New Software Instructions” on page 22
“Installing Packages Offline (Sneaker‐Net)” on page 24
“Fixing Proxy Issues” on page 25
“Uninstalling Software” on page 25
Simplified Installation Instructions from the DashboardThe easiest way to install a software package in Workbench is from the Dashboard because the URL for the
various SDKs and certifications is already filled in. The Dashboard is the first screen presented to you when
Workbench starts up. However, you can always get to the Dashboard by navigating to VMware > Dashboard.
To install a software package from the Dashboard:
1 You must sign in to see the list of available SDKs or certifications. See “Signing In to See Content” on
page 15.
2 On the left side, click either the SDK or Certifications link to see the list of SDKs or certifications that you
can download and install.
3 Click the name of the SDK or certification that you wish to install.
4 Click the link to install the SDK or certification package to the local machine. The installation wizard starts
after you click here to install. Update Site (Work with) is automatically filled in for you, saving you from
having to cut and paste the Update Site from another location.
5 In the Install wizard, click Select All, and then click Next.
6 On the Install Details page, click Next.
7 Review the license, select I accept the terms of the license agreement, and click Finish.
8 During the install, a dialog box appears telling you the module is unsigned. Click OK.
9 At the end of the installation, a dialog box asks you for permission to restart VMware Workbench. If you
are done installing software packages, click Yes. If you have more to install, click No.
Installing Software Packages 3
VMware Workbench Getting Started Guide
22 VMware, Inc.
Install New Software InstructionsYou can install software using the classic Eclipse method where you provide the URL for a software package.
This allows you to specify arbitrary software packages for a custom approach.
Specifying Available Software Sites
There may be multiple software sites from which you must download packages. Sometimes a package on one
site has a dependency on a package on another download site. VMware Workbench can coordinate this for
you and automatically download the components you need to satisfy any dependencies. To set up this feature,
use the Available Software Sites preferences.
Set up Available Software Sites preferences
1 From the VMware Workbench click Help > Install New Software and click the Install link for the plug‐in.
2 From the Install dialog box, click Available Software Sites.
The Preferences dialog box displays with Install/Update expanded and Available Software Sites
selected.
3 Click Add to display the Add Repository dialog box.
4 Determine the URL you need from your partner site on the Developer Center or from another source.
Enter, or copy and paste, the URL of the download site in the Location text box.
5 Type a name for that update site location in the Name text box. Click OK.
The update site appears, added to the list of available software sites in the Preferences dialog box.
6 The status of the site should be Enabled. If the status of the site is Disabled, select the site and click Enable.
7 Repeat the Add operation until you have added and enabled all the available software sites that you will
be using for VMware Workbench.
8 When you are finished, click OK to dismiss the Preferences dialog box and return to the Install dialog box,
where you can proceed to installing new software packages.
Installing New VMware Workbench Software Packages
You can add VMware Workbench software packages and certification tests or update existing packages using
the Install dialog. You can reach the Install dialog two ways: by clicking Help > Install New Software, or by
clicking Install in the Dashboard Development panel under SDKs, after you have logged in.
Software packages can be installed from a site you already entered using the Available Software Sites dialog,
from a network update site, or from a local folder (after downloading the ZIP files to a local folder).
Install software packages from the list of available software sites
1 From the Install wizard, make a selection from the Work with drop‐down menu.
2 Click Select All, or select the check box next to the package name, and click Next.
The system calculates the requirements and dependencies for the package(s) you selected.
IMPORTANT Before you install any software packages, proxy settings must be configured. Failure to configure
proxy settings can result in the installation stalling. You were offered the opportunity to set proxies when you
installed the base VMware Workbench appliance. If you have not already configured the proxy settings, see
“Fixing Proxy Issues” on page 25.
NOTE The Contact all update sites during install to find required software check box is not selected by
default here in the Install wizard, unlike when installing plug‐ins from the Dashboard. Additionally,
non‐VMware Update Sites are disabled here as they are when installing from the Dashboard.
VMware, Inc. 23
Chapter 3 Installing Software Packages
(Optional) You can expand VMware Workbench <Package Name> in the Name column to see the list of
components included in the package. You can choose to exclude some or all components by deselecting
them, however this step is not necessary because the installation software prevents you from installing
duplicate or unnecessary components.
3 Review the Install Details, and click Next.
4 Review the license text, select I accept the terms of the license agreements. You cannot install the
software without agreeing to the license terms. Click Finish. The software installation can take several
minutes to complete. If you are asked to accept unsigned content, click OK.
5 When installation is complete, a dialog box advises you to restart Eclipse for the changes to take effect and
asks you if you want to restart now.
If you have other packages to install, click No.
If you are finished installing software packages, click Yes to restart Eclipse.
Install software packages from the network update site
1 Open a Web browser and go to the VMware download site for your development kit or certification suite.
2 Copy the URL for the software package to download.
3 Click Help > Install New Software. From the Install dialog box, click Add.
4 The first time you install the package, paste the URL into the Location text box. Type a Name. Click OK.
VMware Workbench <Package Name> shows in the text box.
If you are reinstalling the package (for an update of the software), select the update site from the list in the
Work with drop‐down menu.
5 Select the check box next to the package name, and click Next.
The system calculates the requirements and dependencies for the packages you have selected.
(Optional) You can expand VMware Workbench <Package Name> in the Name column to see the list of
components included in the package. You can choose to exclude some or all components by deselecting
them, however this step is not necessary because the installation software prevents you from installing
duplicate or unnecessary components.
6 Review the Install Details and click Next.
7 Review the license text, select I accept the terms of the license agreements. You cannot install the
software without agreeing to the license terms. Click Finish. The software installation can take several
minutes to complete. If you are asked to accept unsigned content, click OK.
8 When installation is complete, a dialog box advises you to restart Eclipse for the changes to take effect and
asks you if you want to restart now.
If you have other packages to install, click No.
If you are finished installing software packages, click Yes to restart Eclipse.
Install software packages from a local folder
1 In the Dashboard, you can choose to download a package to a local folder. Alternately, you can open a
browser in the Workbench virtual appliance and go to a VMware download site. Download the ZIP file
containing a software package. For example, download the following file:
UpdateSite-<package name>-com.vmware.vide-<version number>.zip
2 Make a new directory and move the ZIP file into it, for example /home/vmware/update.
3 In VMware Workbench, click Help > Install New Software.
4 Click Add to open the Add Repository dialog box.
5 Click Local, navigate to the update file path (repository root directory) and click OK.
6 Back in the Add Repository dialog box, type a name for the package and click OK.
VMware Workbench Getting Started Guide
24 VMware, Inc.
7 Click Select All, or select the check box next to the package name, and click Next.
The system calculates the requirements and dependencies for the package(s) you selected.
(Optional) You can expand VMware Workbench <Package Name> in the Name column to see the list of
components included in the package. You can choose to exclude some or all components by deselecting
them, however this step is not necessary because the installation software prevents you from installing
duplicate or unnecessary components.
8 Review the Install Details, and click Next.
9 Review the license text, select I accept the terms of the license agreements. You cannot install the
software without agreeing to the license terms. Click Finish. The software installation can take several
minutes to complete. If you are asked to accept unsigned content, click OK.
10 When installation is complete, a dialog box advises you to restart Eclipse for the changes to take effect and
asks you if you want to restart now.
If you have other packages to install, click No.
If you are finished installing software packages, click Yes to restart Eclipse.
Installing Packages Offline (Sneaker-Net)To accommodate those who do not have Internet access for installation of the software packages, VMware
Workbench installation packages can be downloaded and transferred (sneaker‐net) as individual ZIP files. You
can download software packages from the same site where the base VMware Workbench package resides.
Install software packages off-line
1 On a machine connected to the Internet, using the Dashboard of the Workbench virtual appliance or
Workbench IS, click the “download” link for one of the SDKs or Certifications. Download the software
package as a ZIP file. Copy it to portable media. For example, download and copy the following file:
UpdateSite-<package name>-com.vmware.vide-<version number>.zip
2 Insert the portable media into the system running the Workbench virtual appliance where you wish to
install the package.
3 On the Workbench virtual appliance, make a new directory, for example /home/vmware/update, and copy the ZIP file from portable media into the update directory.
4 In VMware Workbench, click Help > Install New Software.
5 Click Add to open the Add Repository dialog box.
6 Click Local, navigate to the update file path (repository root directory) and click OK.
7 Back in the Add Repository dialog box, type a name for the package and click OK.
8 Click Select All, or select the check box next to the package name, and click Next.
The system calculates the requirements and dependencies for the package(s) you selected.
(Optional) You can expand VMware Workbench <Package Name> in the Name column to see the list of
components included in the package. You can choose to exclude some or all components by deselecting
them, however this step is not necessary because the installation software prevents you from installing
duplicate or unnecessary components.
9 Review the Install Details, and click Next. Review the license text, select I accept the terms of the license
agreements. You cannot install software without agreeing to the license terms. Click Finish. Installation
can take several minutes to complete. If you are asked to accept unsigned content, click OK.
10 When installation is complete, a dialog box advises you to restart Eclipse for the changes to take effect and
asks you if you want to restart now.
If you have other packages to install, click No.
If you are finished installing software packages, click Yes to restart Eclipse.

VMware, Inc. 25
Chapter 3 Installing Software Packages
Fixing Proxy IssuesIf you have problems with the installation seeming to stall or taking a long time to complete, or you cannot
open a terminal, you might need to configure proxy settings.
Fix proxy issues
1 In VMware Workbench (Eclipse) menu bar, click Window > Preferences.
2 On the left side, expand General and click Network Connections.
3 In the Active Provider drop‐down menu, select Manual proxy configuration.
4 Verify that you have the HTTP and HTTPS proxies set properly. If not, select them one at a time, click Edit,
and type the correct settings for the proxy host and port.
a Verify the proxy server name and port number are correct.
b In the Proxy bypass list, add the list of IP addresses or host names for which the proxy server should
not be used. Use of wildcards is permitted. The list might look something like this:
*.example.com127.0.0.1localhost
5 Click Apply to save changes.
6 Click OK to exit.
Uninstalling SoftwareAlso see the Eclipse Workbench User Guide for detailed instructions about removing software packages that are
already installed.
Uninstall software
1 In the VMware Workbench (Eclipse) menu bar, click Help > About VMware Workbench.
2 Click Installation Details to see the Installation Details page.
3 On the Installed Software tab, select the package to uninstall, and click Uninstall.
CAUTION Even though it is possible to remove software packages, VMware advises against it. If you must do
it, VMware urges you to be extremely careful because you risk rendering other packages inoperable because
of missing dependencies. Data loss is possible.
Many installed packages contain common modules that are needed by other installed software packages
(development kits and certification suites). If you inadvertently remove a common module that other installed
software depends on, you can render those software packages inoperable.
If you have used the software to create valuable data that you want to keep, take measures to copy the files to
a safe location before uninstalling the software.

VMware Workbench Getting Started Guide
26 VMware, Inc.
VMware, Inc. 27
4
VMware Workbench provides a Test Manager to help you run certification tests or unit tests. In unit test mode,
you can run the certification tests individually and change the test parameters.
For information about your specific certification, see the certification guide appropriate to your module type.
You can fine PDF certification guides at the VMware partner site, or in Eclipse, Help > Help Contents. This
chapter contains the following Test Manager topics, generally in workflow order. When you want to complete
a certification from start to finish, you should be reading the certification guide, not this chapter.
“Tests Dashboard” on page 28
“Starting a New Test Session” on page 29
“Setting Up and Running the New Test Session” on page 30
“Running an Existing Test Session” on page 33
“Generating a Results Package” on page 34
“Submitting the Test Results Immediately” on page 35
“Filing a Service Request (SR) with the Certification Submission Wizard” on page 35
“Submitting Results at a Later Time” on page 36
“Off‐Line Submission for Certification” on page 36
“Entering or Modifying a VMware Waiver Approval ID” on page 37
“Email Notifications” on page 37
“Test Manager Command‐Line Interface” on page 38
“Test Manager Web Client” on page 40
“Importing and Exporting Parameters from a File” on page 41
“Enabling Prefilling from the Parameter Cache” on page 41
“Importing a Parameter Cache from Another Workspace” on page 41
“Time Management Help for Long Running Tests” on page 42
“Splitting Certification Tests into Multiple Sessions” on page 42
“Merging Split Sessions into One New Merged Session” on page 43
“Recreating a Test Session by Importing Test Results from Previous Run” on page 43
“Verifying Remote Installation Before You Submit Your VIB to VMware” on page 44
“Adding A Custom Test” on page 45
To set up the appropriate testbed for your certification, run the Installation Helper before starting the Test
Manager. For information on the Installation Helper, see the VMware Workbench Installation Helper Guide.
Running Test Manager 4
VMware Workbench Getting Started Guide
28 VMware, Inc.
When running in unit test mode, you still see references in the UI to certifying the results. Unit test results
cannot be use for certification; the results are only for your use in testing.
Sections “Test Manager Command‐Line Interface” on page 38 and “Test Manager Web Client” on page 40
describe alternate interfaces to Test Manager. You might find them useful.
You can record your certification session for later replay from the command line. This allows you to run the
session remotely and unattended. For more information, see “Test Progress page” on page 32, and “Running
Multiple Recorded Test Sessions Simultaneously” on page 38.
Many certifications require that you fill out a configuration information page. You must enter this information
each time you run the certification. Test Manager saves the parameter values in a parameter cache and can
prefill them for you when you run the certification again. You can import the cache from other workspaces.
During your Test Manager session, you can override the prefilled information to suit your individual needs
for this certification run. For instructions on configuring this feature, see “Enabling Prefilling from the
Parameter Cache” on page 41 and “Importing a Parameter Cache from Another Workspace” on page 41.
Tests DashboardThe Tests Dashboard is a utility plug‐in installed with Test Manager on your Workbench system. The
dashboard displays in a view separate from the Test Manager on the Workbench interface. Use the Tests
Dashboard to view the state of all test sessions in the Test Sessions folder. The sessions display even if they are
not currently running.
Viewing the Test Manager Dashboard
Open the Test Dashboard view from the Window menu. (Window > Show View > Other, then expand
VMware and select Test Dashboard)
The following table lists the various dashboard view column headings and a description of the data you see in
each column.
Scheduling Test Sessions Using the Test Manager Dashboard
On the dashboard, a Schedule link shows to right of the Progress column for test sessions that are open.
Scheduler limitations
1 The test session must be open to schedule it.
If you want to schedule a test session and don’t see the Schedule link next to it, open the test session by
double‐clicking the session’s .cert file name in the Navigator pane.
2 Some test sessions require the user to enter configuration data in one of the test session pages. You must
make sure data has been entered and the Confirm button has been clicked before you schedule the test.
Table 4-1. Test Manager Dashboard View Contents
Column Heading Description
Certification The name of the certification session.
Total tests The total number of tests in this certification.
Passed/Waived/NA The number of tests that passed, were waived in the last run, or were not applicable.
Failed The number of tests that failed in the last run.
Remaining The number of tests that did not run in the last run.
Status Status of the certification session: Closed, Not Running, Running, Waiting, Run Ended.
Progress A moving colored bar that tracks progress of the certification tests. Green indicates that tests have passed. Red indicates that tests have failed.
VMware, Inc. 29
Chapter 4 Running Test Manager
3 Some certifications ask the user for information at run time. A test that is scheduled but requires runtime
input will not automatically run to completion. The test will wait for user input until the requested
information is entered.
4 Only the tests that are checked in the Test Selection page will be run during the scheduled test.
5 Test sessions that are designed to be run manually cannot be scheduled.
Schedule a Test Session
1 Click the Schedule link.
The Schedule a Test Session dialog box displays.
2 Select a starting date on the calendar.
3 Adjust the time field.
a Highlight the hour, minute or second number.
b Click the top button next to the time field to adjust the number higher. Click the bottom button to
adjust the number lower.
4 Select the Frequency to run the test from the drop‐down menu.
Choices are Once, Hourly, Daily, or Weekly.
5 Click Schedule.
Cancel or Reschedule a Test Session
A scheduled test session can be cancelled (unscheduled) or rescheduled by clicking the Schedule link next to
the Progress column for the test.
In the Schedule a Test Session dialog box, to reschedule a test session, reset the date, time or frequency of the
test and click Schedule.
To cancel a test session, click Unschedule.
Viewing the Test Session Web Report
You can view a read‐only summary report of each test session with its test results on a web browser by typing
the following URL in a browser: http://IP address of Workbench virtual appliance:8100/tm.
You can retrieve the IP address of the virtual appliance by running ifconfig from a terminal window inside
the VMware Workbench virtual appliance.
The content of the web report is the same as the Tests Dashboard view in the Workbench interface, except that
there are no Schedule links in the web report.
Starting a New Test SessionYou can create a new test session or start an existing session. You can optionally use a cheat sheet to get started.
Use a cheat sheet to get started
1 Select Cheat Sheets from the Help menu.
Help > Cheat Sheets
2 From the Cheat Sheet Selection dialog box, expand VMware Test Manager.
3 Select Creating a Test Session and click OK.
Follow the instructions for creating a test session.
VMware Workbench Getting Started Guide
30 VMware, Inc.
Open Test Manager and create a new test session
1 Open Test Manager.
From the Window menu, select Open Perspective > VMware Test Manager.
2 Create a new test session.
From the File menu, select New, then select Test Session. (File > New > Test Session)
The New Test Session wizard displays.
To import an existing test session, see
3 In the New Test Session wizard, complete the various fields:
4 (Optional) For unit testing, select the Unit Test Mode check box.
In unit test mode, you can modify the test cases and specify parameters. You cannot do a full certification
session from this mode. You can submit troubleshooting logs from a unit test. If you select this mode,
[Unit Test Mode] shows at the top‐right corner of the subsequent Test Manager screens.
5 Click Finish.
The certification session starts. The screens vary somewhat according to the type of testing you are doing.
See the appropriate certification guide for detailed information on the certification you are going to run.
Setting Up and Running the New Test SessionYou configure the test session by entering testbed information, server configuration, and selecting tests to run.
Before you run Test Manager, you should have already run Installation Helper to set up your testbed and
create the virtual machine library needed for device driver testing. See the VMware Workbench Installation
Helper Guide, found in the Help Contents.
Before running your certification, you can configure Test Manager to save any configuration page information
you enter, or you can import configuration information from another session that you ran previously. For
configuration instructions, see
Host Selection page
1 If you have downloaded Global Waivers, apply them now by clicking the gear icon found on the right side
of the bar that contains the Back and Next buttons.
a The Waiver Selection window lists the waivers that you downloaded in the Dashboard.
b Select the waivers you wish to apply to the tests you are about to run and click OK.
c A pop‐up message tells you the waiver was applied successfully. Click OK to dismiss the window.
After the tests have run, you can verify that the proper tests were waived on the Test Selection or
Summary page.
Table 4-2. New Certification Session Fields
Field Name Description
Test Project Click the Browse button to choose a project for this test. The Folder Selection pop‐up window displays a list of the project folders and the TestSessions folder. If you choose a project, the test session file will be saved to the project folder. If you choose TestSessions, the test session file will be saved to that folder.
Session Name Name the certification session so you can distinguish it from other tests and your real certification sessions. The default name is new-cert.cert.
Categories Choose a category from the drop‐down menu. Your choice determines which tests are preloaded for your use. The list of available session types loads in the Session Types text box.
Session Types Select the Session Type to test.
VMware, Inc. 31
Chapter 4 Running Test Manager
d You can apply waivers after a test run in the Summary page by clicking the Apply Waiver link.
2 Complete the Primary Host and if required, Secondary Host information.
ESXi hosts must have SSH enabled. If you have existing connections to ESXi hosts defined in VMware
Workbench, choose them from the drop‐down menus. If not, you can establish a new connection by
clicking Add Target to bring up the New Connection dialog box. If you add a new host connection, set the
proxy from the Window menu.(Window > Preferences > General)
3 Click Check Host for the Primary Host and for the Secondary Host, if present.
For the primary host only, the Check Host feature checks VIB dependencies for IOVP, Storage VAAI NAS,
and PSA certifications. It also checks VIB dependencies for CIM Provider Acceptance Tests and Host
Profile Acceptance Tests.
After the VIB dependencies are checked, you see either Passed or Failed in the VIB Dependencies field.
If the VIB dependency test fails, you see a VIB Dependency Error dialog that explains its findings and
suggests actions to take. In general, you can try the following steps if the VIB dependency fails:
Uninstall redundant VIB packages. The system performing certification tests should be clean
machine, which has only the VIB packages required to run your certification tests. Removing
unnecessary VIB packages will reduce the chance of failure.
Check for missing dependencies between your VIBs. If you are sure your VIB packages donʹt have
any dependencies with each other, you can ignore this message and go to the next step. False
warnings may happen when you install VIB packages of different classes. For example, if you install
both a 3rd party network driver and a storage driver, it may give a false warning.
4 (Optional) If available, click Check Testbed to use the Testbed Analyzer tool to verify your ESXi systems
against the configuration requirements of your certification.
The Testbed Analyzer view displays the results of the analysis. You can view the results in Tree mode or
Text mode. Switch between modes by clicking the tabs at the bottom of the view.
Errors are flagged with red icons. You can expand the directories for each error to inspect the error. In Tree
mode, the first error is automatically expanded.
Fix any problems with your testbed configuration before proceeding with the certification
5 Click Next.
Server Configuration page
Some certifications require you to make selections concerning the testbed server. You will not see this page if
it does not apply to your certification.
1 Select the check boxes that apply to your test session.
2 Select either Partial Certification or Complete Certification.
3 (Optional) If you choose Partial Certification, select the components have been upgraded since the last
certification.
4 Click Confirm.
Once you have clicked Confirm, you cannot go back and change the selections.
5 Click Next.
NOTE You must perform the Check Host check for the Primary Host. The Next button is dimmed until
you click Check Host for the Primary Host.
IMPORTANT The Testbed Analyzer is a separately installable plug‐in. If the plug‐in is installed and the
open certification supports testbed analysis, the Check Testbed button is present.

VMware Workbench Getting Started Guide
32 VMware, Inc.
Questionnaire page
Before you can continue to test selection, certain types of certifications require you to fill out a questionnaire.
If the questionnaire page is present, select the answers to the questions and click Confirm.
If you plan to run the tests repeatedly and don’t want to repeatedly fill out the questionnaire page, you can
save the answers to a workspace file.
Test selection page
1 From the Test Catalog, select All tests or expand it to reveal groups of tests you can select or expand. You
can keep expanding the sections to get down to each individual test and can select or deselect individual
tests.
2 (Optional) You can select specific tests and apply a waiver to them by right clicking on the test.
For more information about applying waivers, see “Entering or Modifying a VMware Waiver Approval
ID” on page 37.
3 (Optional) You can enter or modify comments on specific tests by right‐clicking on the test.
The Add a Comment pop‐up window displays where you can type a comment. Click OK when you are
finished typing.
4 Once you have selected all the tests for this run, click Next.
Configuration page
1 If presented to you, fill in the required configuration information.
Most of the Storage Certifications require that you enter information in a Configuration Information
form before any tests can be run. Verify or change the various configuration parameters used for your
testbed.
2 (Optional) A toggle button at the bottom of the form allows you to hide or view virtual machine
information for each field. (Show VM Info/Hide VM Info)
3 Click Confirm and click Next.
For more details on some of the data fields in the Configuration form, see the Storage certification guide.
Test Progress page
1 If you want to record the test session for future replay from the command‐line, select the Record Test
Session check box.
For more information about the Record Test Session feature, see “Running Multiple Recorded Test
Sessions Simultaneously” on page 38.
2 Click Run Test Session, or optionally if present, click Run Unattended.
The page displays the tests you have chosen in one text box and the results in another text box.
NOTE You can save your inputs so that subsequent certification runs can reuse the configuration
information you enter for this page. Or you can import configuration information that you entered in
another workspace. For instructions, see “Enabling Prefilling from the Parameter Cache” on page 41 and
“Importing a Parameter Cache from Another Workspace” on page 41.
IMPORTANT The record function doesn’t work with manual tests.
IMPORTANT Run Unattended: If this mode is available for your certification, and you will not have to
perform some action, such as removing a cable or powering off some equipment before continuing the
test, then you can click Run Unattended instead of Run Test Session.
If you are rerunning a certification and entered test data for the previous run, that test data was recorded.
If you select Run Unattended for this run, the data will be reused and you will not have to reenter it.

VMware, Inc. 33
Chapter 4 Running Test Manager
When the test finishes, the results indicate if the test passed or failed.
3 (Optional) Click Abort Test Case or Abort Test Session to stop a test or the entire test session before it
finishes.
4 (Optional) Click Rerun Test Session to rerun the entire session.
5 Click Next.
Session Summary page
1 View the test Summary report and Test Run Details report.
If there were problems that caused the test session to fail and quit, the Test Run Details report shows you
which tests were skipped. Fix the problems that caused the failure and rerun the test session.
You can apply Global Waivers for tests that did not pass by clicking the Apply Waivers link.
2 (Optional) If you are satisfied with this run, you can create a submission report and package by clicking
Upload/Save Results.
The Results Submission form displays. For instructions on how to fill out this form and generate the
report, see “Generating a Results Package” on page 34.
3 (Optional) If you plan to submit the results package from this test machine, click Purchase SR to be taken
to the VMware Store page (http://www.vmware.com/go/enablement) where you can purchase the SKU
package. that allows you to submit your certification.
The CLI application locks the workspace when performing any operation. This has the following implications:
You can run a separate instance of the CLI application, but you must use another workspace.
The CLI application and the Workbench UI can share the same workspace, but they can not run at the
same time.
Running an Existing Test SessionTo rerun an existing test session, perform the following steps:
1 Depending on what you were doing in Workbench up to this point, the contents of the left pane can vary.
If neither the Project Explorer nor the Navigator tab is open, open the Test Manager. (Window > Open
Perspective > VMware Test Manager)
2 In either the Project Explorer or the Navigator tab in the left pane, locate the name of the test session you
wish to open.
Test sessions are files that have the .cert suffix. They can be located either inside your project (expand the project to find it) or under TestSessions (expand TestSessions).
3 Double‐click the name of the test session you want to open.
4 Run the test session.
When the tests have finished and you are ready to generate a results report. For instructions on how to
generate a results report, see “Generating a Results Package” on page 34.
IMPORTANT The tests to be run are signed by VMware. A test‐checking program determines if any of the
tests have been altered. If any altered tests are found, an Error dialog box opens with the altered tests
listed. Results of the these tests will be invalid for official certification. Click OK to continue the test
session.
NOTE Clicking the Help button brings up this Getting Started Guide.
NOTE If the test was in Unit Test Mode, you can make changes to it, if not, you must run the test as is.
VMware Workbench Getting Started Guide
34 VMware, Inc.
Generating a Results PackageAfter you have run the tests and passed all of the tests, or added waivers for the ones that didn’t pass, and you
have tested deployment of your package with VUM, you are ready to submit a results package to VMware.
Before You Start
Before you generate a results package, you should consider removing extraneous test result directories so that
the ZIP file created for the submission is not too large. Currently the upper limit on ZIP size is 1 GB. If you
have performed multiple runs of the tests, you will have a separate timestamped directory for each test run.
You only need to submit the test run that passed; the other test runs will be ignored anyway, so removing them
will not affect the final result. To decrease the size of the ZIP file, delete the extraneous timestamped
directories, or move them to another location.
Generate the Results Report
1 In the Results Submission pop‐up window, enter your VMware certification ID in the Cert ID field.
If you have not received one, please contact VMware.
2 (Optional) Click Troubleshooting submission if you are uploading troubleshooting logs to VMware.
3 (Optional) Enter up to 1000 characters in the Comment field.
The content of the comment field is added to the certification submission confirmation email, and is stored
in the cert_<cert ID>.pdf as the last field in the Partner and Test Lab Information table. The comment
also is stored in the report.xml file.
4 Click Next.
5 Enter organizational and vendor information as requested in the Result Submission form.
The Partner Information fields are pre‐filled if you have previously submitted results.
6 (Optional) Click Preview Report to view the report before sending.
The report can take a few minutes to complete. You do not have to wait for the report to complete before
continuing on with other tasks.
7 Click Finish to start gathering information for the submission.
A pop‐up window tells you how long this step will take.
8 Click OK to start results collection or click Cancel to return to the Summary page and upload test results
at a later time.
9 (Optional) For some certifications, the Certification Verifier wizard displays.
Fill in the fields with the required information. All of the fields must be filled with the appropriate
information in order for your certification submission package to be complete.
The information required is specific to each certification type. See your VMware certification program
guide for details. If you have questions or have difficulty obtaining the necessary information, contact
your VMware program representative.
If you cancel this page, the process continues, but a warning informs you that your submission might not
be accepted without the required information. If you finish the form, but leave some of the fields blank,
the process continues, but you might be required to supply the information later, which could delay your
submission.
10 Upload the report to VMware, or save it to a file.
NOTE For a statement of best practices before submitting your VIB, see “Verifying Remote Installation Before
You Submit Your VIB to VMware” on page 44.ʺ
IMPORTANT You must have configured your proxy settings in order to upload your results to VMware. See
“Setting Network Proxies” on page 12.

VMware, Inc. 35
Chapter 4 Running Test Manager
When the submission report completes, a pop‐up window displays.
If you have an Internet connection on the test machine, you can click Yes to submit your certification
results now. To continue the submit process, see “Submitting the Test Results Immediately” on
page 35.
If you do not have an Internet connection or you just wish to delay submitting your results, click No
to store the file.
A dialog displays the location of the submission file. Note the location.
If you have to move your submission package to a computer with Internet access, copy the bundle to
a removable media device.
For instructions on how to submit your results at a later time or on a different machine, see
“Submitting Results at a Later Time” on page 36.
Submitting the Test Results ImmediatelyUse these instructions if you chose to submit your test results from the test machine immediately after running
the tests. After you clicked Yes, the report starts uploading to VMware.
1 When the upload completes, a pop‐up window displays the transaction ID. Note the transaction ID for
future reference.
The transaction ID is stored in the submissions.log file in the cert.d directory, where cert is the name
you gave your certification session. The entry lists the timestamp and the transaction ID.
2 When the upload is complete, a Create new Service Request (SR) pop‐up window displays that allows
you to automatically file an SR. Click Yes to continue.
3 Complete the Certification Submission wizard.
For instructions, see “Filing a Service Request (SR) with the Certification Submission Wizard” on page 35.
Filing a Service Request (SR) with the Certification Submission WizardAfter uploading results, if you clicked Yes to file an SR, or you clicked File SR in the Test Manager Summary
page, the Certification Submission wizard displays.
1 In the VMware Service Request Login page, login to have your credentials validated.
Fill in your vmware.com username and password and click Login.
2 If you have not already previously submitted the transaction ID, a pop‐up window displays asking for
you to enter the transaction ID for your submission.
The system displays your partner information, including how many available credits you have.
If you have enough credits to submit an SR, the next screen is enabled. Otherwise you must go to the
VMware Store to purchase enough credits, and then come back to this wizard to file the SR (click File SR).
3 In the Service Request Information page, fill out all the required information.
The system auto‐fills all the known information. You must enter some specifics for this certification.
a Select the Account from the drop‐down list.
b Select the Product Name from the drop‐down list.
c Select the Incident package to use from the drop‐down menu.
d Fill in the phone number, country and time zone if not auto‐filled.
NOTE You can also open the Certification Submission wizard from the New Wizard dialog from the
right‐click menu found in the Navigator pane (New > Other > VMware > SR Submission Wizard, then click
Next).
VMware Workbench Getting Started Guide
36 VMware, Inc.
e Fill in the optional information fields if desired, such as secondary email address, any alternate
contact information, or a third party tracking number.
f Select the Problem category from the drop‐down menu or fill it in if the drop‐down menu is blank.
For example, you might choose Server, or Storage.
g The Description/Transaction ID field is auto‐filled if possible. If it is not, enter the transaction ID in
the text area.
4 Click Finish to complete the certification submission process.
The system automatically files the SR.
You can check the status of your certification submissions in the Dashboard. For an explanation of the
Dashboard, see Chapter 2, “The VMware Workbench Dashboard,” on page 15.
Submitting Results at a Later TimeIf you choose to submit your results at a later time, save your submission results and the location and
transaction ID that are supplied to you. When you want to submit the results, do the following, or if your test
session was run on a computer not connected to the Internet, you can first move the ZIP file to a flash drive or
other removable media and move it to a computer that is connected to the Internet and has VMware
Workbench virtual appliance or Toolsuite installed and then do the following:
1 Start the Test Manager. Navigate to Window > Open Perspective > VMW Test Manager
2 Start the Certification Submission wizard. Right‐click in the Navigator pane and select New > Other
3 Expand VMware in the Wizards list.
4 Select SR Submission Wizard and click Next.
5 Browse to the directory with the submission file.
The submission package is stored as a ZIP file in the cert.d directory, where cert is the name you gave
your certification session.
6 Upload the submission package.
When the upload is complete, you will see the Submission Status filled in, including the transaction ID.
You should record the transaction ID for future reference. Click Next to proceed to submit the SR. For
instructions, see “Filing a Service Request (SR) with the Certification Submission Wizard” on page 35).
Off-Line Submission for CertificationThe easiest way to submit a certification bundle to VMware is to click the Upload/Save Results button on the
Summary page displayed after you finish running a test session. However, if you are working in a lab that is
not Internet connected, it is not possible, so you must do an “off line” submission of the certification bundle.
To submit a certification bundle off-line
1 Save the certification bundle by clicking the Upload/Save Results button. Fill out the next three dialogs
normally, but when asked “Do you want to submit your results automatically?” click No. The submission
bundle will be saved as a ZIP file, and you will see its location with a summary of how to submit it.
2 Copy the ZIP file to an Internet connected machine where you installed either Workbench or Workbench
Toolsuite. The ZIP can be large – 100MB files are common, and several GB files are sometimes generated.
3 Upload the ZIP file to VMware. Using either Workbench or Workbench Toolsuite, in the Dashboard select
Certification Details and Submission Status. Click the first link, for manually submitting a certification.
In the next dialog enter the location of the ZIP file on a local file system.
If the last step does not work, you can use a browser to visit the following URL and upload the ZIP file:
http://partnerweb.vmware.com/cva_results/cert_result_upload.php
VMware, Inc. 37
Chapter 4 Running Test Manager
Entering or Modifying a VMware Waiver Approval IDDuring test selection, you have the option of waiving any tests that are not pre‐certification or
post‐certification tests.
1 From the Test Catalog, right‐click on the test you want to waive.
2 Select Enter/Modify VMware Waiver Approval ID.
When the Test Waiver dialog box displays, type the waiver ID supplied by your VMware representative
and click OK.
3 (Optional) You can remove a waiver by selecting Remove VMware Waiver Approval ID from the
right‐click menu.
The test can now be selected for the test run.
4 (Optional) You can enter a comment by selecting Enter/Modify A Comment from the right‐click menu.
Type a comment in the Add a Comment dialog box that displays. Click OK to add the waiver comment.
5 (Optional) You can remove a comment by selecting Remove a Comment in the right‐click menu.
A waived test cannot be selected for a test run. The waiver ID displays in the Status column. View the
Summary page to see the total number of tests waived in the test run. To see which tests were waived, view
the Test Run Details page.
Email NotificationsTest Manager will send email notifications (using sendmail inside VMware Workbench) to a local email
address based on the configuration of preferences you set. The email notifications include a link to the Test
Manager, which allows you to view the Tests Dashboard remotely.
Email notification is not enabled by default; you must specifically enable it and configure it. Email addresses
that you add must be local. That is, they must be behind your firewall. For example, a VMware employee must
specify email addresses with @vmware.com in them. Test Manager does not attempt to resolve email addresses
outside your own company.
Open the configuration page
1 From the Window menu in Workbench, select Preferences.
2 In the left pane of the Preferences dialog box, expand VMware.
3 Expand Test Manager.
4 Select Notifications.
Configure notifications
1 Select the Enable email notifications check box.
2 (Optional) Select the Enable notifications for sessions in Unit‐Test mode check box.
3 Click Add Email.
The Email Address pop‐up window displays.
4 Type in a local email address and click OK.
5 (Optional) You can remove one or all of the email addresses in the text box.
Highlight an email address and click Remove.
Click Remove All to remove all of the addresses.
6 Select which Notification Events you want to receive.
VMware Workbench Getting Started Guide
38 VMware, Inc.
There are four notification events you can receive: when a test session completes, when a test requires
human intervention, and either when a test fails or when a test completes (when a test passes or fails).
The last two, when a test fails and when a test completes are mutually exclusive. You can’t have both of
them selected at the same time. (The check boxes for these two act like a radio button. That is, when one
is selected, the other one is deselected.)
7 Click Apply and click OK.
You receive email messages from Test Manager for notification events for all test sessions that you run.
You can reconfigure or disable notifications at any time.
Test Manager Command-Line InterfaceThe Test Manager CLI is useful for managing the scripts of Test Sessions that you’ve recorded with the
Workbench UI. The purpose of the recordings is to capture a set of tests, the input they require, and the results
of the tests (pass/fail).
A recording is the superset of tests that can be run from the CLI. You can drop any of the tests from the script,
but you cannot add any new tests from the CLI because you need to capture all the user input events.
Using the CLI, you can modify the Test Session scripts, save them as new sessions, and then run them from the
CLI. You can also run the same recorded tests against a new test session.
See the “Test Manager Command‐Line Interface Reference” on page 39.
Running a Recorded Test Session
If you selected Record Test Session in the Test Progress page when you initially ran the certification session,
a certification record bundle was added to the session. You can replay the entire session from the command
line, and it will run unattended. The name of the CLI is vmwb-tmcli and the first argument must always be
the workspace path. To run a recorded session from the command line, use the following command:
vmwb-tmcli /workspace -s /workspace/TestSessions/<session>.cert -b /workspace/TestSessions/<session>.d/<name of crb file>.crb
A number of conditions are checked prior to running the certification session. If any conditions are violated,
and the force (-f) option was not used, you will be prompted to confirm if you want to continue. If the force
option was used, the application continues without prompting you, but you risk run failures.
For information about the Test Manager Command‐Line Interface, see “Test Manager Command‐Line
Interface Reference” on page 39.
Running Multiple Recorded Test Sessions Simultaneously
The CLI application locks the workspace when performing any operation. This means two things:
You can run a separate instance of the CLI application, but you must use another workspace.
The CLI and the Workbench UI can share the same workspace, but they cannot run at the same time.
Other Use Cases
The following are other use cases for the Test Manager CLI:
“Create a New Test Session” on page 39
“Run a Recorded Test Session” on page 39
“User Prompted when a Dependency Noticed” on page 39
“User Not Prompted when a Failure Noticed (use of ‐f)” on page 39
NOTE The bundle is saved to the root of the cert log directory. The bundle name is
<certtype>‐<timestamp>.crb, where the timestamp format is yyyyMMddHHmmss.

VMware, Inc. 39
Chapter 4 Running Test Manager
Create a New Test Session
The following example creates a new test session:
# vmwb-tmcli /workspace -c <new cert name>.cert -t test -h server1.example.com -u rootUsing /workspace as workspace...Created new session '/workspace/TestSessions/<new cert name>.cert'
Run a Recorded Test Session
# vmwb-tmcli /workspace -b /workspace/TestSessions/test.d/Test-20120418160341.crb -s /workspace/TestSessions/<new cert name>.cert
Using /workspace as workspace...Enter password for 'root' on 'server.example.com' Partial run started...'Test 1' started...'Test 1' completed: passed'Test 2' started...'Test 2' completed: passedPartial run complete
User Prompted when a Dependency Noticed
# vmwb-tmcli /workspace -b /workspace/TestSessions/test.d/Test-20120418160341.crb -s /workspace/TestSessions/<new cert name>.cert -x "Test 1"
Using /workspace as workspace...Test 'Test 2' has dependency 'Test 1' excludedAre you sure you want to continue? [y/n]yPartial run started...'Test 2' started...'Test 2' completed: passedPartial run complete
User Not Prompted when a Failure Noticed (use of -f)
# vmwb-tmcli /workspace -b /workspace/TestSessions/test.d/Test-20120418160341.crb -s /workspace/TestSessions/foo.cert -x "Test 1" -f
Using /workspace as workspace...Partial run started...'Test 2' started...'Test 2' completed: passedPartial run complete
Test Manager Command-Line Interface Reference
The entire Test Manager CLI is listed in the tables that follow. To see the commands and options at the
command line, use the --help command.
Table 4-3. Test Manager CLI Commands
Command Options Description
-l List all of the certification types installed on the system, and the number of hosts required for each.
-c <cert_session_name> -t <type>
-h <host>
-u <user>
Create a new session of the specified type and assign it the host(s) and user values.
-b <bundle> -i List information about the certification record bundle.
-s <cert_session_name> -b <bundle>
[ -x <test-name> ]
[ -f ]
[ -p <password> ]
Run the certification.
VMware Workbench Getting Started Guide
40 VMware, Inc.
Prior to running the certification, the application will perform the following checks:
Verify recordVersion in bundle against .cert XML file.
Verify test dependencies are still satisfied if test are excluded from run.
Verify that all tests to be run have a passed result in the bundle.
Verify that all tests to be run have unattended-ok set to true in the bundle.
If any of these checks fail, the user will be prompted if they want to continue. The application will continue
automatically if the force (-f) option is used, but the user risks run failures.
Test Manager Web ClientWith the Test Manager Web Client, you can view the same certification Test Sessions that are visible in the
Workbench UI. You can perform most operations from either the Workbench UI or the Web Client, such as
opening a test session, checking host status, entering configuration parameters, selecting tests, and running
the Test Session. There is no need for a Test Session to be opened inside the Workbench UI before viewing it in
the Web Client.
When an operation is completed in one location, the other location reflects the changes. For example, you can
create a new certification directly from the Web Client and the Workbench UI shows the new certification in
the Project Navigator.
Before launching the Test Manager Web Client, enable the web server and start the web server in the VMware
Workbench UI.
Enable and Start Web Server
To enable and start the web server perform the following steps:
1 From the Window menu in the Workbench UI select Preferences, then expand VMware and select Web
Server
2 Select the check box labeled Enable web server on start up.
3 Click Start Server.
Launch Test Manager Web Client
To launch the Test Manager Web Client, just point your web browser to the Test Manager in the Workbench
UI. For example, the URL might look like:
<ip-addr>:<port number>/testmanager/testmanager_webclient.html
Table 4-4. Recorded Test Session Options
Options Description
-c <session> Name for new session (will be created in <workspace>/TestSessions project).
-t <type> Certification type (must be one listed when using -l option).
-h <host> Name of host for new session (must be repeated for certification types that require more than one host).
-u <user> Name of user for new session (must be repeated for certification types that require more than one host).
-b <bundle> Path to certification record bundle (.crb) file.
-s <session> Path to session file (must already exist).
-x <test-name> Name of the test to exclude (optional, can be repeated ‐ if not specified all tests in the bundle will run).
-f Force (optional).
-p <password> Host password (optional, can be repeated. The order must match host order in the session file).

VMware, Inc. 41
Chapter 4 Running Test Manager
Importing and Exporting Parameters from a FileYou can import your certification parameters from a file you’ve previously exported from another certification
and moved to your workspace. This allows you to import only those parameters that apply to your specific
certification instead of the whole parameter cache.
Importing Parameters from a Parameter File
1 Open the preference page in Workbench Windows menu. (Windows > Preferences)
2 Expand VMware, and then expand Test Manager.
3 Select Cert Parameters.
4 To import the parameters from a parameter file, click Import From Param File.
5 In the dialog box that opens, browse to the file from which to import the parameters, and click OK.
The list of parameters in the file will be merged into the cache in your workspace.
You can also export your certification parameters to a file in your workspace.
Exporting Parameters to a Parameter File
1 Open the preference page in Workbench Windows menu. (Windows > Preferences)
2 Expand VMware, and then expand Test Manager.
3 Select Cert Parameters.
4 To import the parameters from a parameter file, click Export To Param File.
5 In the dialog box that opens, browse to the file to which to export the parameters, and click OK.
The list of parameters in the file will be added to the file.
Enabling Prefilling from the Parameter CacheA certification session may request a set of configuration parameters that you must enter interactively. The
parameters must be reentered each time the session is run. Test Manager caches these certification parameters
and can be configured to prefill them the next time the session is run. Test Manager saves these parameters in
a local cache in your workspace directory. You can override these prefilled values when you rerun the session.
Cached parameter values for one certification may apply to sessions of another certification type. If the
parameter form is similar, the parameter values will be prefilled.
Enabling Parameter Prefilling
1 Open the preference page in Workbench Windows menu. (Windows > Preferences)
2 Expand VMware, and then expand Test Manager.
3 Select Cert Parameters.
4 Select the check box labeled Enable automatic certification parameter filling.
This check box is a toggle that enables or disables prefilling of certification parameters. Even if disabled,
Test Manager will continue to remember new form parameters, but the parameters in the configuration
parameters form will not be prefilled.
5 Then click Apply and click OK to save the preference.
Importing a Parameter Cache from Another WorkspaceCached parameters from one workspace can be merged into the parameter cache of another workspace.
VMware Workbench Getting Started Guide
42 VMware, Inc.
Importing a Parameter Cache
1 Open the preference page in Workbench Windows menu. (Windows > Preferences)
2 Expand VMware, and then expand Test Manager.
3 Select Cert Parameters.
4 To import the cache from another workspace, click Import From Workspace.
5 Select the file folder where the workspace cache is located and click OK.
The cache is merged with the cache in your current workspace.
Time Management Help for Long Running TestsBecause some of the certifications can run for a long time, you might want to let them run unattended. To help
facilitate running the tests unattended, you can configure preferences such that Test Manager sends email
notifications to you for various test session events. You could leave the room, knowing that you will receive an
email notification when the test session ends, or if it needs human intervention. For more information, see
“Email Notifications” on page 37 and “Tests Dashboard” on page 28.
Alternately, to save time, you can split your certification tests into multiple sessions that can run in parallel.
You can use this feature if two conditions are met: the test suite must allow it, and you must have multiple
equivalent hosts on which to run the certification tests.
After the tests run to completion, the test sessions are merged into one new merged session from which you
submit the certification. For more information on how to split your certification tests and later merge them for
submission, see “Splitting Certification Tests into Multiple Sessions” on page 42 and “Merging Split Sessions
into One New Merged Session” on page 43.
Splitting Certification Tests into Multiple SessionsTo speed running your certification tests, if the test suite allows merging of test sessions, you can split the tests
into multiple test sessions that can be run concurrently. Because Test Manager requires all tests to be run on
the same host, when you merge the sessions, the Merge Existing Certifications wizard performs equivalency
tests on the hosts to ensure that all hosts or sets of hosts being used for the multiple sessions are equivalent.
Tips for Creating Target Hosts for Multiple Sessions in Installation Helper
Run Installation Helper as usual to create your testbeds.
Decide how many test sessions you want to use for this certification and create the same number and type
of target hosts for each test session.
When selecting target hosts for your test sessions, make sure they are equivalent for each session.
For help with the Installation Helper, see the VMware Workbench Installation Helper Guide.
Create Multiple Test Sessions
1 In the Test Manager, create multiple test sessions of the same type.
2 Select a subset of tests to assign to each session, such that all tests are covered.
3 Run the test sessions concurrently.
For information about how to create a test session, choose tests for it, and then run it, see “Starting a New Test
Session” on page 29, and “Setting Up and Running the New Test Session” on page 30.

VMware, Inc. 43
Chapter 4 Running Test Manager
Merging Split Sessions into One New Merged SessionAfter all the test sessions in your multiple‐session certification have successfully completed, and you are ready
to submit the certification, you must merge all the sessions by creating a new merged session. Test Manager
will collect the support bundles from the targets used in each of the original sessions into the new merged
session. You use the new merged session to submit your certification to VMware.
Merge Test Sessions
1 To open the merge wizard, right‐click in the Test Sessions pane and select Import > VMware > Merge
Existing Certifications.
If none of the installed certifications support this feature, a message at the top of the wizard window
states:
There are no certification types installed that support merging.
2 In the Select Merge Leader Session page, select the test category from the Category, the Session Type, and
the Certification Session for the merge leader session, and click Next.
3 In the Select Additional Sessions page, select the additional sessions to be merged from the Certification
Sessions list, and click Next.
4 In the New Certification Session page, fill in the Project name and Session name for the new merged
session, and click Next.
5 In the Summary page, review the selections, and click Finish if everything is correct.
6 A confirmation pop‐up window asks whether you want to continue.
If you reply OK, Test Manager runs the equivalency tests on each of the selected test sessions to verify that
the hosts are identical in each session and then gathers all of the support bundles from each session. This
can take several minutes.
If you reply Cancel, then the Merge Existing Certifications wizard exits without saving the new merged
session and without having gathered any results. You will have to start over again when you have time to
wait for the results to be gathered.
If you replied OK, and the merge completes without error, you can proceed to submit your certification
using the new merged session as if you had run the certification as a single session. For information on
submitting your certification bundle, see “Generating a Results Package” on page 34 and subsequent
sections.
You can rerun all the tests together as one test session by selecting the new merged session and running
it. For information on rerunning test sessions, see “Running an Existing Test Session” on page 33.
Recreating a Test Session by Importing Test Results from Previous RunIf you lose a .cert file or it becomes corrupted, but you still have the directory where the log files are kept,
you can restore the results of previous runs without having to recreate the certification session and rerun the
tests. The log files are stored in the testname.d directory.
You can re‐run all or part of the tests. For example, if the system went down while the certification was
running, you can use the logs to restore the results from the tests that ran successfully, and then you can restart
the certification, selecting only the tests that did not complete. This can save substantial amounts of time over
rerunning the entire certification.

VMware Workbench Getting Started Guide
44 VMware, Inc.
Import previous results
1 Create a new test session with exactly the same name, same category and same type as the one that you
lost.
When Test Manager finds a .d directory with the same name as the new certification, it displays the
Import Previous Results dialog. For example, if your test session was named new_cert.d, you might see
the following dialog box:
2 Click Yes to have Test Manager read the log files from the .d directory.
3 On the Host Selection page, reenter the IP addresses of the target hosts used to run the certification in the
Test Manager editor, and click Next.
4 Click Next until you get to the Test Selection page.
You must keep the same configuration and data as used in the last test run.
5 (Optional) Select the tests you want to rerun from the Test Selection page, and click Next.
If you want to rerun some of the tests, you can select them while keeping the results of the other tests from
the previous run.
6 (Optional) If you are rerunning some tests, click Run Test Session or Run Unattended in the Test Progress
page; when the tests complete, click Next.
7 At the Session Summary page, you can upload the results for submission to VMware.
For information on how to generate and submit results to VMware, see “Generating a Results Package” on
page 34.
Verifying Remote Installation Before You Submit Your VIB to VMwareTest your module before submitting it to VMware for certification. As a best practice:
Install your VIB using esxcli software vib install. For more information, refer to the esxcli
documentation.
Make sure your VIB will also deploy successfully using the vCenter Update Manager (VUM). For
complete instructions on using vCenter Update Manager, see the vCenter Update Manager
documentation.
Before submitting your VIB to VMware for certification, as a best practice, make sure it will deploy
successfully using vSphere Update Manager (VUM).
Install Your Module Using vCenter Update Manager
Use the following steps to install your module using VUM:
1 Install and configure VUM, according to VMware instructions.
2 Import the offline bundle you created for your module into the VUM package repository by selecting the
“Import Patches” option and browsing to the bundle.
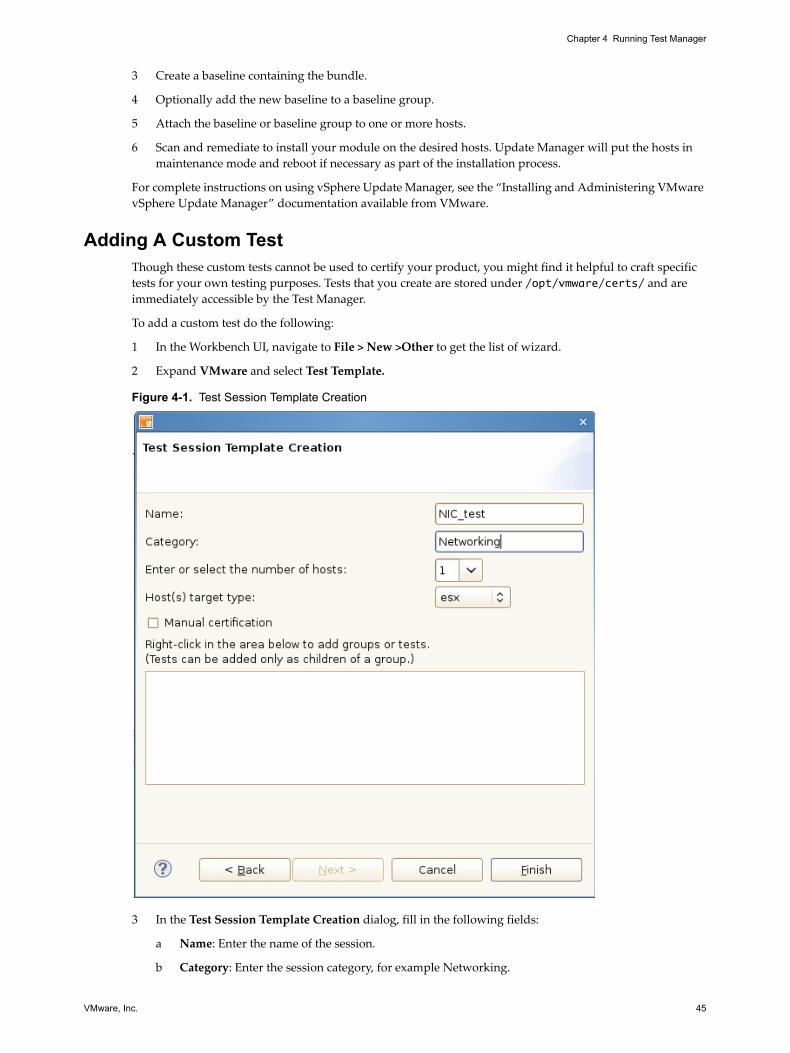
VMware, Inc. 45
Chapter 4 Running Test Manager
3 Create a baseline containing the bundle.
4 Optionally add the new baseline to a baseline group.
5 Attach the baseline or baseline group to one or more hosts.
6 Scan and remediate to install your module on the desired hosts. Update Manager will put the hosts in
maintenance mode and reboot if necessary as part of the installation process.
For complete instructions on using vSphere Update Manager, see the “Installing and Administering VMware
vSphere Update Manager” documentation available from VMware.
Adding A Custom TestThough these custom tests cannot be used to certify your product, you might find it helpful to craft specific
tests for your own testing purposes. Tests that you create are stored under /opt/vmware/certs/ and are immediately accessible by the Test Manager.
To add a custom test do the following:
1 In the Workbench UI, navigate to File > New >Other to get the list of wizard.
2 Expand VMware and select Test Template.
Figure 4-1. Test Session Template Creation
3 In the Test Session Template Creation dialog, fill in the following fields:
a Name: Enter the name of the session.
b Category: Enter the session category, for example Networking.
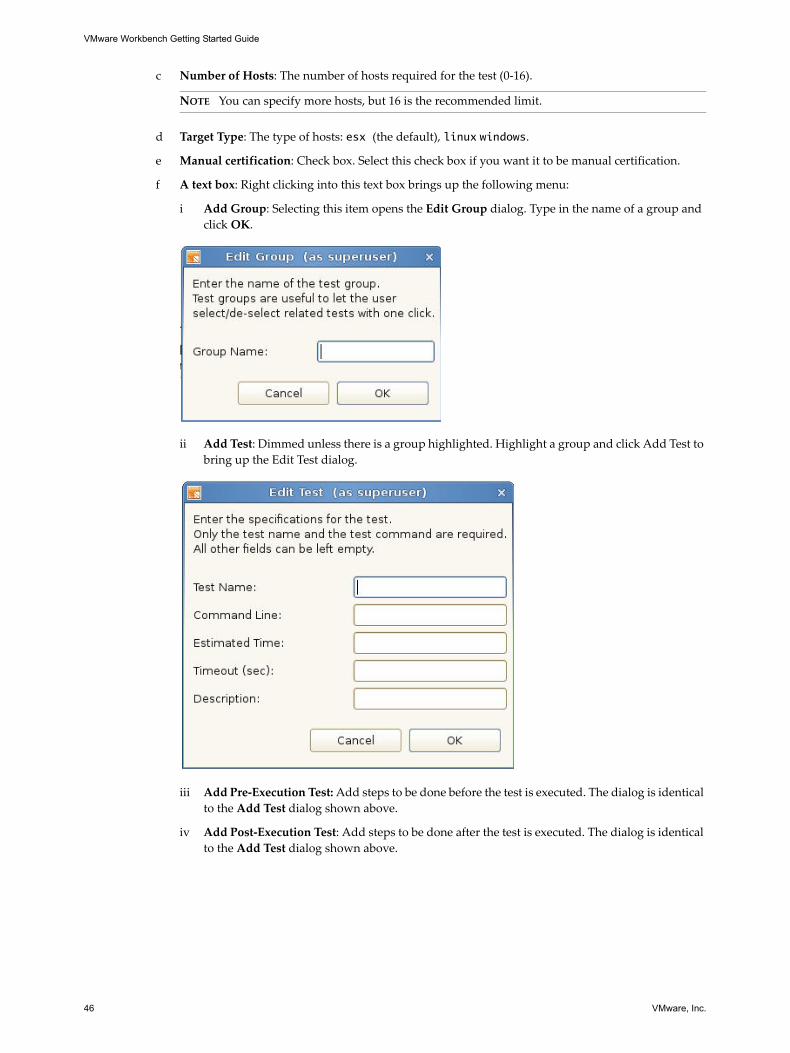
VMware Workbench Getting Started Guide
46 VMware, Inc.
c Number of Hosts: The number of hosts required for the test (0‐16).
d Target Type: The type of hosts: esx (the default), linux windows.
e Manual certification: Check box. Select this check box if you want it to be manual certification.
f A text box: Right clicking into this text box brings up the following menu:
i Add Group: Selecting this item opens the Edit Group dialog. Type in the name of a group and
click OK.
ii Add Test: Dimmed unless there is a group highlighted. Highlight a group and click Add Test to
bring up the Edit Test dialog.
iii Add Pre‐Execution Test: Add steps to be done before the test is executed. The dialog is identical
to the Add Test dialog shown above.
iv Add Post‐Execution Test: Add steps to be done after the test is executed. The dialog is identical
to the Add Test dialog shown above.
NOTE You can specify more hosts, but 16 is the recommended limit.
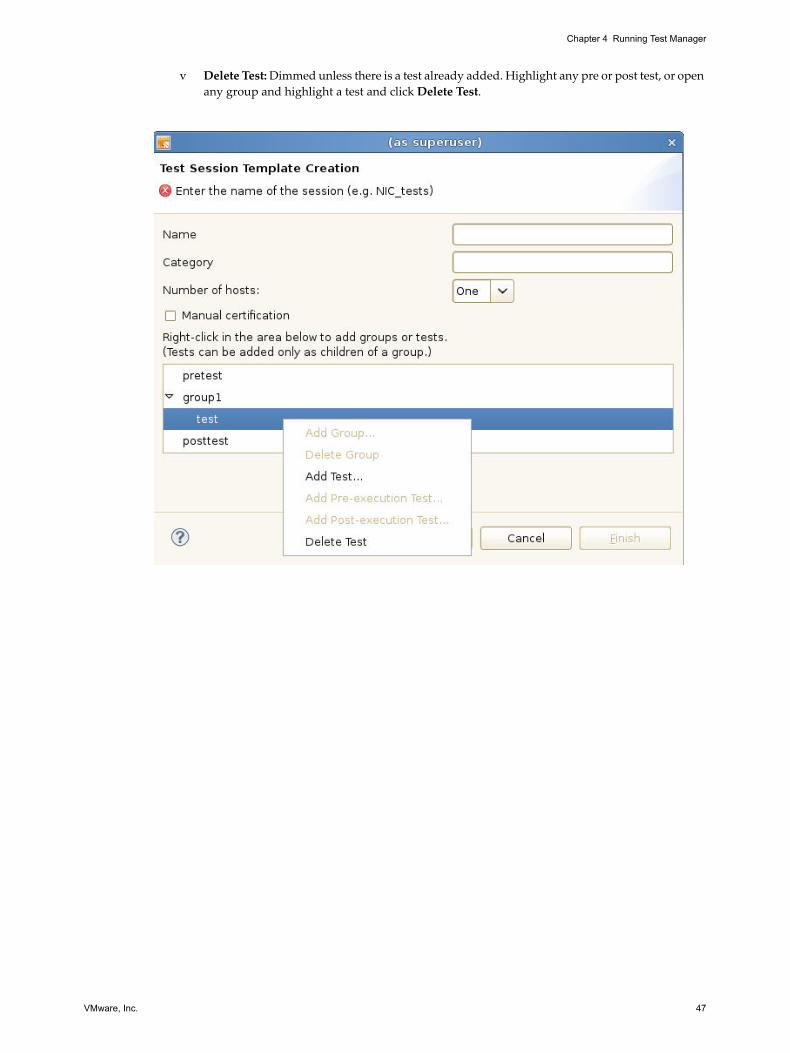
VMware, Inc. 47
Chapter 4 Running Test Manager
v Delete Test: Dimmed unless there is a test already added. Highlight any pre or post test, or open
any group and highlight a test and click Delete Test.

VMware Workbench Getting Started Guide
48 VMware, Inc.
vi Delete Group: Dimmed unless there is a group to delete. To delete a group, highlight the group,
right click in the box and click Delete group. You can delete the group even if there is a test inside
it. No need to remove the test first. The test is lost.
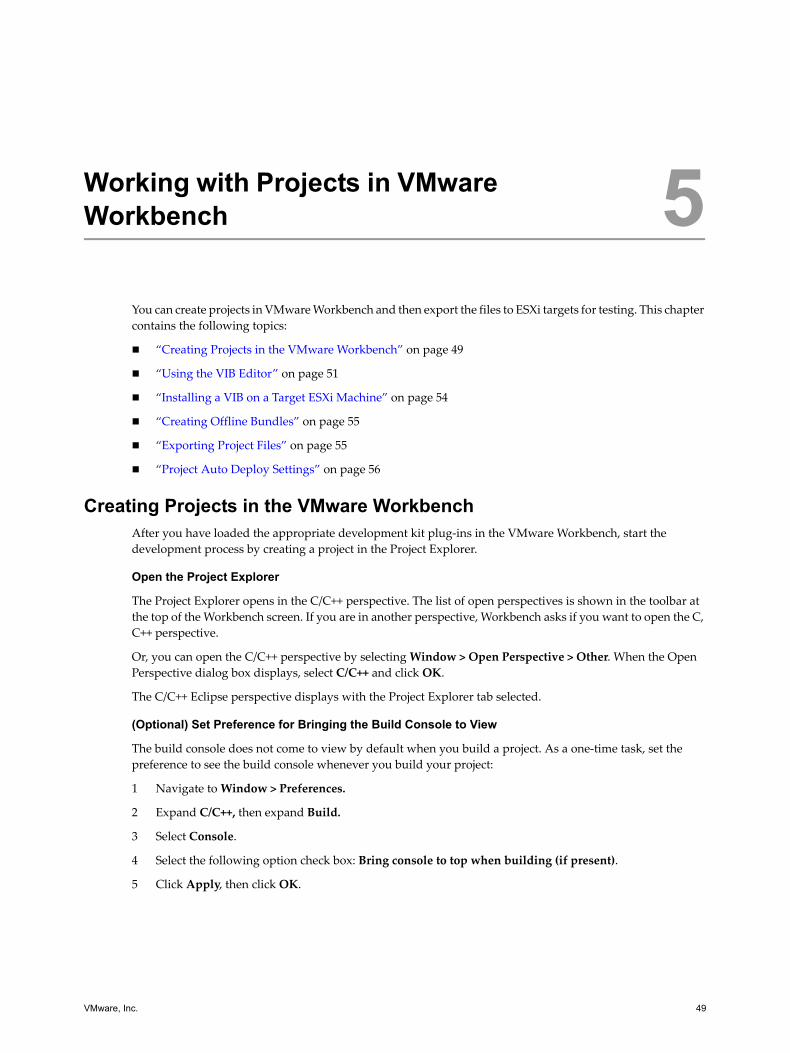
VMware, Inc. 49
5
You can create projects in VMware Workbench and then export the files to ESXi targets for testing. This chapter
contains the following topics:
“Creating Projects in the VMware Workbench” on page 49
“Using the VIB Editor” on page 51
“Installing a VIB on a Target ESXi Machine” on page 54
“Creating Offline Bundles” on page 55
“Exporting Project Files” on page 55
“Project Auto Deploy Settings” on page 56
Creating Projects in the VMware WorkbenchAfter you have loaded the appropriate development kit plug‐ins in the VMware Workbench, start the
development process by creating a project in the Project Explorer.
Open the Project Explorer
The Project Explorer opens in the C/C++ perspective. The list of open perspectives is shown in the toolbar at
the top of the Workbench screen. If you are in another perspective, Workbench asks if you want to open the C,
C++ perspective.
Or, you can open the C/C++ perspective by selecting Window > Open Perspective > Other. When the Open
Perspective dialog box displays, select C/C++ and click OK.
The C/C++ Eclipse perspective displays with the Project Explorer tab selected.
(Optional) Set Preference for Bringing the Build Console to View
The build console does not come to view by default when you build a project. As a one‐time task, set the
preference to see the build console whenever you build your project:
1 Navigate to Window > Preferences.
2 Expand C/C++, then expand Build.
3 Select Console.
4 Select the following option check box: Bring console to top when building (if present).
5 Click Apply, then click OK.
Working with Projects in VMware Workbench 5

VMware Workbench Getting Started Guide
50 VMware, Inc.
Create a project
1 Right‐click in the Project Explorer and select New VMware Project/File > Development Kit Projects.
The VMware new project wizard dialog box displays. Expand the project type you want to develop from
the list of Available project types.
You can create a project from samples, which includes the infrastructure files needed for building and
debugging. In some development packages, you can create a new project that does not have the sample
code included (skeleton projects).
2 Expand the sample or new project type to reveal the available project types.
3 Select a project type and click Next.
A dialog box displays for creating the project.
4 Type a name for the project.
5 (Optional) If the Create default xml files for VIB package check box is active, you can choose to have a
VIB created and populated with default values by selecting the check box and clicking Next.
Some development kits do not create VIBs at project creation, and for those development kits, the check
box will be dimmed and inactive, or just not present.
If the check box is active but not selected and you do not select it, or it is selected and you deselect it, no
VIB is built when the project is created. To create the VIB later, see “Using the VIB Editor” on page 51.
6 The Project Information page displays various details about the project. The page is populated with
default values, but you can customize it by editing the fields.
If you selected Create default xml files for VIB package, click Next when you are finished editing the
project information.
If you did not select the Create default xml files for VIB package check box, the Next button is
unavailable and you are taken to the VIB Information page. This is your only opportunity to change the
values of your VIB information in the Workbench UI.
7 (Optional) If you selected Create default xml files for VIB package, the VIB Information page displays.
The VIB fields are populated with default values, which you can customize by editing the fields.
One of the options for the VIB Information is the Live install flag. When Live install is set to true, firewall
rules are automatically reloaded after the VIB is installed.
8 Click Finish.
The new project shows in the Project Explorer tab in the left pane. Expanding the project displays a list of
folders created for the project. If you selected Create default xml files for VIB package, a VIB is created
for your project. Otherwise, you can build a VIB in a separate step (see “Using the VIB Editor” on page 51).
9 To build the project, right‐click on the project name, and select Build Project.
You must build the project before you can build a VIB.
CAUTION To work with the VMware Update Manager (VUM), you cannot have both Live Install and
MaintenanceMode set to false. VUM will throw an error if both are set to false.
NOTE To see the build progress, make sure the correct preferences are selected in order to bring the Build
view to the front. Navigate to Window > Preferences, then expand the C/C++ preference, expand the
Build preference, and click Console. Make sure that both the Open console when building and the Bring
console to top when building (if present) check boxes are selected. Click OK to save the preferences.
VMware, Inc. 51
Chapter 5 Working with Projects in VMware Workbench
Using the VIB EditorYou can create a VIB for a project that does not have one, or update an existing VIB using the VIB Editor. A VIB
package can be built with release objects or debug objects. If you deploy a VIB with debug objects, deploy it to
a host installed with a debug build of ESXi.
For details on creating VIBs for individual development kits, refer to the appropriate Developer’s Guide for
that development kit in the Help Contents.
For CIM PDK
For CIM PDK release builds
You can create a build with release objects two ways:
1 With your project highlighted in the Project Explorer, select VIB Package (release) from the right‐click
menu.
The VIB is built with default values, but with release objects.
2 With your project highlighted in the Project Explorer, select Create/Edit VIB xml from the right‐click
menu.
The VIB Editor view displays.
a Edit the fields.
For CIM PDK, select release as the VIB Build Type.
b Click Build VIB Package.
In addition, using a file editor of your choice, you can edit the VIB XML files that were created when the project
was first built.
For CIM PDK debug builds
You can create a build with debug objects two ways:
1 With your project highlighted in the Project Explorer, select VIB Package (debug) from the right‐click
menu.
The VIB is built with default values, but with debug objects.
2 With your project highlighted in the Project Explorer, select Create/Edit VIB xml from the right‐click
menu.
The VIB Editor view displays.
a In the VIB Editor, select debug as the VIB Build Type.
b Click Build VIB Package.
For information on how to debug your CIM Provider, see the CIM Provider Development Kit (CIM PDK) Guide
found in the Workbench Help Contents.
IMPORTANT VMKAPIDDK and DDK projects to not use the VIB Editor. Modify the <project name>.sc file and Makefile to configure the VIB package. For more information, refer to the VMware VMK API Device Driver
Development for ESXi guide, or the VMware Device Driver Development Kit Guide.

VMware Workbench Getting Started Guide
52 VMware, Inc.
For Host Extensions
For Host Extensions release builds
You can create a build with release objects two ways:
1 With your project highlighted in the Project Explorer, select VIB Package from the right‐click menu.
The VIB is built with default values, but with release objects.
2 With your project highlighted in the Project Explorer, select Create/Edit VIB xml from the right‐click
menu.
The VIB Editor view displays.
a Edit the fields.
For CIM PDK, select release as the VIB Build Type.
b Click Build VIB Package.
For Host Extensions debugging
There is no debug build for Host Extension plug‐ins. For information on debugging a Host Extension plug‐in,
see “Debugging a Live Host Extensions Module” on page 76 and see the VMware Host Extensions Developer’s
Guide.
For KMDK-Based Development Kits (PSA and VDS)
For release builds
1 With your project highlighted in the Project Explorer, select Create/Edit VIB xml from the right‐click
menu.
The VIB Editor view displays.
2 Edit the fields.
For example, select release as the VIB Build Type.
3 Click Build VIB Package.
Optionally, outside the Workbench UI, you can edit the VIB XML files created when the project was first built
using a file editor of your choice.
For debug builds
You can get a debug build in two ways:
1 With your project highlighted in the Project Explorer, select Build package with debug module from the
right‐click menu.
The VIB is built with debug objects. Since you do not certify with a debug build, the VIB File Generation
dialog box does not display; default values are used.
2 From the VIB Editor, select debug as the VIB Build Type.
a With your project highlighted in the Project Explorer, select Create/Edit VIB xml from the right‐click
menu.
The VIB Editor view displays.
b Select debug as the VIB Build Type.
c Click Build VIB Package.
Tips for VIB Fields
There are several details you should be aware of when working with the VIB Editor.
VMware, Inc. 53
Chapter 5 Working with Projects in VMware Workbench
There are multiple tabs at the bottom of the VIB Editor view:
VIB Editor – The main tab where most information can be edited.
Clicking any of the relationship links (Depends, Conflicts, Replaces, Provides, CompatibleWith) or
the Software Platform link takes you to a tab for editing the values.
Relationships – Tab that allows you to specify relationships such as depends and provides.
descriptor.xml – Tab that allows you to edit the descriptor.xml file directly.
Bulletin Input – Tab that allows you to edit the bulletin using a UI interface.
Platforms – Tab that allows you specify the software platforms to which this software applies.
bulletin.xml – Tab that allows you to edit the bulletin.xml file directly.
The default VIB Build Type is release. For debugging purposes, select debug as the VIB Build Type.
If you choose to create a debug build, deploy this VIB to a host with a debug build of ESXi 5.5 installed,
not a release build of ESXi 5.5.
The LiveInstall flag is set to true by default. To set it to false, deselect the Live install allowed check box.
The LiveRemove flag is set to true by default. To set it to false, deselect the Live remove allowed check box.
You can enable maintenance mode by selecting the Enable Maintenance mode check box.
For CIM projects, if you are doing a live install, the Restart CIMOM check box should be selected (it is the
default).
The live install process does not automatically restart the CIMOM unless this is selected.
Select the Stateless Ready check box if you are confident that your module functions properly in a
stateless environment. That is, it does not require state information, or you have provided a host profile
to collect and save the required state information. An ESXi host must be able to reboot at will and not have
to save anything, and your state data cannot be recorded in a local file system.
One relatively easy way to test that your module is stateless ready is to follow the procedures in the “Auto
Deploy Proof of Concept Setup” and “Testing Stateless Readiness with Auto Deploy” sections in the
vSphere Installation and Setup manual at www.vmware.com/support/pubs.
Specifying Dependencies in the VIB Editor
The ESXi VIB database specifies various functions, APIs, or features that are provided by ESXi using provides tags. If the item you are packaging in a VIB depends on specific features provided by the base ESXi installation,
add a depends constraint to your VIB for each of those features.
To find out which functions, APIs, or features are provided by the ESXi base installation, run the following
command on an ESXi machine:
esxcli software vib get -n esx-base | grep Provides:
NOTE If you don’t see one of the tabs in the VIB Editor, look in the Project Explorer under your
project name and double click the file name. That will open the file in the VIB Editor.
NOTE Just as with a regular install and reboot, firewall settings are automatically reloaded upon
completion of a live install.
CAUTION If you are using VUM to install your VIB package, you cannot set both MaintenanceMode and LiveInstall to false. VUM will throw an error.

VMware Workbench Getting Started Guide
54 VMware, Inc.
If you are providing a separately bundled library or tools package that your development‐kit‐generated
module will depend on, make sure that these separate bundles have the necessary “provides” tags. Enter
“provides” constraints in the separate bundles, and use a corresponding “depends” constraint for each bundle
in your development‐kit‐generated module.
Enter a depends constraint
1 Open the VIB Editor by highlighting your Workbench project and right‐clicking Create/Edit VIB xml.
2 Select the Relationships tab and expand relationships.
3 Right‐click depends, and select Add constraint.
4 Expand depends, select the constraint, and fill in the constraint Properties.
Refer to the provides tags gathered from the ESXi machine for the information to enter in the name,
relation and version fields.
5 (Optional) Add other constraints as necessary by right‐clicking on depends.
6 Save the changes. (File > Save)
Installing a VIB on a Target ESXi MachineAfter creating a project, and building a VIB, you can install the VIB on a target ESXi machine. You can reach
the installation wizard from either the Project Explorer, or the Remote System Explorer right‐click menu.
Install the VIB
1 Highlight the VIB you wish to install in the Project Explorer.
For kernel modules and host extensions modules, the VIB is located in the following directory:
<project_name>/build/
For CIM providers, the VIB is located in the following directory:
<project_name>/build/obj/esx/staging/
For device drivers, the VIB is located in the following directory:
<project_name>/build/vib/
2 In the right‐click menu, select Install Package.
The Install Wizard displays.
3 Select the check box next to the target ESXi host.
You can install the package on multiple ESXi targets. If you have more than one ESXi target defined, you
can select any or all of them and the install wizard will install the package on each in succession.
If you are not already connected to an ESXi target, click Add Target to display the New Connection dialog
box. For instructions on how to use the New Connection dialog box to connect to an ESXi, see “Add an
ESXi Server” on page 60.
4 Click Next.
The VIB is copied to the remote system under /tmp and automatically installed.
If the module fails to install, make sure you are installing a later version than is already installed on the
ESXi machine. Check the kernel logs for detailed messages to help isolate the problem.
5 Click Install.
A pop‐up window informs you that once installation of the VIB starts, you cannot cancel the operation.
Click OK to continue.
IMPORTANT This section gives generic instructions on how the interface works. Refer to the appropriate
development kit guides for specific instructions on installing your modules.
VMware, Inc. 55
Chapter 5 Working with Projects in VMware Workbench
Installation progress and status is written to the text box.
When you created the VIB, you had the opportunity to choose whether to do a live install. If you chose a
live install, then at installation, the ESXi machine is automatically restarted and the VIB payload is loaded.
6 When the installation is complete, the Installation Result displays. Click Next.
The Installation Summary page appears.
7 (Optional) If you did not choose live install, then you can reboot the machine now or wait until a later
time. To reboot now, select the box with the name of the ESXi host.
8 Click Finish.
9 (Optional) Verify that the module loaded.
Launch a terminal by right‐clicking Ssh Terminals under the ESXi connection in the Remote Systems
Explorer. Select Launch Terminal.
At the command line, type the following command:
# esxcli system module list | grep <module-name>
For example for a vStorage module, you might see the following, where you get the module name,
followed by true/false twice. The first for it is loaded and the second for if it is enabled: The the example
that follows, the module is loaded and enabled.
# esxcli system module list | grep satp-examplesatp-example true true
For Userworld Applications Only: VIBs Developed for Live Install/Upgrade
If you develop Userworld application VIBs for live install/upgrade and you change the host state or
configuration using non‐esxcli commands, then you will have to manually refresh the hostd cache for the particular subsystems involved. That is, you have to manually refresh the cache if you use esxcfg commands,
a custom esxcli extension, or any command outside of the built‐in esxcli commands. If you use esxcli commands, hostd will be able to refresh its caches automatically.
To refresh the hostd caches manually, use one or more of the following commands, depending on what you
need to refresh:
vim-cmd hostsvc/refresh_firewallvim-cmd hostsvc/refresh_servicesvim-cmd hostsvc/storage/refreshvim-cmd hostsvc/net/refreshvim-cmd hostsvc/datastore/refresh
Creating Offline BundlesWhen you create a project, if Project > Build Automatically is selected, or when you click the Build VIB
Package button in the VIB Editor, an offline bundle is created. Bundle contents can be found in the following
project directory:
<project name>/build/bundle/
For further information about offline bundles for your project type, see the documentation for your specific
development kit. Also, see the VIB Tools Guide in the Help Contents.
Exporting Project FilesYou can export project files to ESXi targets using the Remote File Deploy export wizard.
NOTE If you explicitly rebooted or did a live install and it restarted automatically, the connection you had
to the ESXi host will be broken, and you will have to reconnect using the RSE. For instructions on
connecting to a remote host, see “Connecting to an ESXi Server” on page 60.

VMware Workbench Getting Started Guide
56 VMware, Inc.
Export project files
1 With your project highlighted in the Project Explorer, right‐click to open the Export dialog box.
2 Expand VMware and select Remote File Deploy.
3 In the left pane at the top, select the project to export.
4 Select the file or files to be exported.
You can filter for a specific file type to select by clicking Filter Types and selecting the suffix. You can also
select all the files displayed by clicking Select All, or deselect all the files displayed by clicking
Deselect All.
5 Type in the target location for the files, for example: <esxi-host-name>:/root/vib, or click Browse to select a target machine and file path.
6 Select either Create Directory structure for files to create the directories from the top of the project, or
Create only selected directories to create only the directories necessary for the selected files.
7 Type in a name for the new operation and click Save to create the operation, and click Finish to perform
the operation and close the dialog box.
The operation executes and the files are copied to the ESXi machine. The operation is saved in the
Workspace with the name you gave it for future reuse.
Project Auto Deploy SettingsAfter creating and building a project, you can create auto deploy file operations that will be executed after
every build. You can deploy your project files, and execute other commands on the ESXi machine using these
operations.
Create auto deploy operations
1 In the Project Explorer, right‐click on the project name and select Properties.
2 In the Properties dialog box, select Auto Deploy Settings.
3 Click New to bring up the Export Settings dialog.
4 Expand your project name in the left pane.
The file names display in the right pane.
5 In the right pane, select the files to deploy.
You can filter for a specific file type to select by clicking Filter Types and selecting the suffix. You can also
select all the files displayed by clicking Select All, or deselect all the files displayed by clicking
Deselect All.
6 Type in the target location for the files, for example: <esxi-host-name>:/root/vib, or click Browse to select a target machine and file path.
7 Select either Create Directory structure for files to create the directories from the top of the project, or
Create only selected directories to create only the directories necessary for the selected files.
8 Type in the name for this deploy operation.
9 Click Save and click Cancel or Finish.
The operation is saved and displays in the list of available operations.
10 Select one or more operations and click Select to put them into the After build list.
IMPORTANT See the VIB Suite documentation for a list of allowed directories where your files can be
installed. Do not install your binaries to /sbin, which is a restricted directory.
VMware, Inc. 57
Chapter 5 Working with Projects in VMware Workbench
11 (Optional) You can reorder the operations in the After build list by selecting an operation and clicking UP
or DOWN.
12 Click Apply and click OK when you are finished.
These operations will then be executed after every build.
Recall and alter an existing operation
Operations you have already named and saved can be recalled and redefined.
1 In the Save/restore deploy operation section of the Export Settings dialog, click the drop‐down menu.
2 Select one of the named operations in the list and click Restore.
3 Select the new files you want to put in this deploy operation and select the new target location, if desired.
4 Click Save.
A new set of files is now associated with the named operation.
Move operations from the After build list
1 In the Project Explorer, right‐click on the project name and select Properties.
2 In the Properties dialog box, select Auto Deploy Settings.
3 In the After build list, select the operation to remove and click Deselect.
The operation is removed from the After build list, but is available to be selected at a later time.
4 Click Apply to save the setting and click OK to close the dialog box.
Remove operations permanently from the list of available operations
1 In the Project Explorer, right‐click on the project name and select Properties.
2 In the Properties dialog box, select Auto Deploy Settings.
3 Select the operation you wish to remove and click Remove.
4 Click Apply to save the change and click OK to close the dialog box.
Add Pre- and Post-Deploy Commands to an Auto Deploy Operation
1 In the Project Explorer, right‐click on the project name and select Properties.
2 In the Properties dialog box, select Auto Deploy Settings.
3 Select the operation and click Edit.
4 The Deploy Commands dialog displays.
Edit existing commands or add pre‐ and post‐deploy commands to the deploy operation. Each command
works as an individual shell process.
5 Click Finish when you are done editing the operation.
6 Click Apply and click OK to close the dialog.

VMware Workbench Getting Started Guide
58 VMware, Inc.
VMware, Inc. 59
6
The Remote System Explorer (RSE) is an Eclipse plug‐in for connecting to and performing operations on
remote systems. VMware has extended the standard RSE tool to connect to remote servers. This chapter
contains the following sections:
“RSE Functions” on page 59
“Configuring SSH on Your Target Machine” on page 59
“Accessing the RSE” on page 60
“Connecting to Windows Machines and Virtual Centers” on page 60
“Connecting to an ESXi Server” on page 60
“Properties and Details For ESXi Servers” on page 61
“Launching SSH Terminals” on page 65
“Configuring SSH Services on an ESXi Host” on page 65
“Managing Packages on an ESXi Host” on page 66
“Monitoring Server Logs” on page 67
“Installing VIB Packages on the Remote System” on page 67
“Managing Passwords” on page 67
RSE FunctionsYou can use the ESXi connections that you create in RSE to do the following functions:
Transfer files between your local system and a remote system.
Run commands on the remote system.
Install and deploy VIB packages on the remote system
Test your module before certification
Run certification tests
Configuring SSH on Your Target MachineTo ensure that SSH is configured properly to work with RSE, do the following:
1 Make sure that SSH is enabled on the target machine.
SSH is not enabled by default on a hardened SLES11 SP3 VM.
a In a terminal window on the target machine, log in as root.
b Start SSH.
Using the Remote System Explorer 6
VMware Workbench Getting Started Guide
60 VMware, Inc.
service sshd start
2 For hardened SSH servers, change or add configure parameters.
Default values for a hardened SSH server (sshd) may be different than on other non hardened servers.
Change the SSH configuration file to contain the following configuration parameters.
a Change to the location for the configuration file. The Linux configuration file is located at:
/etc/ssh/sshd_config
b Add or change to the following values:
MaxSessions 20AllowTcpForwarding yes
Accessing the RSEWhen you open the Project Explorer by selecting Develop Your ESXi <Module Type>, in the development kit
menu, VMware Workbench also opens the RSE.
To explicitly open the RSE in VMware Workbench, perform one of the following:
Select Window > Open Perspective >Remote System Explorer.
Select Window > Show View > Remote Systems.
Connecting to Windows Machines and Virtual CentersIn the RSE New Connection wizard, you can choose to make remote connections to Windows machines and
Window Virtual Centers. The process is essentially the same as with ESXi servers as explained in sections of
this document that follow, but you must use Windows login credentials.
Connecting to an ESXi ServerYou need to connect to ESXi servers for testing and debugging purposes. Use the RSE to add server
connections to your VMware Workbench session. If you have not already added the ESXi machine to your list
of remote hosts, add it now. If you already have the ESXi machine added to the RSE, you must connect to it
before you can install modules.
Add an ESXi Server
1 Display the New Connection dialog box.
With the RSE open in the VMware Workbench, right‐click inside the Remote Systems pane and select
New > Connection from the menu. (If it is the first time you’ve opened the RSE, and nothing is already
selected, the right‐click menu will have only two selections: New Connection and Import Connections.
2 Select ESX from the list of system types and click Next.
You can filter your choices by typing ESX in the System type text box before selecting ESX in the list.
3 If the Parent profile drop‐down menu has more than one choice, select the profile to use.
4 Supply the host name or IP address in the Host Name text box, or choose one of the ESXi hosts in the
drop‐down menu (if present).
If you are creating a new connection to a host that is not in the drop‐down menu, the Next button becomes
available. (Click Next to view the messages.)
5 (Optional) Type in a name in the Connection name text box, if you want it to be different than the host
name.
IMPORTANT For Windows Server 2008, the Datastore daemon is not installed by default. You must install it
on your Windows system and have it running before the RSE can connect to it successfully.
VMware, Inc. 61
Chapter 6 Using the Remote System Explorer
6 (Optional) Type in a description of the ESXi host in the Description text box.
7 Select or deselect the Verify host name check box.
The check box is selected by default. When selected, it checks to see if the host name is a valid name.
8 (Optional) Type in a User Name and Password in the text boxes.
The root user name is the default. You can manage user names and passwords in the Preferences dialog
box. See “Managing Passwords” on page 67 for instructions on setting and changing passwords.
9 Select or deselect the Save password check box.
The check box is selected by default.
10 Click Finish.
Start the SSH daemon on your remote system
1 In the Remote System Explorer, right‐click the target ESXi machine, and select VMware > Configure SSH
Service from the menu.
2 In the SSH configuration dialog box, observe the Status.
3 (Optional) If the Status is Stopped, click Start in the Service Commands area and click OK.
Connect to an ESXi server
Once you have added an ESXi machine, you must connect to it. With the remote ESXi host highlighted in the
RSE pane, select Connect from right‐click menu.
Disconnect from an ESXi Server
If you wish to break the connection to one of the ESXi machines, select the ESXi host in the RSE pane and select
Disconnect from the right‐click menu.
Properties and Details For ESXi ServersAfter you have connected to an ESXi server, the Remote Systems navigation tree contains many items of
information about the server. The following sections describe each of the items available for ESXi servers.
Remote Systems Navigation Tree
The Remote Systems navigation tree contains the following items for a connection to an ESXi server.
NOTE If the connection fails with “failed to connect sshd to <the ESXi host>”, the SSH process must be started.
Table 6-1. Remote Systems Navigation Tree Items
Navigation Tree Item Description
File Explorer Expand this item to view the local file system on the remote server.
Ssh Terminals Click this item to create a SSH terminal window to the remote server. See “Launching SSH Terminals” on page 65 for more information.
Resource Explorer List of resources that you can add to the ESXi machine.

VMware Workbench Getting Started Guide
62 VMware, Inc.
Remote Systems Properties
The Properties tab displays information about the currently selected remote system (or Local).
Remote Systems Details
The Remote Systems Details tab displays the status of the connections in the Remote System Explorer. This tab
provides you with an overview of the properties and other information of all connected remote systems. The
columns in this tab correspond to the properties listed in Properties tab for the currently selected remote
system.
Resource Explorer
The Resource Explorer displays resources and their properties for each ESXi connection in the Remote Systems
tab.
Resource Types
The following resource types are listed under every remote system: Virtual Machines, SCSI LUNs, Storage
Adapters, Data Stores, Virtual Switches, Network Adapters. Each resource type can be expanded to show the
list of actual resources found on this ESXi machine.
When you click a resource type, a list of properties and their values show in the Properties tab. If the Properties
tab is not displayed on the UI, you can access the properties by selecting the resource type and selecting
Properties from the right‐click menu.
Table 6-2. Properties for the Items in the Remote Systems Navigation Tree
Property Description
Connection status Connection status of subsystems.
Default User ID User ID specified when the connection to the remote system was established.
Description Description of this connection.
Host name Host name or IP address of the remote system.
Name Name of resource.
Number of children Number of children currently under this parent.
Parent profile Profile that owns this connection.
Remote system type Type of remote host, for example, ESX.
Type Type of resource, such as Connection.
Table 6-3. Remote Systems Details Tab Items
Column Description
Resource Name of the remote system connection.
Parent Profile Parent profile specified when the remote system connection was established.
Remote system Type of remote host, for example, ESX.
Connection status Connection status of subsystems.
Host Name Name or IP address of the remote host.
Default User ID User ID specified when the connection to the remote system was established.
Description Description of this connection.

VMware, Inc. 63
Chapter 6 Using the Remote System Explorer
The Resource Explorer itself has the following properties:
Every resource type has the following properties:
Resources
When you click one of the resources listed under the resource type, a list of properties and values for that
resource displays in the Properties tab. The following is a list of resource types and their properties:
Virtual machines
The Properties tab shows the following properties for each virtual machine on the ESXi host:
SCSI LUNs
Table 6-4. Resource Explorer Properties
Property Value
Connected Yes/No – Answering the question, “Currently connected to this service?”
Name Name of resources, for example, Resource Explorer.
Number of children Number of entries under this resource type.
Port Port to use when connecting to this remote subsystem.
Type Subsystem: Resource Explorer
User ID User ID for connecting to this service, for example, root (Inherited)
Version Version, release and modification of remote system, if available.
Table 6-5. Resource Type Properties
Property Value
Connection‐private Yes/No – Answers the question, “Is this a connection‐private filter pool, which only exists for this connection?”
Name Name of resource type, for example, Virtual Machines.
Number of children Number of resources currently under this resource type.
Number of filter strings
Number of filter strings that are contained in this filter.
Parent filter Filter containing this filter. Not applicable for resource types.
Parent filter pool Filter pool that directly or indirectly contains this filter.
Type The type of resource, for example, Remote system filter.
Table 6-6. Virtual Machines Properties
Property Value
File VMX file location.
Full Name Full resource name in system.
Guest OS Name of guest operating system as it is identified in the system, for example, otherLinuxGuest.
HostName Full host name, for example, host1.server1.example.com. Available only while the host is running.
IP Address Available only while the host is running.
Memory Amount of memory this virtual machine has, in MB.
numCPU Number of CPUs this virtual machine has.
Power Status of virtual machine, either poweredOn, poweredOff, or suspended.
Tools Status VMware tools status.

VMware Workbench Getting Started Guide
64 VMware, Inc.
The Properties tab shows the following properties for each SCSI LUN:
Storage adapters
The Properties tab shows the following properties for each storage adapter:
Datastores
The Properties tab shows the following properties for each datastore:
Virtual switches
The Properties tab shows the following properties for each virtual switch:
In addition, each virtual switch can have multiple port groups assigned to it. Each port group has
properties of its own:
Table 6-7. SCSI LUNs Properties
Property Value
Device ID Identifier for the device, for example, mdx.vrrhoa2:C0:T0:L0.
Device Type Generic term for device type, for example, disk.
Model Vendor’s model number for this device, for example, ST373207LW.
Vendor Name of vendor, for example, SEAGATE.
Table 6-8. Storage Adapters Properties
Property Value
Driver Driver name, for example pata_amd.
Model Model name, for example, AMD 8111 IDE/PATA Controller
PCI PCI identifier, for example, 00:07.1
Status Status information, if available.
Table 6-9. Data Stores Properties
Property Value
Capacity Amount of space in Gigabytes.
Free Size Amount of free space in Gigabytes.
Location Path for this volume, for example, /vmfs/volumes/49b07ab9-2921257e-d158-0030485da766.
Type Type of file system, for example, VMFS.
VMs List of running virtual machines that use this datastore.
Table 6-10. Virtual Switch Properties
Property Value
Free Num Ports Number of available ports on this virtual switch.
MTU Size in bytes of the largest data unit that the switch can pass onwards.
NumPorts Number of total ports.
Uplinks List of vNIC (network adapter) names the virtual switch uplinks to.
Table 6-11. Port Group Properties
Property Value
Uplinks List of uplinks for this port group, for example, [vmnic0].
VMware, Inc. 65
Chapter 6 Using the Remote System Explorer
Network adapters
The Properties tab shows the following properties for each network adapter:
To refresh a node in the Resource Explorer
1 Select a node in the Resource Explorer.
2 Select Refresh in the right‐click menu.
To clear a bad password in the Resource Explorer
If you entered a bad password, select Clear Password in the right‐click menu. Upon next access, the user name
and password dialog box displays.
Launching SSH TerminalsWith SSH enabled, you can launch an SSH terminal by selecting Ssh Terminals and selecting Launch Terminal
from the right‐click menu.
A Terminal tab opens with a command line available for your use for that ESXi connection.
If you added an ESXi host but you can’t open a terminal, it might be a proxy issue. Check your proxy settings.
See “Fixing Proxy Issues” on page 25.
Configuring SSH Services on an ESXi HostTo configure SSH services on an ESXi host, select VMware > Configure SSH Service from the right‐click menu
in the Remote Systems pane. The SSH configuration page displays.
Choose a startup policy
1 Select one of the startup policies: Start automatically, Start and stop with host (the default), Start and
stop manually.
2 Click OK to exit.
Start, stop or restart SSH
1 Click one of the Service Commands buttons: Start, Stop, Restart.
The action is taken on the host immediately. You see the Status change.
2 Click OK to exit.
Used Ports Number of assigned ports in the port group.
VLAN ID The VLAN ID for this port group. Value if no VLAN ID is assigned: 0.
Table 6-12. Network Adapter Properties
Property Value
Driver The name of the driver, for example, tg3.
Duplex Duplex mode, for example, FULL, HALF.
MAC Unique hardware identifier (MAC Address), for example, 00:30:48:5d:a7:66.
PCI PCI identifier, for example, 02:05.0.
Speed Link speed in Megabytes per second, for example, 100 Mbps.
Table 6-11. Port Group Properties (Continued)
Property Value
VMware Workbench Getting Started Guide
66 VMware, Inc.
Managing Packages on an ESXi HostYou can add or remove VIBs, VIBs in an offline bundle, or image profiles to or from an ESXi host using the RSE
Package Manager. To access the Package Manager, highlight the ESXi host in the Remote Explorer pane and
select VMware > Package Manager from the right‐click menu.
The Package Manager displays with a list of the packages installed on the host.
Add a package
1 Click Add to display the Install Wizard.
2 Select the package to install: a VIB package from a local file or URL, a VIB package from a depot or offline
bundle, or an image profile from a depot or offline bundle and click Next.
3 Supply the location of the VIB, offline bundle or image profile.
a For VIBs: In the VIB Location page, specify the local file or URL for the VIB package to install. Click
Browse to find it in the local file system, or click Projects to find it in the Project Explorer.
b For VIBs in an offline bundle: In the Depot Location page, enter a depot URL or offline bundle ZIP
file from a server. Click Browse to find it in the local file system.
The VIB packages available in that depot or offline bundle display.
c For an image profile: In the Depot Location page, enter a depot URL or off‐line bundle ZIP file from
a server. Click Browse to find it in the local file system.
The image profiles available in that depot or offline bundle display.
4 Click Next to display the Install Options page.
5 Select the options for installation and click Next.
6 Click Install to start installation.
If there are errors, they will display in the text box.
7 When the installation completes, click Finish.
The Packages installed on host <host name> list displays with the new package listed.
Remove a package
1 Highlight one or more packages and click Remove.
The Uninstall Wizard displays with a list of the VIB packages to be removed.
2 Select the Uninstall Options and click Next.
3 Click Uninstall.
If there are any errors, they will display in the text box.
4 When the uninstallation completes, click Finish.

VMware, Inc. 67
Chapter 6 Using the Remote System Explorer
Monitoring Server LogsDepending on which version of ESXi you have installed, a different set of logs is available for monitoring:
Monitor a server log
1 In the RSE, highlight an ESXi host.
2 Select VMware > Monitor System Logs from the right‐click menu.
A view opens for the ESXi host logs. A default log displays.
3 To select a different log, use the drop‐down menu.
The log displays. Use the scroll controls to move back and forward through the log.
Installing VIB Packages on the Remote SystemBefore installing a VIB on the remote ESX, make sure that sshd is started on the remote ESX. See “Start the SSH
daemon on your remote system” on page 61.
Install package on remote system
1 To install files on a remote ESXi system, select the system host name in the Remote Systems pane.
2 Right‐click in the pane, and choose VMware > Install Package from the right‐click menu.
A dialog box displays where you specify the name of the VIB to deploy and the ESXi host to deploy it on.
For instructions on installing a VIB, see “Installing Your Test VIB on a Test ESXi Host” on page 90.
Managing PasswordsTo set or change user names and passwords, use the Eclipse Preferences dialog box.
To manage user names and passwords
1 Select Preferences from the Window menu.
2 In the left navigation frame in the Preferences window, expand the Remote Systems menu and select
Passwords.
3 To add a user to any ESXi in the list, click Add.
Table 6-13. ESX/ESXi Logs by Version
ESX/ESXi Version Logs
ESXi 5.0, 5.1and 5.5 /var/log/vmkernel.log
/var/log/hostd.log
/var/log/vpxa.log
ESXi 4.1 /var/log/vmkernel.log
/var/log/hostd.log
/var/log/vmware/vpx/vpxa.log
/var/log/messages
ESX 4.0 and 4.1 Classic
/var/log/vmkernel
/var/log/vmware/hostd.log
/var/log/vmware/vpx/vpxa.log
/var/log/messages
/var/log/vmksummary
/var/log/vmkwarning

VMware Workbench Getting Started Guide
68 VMware, Inc.
In the New Saved Password dialog box, complete the following fields:
a Type in the host name.
b Select ESX from the System type drop‐down menu.
c Type a User ID.
d Type in a password for the new user and verify it by retyping it.
e Click OK.
4 To change a saved password, select a host from the host name list and click Change.
In the Change Saved Password dialog box, type the new password and verify it by retyping it. Click OK.
5 To delete a user name and password, select the entry in the list of existing host names and their user IDs,
and click Remove.
NOTE No confirmation is required before the entry is deleted. Use with caution.
VMware, Inc. 69
7
VMware Workbench includes the gdb debugger with which you can debug your modules. This chapter
contains the following topics for debugging modules:
“Live Debugging Using VMware Workbench” on page 69
“Debugging a Live Kernel Module” on page 70
“Debugging a Live Host Extensions Module” on page 76
“Debugging a Userworld Application in Workbench” on page 79
“Debugging a Userworld Application Core Dump” on page 82
“Debugging a Kernel Module Core Dump” on page 83
Live Debugging Using VMware WorkbenchThere are special debuggers for CIM Provider Live Debugging and CIMOM (sfcbd) Core Dump Debugging:
For CIM Provider Live Debugging, follow the instructions in “Live Debugging Using VMware
Workbench” on page 69 in this guide, and then see the VMware CIM Provider Development Kit (CIMPDK)
Guide (Help > Help Contents) for CIM Provider‐specific debugging instructions.
For CIMOM (sfcbd) Core Dump Debugging, see the VMware CIM Provider Development Kit (CIMPDK)
Guide (Help > Help Contents) for CIM Provider‐specific debugging instructions.
For live debugging of a module that is running on an ESXi server, you must set up the debugging environment
and configure both the development and test machines.
Setting Up the Debugging Environment
Your development machine (containing the VMware Workbench virtual appliance) and your testing machine
(ESXi server) must be connected by a null modem serial cable, connected using COM ports.
If you are running VMware Workbench on a VMware Workstation, make sure that the serial port is accessible
from the Workstation. In a terminal, type the following command and make sure the output shows the
connection:
#ls -l /dev/ttyS0crw-rw-rw- 1 root uucp 4, 64 <date> /dev/ttyS0
Setting Up the VMware Workbench Virtual Appliance
You must also have a serial (com) port set up on your Workbench virtual appliance.
Make sure your Workbench virtual appliance has a serial port
1 Power off the Workbench virtual appliance.
2 In the VM menu for the virtual appliance, select Settings, and select the Hardware tab.
Debugging Your Module with GDB 7

VMware Workbench Getting Started Guide
70 VMware, Inc.
3 Check to see if there is a Serial Port device that uses COM1.
4 If there is no serial port, add one.
a Select Use physical serial port.
b From the drop‐down menu, select COM1.
c Select the check box for Connect at power on.
5 Power on the Workbench virtual appliance.
Setting Up the ESXi Test Machine
On ESXi beta builds, both the logPort and the gdbPort are enabled by default. If you are debugging on an ESXi release build, for performance reasons, serial logging and debugging are disabled and you must enable
them. In addition to enabling serial logging, you must enable breaking on the serial port (log port).
Enable serial logging and serial debugging on the ESXi machine
1 Determine the state of serial logging on your ESXi machine.
ESXi# esxcli system settings kernel list | grep logPortESXi# esxcli system settings kernel list | grep gdbPort
The settings are blank if serial logging is disabled, or COM1/COM2 if enabled.
2 If necessary, enable serial logging.
ESXi# esxcli system settings kernel set --setting=logPort --value=com1ESXi# esxcli system settings kernel set --setting=gdbPort --value=com1
3 Check to see if breaking from the log port is enabled.
ESXi# esxcli system settings advanced get -o /Misc/BreakFromLogPortAllowed
4 If necessary, configure the ESXi to allow breaking from the log port.
ESXi# esxcli system settings advanced set -o /Misc/BreakFromLogPortAllowed -i 1
This change takes effect immediately without rebooting. The change is saved and persists across reboots.
5 Reboot the ESXi server for the other changes to take effect.
Testing the Serial Connection
After both the VMware Workbench virtual appliance and the ESXi test machine are configured, test the
communication link between them using the following steps:
1 On the VMware Workbench virtual appliance, in a terminal, type the following command:
# /opt/vmware/<package name><version><build>/tools/serial rx /dev/ttyS0 115200
2 Reboot the ESXi machine.
ESXi# reboot
Debugging a Live Kernel ModuleYou start a debug session and use the Debug Configurations tool, as described in this section, to define how
to deploy and test your project module. The setting can be saved as a named debug session and recalled and
reused as necessary for debugging your application. Using the auto‐deploy feature, you can separately define
and save deployment operations that can be recalled and reused in other debug sessions that you create in the
future.
For more information about debugging kernel modules, see Building, Loading, and Debugging Kernel Modules
(Help > Help Contents, then open one of the kernel‐based development kit documentation plug‐ins).
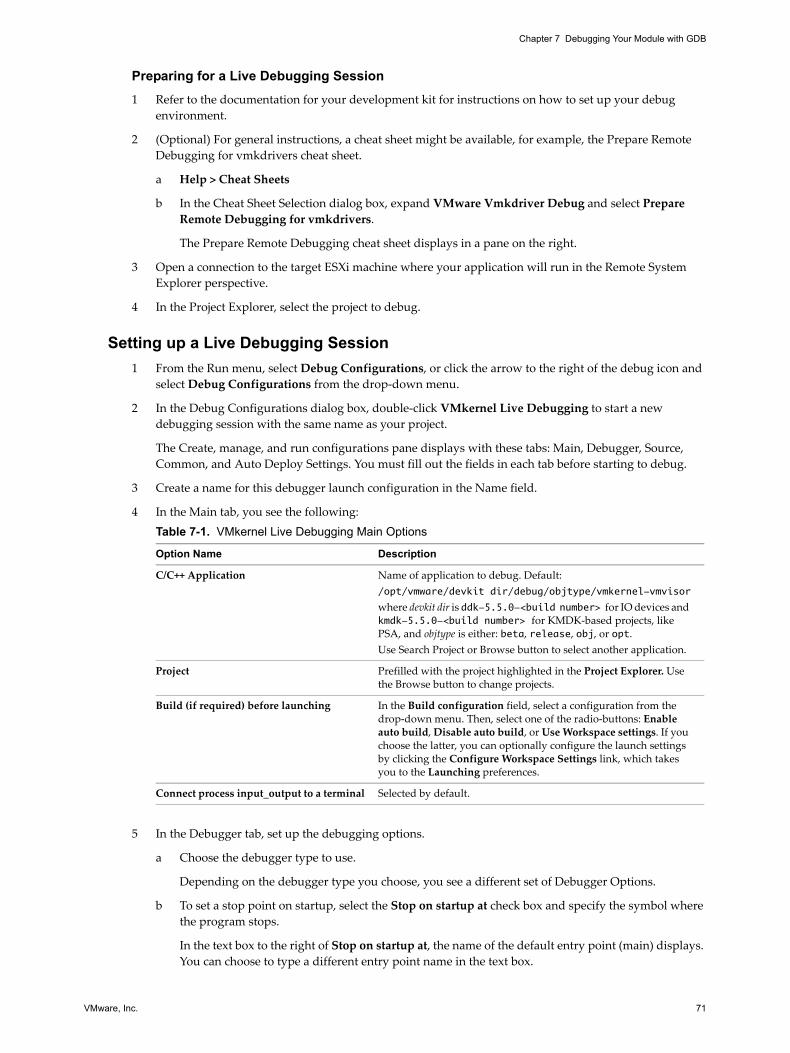
VMware, Inc. 71
Chapter 7 Debugging Your Module with GDB
Preparing for a Live Debugging Session
1 Refer to the documentation for your development kit for instructions on how to set up your debug
environment.
2 (Optional) For general instructions, a cheat sheet might be available, for example, the Prepare Remote
Debugging for vmkdrivers cheat sheet.
a Help > Cheat Sheets
b In the Cheat Sheet Selection dialog box, expand VMware Vmkdriver Debug and select Prepare
Remote Debugging for vmkdrivers.
The Prepare Remote Debugging cheat sheet displays in a pane on the right.
3 Open a connection to the target ESXi machine where your application will run in the Remote System
Explorer perspective.
4 In the Project Explorer, select the project to debug.
Setting up a Live Debugging Session
1 From the Run menu, select Debug Configurations, or click the arrow to the right of the debug icon and
select Debug Configurations from the drop‐down menu.
2 In the Debug Configurations dialog box, double‐click VMkernel Live Debugging to start a new
debugging session with the same name as your project.
The Create, manage, and run configurations pane displays with these tabs: Main, Debugger, Source,
Common, and Auto Deploy Settings. You must fill out the fields in each tab before starting to debug.
3 Create a name for this debugger launch configuration in the Name field.
4 In the Main tab, you see the following:
5 In the Debugger tab, set up the debugging options.
a Choose the debugger type to use.
Depending on the debugger type you choose, you see a different set of Debugger Options.
b To set a stop point on startup, select the Stop on startup at check box and specify the symbol where
the program stops.
In the text box to the right of Stop on startup at, the name of the default entry point (main) displays.
You can choose to type a different entry point name in the text box.
Table 7-1. VMkernel Live Debugging Main Options
Option Name Description
C/C++ Application Name of application to debug. Default:
/opt/vmware/devkit dir/debug/objtype/vmkernel-vmvisor
where devkit dir is ddk-5.5.0-<build number> for IO devices and kmdk-5.5.0-<build number> for KMDK‐based projects, like PSA, and objtype is either: beta, release, obj, or opt.
Use Search Project or Browse button to select another application.
Project Prefilled with the project highlighted in the Project Explorer. Use the Browse button to change projects.
Build (if required) before launching In the Build configuration field, select a configuration from the drop‐down menu. Then, select one of the radio‐buttons: Enable auto build, Disable auto build, or Use Workspace settings. If you choose the latter, you can optionally configure the launch settings by clicking the Configure Workspace Settings link, which takes you to the Launching preferences.
Connect process input_output to a terminal Selected by default.
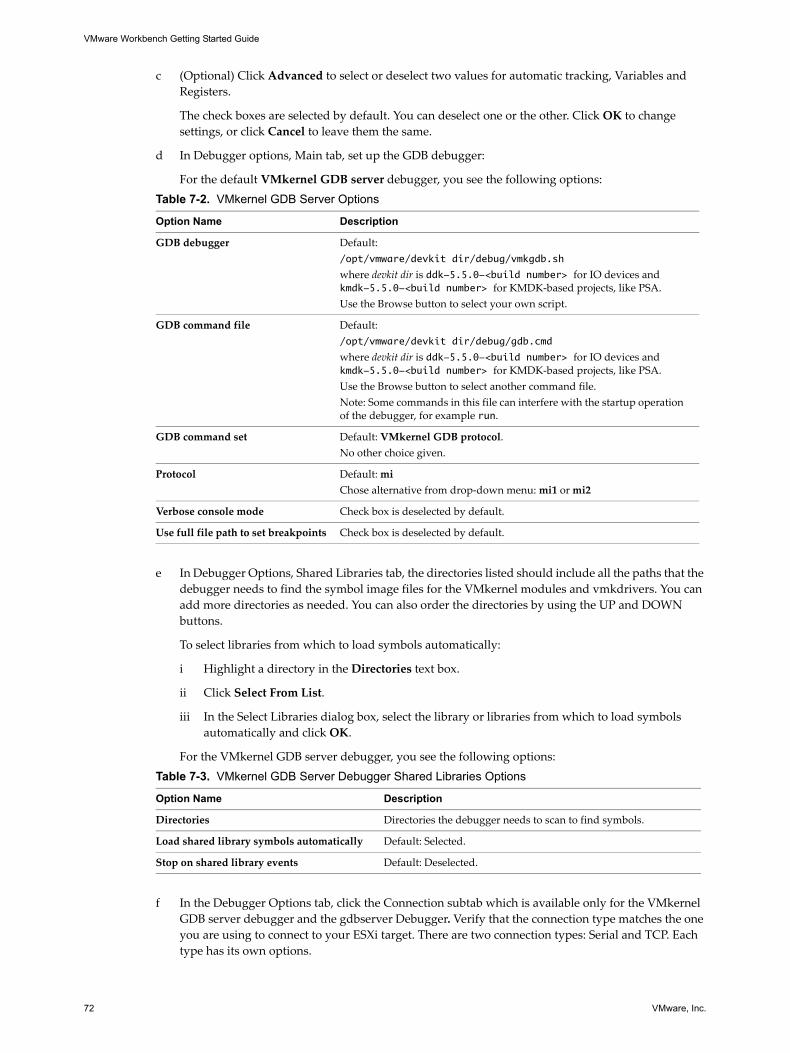
VMware Workbench Getting Started Guide
72 VMware, Inc.
c (Optional) Click Advanced to select or deselect two values for automatic tracking, Variables and
Registers.
The check boxes are selected by default. You can deselect one or the other. Click OK to change
settings, or click Cancel to leave them the same.
d In Debugger options, Main tab, set up the GDB debugger:
For the default VMkernel GDB server debugger, you see the following options:
e In Debugger Options, Shared Libraries tab, the directories listed should include all the paths that the
debugger needs to find the symbol image files for the VMkernel modules and vmkdrivers. You can
add more directories as needed. You can also order the directories by using the UP and DOWN
buttons.
To select libraries from which to load symbols automatically:
i Highlight a directory in the Directories text box.
ii Click Select From List.
iii In the Select Libraries dialog box, select the library or libraries from which to load symbols
automatically and click OK.
For the VMkernel GDB server debugger, you see the following options:
f In the Debugger Options tab, click the Connection subtab which is available only for the VMkernel
GDB server debugger and the gdbserver Debugger. Verify that the connection type matches the one
you are using to connect to your ESXi target. There are two connection types: Serial and TCP. Each
type has its own options.
Table 7-2. VMkernel GDB Server Options
Option Name Description
GDB debugger Default:
/opt/vmware/devkit dir/debug/vmkgdb.sh
where devkit dir is ddk-5.5.0-<build number> for IO devices and kmdk-5.5.0-<build number> for KMDK‐based projects, like PSA.
Use the Browse button to select your own script.
GDB command file Default:
/opt/vmware/devkit dir/debug/gdb.cmd
where devkit dir is ddk-5.5.0-<build number> for IO devices and kmdk-5.5.0-<build number> for KMDK‐based projects, like PSA.
Use the Browse button to select another command file.
Note: Some commands in this file can interfere with the startup operation of the debugger, for example run.
GDB command set Default: VMkernel GDB protocol.
No other choice given.
Protocol Default: mi
Chose alternative from drop‐down menu: mi1 or mi2
Verbose console mode Check box is deselected by default.
Use full file path to set breakpoints Check box is deselected by default.
Table 7-3. VMkernel GDB Server Debugger Shared Libraries Options
Option Name Description
Directories Directories the debugger needs to scan to find symbols.
Load shared library symbols automatically Default: Selected.
Stop on shared library events Default: Deselected.
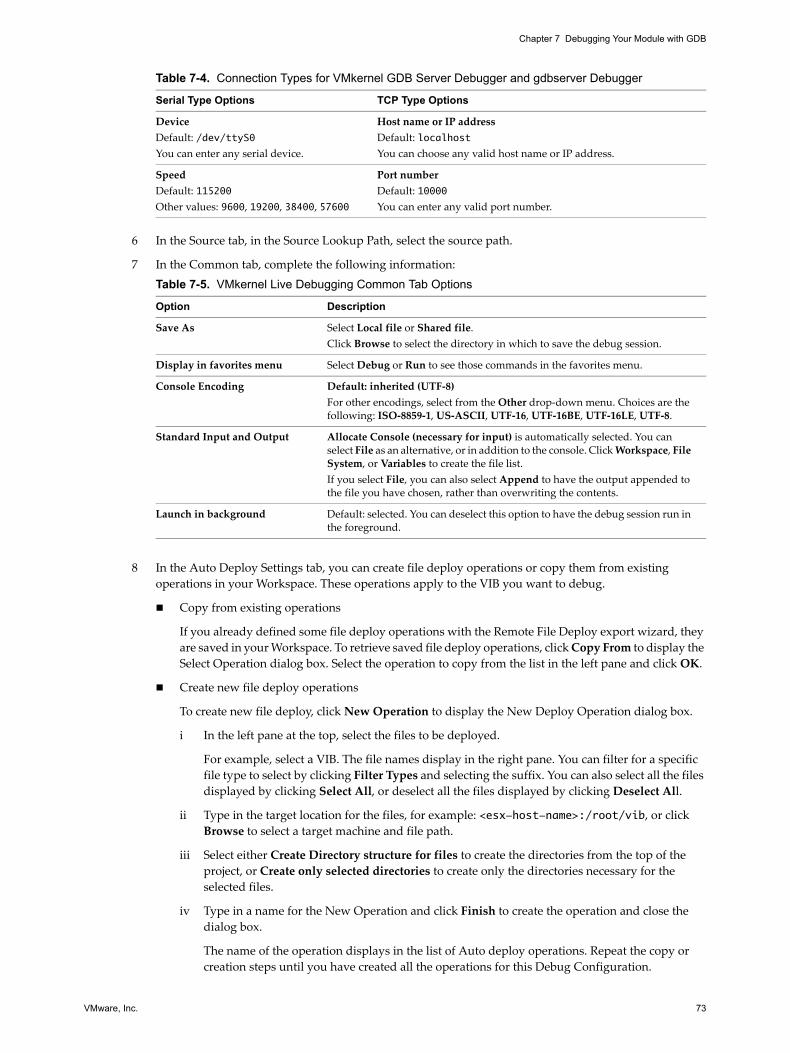
VMware, Inc. 73
Chapter 7 Debugging Your Module with GDB
6 In the Source tab, in the Source Lookup Path, select the source path.
7 In the Common tab, complete the following information:
8 In the Auto Deploy Settings tab, you can create file deploy operations or copy them from existing
operations in your Workspace. These operations apply to the VIB you want to debug.
Copy from existing operations
If you already defined some file deploy operations with the Remote File Deploy export wizard, they
are saved in your Workspace. To retrieve saved file deploy operations, click Copy From to display the
Select Operation dialog box. Select the operation to copy from the list in the left pane and click OK.
Create new file deploy operations
To create new file deploy, click New Operation to display the New Deploy Operation dialog box.
i In the left pane at the top, select the files to be deployed.
For example, select a VIB. The file names display in the right pane. You can filter for a specific
file type to select by clicking Filter Types and selecting the suffix. You can also select all the files
displayed by clicking Select All, or deselect all the files displayed by clicking Deselect All.
ii Type in the target location for the files, for example: <esx-host-name>:/root/vib, or click Browse to select a target machine and file path.
iii Select either Create Directory structure for files to create the directories from the top of the
project, or Create only selected directories to create only the directories necessary for the
selected files.
iv Type in a name for the New Operation and click Finish to create the operation and close the
dialog box.
The name of the operation displays in the list of Auto deploy operations. Repeat the copy or
creation steps until you have created all the operations for this Debug Configuration.
Table 7-4. Connection Types for VMkernel GDB Server Debugger and gdbserver Debugger
Serial Type Options TCP Type Options
Device
Default: /dev/ttyS0
You can enter any serial device.
Host name or IP address
Default: localhost
You can choose any valid host name or IP address.
Speed
Default: 115200
Other values: 9600, 19200, 38400, 57600
Port number
Default: 10000
You can enter any valid port number.
Table 7-5. VMkernel Live Debugging Common Tab Options
Option Description
Save As Select Local file or Shared file.
Click Browse to select the directory in which to save the debug session.
Display in favorites menu Select Debug or Run to see those commands in the favorites menu.
Console Encoding Default: inherited (UTF‐8)
For other encodings, select from the Other drop‐down menu. Choices are the following: ISO‐8859‐1, US‐ASCII, UTF‐16, UTF‐16BE, UTF‐16LE, UTF‐8.
Standard Input and Output Allocate Console (necessary for input) is automatically selected. You can select File as an alternative, or in addition to the console. Click Workspace, File System, or Variables to create the file list.
If you select File, you can also select Append to have the output appended to the file you have chosen, rather than overwriting the contents.
Launch in background Default: selected. You can deselect this option to have the debug session run in the foreground.
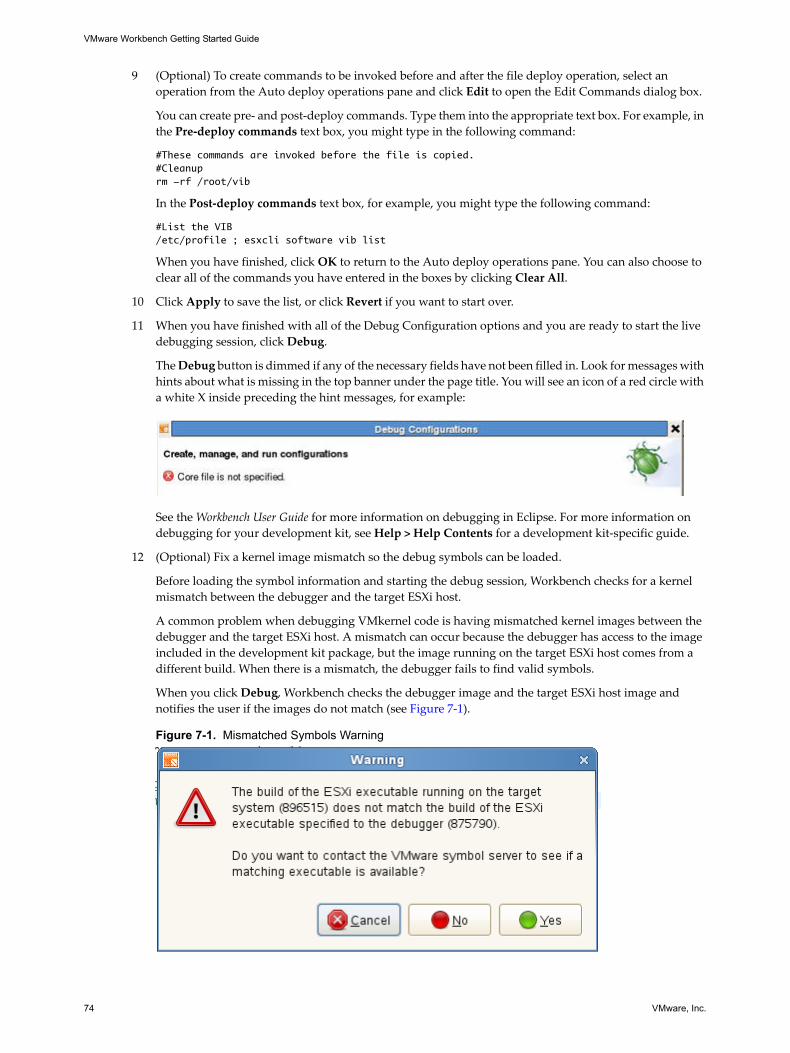
VMware Workbench Getting Started Guide
74 VMware, Inc.
9 (Optional) To create commands to be invoked before and after the file deploy operation, select an
operation from the Auto deploy operations pane and click Edit to open the Edit Commands dialog box.
You can create pre‐ and post‐deploy commands. Type them into the appropriate text box. For example, in
the Pre‐deploy commands text box, you might type in the following command:
#These commands are invoked before the file is copied.#Cleanuprm -rf /root/vib
In the Post‐deploy commands text box, for example, you might type the following command:
#List the VIB /etc/profile ; esxcli software vib list
When you have finished, click OK to return to the Auto deploy operations pane. You can also choose to
clear all of the commands you have entered in the boxes by clicking Clear All.
10 Click Apply to save the list, or click Revert if you want to start over.
11 When you have finished with all of the Debug Configuration options and you are ready to start the live
debugging session, click Debug.
The Debug button is dimmed if any of the necessary fields have not been filled in. Look for messages with
hints about what is missing in the top banner under the page title. You will see an icon of a red circle with
a white X inside preceding the hint messages, for example:
See the Workbench User Guide for more information on debugging in Eclipse. For more information on
debugging for your development kit, see Help > Help Contents for a development kit‐specific guide.
12 (Optional) Fix a kernel image mismatch so the debug symbols can be loaded.
Before loading the symbol information and starting the debug session, Workbench checks for a kernel
mismatch between the debugger and the target ESXi host.
A common problem when debugging VMkernel code is having mismatched kernel images between the
debugger and the target ESXi host. A mismatch can occur because the debugger has access to the image
included in the development kit package, but the image running on the target ESXi host comes from a
different build. When there is a mismatch, the debugger fails to find valid symbols.
When you click Debug, Workbench checks the debugger image and the target ESXi host image and
notifies the user if the images do not match (see Figure 7‐1).
Figure 7-1. Mismatched Symbols Warning

VMware, Inc. 75
Chapter 7 Debugging Your Module with GDB
VMware maintains a symbol server from which a matching image can be downloaded if available. Click
Yes to have Workbench search for a match. Click No to continue debugging with mismatched symbols.
Before the symbol server can be searched, you might have to authenticate. If you already authenticated in
the Dashboard, then you probably will not have to do it again. If you do have to authenticate, you will see
the following screen. Use your my.vmware.com credentials.
Figure 7-2. Authentication Required: Login
If Workbench finds a matching image, it asks for permission to install it and continue debugging.
Figure 7-3. Found a Matching Image
Click Yes to allow VMware to download and install the image on your debug computer. Click No to
continue debugging with mismatched symbols. Click Cancel only if you wish to cancel the whole
debugging session.
13 The debug perspective displays and you can proceed with debugging.
14 End your kernel debug session.
To finish the debug session and let the target ESXi host continue to run, click the disconnect button.
NOTE Click Cancel only if you wish to cancel the entire debugging session.
NOTE The debug symbols file is installed in the following directory: /opt/vmware/ddk-*
NOTE The terminate button is disabled for live debugging because it not only stops the test session, but
also stops the ESXi and leaves it in a broken state.
VMware Workbench Getting Started Guide
76 VMware, Inc.
Debugging a Live Host Extensions ModuleYou can debug your Host Extensions module using the VMware Workbench debugging tools. You start a
debugging session and use the Debug Configurations tool, as described in this section, to define how to deploy
and test your project module. The setting can be saved as a named debugging session and recalled and reused
as necessary for debugging your application. Using the auto‐deploy feature, you can separately define and
save deployment operations that can be recalled and reused in your future debugging sessions.
Preparing for a debugging session
1 Refer to the documentation for your development kit for any special instructions on how to set up your
debug environment.
2 (Optional) For general instructions, a cheat sheet might be available.
3 (Optional) If you are using vmkgdb64 to connect to the live system for debugging (on a serial port), you must configure the ESXi to allow breaking from the log port.
ESX# esxcli system settings advanced set -o /Misc/BreakFromLogPortAllowed -i 1
The change takes effect immediately without rebooting. The change is saved and persists across reboots.
You can check the value to see if it is set already by issuing the following command:
ESX# esxcli system settings advanced get -o /Misc/BreakFromLogPortAllowed
4 Open a connection to the target ESXi machines where your application will run in the Remote System
Explorer perspective.
5 In the Project Explorer, select the project to debug.
Setting up a debugging session
1 From the Run menu, select Debug Configurations, or click the arrow to the right of the debug icon and
select Debug Configurations from the drop‐down menu.
2 In the Debug Configurations dialog box, double‐click VMware Host Extensions Command Live
Debugging to start a new debugging session with the same name as your project.
The Create, manage, and run configurations pane displays with these tabs: Main, Debugger, Source,
Common, and Auto Deploy Settings. You must fill out the fields in each tab before starting to debug.
3 Create a name for this debugger launch configuration in the Name field.
4 In the Main tab, you see the following:
Table 7-6. VMkernel Live Debugging Main Options
Option Name Description
C/C++ Application Name of application to debug (your Host Extensions command).
The field is pre‐filled with information from the project. Click the Search Project or Browse button to select a different application.
Project Prefilled with the project highlighted in the Project Explorer. Use the Browse button to change projects.
Build (if required) before launching In the Build configuration field, select a configuration from the drop‐down menu. Then, select one of the radio‐buttons: Enable auto build, Disable auto build, or Use Workspace settings. If you choose the latter, you can optionally configure the launch settings by clicking the Configure Workspace Settings link, which takes you to the Launching preferences.
Connect process input_output to a terminal Selected by default.

VMware, Inc. 77
Chapter 7 Debugging Your Module with GDB
5 In the Debugger tab, set up the debugging options.
a Choose the debugger type to use.
Depending on the debugger type you choose, you see a different set of Debugger Options.
b To set a stop point on startup, select the Stop on startup at check box and specify the symbol where
the program stops.
In the text box to the right of Stop on startup at, the name of the default entry point (main) displays.
You can choose to type a different entry point name in the text box.
c (Optional) Click Advanced to select or deselect two values for automatic tracking, Variables and
Registers.
The check boxes are selected by default. You can deselect one or the other. Click OK to change
settings, or click Cancel to leave them the same.
d In Debugger options, Main tab, set up the GDB debugger:
For the default VMkernel GDB server debugger, you see the following options:
e In Debugger Options, Shared Libraries tab, the directories listed should include all the paths that the
debugger needs to find the symbol image files for the Host Extensions module. You can add more
directories as needed. You can also order the directories by using the UP and DOWN buttons.
To select libraries from which to load symbols automatically:
i Highlight a directory in the Directories text box.
ii Click Select From List.
iii In the Select Libraries dialog box, select the library or libraries from which to load symbols
automatically and click OK.
For the VMware Host Extensions Live Debugger, you see the following options:
Table 7-7. VMkernel GDB Server Options
Option Name Description
GDB debugger Default:
/opt/vmware/project-type/debug/vmkgdb64-7.2for example project‐type could be PSA-<rel>-<buildnum> for PSA devkit. Use the Browse button to select your own script.
GDB command file Default:
/opt/vmware/project-type/debug/gdb.cmdfor example project‐type could be PSA-<rel>-<buildnum> for PSA devkit. Use the Browse button to select your own script.
Note: Some commands in this file can interfere with the startup operation of the debugger, for example run.
GDB command set Default: UserWorld32 GDB protocol.
No other choice given.
Protocol Default: mi
Chose alternative from drop‐down menu: mi1 or mi2
Verbose console mode Check box is deselected by default.
Use full file path to set breakpoints Check box is deselected by default.
Table 7-8. VMware Host Extensions Live Debugger Shared Libraries Options
Option Name Description
Directories Directories the debugger needs to scan to find symbols.
Load shared library symbols automatically Default: Selected.
Stop on shared library events Default: Deselected.
VMware Workbench Getting Started Guide
78 VMware, Inc.
f In the Debugger Options, Host Extensions sub‐tab, you see the following options:
6 In the Source tab, in the Source Lookup Path, select the source path.
7 In the Common tab, complete the following information:
8 In the Auto Deploy Settings tab, you can create file deploy operations or copy them from existing
operations in your Workspace. These operations apply to the VIB you want to debug.
Copy from existing operations
If you have already defined some file deploy operations with the Remote File Deploy export wizard,
they are saved in your Workspace. To retrieve saved file deploy operations, click Copy From to
display the Select Operation dialog box. Select the operation to copy from the list in the left pane and
click OK.
Create new file deploy operations
To create new file deploy operations, click New Operation to display the New Deploy Operation
dialog box.
i In the left pane at the top, select the files to be deployed. For example, select a VIB. The file names
display in the right pane. You can filter for a specific file type to select by clicking Filter Types
and selecting the suffix. You can also select all the files displayed by clicking Select All, or
deselect all the files displayed by clicking Deselect All.
ii Type in the target location for the files, for example: <esx-host-name>:/root/vib, or click Browse to select a target machine and file path.
Table 7-9. Host Extensions Tab Options
Option Name Description
ESXi Specify the ESXi host name or IP address.
Port Specify the TCP port number. The recommended range is 50000 to 50999; default is 50071.
Location Specify the location where the command program resides on the ESXi host. The default is /opt/vmware/bin.
Copy Choose under what conditions to copy the program if it already exists at the chosen location.
Optional check box To save the existing command program during the debugging session and restore it when the session completes, select Backup existing program in the location on the ESXi.
Esxcli Specify the command line used to invoke the command program.
Optional check box To have the debugger prompt the user to enter the command at start up, select Ask the esxcli command line when launching the debugger.
Table 7-10. VMkernel Live Debugging Common Tab Options
Option Description
Save As Select Local file or Shared file.
Click Browse to select the directory in which to save the debug session.
Display in favorites menu Select Debug or Run to see those commands in the favorites menu.
Console Encoding Default: inherited (UTF‐8)
For other encodings, select from the Other drop‐down menu. Choices are the following: ISO‐8859‐1, US‐ASCII, UTF‐16, UTF‐16BE, UTF‐16LE, UTF‐8.
Standard Input and Output Allocate Console (necessary for input) is automatically selected. You can select File as an alternative, or in addition to the console. Click Workspace, File System, or Variables to create the file list.
If you select File, you can also select Append to have the output appended to the file you have chosen, rather than overwriting the contents.
Launch in background Default: selected. You can deselect this option to have the debug session run in the foreground.
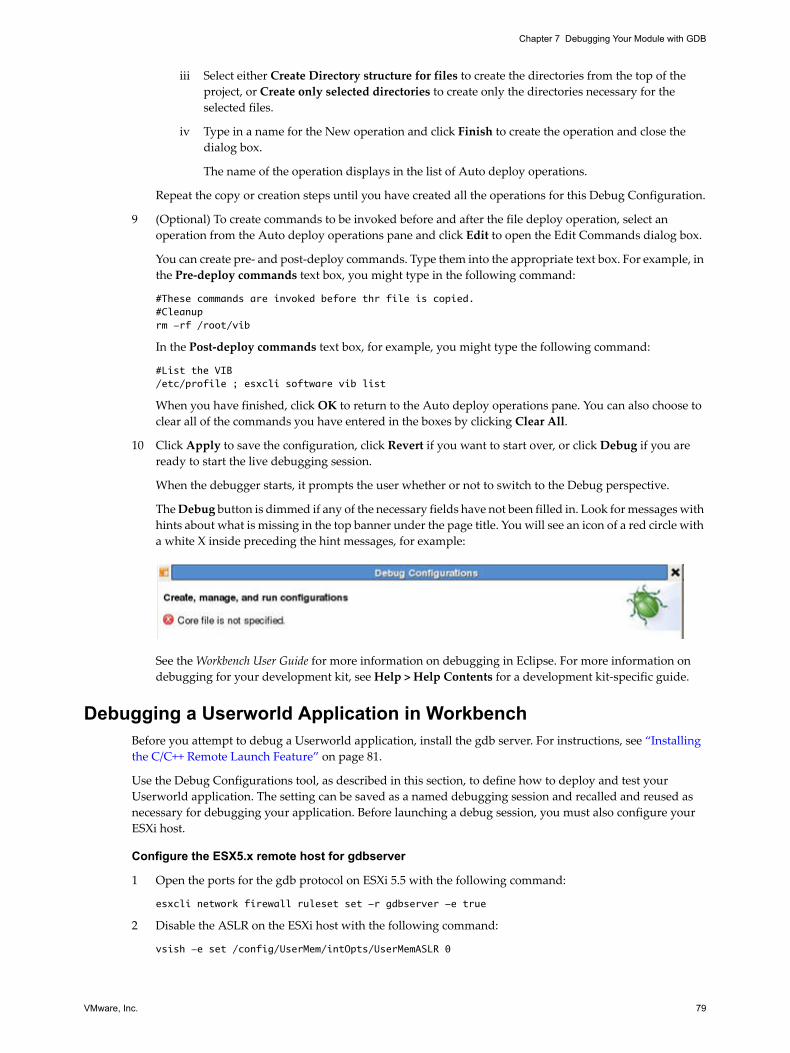
VMware, Inc. 79
Chapter 7 Debugging Your Module with GDB
iii Select either Create Directory structure for files to create the directories from the top of the
project, or Create only selected directories to create only the directories necessary for the
selected files.
iv Type in a name for the New operation and click Finish to create the operation and close the
dialog box.
The name of the operation displays in the list of Auto deploy operations.
Repeat the copy or creation steps until you have created all the operations for this Debug Configuration.
9 (Optional) To create commands to be invoked before and after the file deploy operation, select an
operation from the Auto deploy operations pane and click Edit to open the Edit Commands dialog box.
You can create pre‐ and post‐deploy commands. Type them into the appropriate text box. For example, in
the Pre‐deploy commands text box, you might type in the following command:
#These commands are invoked before thr file is copied.#Cleanuprm -rf /root/vib
In the Post‐deploy commands text box, for example, you might type the following command:
#List the VIB /etc/profile ; esxcli software vib list
When you have finished, click OK to return to the Auto deploy operations pane. You can also choose to
clear all of the commands you have entered in the boxes by clicking Clear All.
10 Click Apply to save the configuration, click Revert if you want to start over, or click Debug if you are
ready to start the live debugging session.
When the debugger starts, it prompts the user whether or not to switch to the Debug perspective.
The Debug button is dimmed if any of the necessary fields have not been filled in. Look for messages with
hints about what is missing in the top banner under the page title. You will see an icon of a red circle with
a white X inside preceding the hint messages, for example:
See the Workbench User Guide for more information on debugging in Eclipse. For more information on
debugging for your development kit, see Help > Help Contents for a development kit‐specific guide.
Debugging a Userworld Application in WorkbenchBefore you attempt to debug a Userworld application, install the gdb server. For instructions, see “Installing
the C/C++ Remote Launch Feature” on page 81.
Use the Debug Configurations tool, as described in this section, to define how to deploy and test your
Userworld application. The setting can be saved as a named debugging session and recalled and reused as
necessary for debugging your application. Before launching a debug session, you must also configure your
ESXi host.
Configure the ESX5.x remote host for gdbserver
1 Open the ports for the gdb protocol on ESXi 5.5 with the following command:
esxcli network firewall ruleset set -r gdbserver -e true
2 Disable the ASLR on the ESXi host with the following command:
vsish -e set /config/UserMem/intOpts/UserMemASLR 0
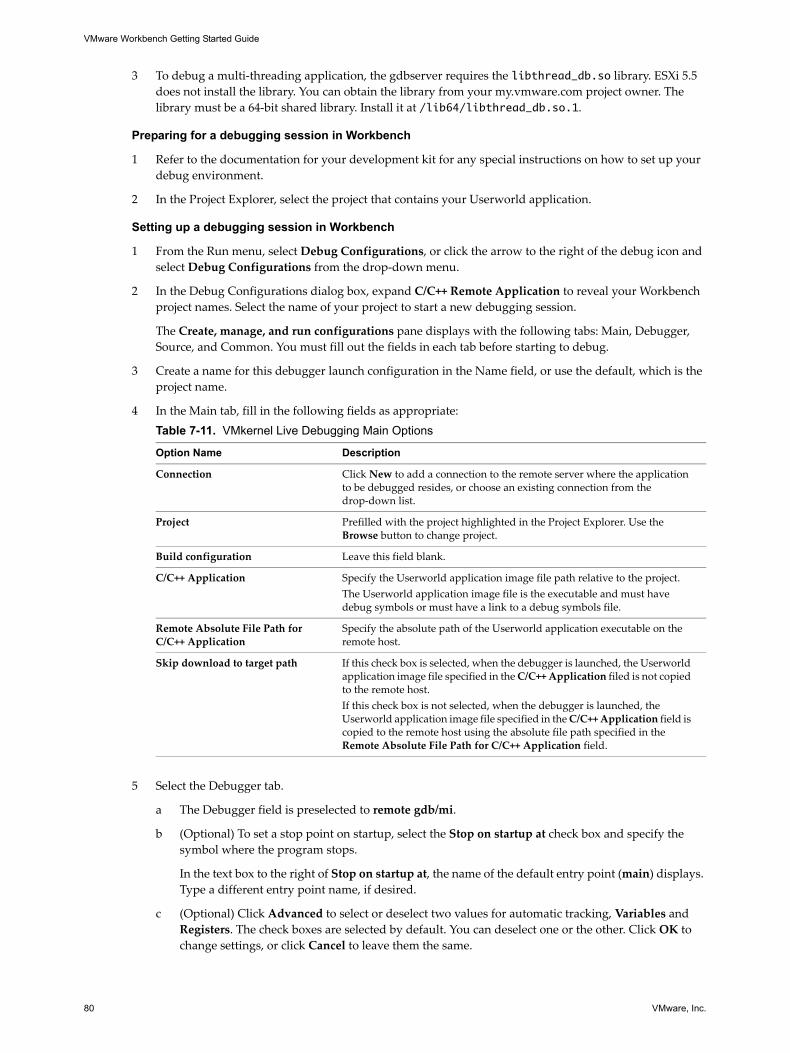
VMware Workbench Getting Started Guide
80 VMware, Inc.
3 To debug a multi‐threading application, the gdbserver requires the libthread_db.so library. ESXi 5.5 does not install the library. You can obtain the library from your my.vmware.com project owner. The
library must be a 64‐bit shared library. Install it at /lib64/libthread_db.so.1.
Preparing for a debugging session in Workbench
1 Refer to the documentation for your development kit for any special instructions on how to set up your
debug environment.
2 In the Project Explorer, select the project that contains your Userworld application.
Setting up a debugging session in Workbench
1 From the Run menu, select Debug Configurations, or click the arrow to the right of the debug icon and
select Debug Configurations from the drop‐down menu.
2 In the Debug Configurations dialog box, expand C/C++ Remote Application to reveal your Workbench
project names. Select the name of your project to start a new debugging session.
The Create, manage, and run configurations pane displays with the following tabs: Main, Debugger,
Source, and Common. You must fill out the fields in each tab before starting to debug.
3 Create a name for this debugger launch configuration in the Name field, or use the default, which is the
project name.
4 In the Main tab, fill in the following fields as appropriate:
5 Select the Debugger tab.
a The Debugger field is preselected to remote gdb/mi.
b (Optional) To set a stop point on startup, select the Stop on startup at check box and specify the
symbol where the program stops.
In the text box to the right of Stop on startup at, the name of the default entry point (main) displays.
Type a different entry point name, if desired.
c (Optional) Click Advanced to select or deselect two values for automatic tracking, Variables and
Registers. The check boxes are selected by default. You can deselect one or the other. Click OK to
change settings, or click Cancel to leave them the same.
Table 7-11. VMkernel Live Debugging Main Options
Option Name Description
Connection Click New to add a connection to the remote server where the application to be debugged resides, or choose an existing connection from the drop‐down list.
Project Prefilled with the project highlighted in the Project Explorer. Use the Browse button to change project.
Build configuration Leave this field blank.
C/C++ Application Specify the Userworld application image file path relative to the project.
The Userworld application image file is the executable and must have debug symbols or must have a link to a debug symbols file.
Remote Absolute File Path for C/C++ Application
Specify the absolute path of the Userworld application executable on the remote host.
Skip download to target path If this check box is selected, when the debugger is launched, the Userworld application image file specified in the C/C++ Application filed is not copied to the remote host.
If this check box is not selected, when the debugger is launched, the Userworld application image file specified in the C/C++ Application field is copied to the remote host using the absolute file path specified in the Remote Absolute File Path for C/C++ Application field.

VMware, Inc. 81
Chapter 7 Debugging Your Module with GDB
d In the Debugger Options Main tab, set up the GDB debugger:
e In the Debugger Options Gdbserver Settings sub‐tab, specify the following options:
6 Click Apply to save the configuration, click Revert if you want to start over, or click Debug if you are
ready to start the live debugging session.
When the debugger starts, it prompts the user whether or not to switch to the Debug perspective.
The Debug button is dimmed if any of the necessary fields have not been filled in. Look for messages with
hints about what is missing in the top banner under the page title. You will see an icon of a red circle with
a white X inside preceding the hint messages, for example:
See the Eclipse Workbench User Guide for more information on debugging. For more information on
debugging for your development kit, see Help > Help Contents for a development kit‐specific guide.
Installing the C/C++ Remote Launch Feature
ESXi supports the gdbserver which makes it easier to debug a Userworld application. You can install the
Eclipse C Development Tool (CDT) optional feature, C/C++ Remote Launch, on Workbench and configure it
for debugging your Userworld applications.
For instructions on debugging a Userworld application, see “Debugging a Userworld Application in
Workbench” on page 79. See the Eclipse help for other remote debugging information, such as remote launch
configuration.
Install the C/C++ Remote Launch feature
1 Inside VMware Workbench, select Help > Install New Software.
2 Click the Available Software Sites link.
Table 7-12. VMkernel GDB Server Options
Option Name Description
GDB debugger Specify vmkgdb64-72 with full path.
Default path:
/opt/vmware/devkit dir/debug/tools/vmkgdb64-7.2
or
/opt/vmware/devkit dir/debug/vmkgdb64-72
depending on the development kit, and where devkit dir is ddk-5.5.0-<build number> for IO devices and kmdk-5.5.0-<build number> for KMDK‐based projects, like PSA.
GDB command file Change the value to be blank.
Or use the Browse button to select your own command file.
Protocol Use the default: mi
Use full file path to set breakpoints Check box is deselected by default.
Table 7-13. Gdbserver Settings Tab Options
Option Name Description
Gdbserver name Use the default: gdbserver.
Port number Specify the UDP port number for debugging. The port number must be unused and must be accepted by the firewall on the ESXi host for the gdb protocol.If the firewall on the ESXi host is configured properly for the gdb protocol, the port number range is 50000 to 50999.
VMware Workbench Getting Started Guide
82 VMware, Inc.
3 Scroll to the location of the Eclipse tools CDT URL:
http://download.eclipse.org/tools/cdt/releases/helios
The site is disabled by default.
4 Enable the site by selecting the URL (or select the check box to the left of it) and click Enable and click OK.
5 Select the URL from the Work with drop‐down list.
The modules available for installation are listed below.
6 Expand CDT Optional Features.
7 Select the C/C++ Remote Debug Launcher check box and click Next.
8 Review the Install Details and click Next.
9 Review the license notice and select I accept the terms of the license agreement, and click Finish. The
installation proceeds. This step can take several minutes to complete. You cannot install the software
without agreeing to the license terms.
When the installation is complete, a dialog box advises you to restart Eclipse for the changes to take effect.
Click Restart Now to restart Eclipse.
Debugging a Userworld Application Core DumpThe Userworld zdump debugger is a postmortem debugger that launches an Eclipse CDT debugger with a
dump file that includes core and executable. The debugger extends the debugger services framework gdb launch delegate (GdbLaunchDelegate) and allows programmers specify a remote zdump including core file, executable image, and symbol tree directory, either interactively or automatically, to aid debugging.
Debug a Userworld program crash from ESXi host zdump
1 In VMware Workbench, make sure that the C/C++ perspective is selected.
2 Instead of Project Explorer showing your program and other items, click Remote System Explorer (RSE).
3 Right‐click New > Connection and navigate to the ESXi host where your project’s program crashed. You
are asked to supply user name root and password. SSH must be enabled on the host.
4 Instead of RSE, click Project Explorer and return to your program. Click Run > Debug Configurations.
5 On the left side of the Debug Configurations window, scroll down and click VMware User World Zdump
Debugging. New_configuration appears on the right side. You can fill out the boxes for Zdump, Core,
Executable and Symbols, but this is not necessary because you can specify them later.
6 In the Name box for New_configuration, type a name. Click the Debugging tab. Beside GDB debugger,
replace “gdb” by navigating to /opt/vmware/<devkit-release#-build#>/debug/vmkgdb64* then click OK. Beside GDB command file, erase the “.gdbinit” text.
7 Click the Shared Libraries tab. Right‐click and select Show Hidden Files so you can see the .build choice in the upcoming location path. Click Add and navigate to this location in your workspace project:
workspace/<project>/<name>/.build/build/LIBRARIES/<devkit-project>/uw32/release which contains debug object, stripped object, and shared object (.so) file. Click OK twice.
8 Click the Zdump Main tab and go back to the previous view. Click Debug on lower right.
9 The Select Zdump File dialog box appears. From the Projects pull‐down menu at the bottom, select the
ESXi host to which you connected RSE. On the ESXi host, select /var/core and click Search. Your zdump files should appear. Select one and click OK.
10 The User World Select Symbol Tree dialog box appears. Click Create. Another dialog box appears. In the
pull‐down menu below ESX Build Number, select the choice saying “From zdump” with a build number.
Click Next. The Userworld symbol tree directory appears, with two check boxes underneath. Uncheck the
box next to Get image files from ESX. Click Finish and wait for the symbol tree to be updated. When the
User World Select Symbol Tree dialog box reappears, click OK.
VMware, Inc. 83
Chapter 7 Debugging Your Module with GDB
11 The Confirm Perspective Switch dialog box appears. Click Yes to confirm Debug perspective.
12 In the upper left Debug pane, you can select a thread and double‐click function names and line numbers
to display the source code where the crash may have occurred.
13 When you return to the C/C++ perspective and the Project Explorer view, the debug project appears with
your project and build files.
Debugging a Kernel Module Core DumpThe following is a general description of the core debugging facility that can be used for KMDK‐based
modules (PSA and DVFilter) and DDK drivers.
The VMware Workbench provides the gdb debugger. To open a debugging session, you must be in the C/C++
perspective with your project selected in the Project Explorer.
Debug a core dump produced by an ESXi system
1 From the Run menu, select Debug Configurations, or click the arrow to the right of the debug icon and
select Debug Configurations from the drop‐down menu.
2 Open the debugging configuration dialog in one of the two following ways:
In the Debug Configurations dialog box, right‐click on VMkernel Core Dump Debugging, and
select New.
Double click VMkernel Core Dump Debugging.
A debug configuration is created with the same name as your project.
3 In the Main tab, configure the following parameters:
a The C/C++ Application path is prefilled with a path to the VMkernel, but you can choose a different
path by clicking Search Project or Browse.
b Verify the project name.
c If you want to build the project before launching the debugger, select the build configuration from
the drop‐down menu and select one of the radio buttons: Enable auto build, Disable auto build, or
Use workspace settings.
If you choose Use workspace settings, you can configure the settings by clicking the Configure
Workspace Settings link.
d If you do not want to connect the process input and output to a terminal, deselect the check box.
e Specify the location of the Core file.
You can click the Search Project or Browse buttons to find the core file.
4 In the Debugger tab, set up the debugger options:
a Choose the debugger type to use.
Depending on the debugger type you choose, you see a different set of Debugger Options.
b In Debugger options, Main tab, set up the GDB debugger:
IMPORTANT To support the debug session, create and deploy a VIB package with debug build objects, and
deploy the debug VIB package on a debug build of ESXi.

VMware Workbench Getting Started Guide
84 VMware, Inc.
For the default VMkernel Core Dump Debugger, you see the following options:
c In Debugger Options, Shared Libraries tab, the directories listed should include all the paths that the
debugger needs to find the symbol image files for the VMkernel modules and vmkdrivers. You can
add more directories as needed. You can also order the directories by clicking the UP and DOWN
buttons.
To select libraries from which to load symbols automatically:
i Highlight a directory in the Directories text box.
ii Click Select From List.
iii In the Select Libraries dialog box, select the library or libraries from which to load symbols
automatically and click OK.
For the VMkernel Core Dump Debugger shared libraries, you see the following options:
5 In the Source tab, select a source lookup path, or select other paths.
a You can choose to add other source paths and you can order them by moving them up or down in
the list.
b The default path for debugging is /project name/build.
c (Optional) Select the Search for duplicate files on the path check box.
Table 7-14. VMkernel Core Dump Debugger Options
Option Name Description
GDB debugger Default:
/opt/vmware/devkit dir/debug/vmkgdb.sh
where devkit dir is ddk-5.5.0-<build number> for IO devices and kmdk-5.5.0-<build number> for KMDK‐based projects, like PSA.
Use the Browse button to select your own script.
GDB command file Default:
/opt/vmware/devkit dir/debug/gdb.cmd
where devkit dir is ddk-5.5.0-<build number> for IO devices and kmdk-5.5.0-<build number> for KMDK‐based projects, like PSA.
Use the Browse button to select another command file.
GDB command set Default: VMkernel GDB protocol.
No other choices are given.
Protocol Default: mi
Chose alternative from drop‐down menu: mi1 or mi2
Verbose console mode Check box is deselected by default.
Use full file path to set breakpoints Check box is deselected by default.
Table 7-15. VMkernel Core Dump Debugger Shared Libraries Options
Option Name Description
Directories Directories the debugger needs to scan to find symbols.
Load shared library symbols automatically Selected, but dimmed.
Stop on shared library events Deselected and dimmed.

VMware, Inc. 85
Chapter 7 Debugging Your Module with GDB
6 In the Common tab, configure the following options:
7 Click Apply and click Debug.
Before loading the symbol information and starting the debug session, Workbench checks for a kernel
mismatch between the debugger and the ESXi host that generated the dump.
You can delete all of the changes you made to the operation by clicking Revert instead of Apply.
See the Eclipse Workbench User Guide for more information on debugging in Eclipse (Help > Help
Contents).
8 (Optional) Fix a kernel image mismatch so the debug symbols can be loaded.
A common problem when debugging VMkernel code is having mismatched kernel images between the
debugger and the ESXi host that produced the dump. A mismatch between the two can occur because the
debugger only has access to the image included in the development kit package, but the ESXi host that
produced the dump might be running a different release. When there is such mismatch, the debugger fails
to find valid symbols which makes debugging difficult.
When you click Debug, Workbench checks the debugger image against the image of the ESXi host that
created the dump and notifies the user if the images do not match (see Figure 7‐4).
Figure 7-4. Mismatched Symbols Warning
VMware maintains a symbol server from which a matching image can be downloaded if available. Click
Yes to have Workbench search for a match. Click No to continue debugging with mismatched symbols.
Table 7-16. VMkernel Core Dump Debugging Common Tab Options
Option Description
Save As Select Local file or Shared file.
Click Browse to select the directory in which to save the debug session.
Display in favorites menu Select Debug to see this command in the favorites menu.
Console Encoding Default: inherited (UTF‐8)
For other encodings, select from the Other drop‐down menu. Choices are the following: ISO‐8859‐1, US‐ASCII, UTF‐16, UTF‐16BE, UTF‐16LE, UTF‐8.
Standard Input and Output Allocate Console (necessary for input) is automatically selected. You can select File as an alternative, or in addition to the console. Click Workspace, File System, or Variables to create the file list.
If you select File, you can also select Append to have the output appended to the file you have chosen, rather than overwriting the contents.
Launch in background Default: selected. You can deselect this option to have the debug session run in the foreground.
NOTE Click Cancel only if you wish to cancel the entire debugging session.

VMware Workbench Getting Started Guide
86 VMware, Inc.
Before the symbol server can be searched, you might have to authenticate. If you already authenticated in
the Dashboard, then you probably will not have to do it again. If you do have to authenticate, you will see
the following screen. Use your my.vmware.com credentials.
Figure 7-5. Authentication Required
If Workbench finds a matching image, it asks for permission to install it and continue debugging.
Figure 7-6. Found a Matching Image
Click Yes to allow VMware to download and install the image on your debug computer. Click No to
continue debugging with mismatched symbols. Click Cancel only if you wish to cancel the whole
debugging session.
9 The debug perspective displays after gdb loads the VMkernel modules and the symbolic information.
In the Debug pane at top left is a stack trace of the location of the failure. You can select different stack
levels. The source file for the active stack shows in a pane under the stack trace. At the top right, the
Variables view shows the local variables for the active function. Other views are available, such as views
to see the current value of the CPU registers, to inspect the content of the target memory, and to see the
list of breakpoints.
NOTE The debug symbols file is installed in the following directory: /opt/vmware/ddk-*
IMPORTANT Depending on the currently selected stack level, the debugger may or may nor have access to the
source code. You can still debug functions for which there is no source code available at the assembly level.
Variables and registers should display correct values even when no source code is available.
VMware, Inc. 87
8
To deploy your module, you must package it in a VIB. The VIB can be signed with test keys and certificates
until you have certified and are given your production key and certificate from VMware.
The chapter contains the following topics:
“Test Keys and Certificates” on page 87
“Installing Test Certificates” on page 87
“Signing Your Test VIB” on page 88
“Set the Acceptance Level on Your Test ESXi” on page 90
“Signing Your VIB for Production and Distribution” on page 92
“Verifying Remote Installation” on page 92
Test Keys and CertificatesVIBtools contains the VMware test keys and certificates that you use to sign your VIBs for testing and
certification and is integrated into Workbench. The test keys and certificates are located in the
/opt/vmware/vibtools/testcerts directory. There is a set of keys and certificates for each acceptance level for which you can certify, that is, VMware Certified, VMware Accepted, Partner Certified, and Community.
With the test certificates installed on your target ESXi host, a VIB created with the appropriate test keys will
be installable on the target ESXi host.
Installing Test CertificatesYour module to be tested has to be signed with the test keys as described earlier. The matching test certificates
must be installed on your test ESXi host before you install your test VIB.
There are two ways to install test certificates on your target host. You can perform a fresh install on a host
machine, or you can install the certificates only on an existing ESXi host. The latter is only appropriate for
engineers testing their development modules and who want to install their unsigned VIBs on the ESXi
machine.
Signing VIBs for Test and Production 8
NOTE New for vSphere 6.0, during development, if you are installing an unsigned VIB to your test host using
the command line, you must use the -no-sig-check option with the ESXi host set at the
CommunitySupported acceptance level. When you are ready to run certification tests, you must sign your VIB,
using the test keys and certificates provided by VMware, at the acceptance level for which you wish to certify.
NOTE To obtain a VMware signed key and certificate for your production VIB, you must certify at the
VMware Certified or VMware Accepted level.

VMware Workbench Getting Started Guide
88 VMware, Inc.
For certification and for testing signed VIBs, perform a fresh install of the special ESXi ISO, which has test
certificates already installed on it:
a Download theVMware-VMvisor-Installer-With-Test-Certs-6.0.0-<build number>.x86_64.iso from the Developer Center.
b Install it on the test host.
For development testing purposes only, to facilitate installing your unsigned test VIBs, you can install the
VMware‐provided, unsigned VIB that contains only the test certificates on an existing ESXi host:
a Set the acceptance level to CommunitySupported on the ESXi 6.0 host.
You must set the acceptance level to CommunitySupported level because the test‐certificates‐only VIB is unsigned.
esxcli software acceptance set --level=CommunitySupported
b Copy the vib-test-certs package, found on the VMware Developer Center, to the ESXi 6.0 host in
the /tmp directory and then use the following command to install the VIB:
esxcli software vib install -v /tmp/vib-test-certs.vib --no-sig-check
The --no-sig-check option is required with the esxcli command when installing unsigned VIBs.
Signing Your Test VIBYou can sign your test VIB using the Workbench UI or the command line.
The VIB can be signed using Workbench or by running the Makefile in the command line:
“Signing a VIB Using the Workbench UI” on page 88
“Signing a VIB in the Command Line” on page 89
Signing a VIB Using the Workbench UI
Use the following process when you are ready to sign the VIB for testing and certification purposes:
1 Create the VIB for your development kit.
See your development kit guide for instructions on how to create a VIB. (Generally, you select a
VIB‐creation related menu item from the right‐click menu in Project Explorer.)
2 Double‐click the VIB in the Project Explorer.
This opens the VIB in a Workbench pane.
3 Select the Signature tab at the bottom of the pane.
4 Browse to the testkey directory in the local file system. (Click Browse)
CAUTION You cannot raise the acceptance level on the ESXi host once an unsigned VIB has been installed
on the host.
IMPORTANT Once your module is ready to start certification testing, you must sign the VIB with the proper
test key. Select the test key that corresponds to the acceptance level for which you are certifying.
CAUTION If the acceptance level in the VIB does not match the keys you are trying to use to sign the VIB,
you will see the following error: The VIB of "<level name>" acceptance level can't be signed with "<cert level name>" cert. When you create the VIB, the default acceptance level is community. Be sure to set the desired acceptance level in the descriptor.xml file before you create the VIB. See “Selecting an Acceptance Level in the descriptor.xml File” on page 90.

VMware, Inc. 89
Chapter 8 Signing VIBs for Test and Production
The Select File window displays.
a Double‐click File System in the left pane.
b In the right pane, browse to /opt/vmware/vibtools/testcerts.
5 Select the appropriate key file for your acceptance level. The available test keys are:
6 Click Browse to select the appropriate certificate file for your acceptance level. Available test certificates:
7 Click Add Signature.
If you are successful, you see the following message:
Successfully signed /workspace/<project name>/build/<vib name>.vib.
If you see the following error message, you must edit the VIB’s descriptor.xml file to change the VIB acceptance level to match the test key and certificate acceptance level you chose. To fix this, you can edit
the descriptor.xml file directly in the Workbench UI.
"The VIB of "<level name>" acceptance level can't be signed with "<cert level name>" cert."
Signing a VIB in the Command Line
If you wish to sign your VIB with a test key in the command line instead of using the Workbench UI, install
the test keys and certificates on your development machine and the target ESXi host using the instructions in
the procedures that follow. After installing the test keys and certificates, a licensed VIB created with these test
keys will be installable on the ESXi host.
Install test keys and certificates on your development machine
1 Back up the following files:
/opt/vmware/vibtools/certs/vmware.cert/opt/vmware/vibtools/certs/vmpartner.cert/opt/vmware/vibtools/certs/vmpartner.crl
2 Replace the above files with those found in the test-keys/devkit-test-certs directory.
Table 8-1. Available Test Keys
Acceptance Level Key Name
VMware Certified vmware.key
VMware Accepted accepted.key
Partner Certified partner.key
Community none required
Table 8-2. Available Test Keys
Acceptance Level Certificate Name
VMware Certified vmware.cert
VMware Accepted accepted.cert
Partner Certified partner.cert
Community none required
NOTE If the test keys and certificates are not installed on your development machine, when you try to run the
license example Makefile, you will see the following error: "The VIB acceptance level (partner) doesn't
match the signing certificate."
CAUTION You must restore the original files to /opt/vmware/vibtools/certs before attempting to
create production VIBs, or else your VIBs will be unrecognized by a production, non‐test version of ESXi.

VMware Workbench Getting Started Guide
90 VMware, Inc.
Signing Your VIB
Run the Makefile in the CLI to create a VIB with the test keys
Selecting an Acceptance Level in the descriptor.xml File
When you are ready to sign your VIB, if necessary replace the default acceptance level in the descriptor.xml file with one of the following levels:
The acceptance level you choose when signing your VIB (using the keys and certificates) must agree with the
acceptance level in the descriptor.xml file. Verify that the descriptor.xml lists the same acceptance level
you are going to use to sign the VIB. If it does not match, edit the file to list the same acceptance level.
Changing the acceptance level in the descriptor.xml file
1 With the development kit project highlighted in the Project Explorer, double‐click the VIB creation choice
(the choice differs by development kit) from the right‐click menu.
The VIB Editor displays in a pane in the Workbench UI.
2 Select the descriptor.xml tab at the bottom of the pane.
3 Find the acceptance level tag in the file.
For example, the default setting might be as follows:
<acceptance-level>community</acceptance-level>
4 Edit the tag directly in the interface and then save the file.
Select one of the following values: certified, accepted, or partner.
(You do not sign VIBs that carry the community acceptance level.)
Build the VIB by clicking Build VIB Package in the VIB Editor.
Set the Acceptance Level on Your Test ESXiThe acceptance level on your test ESXi host must match the test key on your test VIB, and the matching test
certificate must also be installed on your host ESXi host.
If you have not already done so, make sure the acceptance level on your test ESXi is the same as the test key
with which your test VIB is signed. For example, you can get test host the acceptance level and the reset it:
esxcli software acceptance get<prints the current acceptance level>esxcli software acceptance set --level=<level matching your test VIB>
Installing Your Test VIB on a Test ESXi HostYou can install your test VIB on a test host using Workbench or the command line.
“Installing a VIB Using the Workbench UI” on page 91
“Installing a Signed VIB Using the Command Line” on page 91
“Installing an Unsigned VIB Using the Command Line” on page 91
Table 8-3. Descriptor.xml Acceptance Levels
Acceptance Level Name Term to Use in the Descriptor.xml File
VMwareCertified certified
VMwareAccepted accepted
PartnerSupported partner
CommunitySupported community

VMware, Inc. 91
Chapter 8 Signing VIBs for Test and Production
Installing a VIB Using the Workbench UI
1 With the project expanded in the Project Explorer, expand build and select the VIB.
2 Select Install Package from the right‐click menu.
The Install Wizard displays with the file to install already selected. You can browse to a different file.
3 Click Add Target to choose the ESXi hosts where you will install the VIB.
The New Connection wizard displays.
4 Select ESXi and click Next.
5 Fill in the Host name (the Connection name is filled in and mirrors the Host name) and optionally add a
Description.
6 Enter the user name and password for the ESXi system and click Next or Finish to return to the Install
Wizard.
7 Select the ESXi host by clicking the check box next to the host name.
You can add multiple targets by clicking Add Target again and repeating the add target process until you
have all the targets you need.
8 When you have added all the desired targets, click Next.
9 Click Install.
Installation of the VIB package starts on the ESXi hosts you have selected. This can take a few minutes.
When installation is complete you receive a results message in the text box. If there is a failure, an error
message displays in the text box.
10 Click Next to see the Installation Summary for each ESXi host.
11 Click Finish to dismiss the installation wizard.
Installing a Signed VIB Using the Command Line
Once the VIB has been signed with the appropriate test key, install it using the following esxcli command:
esxcli software vib install
Installing an Unsigned VIB Using the Command Line
For development purposes only, if you wish to install your unsigned VIB to the test host, you can use the
command line, as shown in the example that follows. Note that you must first set the acceptance level of the
test host machine to CommunitySupported. When you are ready to have your module go through certification
testing, you must use Workbench to sign your module with the acceptance level for which you wish to certify.
Example 8-1. Installing a Test VIB Using the -no-sig-check Option
First set the test host machine’s acceptance level to CommunitySupported:
<!-- optionally, you can check to see what the level is set to first -->esxcli software acceptance get<!-- prints the current acceptance level -->esxcli software acceptance set --level=CommunitySupported
Then install the test VIB using the -no-sig-check option:
esxcli software vib install -no-sig-check
CAUTION If you are installing an unsigned VIB for testing purposes, you must change the acceptance level on
the test ESXi to CommunitySupported, or the install will fail.
VMware Workbench Getting Started Guide
92 VMware, Inc.
Changing the hostʹs acceptance level to CommunitySupported should only be done in a testing environment
that is isolated from other hosts. Doing so in a production environment will affect the supportability of the
host by VMware and partner support organizations. If you are using the CLI to install your unsigned VIB, the --no-sig-check option bypasses digital certificate validation of the installed package, which is allowable for
your own testing environment, but in production could completely compromise the integrity of a host. This
must never be done in production and must never be suggested to your customers
Signing Your VIB for Production and DistributionAfter you have certified your host extension with VMware, you receive a formal key and certificate with which
you will sign your VIB for production and distribution of your host extension. Use the following process for
signing your VIB.
1 Store the key and certificate files in a secure location on your development machine.
2 Verify that the descriptor.xml file has the correct acceptance level (the one you certified for).
3 Locate and double‐click the build‐bundle.inc file for your project in the Project Explorer.
4 Edit the following lines in the build-bundle.inc file to include the location of your formal key and
certificate files. For example, substitute the path to your key and certificate in the appropriate certification
level. If your secure location path is /your/secure/location and your acceptance level is certified, the file would have the following lines:
CERTIFIED_DEV_SIGNING_PREFIX = /your/secure/location/vmware
5 Save the file and then generate your VIB.
For example, after saving the file, you can open the VIB Editor (right‐click on the project and select
Create/Edit VIB xml), and click Build VIB Package.
Verifying Remote InstallationTest that your module deploys successfully before submitting it to VMware for certification. As a best practice:
Install your VIB using the command esxcli software vib install. For more information, refer to the
esxcli documentation found at vmware.com.
Make sure your VIB will also deploy successfully using the vCenter Update Manager (VUM). For
complete instructions on using Update Manager, see the vCenter Update Manager documentation.
Before you distribute your Host Extension module to your customers, a best practice is to make sure it will
deploy successfully using the vSphere Update Manager.
Install Your Module Using vCenter Update Manager
Use the following steps to install your module using VUM:
1 Install and configure VUM, according to VMware instructions.
2 Import the offline bundle you created for your module into the VUM package repository by selecting the
“Import Patches” option and browsing to the bundle.
3 Create a baseline containing the bundle. Be sure to choose a “Host Extension” type for the baseline.
4 Optionally add the new baseline to a baseline group.
5 Attach the baseline or baseline group to one or more hosts.
6 Scan and remediate to install your module on the desired hosts. Update Manager will put the hosts in
maintenance mode and reboot if necessary as part of the installation process.
For complete instructions on using vSphere Update Manager, see the “Installing and Administering VMware
vSphere Update Manager” documentation available from VMware.
VMware, Inc. 93
9
The Log Browser in the Workbench UI supports the viewing and analysis of vSphere and Workbench log files.
This chapter presents the following topics:
“Loading Log Files into Workbench” on page 93
“Tour of the Workbench Log Browser” on page 94
“Recording a Log Browser Session” on page 95
“Displaying and Using the Activity Graph” on page 95
“More About the Log Browser UI” on page 97
Log Browser features are also available in the vSphere Web Client, however they operate faster in Eclipse or
VMware Workbench, and you can choose to display an activity graph.
Loading Log Files into WorkbenchThe Workbench Log Browser works by creating .logx files in a designated folder. Rather than open log files directly, Log Browser is driven by these .logx configuration files, which tell Eclipse where to find a set of logs
on local disk, or how to import a set of log files across the network. The .logx files also describe how to parse the log files into columns for display in a table.
Prerequisite To fetch logs from a remote system, if you have a network proxy set, you first must add the
system’s hostname or IP address to the Proxy bypass list in Window > Preferences > Network Connections.
When you open (or double click) a .logx file in the Project Explorer pane, a tabular display with controls
appears in the same pane where the Dashboard appeared. You can then filter, highlight, and examine the log.
To start using the Log Browser
1 In VMware Workbench, click File > New > Log Analysis.
Or to analyze logs associated with a project, select the project and right click New > Log Analysis.
2 To the right of the Source host drop‐down list, click Add.
3 In the Select Remote System Type dialog, click ESX for an ESXi host, Virtual Center for vCenter Server,
or another choice. You will probably be asked for a password.
4 Back in the Log Host and Format Selection dialog, choose a Log Format. You can either Browse to an
existing Project container, or type in the name of a new folder to be created.
For vCenter Server Appliance, you will need to know the parent directory where your log files reside. For
example, the vpxd logs appear in the /var/log/vmware/vpx directory.
For an ESXi host, you can select Standard Log Collection and get most of the available log types.
5 In the Project container area, double click (or open) one of the .logx files. A new middle pane appears.
Using the Workbench Log Browser 9
VMware Workbench Getting Started Guide
94 VMware, Inc.
To analyze Log Browser entries
1 With a log that scrolls past the end of pane, type a search term in the text box on upper left and click Filter.
To make the filter more precise you can enable Case sensitive.
2 To restore all lines in the log, click Unfilter.
3 You can display context around a matching filter term, and show one (1) or more adjacent lines in the log,
by changing 0 in the drop‐down list between Filter and Case sensitive. The lines of context appear with
alternating green and white backgrounds.
4 Instead of or in addition to filtering, you can emphasize a term by typing in the text box on upper right
and clicking Highlight. The term appears in yellow.
5 There are two tabs at the bottom of the pane, one saying Log Viewer, the other giving the .logx file name.
If you click the second, it shows the XML definition for retrieving and formatting this log type.
Tour of the Workbench Log BrowserOnce you have a set of .logx files in a project, and open one of them, you can browse logs using directives in
the vLogBrowser menu or Eclipse toolbar.
Opening an Existing Log Project
You can open an existing log analysis file that you saved to the Project Explorer by expanding the project name
and double‐clicking the .logx file. The file opens in a Workbench Log Browser view.
Enhanced Search with Named Filters
In addition to simple keyword filtering, you can perform more complex filtering using the Named Filter
facility. With a Log Viewer pane displayed, find the Eclipse menu and click vLogBrowser > Filter. The toolbar
contains the same icon as a shortcut.
A dialog box appears, Keyword Filtering with a Named Filter. By default the Filter Source is the current .logx file, but you can also open other .logx files, or take filters from a file on disk.
You can create a new named filter by adding keyword or regular expressions and using And/Or/Not boolean
operators, then clicking Save. Later you can use the Named Filters drop‐down list to choose that saved filter
by name. You have a drop‐down box to include 1 or more adjacent lines. When ready, click Save and Filter.
Only filters from this .logx file can be applied to the log. Filters from other sources can be viewed, but must
be saved to this .logx file before you can edit or apply them.
Copying Log Entries to Clipboard
To search for log entries that match a search string, find the Eclipse menu and click vLogBrowser > Find. The
toolbar contains the same icon as a shortcut.
In the Find by keyword dialog box, you can click either Find All or Find next. In either case, click Close then
vLogBrowser > Copy to copy all these log entries to your desktop Clipboard.
Finding and Synchronizing Time Stamps
To see a log entry created near a certain time, in the Eclipse menu click vLogBrowser > Find or Adjust Date.
The toolbar contains the same icon as a shortcut. In the Find by Timestamp or Adjust All Timestamps dialog,
use the date and time picker to select a month and date, optionally change time, and click Find.
If you want to synchronize time stamps between logs, click the Sync button in both .logx browser windows,
and the matching log entries that are nearest your specified time will be highlighted in both windows.
The Sync button also works without the dialog box. If you highlight a log entry in one .logx browser window
a nearby timestamp will be highlighted in other .logx browser windows with Sync button checked.
VMware, Inc. 95
Chapter 9 Using the Workbench Log Browser
You can also adjust time stamps, for instance to correct clock skew. This adjustment does not affect the actual
log entires, only the display in the .logx browser window. To adjust time stamps, specify a date and time and
click Find. In the box underneath Time, specify the date and time to adjust and click Adjust. The adjusted
appearance appears in red, and the time difference (as an offset minus or plus) appears beneath. To undo the
time adjustment, click Clear Adjustment.
Refreshing a Log
To reload the log entries in a .logx file, click vLogBrowser > Refresh. The toolbar contains the same icon as a
shortcut. The lower right corner of Eclipse shows a progress bar for the refresh.
To view information about a loaded or refreshed .logx file, click vLogBrowser > View Log Info. The toolbar contains the same icon as a shortcut. The Log File Information dialog shows the source host, the full path and
filename, the time stamp, and the file size in bytes. Log files are listed in chronological order.
If there is a log file on the local system that you want to add to the list, click vLogBrowser > Add Log Files and
browse to the location of the local log file.
Click vLogBrowser > Export to export the current .logx file, in a variety of formats (XML, text, JSON, CSV)
to a local file, in your Eclipse workspace by default. You can export all events, or a subset of filtered events.
Cheat Sheets
Eclipse offers Cheat Sheets to introduce certain features.
VMware implemented three cheat sheets to explain Log Browser. Two of those cheat sheet topics are not
covered in this chapter: importing a remote log file into the local project, and opening a local log file.
Recording a Log Browser SessionYou can create a recording of some or all the actions that you take in the log browser. The recording is stored
as a shell script (lb-script.sh) that can be replayed from the command line, edited, or embedded in another
shell script. For more information about the command‐line, see Appendix A, “Log Browser Command Line,”
on page 99.
Start and stop recording
1 Start the recording of log browser actions by clicking the red start recording icon.
2 In the Select a file to save generated script contents pop‐up window, either accept the default name
(lb.‐script.sh) and location (inside your project folder), or choose your own name and location, and click
OK.
If you are attempting to overwrite an existing script with the same name and location, a warning pops up.
Click OK to continue overwriting an old script, or click Cancel to rename or relocate the script.
The icon changes to the stop recording icon.
3 After you perform the log browser actions you want to record, click the stop recording icon:
Displaying and Using the Activity GraphThe log browser includes an activity graph view that can show activity from multiple log files over a period
of time. Activity graphs can be useful to identify irregular activity, such as a system reboot or a peripheral that
stops responding.
NOTE You can view cheat sheets for Workbench Log Browser by clicking Help > Cheat Sheets then expanding
VMware vLogBrowser to select the desired cheat sheet.

VMware Workbench Getting Started Guide
96 VMware, Inc.
Open the Activity Graph
1 From the Window menu, click Show View > Other.
2 From the Show View dialog box, expand VMware.
3 Click Activity Graph and click OK.
Figure 1. Activity Graph displaying three logs
Display log files in the activity graph
1 Click the plus (“+”) icon at top right of the activity graph to open the Add Log File(s) to Graph dialog box.
2 Select one or more log files that you want to display. Click OK.
The dialog box displays the log files already open in Workbench Log Browser. Each log is represented by
a separate time line with the time scale spread out on the horizontal axis.
You can enlarge the activity graph window by clicking the Maximize button on upper right, and return
to original size by clicking the Restore button (same location, different name and shape).
3 Adjust the time scale on the horizontal axis in one of three ways:
a In one of the time lines, click and drag the cursor across an area of the time line that you are interested
in expanding. When you release the cursor, the area you highlighted is expanded to fill the entire time
line. The time scale is adjusted on the bottom axis.
b Select one of the Zoom chart links at the top of the activity graph: 1min, 1hour, 1day, 1week, 1month.
The time line at the bottom changes to display the activity during that time interval.

VMware, Inc. 97
Chapter 9 Using the Workbench Log Browser
c Click the Zoom In or Zoom Out (magnifying glass) buttons to uniformly expand the time scale or
shrink the time scale.
There are upper and lower bounds to the zoom scale. You will receive a warning message if you
Zoom In to less than 100 ms, or Zoom Out to more than 10 years.
4 Use the Zoom Back and Zoom Forward (yellow arrow) buttons at the top of the activity graph to move
backward and forward through previous zoom settings.
5 To scroll through the entire log, move the Scroll chart horizontal slider at the top left of the activity graph
to move the view left or right.
More About the Log Browser UIThe vLogBrowser pane displays formatted log entries. Each log entry is formatted into columns. For
VMkernel logs, the column headers are: #, Date, CPU, World ID, and Entry. For hostd and other logs the column headers are: #, Date, Source and Entry (log text).
In the log browser, you can perform the following tasks:
Double‐clicking an entry causes a dialog box to open, displaying other text associated with the log entry.
Click OK when you are ready to dismiss the dialog box.
Filter for specific keywords by typing the keyword into the unlabeled text box on the top left of the
Workbench Log Browser view and clicking Filter. The button is a toggle. If you wish to return to the
unfiltered view of the log, click Unfilter.
Before clicking Filter, if you want to see the log entries immediately surrounding the entry with the
keyword, select the number of surrounding entries to display from the numerical drop‐down menu.
Sort the log entries by any column by clicking the column header once to sort in ascending order and click
again to sort in descending order. Restore the original order by clicking the number (“#”) column header
to get ascending order.
Synchronize log entries in multiple log browsers by a specific timestamp. Select the Sync check box in
each log browser that you want synchronized. Select a time stamped entry in one of the browsers. The
other log browsers have the log entry closest to that timestamp selected.
Click the <log_file_name.logx> tab at the bottom of the vLogBrowser pane to see the .logx configuration file (XML formatted).
You can customize this log view by editing the XML in the .logx file. To see the changes, save, close and reload the file.
Various actions are available in the right‐click menu, from the task bar icons, or from the vLogBrowser
menu in the VMware Workbench menu bar:
a Filter – The Keyword Filtering with a Named Filter dialog box displays.
In the Choose a Filter Source area, select one of the radio buttons: This .logx file, Filters file (and
Browse for the file), or Other open .logx files (select the file from a drop‐down list).
To create your own named filter, type a name in the Named Filters field or select an already existing
named filter from the drop‐down menu. Edit or accept the keywords for the filter in the regular
expression formatting fields that follow. If you want to include lines surrounding the filtered lines,
choose the number to include in the Include # Surrounding Lines selector.
To save your new named filter or edited filter, click Save.
To delete the filter in the Named Filters field, click Delete Filter. To clear the regular expressions form,
click Clear Form.
IMPORTANT Double‐clicking on an individual line in the activity graph causes the corresponding entry
in the log browser to be highlighted.

VMware Workbench Getting Started Guide
98 VMware, Inc.
To save the new or edited Named Filter and filter the .logx file, click Save and Filter. To unfilter the .logx file and clear the regular expression form, click Unfilter and Clear Form.
b Find – The Find by keyword dialog box displays. Enter the keyword to search for in the Keyword
text box. Click Find All to see all entries in the log browser containing the keyword selected. Click
Hide to close the dialog box. Click Find next to find the next instance of the keyword in the log
browser.
c Find Next – When selected, takes you to the next entry containing the keyword you searched for
previously. If you haven’t selected keyword, it opens the Find by keyword dialog box.
d Find or Adjust Date– The Find by Timestamp or Adjust All Timestamps dialog box displays.
To find a specific timestamp, type the desired timestamp in the Date Input field and click Find to go
to the first entry in the log with that timestamp.
Or you can construct the timestamp using the calendar and clock controls in the dialog box. Changes
you make using the calendar controls are reflected in the timestamp shown in the Date Input field.
For example, changing the month to February changes the timestamp month to 02. For the time
portion of the timestamp, highlight a section of the clock display and click the buttons on the right to
increment or decrement the number. For example, highlight the hour, and click the bottom button to
decrement the hour number.
To adjust all of the timestamps in the log, set the desired timestamp in the Date Input field, and click
Adjust. You can revert to the original timestamp by clicking Clear Adjustment.
e Highlight – The Highlight a keyword dialog box displays. Type in the keyword to highlight and
click Highlight. All instances of the keyword in the log are highlighted. Click Unhighlight to turn off
the highlighting. Click Hide to close the dialog box.
To highlight keywords using the Highlight button on the Workbench Log Browser interface, type in
a keyword in the unlabeled text box on the right side of the Workbench Log Browser view and click
Highlight. The button is a toggle. If you wish to remove highlighting of the keyword, click
Unhighlight.
f Copy – Copy the selected entry or entries to the clipboard. You can open a text editor and paste the
entries into a document.
g Refresh – If additional log entries have been added to the log since you started analyzing it, you can
select Refresh from the menu to bring those additional entries into the view. This works for logs on
the local file system as well as logs from the ESXi hosts you are connected to.
h View Log Info – A pop‐up window displays the list of logs and their locations that you currently
have loaded in this Workbench Log Browser project.
i Add Log Files – Add local logs files to an existing Workbench Log Browser project (.logx file). The Add local log files to table dialog box displays. Browse to the log directory and select one or more
logs to add. Click Add to add the files to the .logx file. The log display refreshes to include the new entries.

VMware, Inc. 99
Workbench Log Browser packages include a command‐line client (vmwb-lbcli) and server (vmwb-server) that allow you to operate on logs, log bundles, and recorded log sessions using the command‐line. This
appendix covers the following topics:
“Command‐Line Client Use Cases” on page 99
“Where to Find the Command‐Line Client‐Server” on page 100
“Using the Command‐Line with the Workbench GUI” on page 100
“Using the Command‐Line Client with the Standalone Server” on page 101
“Permission Issues when Retrieving a Recorded Log Browser Session” on page 101
“Command‐Line API Reference” on page 102
“Use Case Examples” on page 102
“Known issues/Limitations” on page 107
“Advanced Use Cases” on page 107
Command-Line Client Use CasesThis command‐line client is meant to enable use cases such as the following:
Using the log browser during headless automated testing.
At whatever point is appropriate in your tests you can run a shell script that connects to a remote system,
downloads certain types of logs and looks for patterns that indicate that failures or errors occurred.
Creating scripts of repeated actions.
If you need to do a repeated sequence of actions on a given type of log, for example once for each of a
number of different hosts, you can create a script that performs those actions for you, such as connecting
to the host, downloading certain types of logs, and applying a filter to that log.
Using the log browser as a qualification tool for known defects.
Log analysis is often the primary means of identifying defects. It would be helpful to quickly identify if a
log bundle matches a pattern that corresponds to a known defect. The log browser command‐line enables
this sort of analysis. You can load the log bundle and then apply filters and search the log for matching
entries.
Doing manual log analysis from the command line
If the system in which you are doing log analysis is a purely command‐line system, it is convenient to do
log analysis activities like loading a log bundle, applying a filter and printing the results on the screen or
to a file right from the command‐line without needing to run any sort of GUI application.
Log Browser Command Line
VMware Workbench Getting Started Guide
100 VMware, Inc.
Where to Find the Command-Line Client-ServerThe Workbench Log Browser command‐line client‐server feature is available in the following packages:
“Workbench Log Browser Update Site Plug‐in for the Workbench Appliance” on page 100
“Workbench Log Browser Native Eclipse IDE” on page 100
Workbench Log Browser Update Site Plug-in for the Workbench Appliance
The command‐line client and server are automatically installed when you download and install the
Workbench Log Browser plug‐in in the Workbench GUI (Help > Install New Software). When you install the
update site, it installs the command‐line only log browser server (vmwb-server) and the Log Browser
command line client (vmwb-lbcli). The executables are automatically added to your path in the virtual
machine.
Workbench Log Browser Native Eclipse IDE
The install packages for the native Eclipse version of the Log Browser, are self‐contained platform‐dependent
ZIP files. Each platform specific package includes the command‐line only log browser server (vmwb-server) and the log browser command‐line client (vmwb-lbcli), and incudes a full working instance of a subset of the
Workbench tools (including the Log Browser GUI) that can run on any machine.
The advantage of this package is that it can be used on any pre‐existing host of your choosing. The packages
are lightweight in the sense that they require no installation. Each package is a ready‐to‐use archive that you
extract to your preferred directory.
To be able to launch the log browser server or command‐line client from any shell, you must add them to the
path.
The following is a list of the available platform‐dependent packages:
rcp‐toolsuite‐lin64‐3.5.0.*.zip
rcp‐toolsuite‐mac64‐3.5.0.*.zip
rcp‐toolsuite‐win32‐3.5.0.*.zip or rcp‐toolsuite‐win64‐3.5.0.*.zip
Using the Command-Line with the Workbench GUITo use the command‐line client, you can either enable the server from the Workbench GUI (VMware >
Preferences) or start the server from the command‐line. If you want to move back and forth from the client
command‐line to the Workbench GUI, enable the server inside the GUI.
The advantage of using the command‐line client in the context of the Workbench appliance is the seamless
interoperability between the command line client and GUI operations. Logs that you open in the GUI will be
available in the command line, and the reverse is also true, that is, logs opened in the client are available in the
GUI. In the GUI also, you can record log browser sessions to create scripts (which are just a sequence of log
browser commands).
The disadvantage of using the client with the Workbench GUI is that the Eclipse GUI must be running, thus it
cannot be started from a shell. Another perceived disadvantage might be that the Workbench uses a fixed port
number for the server. This means there can only be one server instance running on a given host. This
limitation can be overcome with the standalone server.
CAUTION Log Browser requires 64‐bit Java for Mac and Linux and either 32‐bit or 64‐bit Java for Windows.
The JVM is no longer packaged with the toolsuite. Download and install either a 32‐bit (for Windows only) or
64‐bit JVM for your platform from http://www.java.com/en/download/manual.jsp.
If you are using the 32‐bit Windows JVM, be sure to set JAVA_HOME and your PATH locally. If you set the
JAVA_HOME variable globally, 64‐bit‐reliant packages will not find the correct JAVA package.
VMware, Inc. 101
Log Browser Command Line
Enable the server from the Workbench GUI
1 In the Workbench GUI, select Windows > Preferences to open the Preferences page.
2 In the Preferences page, expand VMware and select Web Server to display the Web Server options.
3 Select the Enable web server on start up check box, click Apply.
4 (Optional) To check if the web server has started, click Check Status.
5 Click OK to exit the Preferences page.
Using the Command-Line Client with the Standalone ServerThe new command‐line only server (vmwb-server) can be used to run the server manually from any shell. The
server must be provided a path to a location to use for a workspace, that is a place to cache log files that are
read during the process of log analysis. This workspace location must be unique to this server instance and
cannot be shared with other server instances or with the IDE.
When you start the command‐line server, it dynamically allocates ports that clients use for communication.
The server records these ports in a file in the current users home directory so that when the vmwb‐lbcli
command‐line client starts, it can read these values and know what ports to connect to. This functionality is
seamless from your perspective as a user.
Start the command-line server from the command line
1 Open a terminal inside the Workbench virtual machine.
2 The server can be started in the background, for example:
$ vmwb-server /path/to/your/workspace &
The IDE currently is configured to use a fixed default port of 12443 for the server. You can start the server at the command in a mode where it also uses this same default port by doing:
$ vmwb-server /path/to/your/workspace --default-port &
Of course this mode means that you cannot start more than one instance of this server on a given host since it
uses the same port number.
If you cannot have the server on the default port, you can manually specify which port(s) you would like it to
use. There are actually two ports, one for the web services (12443 by default) and one for an administration
interface (12221 by default). In the example that follows, the command is given with a value of 0 (which causes
the dynamic allocation of the ports) but you can change this value to anything you wish.
$ vmwb-server /path/to/your/workspace --https-port=0 --admin-port=0 &
The command‐line client application for the current user (the user that started the server) will automatically
figure out the ports to use.
Permission Issues when Retrieving a Recorded Log Browser Session By default on the Workbench virtual appliance, the IDE is run as root even though you may be logged in as
a normal user (for example, the vmware user). One side effect of this is that files that are created by the IDE, such as the recorded shell script/batch file, are owned by root by default. If you log into Workbench as root, you will not have any permission issues in retrieving the recorded log browser session script. However, if you
have logged into Workbench as a regular user, such as vmware, you will lack permissions to do anything with
the script. To fix this, use one of the following commands to change the permissions:
Change ownership of the file.
sudo chown vmware:vmware lb-script.sh
Change permissions of the file so that user vmware can access it.
sudo chmod o+rwx lb-script.sh

VMware Workbench Getting Started Guide
102 VMware, Inc.
Command-Line API ReferenceThis section describes the command‐line client API and contains the following topics:
“Command Syntax” on page 102
“Getting the List of Available Commands” on page 102
“Getting Help on a Particular Command” on page 102
Command Syntax
The command‐line client, vmwb-lbcli, has syntax consistent with tools like git or p4 from the command line,
that is, you give the executable name, a command, command specific option, and then command specific
arguments, if applicable.
There are many options that are common to various commands such as --project, which specifies the name
of the project you are operating on, as well as --resource which is the resource within the project. Many of
these commands can inherit the values for the command from the environment, if certain environment
variables are defined. For example, if you do not specify the --resource option for a command that requires
it, the value of the VMLB_RESOURCE environment variable, if defined, will be used. See the help for particular
commands to see which variables are applicable if you desire to use this facility.
Getting the List of Available Commands
$ vmwb-lbcli helpvmwb_lbcli <command> [options] define Define an additional user provided logx file type to the log browser server. save Save the specified filter. count Print the number of log entries currently filtered in. select Select a log to be loaded in the log browser server. adjust Adjust log entry timestamps by the specified time value. delete Delete bundle and cached files for the project host. Optionally specify
particular resource. download Download and analyze a log file from the given host. print Print the specified log entries to the console. find Find the index of log entries that match the specified pattern. filter Appy the filter with the specified name. The filter must have already been added. getfilter Get filters/a single filter if name specified. help Display top level help information. version Display program version number.
Getting Help on a Particular Command
For detailed help on a particular command, type the following:
vmwb-lbcli help <command>
Use Case ExamplesThe section lists some possible use cases and the client commands:
“Printing Log Entries to the Console” on page 103
“Downloading Log Files from a Remote Host for Analysis” on page 103
“Discovering Logs on a Host” on page 104
“Downloading All Logs for a Host” on page 104
“Getting the Count of the Total Number of Visible Log Entries” on page 104
“Printing Log Entries to stdout” on page 104
“Applying a Simple Filter” on page 104
“Exporting Entries to a File” on page 105
VMware, Inc. 103
Log Browser Command Line
Using client commands, you can do the following tasks:
Aggregate logs from multiple sources and combine them.
Load a subset of log types from a log bundle.
Count the number of log entries in a given log (unfiltered or filtered).
Find log entries that match patterns.
Print log entries to output files, and print in various formats (txt, xml, json, csv).
Adjust time stamps in logs.
Printing Log Entries to the Console
Print the specified log entries to the console.
vmwb_lbcli print [options] --count <arg> Optional max count of the number of entries to display. Defaults to 30. You may also specify 'all' in order to fetch all log entries. --first <arg> Optional 1 based entry number of the first entry to display. --format <arg> Optional format for the output. Must be one of json,xml,txt. Default is txt. --lbserver <arg> The host name of the log browser server to connect to. If not provided looks for env variable VMLB_SERVER, and then defaults to localhost. --noextra If given, suppress printing of 'extra' lines in the output, leaving only the first line of a given log entry as the value emitted. Default is to emit the extra lines. --nofilter If given, the printed results are the UNFILTERED log entries. By default the entries printed are a result of the currently applied filter. --outfile <arg> Redirect the output to the specified file instead of stdout. --project <arg> The name of the project. If not provided looks for env variable VMLB_PROJECT. --resource <arg> The name of the resource. If not provided looks for env variable VMLB_RESOURCE. --verbose Verbose display of results if available.
Downloading Log Files from a Remote Host for Analysis
The download command allows you to connect to a remote host, collect a particular type of log file from it, and
open it for analysis:
$ vmwb-lbcli download --host=192.168.1.106 --htype=esx --user=root --project=test --type=hostd[Enter password for connection:]
Values for --htype can be the following:
:The command shares the workspace of the server it connects to, and by implication it also shares all projects,
log analyses, and cached target credentials that the server has.
In this example, the user had not connected to this target yet, and because the command did not explicitly
specify the password with the --password switch, it prompted the user for it.
For subsequent commands, the password does not have to be entered again because the credentials are cached
in the servers secure storage. In the following example, a later download of a different log file type, it is not
necessary to specify the user name and password. The cached ones from the connection above are used.
$ vmwb-lbcli download --host=192.168.1.106 --htype=esx --project=test --type=VMkernel$
Table A-1. Values for the --htype Option
vc= Windows VC
vcva= Linux VC
esx= ESXi host
ssh= SSH Server

VMware Workbench Getting Started Guide
104 VMware, Inc.
After downloading the files, if you have the Workbench IDE running, you will see projects that have been
created as a result of these commands. The projects include the server it connects to, as well as a new remote
systems target for the host that was specified in the command‐line.
Discovering Logs on a Host
If you do not know the types of logs that your remote system supports, the download command can give you
some guidance. Omitting the --type argument causes the system to return an error message that lists the
allowable types:
$ vmwb-lbcli download --project=myProj --host=192.168.1.106 --htype=esx --user=root --password=VMwar3rules
ERROR: Log type must be supplied. Allowable values for this host include vmware,VMKernel,hostd,shell,syslog,vpxa,fdm,VMKwarning.
Downloading All Logs for a Host
The download command supports --type=all as a way to load all known log types for the specified host:
$ vmwb-lbcli download --project=myProj --host=192.168.1.106 --htype=esx --user=root --password=VMwar3rules --type=all
Loaded 8 log file types to project myProj: vmware 192.168.1.106_vmware.logx VMKernel 192.168.1.106_VMKernel.logx hostd 192.168.1.106_hostd.logx shell 192.168.1.106_shell.logx syslog 192.168.1.106_syslog.logx vpxa 192.168.1.106_vpxa.logx fdm 192.168.1.106_fdm.logx VMKwarning 192.168.1.106_VMKwarning.logx
Getting the Count of the Total Number of Visible Log Entries
The count command gives you the count of the number of log entries that are visible with the current filter
applied (if there is one). There is an additional --nofilter command line option that will give you the
unfiltered count if you wish to get that without removing the filter. In the example that follows, the number
that shows below the command is the answer returned by the system.
$ vmwb-lbcli count --project=test --resource=192.168.1.106_hostd.logx471686
Printing Log Entries to stdout
The print command, used to print log entries, is flexible in terms of the format of the reporting (txt, xml, json), as well as the number of entries it prints and the starting entry. You must specify at least the project and
resource within the project as arguments to the command. Other arguments, such as formatting, are optional.
The following is an example of the default behavior, which is to print the first 30 entries matched by the
currently applied filter, if one exists. In this example, there is no filter applied.
$ vmwb-lbcli print --project=test --resource=192.168.1.106_hostd.logx1 | | | Section for VMware ESX, pid=2853, version=5.0.0, build=build-623860, option=Release |
------ In-memory logs start --------2 | 2012-07-13 03:23:48.100 -0600 | FFE2BAC0 info 'Default' | Supported VMs 63 | <snip...>30 | 2012-07-13 03:23:48.104 -0600 | FFE2BAC0 info 'Default' | Trying hbrsvc |
Applying a Simple Filter
The filter command supports two kinds of filters: defining a simple filter dynamically with the --pattern option (a regex pattern), or applying a known named filter. In the following example, a simple filter is applied,
the count of filtered entries is retrieved, and the entries are printed in XML format:
$ vmwb-lbcli filter --project=test --resource=192.168.1.106_hostd.logx --pattern="Event 157"

VMware, Inc. 105
Log Browser Command Line
$ vmwb-lbcli count --project=test --resource=192.168.1.106_hostd.logx 2
$ vmwb-lbcli print --project=test --resource=192.168.1.106_hostd.logx --format=xml <logItems> <logItem> <_>411049</_> <Date>2012-08-03 16:25:32.215 -0600</Date> <Source>47B01B90 info 'ha-eventmgr'</Source> <Entry>Event 157 : User root logged out</Entry> <EntryExtraLines/> </logItem> <logItem> <_>471663</_> <Date>2012-08-03 16:25:32.215 -0600</Date> <Source>47B01B90 info 'ha-eventmgr'</Source> <Entry>Event 157 : User root logged out</Entry> <EntryExtraLines/> </logItem> </logItems>
Exporting Entries to a File
The print command is used to export entries. This can be done many different ways depending on your
needs. Several examples are given.
stdout Redirection
The normal print command directs its output to stdout. You can redirect this to a file. This particular example also demonstrates the use of the --count and --format options:
$ vmwb-lbcli print --project=test --resource=192.168.1.106_hostd.logx --count=1 --format=json > myOutput.json
$ cat myOutput.json{ "logItems": [ { "#": "411049", "Date": "2012-08-03 16:25:32.215 -0600", "Source": "47B01B90 info 'ha-eventmgr'", "Entry": "Event 157 : User root logged out", "EntryExtraLines": "" } ]}
The --outfile Option
The print command also has an --outfile option for directly specifying the output file. This option has the advantage of being able to display a percentage complete status in the console as the download of the entries
progresses. This may be of interest in the case of very large log files. The following example downloads a large
number of log entries. (The --count=all option was used to specify all log entries.)
$ vmwb-lbcli filter --project=test --resource=192.168.1.106_hostd.logx --remove$ vmwb-lbcli print --project=test --resource=192.168.1.106_hostd.logx --format=xml --count=all
--outfile=myFile.xmlDownloading log entries: 100% completeDone writing to file /home/aspear/myFile.xmldownloaded 471686 entries in 62.909s (7497 entries/sec)
NOTE In this example, the filter was first removed with the filter command before printing. The
--nofilter option on the print command could also have been used to do this without removing the filter.

VMware Workbench Getting Started Guide
106 VMware, Inc.
Finding Particular Entries and Printing Them
As an alternative to filtering, you can also use the find command to search for particular patterns. The find command by default returns the log entry number of the matching entries:
$ vmwb-lbcli find --project=test --resource=192.168.1.106_hostd.logx --pattern="Event 157"411049471663
You can print the entries in any given format using the --print option:
$ vmwb-lbcli find --project=test --resource=192.168.1.106_hostd.logx --pattern="Event 157" --print=txt
411049 | 2012-08-03 16:25:32.215 -0600 | 47B01B90 info 'ha-eventmgr' | Event 157 : User root logged out |
471663 | 2012-08-03 16:25:32.215 -0600 | 47B01B90 info 'ha-eventmgr' | Event 157 : User root logged out |
Finding Particular Entries and Failing if the Count is Not What You Expect
Both the find and count commands support a couple of additional options that can be useful for use cases
such as automated regression testing:
--fail_if_count_equal <arg> Optional integer argument to check resulting line count against.If the count is equal to this number the command fails.Mutually exclusive with the fail_if_count_not_equal option.
--fail_if_count_not_equal <arg> Optional integer argument to check resulting line count against.If the count is NOT equal to this number the command fails.Mutually exclusive with the fail_if_count_equal option.
In the following example, Failure is used in a particular log file in the case of any error, and there are 17 instances of Failure that are known issues and always emitted in the log. As a part of an automated
regression test, this log file could be checked and would fail if the count is more than 17 (failing in this case
means that the vmwb-lbcli process returns an exit code of non‐zero in addition to printing an error message
to stderr).
$ vmwb-lbcli find --project=test --resource=192.168.1.106_hostd.logx --pattern="Failure" --fail_if_count_not_equal=17
11626916(... 17 entry line numbers printed here)464835ERROR: Count 18 is not equal to fail_if_count_not_equal value 17.
Printing the Contents of a Local Log Bundle File
The bundle command allows printing of information on the contents of a log bundle, as well as loading all or
a subset of the contained log file types in the bundle.
The following example prints the available log types in a bundle:
$ vmwb-lbcli bundle /home/aspear/logfiles/gss/vcsupport-2011-10-26.16479.zipExamining log bundle /home/aspear/logfiles/gss/vcsupport-2011-10- 26.16479.zip ...Available log types: lookup Server imsTrace eam stats vpxd jointool ssoAdminServer sso-service-cfg SRM Recovery Virgo Server install cim-dia SRM Protected sms
VMware, Inc. 107
Log Browser Command Line
Loading Log Types from a Log Bundle
You can load log types from a bundle by adding one or more --load options to the bundle command. The
load options specify the log types you wish to load. The command requires that you must specify a project
name that you wish to load the given log types into. The following is an example of loading a couple of log
types:
$ vmwb-lbcli bundle --project=test2 --load=vpxd --load=stats ~/logfiles/gss/vcsupport-2011-10-26.16479.zip
Loading log bundle /home/aspear/logfiles/gss/vcsupport-2011-10-26.16479.zip to project test2 ...Loaded 2 log file types: stats Local_stats_vmsp.logx vpxd Local_vpxd_vmsp.logx
You can also specify --load=all to load all types in the bundle:
$ vmwb-lbcli bundle --project=test2 --load=all ~/logfiles/gss/vcsupport-2011-10-26.16479.zipLoading log bundle /home/aspear/logfiles/gss/vcsupport-2011-10-26.16479.zip to project test2 ...Loaded 14 log file types: lookup Server Local_lookup_Server_vmsp.logx imsTrace Local_imsTrace_vmsp.logx eam Local_eam_vmsp.logx stats Local_stats_vmsp.logx vpxd Local_vpxd_vmsp.logx jointool Local_jointool_vmsp.logx ssoAdminServer Local_ssoAdminServer_vmsp.logx sso-service-cfg Local_sso-service-cfg_vmsp.logx SRM Recovery Local_SRM_Recovery_vmsp.logx Virgo Server Local_Virgo_Server_vmsp.logx install Local_install_vmsp.logx cim-dia Local_cim-dia_vmsp.logx SRM Protected Local_SRM_Protected_vmsp.logx sms Local_sms_vmsp.logx
After the bundle is loaded, normal operations can be done against the file, such as finding, printing, and
filtering, by referencing the project and resource names (printed in the previous example):
$ vmwb-lbcli print --project=test2 --resource=Local_vpxd_vmsp.logx --count=1 --first=1010 | 2011-10-25 23:46:56.666 -0600 | EAFFF700 info 'ThreadPool' | Thread enlisted |
Known issues/LimitationsThe log browser server must be running in order for the command to work.
Currently only local log bundles can be loaded. There is no facility to download a remote a log bundle from a
Windows host, and also no integration to request a host to create a log bundle from the CLI. If you can copy
the Windows log bundles to your localhost, then they can be analyzed.
Recordings donʹt actually record the content of filters that are defined. They record the name of the filter and
the activation of filters, but rely on the filter being persisted on the server side.
Advanced Use CasesIt is possible to connect to a log browser server running on any machine you wish. By default the assumption
is that the server is connected to localhost, but the --lbserver option can be used to connect to a server on a different host. Related to this, you can also specify the port to connect on as a part of the host name, for
example --lbserver=”myServer.eng.vmware.com:12444”. Workbench Web Services are fixed on port
12443.

VMware Workbench Getting Started Guide
108 VMware, Inc.
VMware, Inc. 109
Index
Aaccessing the Internet in the virtual appliance 13
Available Software Sites link 22
available test certificates 89
available test keys 89
Ccertificates 87
check host for primary host 31
command line for VMware Workbench 14
configuring a static IP address for the VMware Workbench VA 13
connecting to an ESXi server 60
connections status 62
copy selected entries 98
creating a workspace for VMware Workbench 12
Ddashboard
actions for uninstalled packages 20
certification actions 16
certification submissions status 19
debug symbol repository 20
login troubleshooting 15
vCG preview 20
dashboard, navigating VMware Workbench with 14
dashboard, working with the VMware Workbench 15
data stores in Resource Explorer 64
debugger
connection options 73
core dump options 83
mismatched kernel detection 74, 85
shared libraries 72, 77, 84
VMkernel core dump, options 84, 85
VMkernel GDB server, options 72, 77, 81
debugger, VMkernel live options 73, 78
debugging
core dump 83
VMkernel live, options 71, 76, 80
downloading development kits 22
EESXi servers, connecting to 60
Ffilter keywords 97
find keywords 98
Hhardware requirements for VMware Workbench 9
highlighting keywords 98
how to sign a VIB 88
Iinstalling new software 22
installing test certificates on ESXi 88
installing VIBs 54
installing VIBs with Remove System Explorer 67
Kkeys 87
Llaunching an SSH terminal, problems 25
Linux, logging in 12
log browser 93
.logx file 97
action buttons 97
sorting by column 97
using 97
viewing additional text 97
viewing surrounding entries 97
viewing the XML 97
Mmanaging passwords 67
Nnetwork adapters in Resource Explorer 65
node, refreshing in Resource Explorer 65
Ppassword, clearing in Resource Explorer 65
passwords, managing 67
Preferences, managing passwords 67
project, installing the VIB 54
properties for remote systems 62
proxy issues when launching an SSH terminal 25
Rrefreshing a node in Resource Explorer 65
Remote System Explorer
details, connections status 62
installing VIBs 67
launching SSH shells or terminals 65

VMware Workbench Getting Started Guide
110 VMware, Inc.
navigation tree items 61
properties 62
SSH terminal, launching 61
Resource Explorer
clearing a bad password 65
data stores 64
ESXi connection resource properties 62
network adapters 65
refreshing a node 65
SCSI LUNs 63
storage adapters 64
virtual switches 64
results packages 34
SSCSI LUNs 63
setting proxies for VMware Workbench 12
set-up tasks before using VMware Workbench 10
sftp file operations 61
shared libraries, debugger options 84
signing a VIB 88
signing VIBs 87
sneaker-net install from portable media 21, 24
SSH command shell connection 61
SSH terminal, launch problems 25
SSH terminal, launching 61
SSH, launching remote shells or terminals 65
starting VMware Workbench remotely from Linux 11
starting VMware Workbench remotely from Windows 11
status, connections with remote systems 62
storage adapters in Resource Explorer 64
Ttechnical support resources 7
Test Manager
check host 31
VIB dependencies checking 31
test manager
before submitting VIB to VMware 44
CLI 38
email notifications 37
entering a VMware waiver approval ID 37
filing a service request (SR) 35
fixing corrupted cert files 43
importing test results 43
long running tests 42
merging split test sessions 43
parameter cache 41
recorded test sessions 38
results package 34
running an existing test session 33
setting up new test sessions 30
splitting certification tests into multiple sessions 42
submitting test results 35
tests dashboard overview 28
Uunfilter keywords 97
uninstalling software 25
Using XMing and PuTTy to start VMware Workbench 11
VVIB dependencies checking 31
VIB, installing 54
virtual machines listed in Resource Explorer 62
virtual switches in Resource Explorer 64
vLogBrowser
copy entries 98
highlighting 98
VMware Workbench
installing new software 22
WWorkbench Log Browser 93
filter and unfilter for keywords 97
find a keyword 98
using 97
XX forwarding in a remote client to start VMware
Workbench 11
XML file, log browser 97
Zzdump debugger for Userworld programs 82