vocento, s.a. vocento, s.a. and subsidiariesand ...€¦ · 1 not including sponsored links and...
TRANSCRIPT
Vocento, S.A. Vocento, S.A. Vocento, S.A. Vocento, S.A. and Subsidiariesand Subsidiariesand Subsidiariesand Subsidiaries
Results for January Results for January Results for January Results for January ---- December December December December 2009 2009 2009 2009 25252525 FebruaryFebruaryFebruaryFebruary 2020202010101010
Vocento, S.A and SubsidiariesVocento, S.A and SubsidiariesVocento, S.A and SubsidiariesVocento, S.A and Subsidiaries
2009 Results Report
http://www.vocento.com 2
Translation of a report originally issued in Spanish. In the event of a discrepancy, the Spanish-
language version prevails INTRODUCTIOINTRODUCTIOINTRODUCTIOINTRODUCTION: N: N: N: THE MACROECOTHE MACROECOTHE MACROECOTHE MACROECONOMIC ENVIRONMENTNOMIC ENVIRONMENTNOMIC ENVIRONMENTNOMIC ENVIRONMENT In an adverse global macroeconomic environment, Spain suffered in 2009 a sharp contraction in economic activity (the IMF estimates a -3.6% fall in GDP), because of the weakness of domestic demand. For 2010, the Bank of Spain (in its February bulletin) notes that world economic activity, thanks partly to expansive fiscal and monetary policy, seems to be starting on the way to recovery, at diverging paces in different countries. According to the latest estimates of the IMF, the recovery in Spain will be slower (GDP 2010e -0.6%) than in the other main countries of the Eurozone (GDP 2010e in rank +1.0% / +1.5%), with a weaker recovery in consumption based on the high rate of unemployment in Spain. In this macroeconomic environment in Spain, 2009 closed with one of the sharpest falls in advertising spend yet seen in conventional media, estimated -23.9% (according to the i2p report of Media Hot Line). Faced with a media sector that is transforming from a business based on various media to a business of brands, because of the change in the habits of the consumption of media, VOCENTO stands out because of the strength of its brands, many of which are over one hundred years old, and because of its differentiated positioning in regional and national media.
VOCENTO, in this unfavourable environment, has achieved the following goals:
i) It has outperformed the advertising market and grown its market share in 2009 in various media: decline in the paid press of VOCENTO of -21.9%, compared with the market decline of -26.5%, and growth on the Internet of +21.0% vs. +3.1% for the market1 according to the i2p report from Media Hot Line.
ii) A clear commitment to the Internet area, in order to satisfy the new habits of consuming news, leisure and entertainment, and thanks to the migration of the strength of its brands from offline media to online. According to Nielsen Netview data, in January 2010, VOCENTO is the leading media company on the Internet.
iii) Positioning in the audiovisual sector ahead of the imminent analogue switch-off with VOCENTO having the opportunity to be a major player in DTT (Digital Terrestrial Television), based on alliances with international content providers at the national level (e.g. Disney) and the regional level (e.g. Viacom).
VOCENTO has done a severe adjustment of the cost structure, in order to face up to the current crisis in the economy and to adapt its media to the new technological reality of the media business. Cost reduction plans have been focused on reducing variable costs and fixed costs such as personnel, and this has implied an investment in restructuring. Although these restructuring costs have impacted the profit and loss account in 2009 (restructuring expenses 2009 of -65,276 thousand euros), this process has also had its first results (EBITDA ex non-recurring costs 2009 higher than in 2008), and will continue to generate cost savings in 2010.
VOCENTO´s strength and leadership brands, fixed to the reduction in central corporate costs of its businesses and its sound financial position, will enable the Group to respond flexibly and efficiently among the changes in the sector.
1 Not including sponsored links and other actions (cobranding, email)
Vocento, S.A and SubsidiariesVocento, S.A and SubsidiariesVocento, S.A and SubsidiariesVocento, S.A and Subsidiaries
2009 Results Report
http://www.vocento.com 3
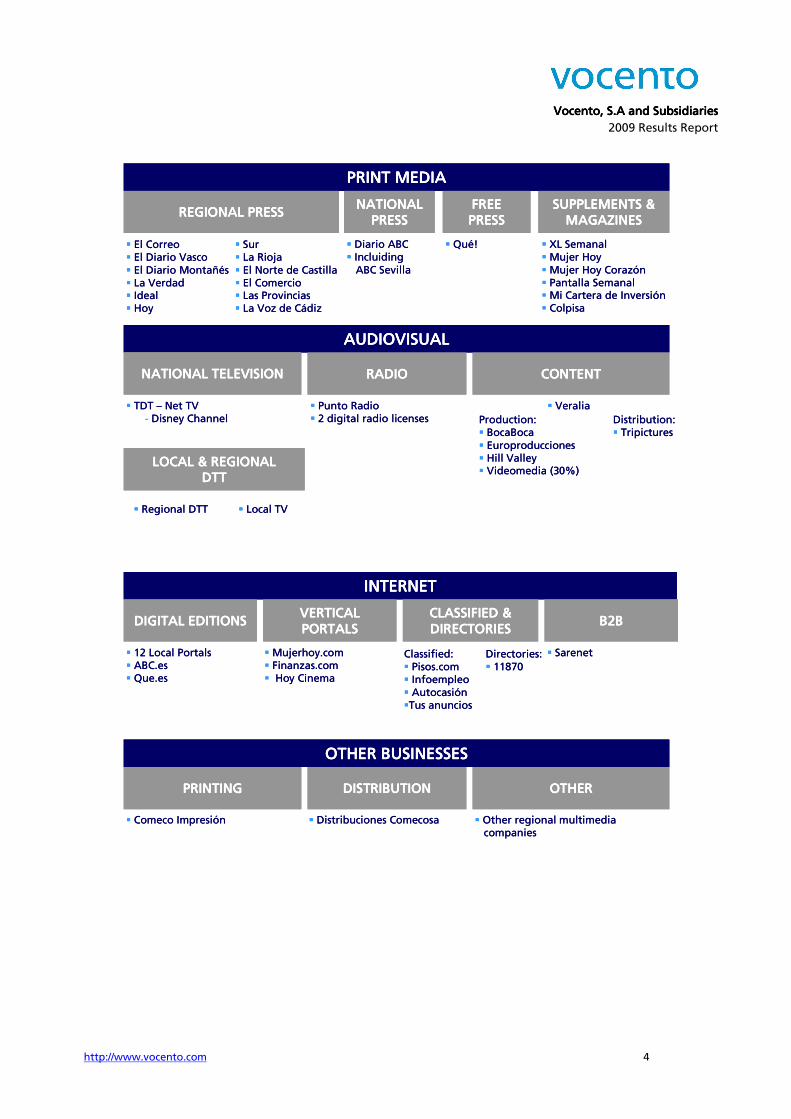
PERFORMANCE OF VOCENTO BUSINESSESPERFORMANCE OF VOCENTO BUSINESSESPERFORMANCE OF VOCENTO BUSINESSESPERFORMANCE OF VOCENTO BUSINESSES VOCENTO is a multimedia group, whose parent company is VOCENTO, S.A., dedicated to the various different areas that compose the media business. The management of VOCENTO, in order to evaluate the risks and returns of the company, structures management information along the following business lines: Print Media, Audiovisual, Internet and Other Businesses. This structuring of the information has proved useful and reliable for company management, and it is used for financial reporting to the market. The information includes all the newspapers, digital editions, local and national televisions and radio stations, etc., where VOCENTO is present, which are all allocated to their respective business lines. The comments and comparisons contained within this Management Report are based on these segments. The financial information contained in this document has been prepared in accordance with the International Financial Reporting Standards adopted by the European Union (IFRS). For information purposes, the following chart shows the areas where VOCENTO operates:
Vocento, S.A and SubsidiariesVocento, S.A and SubsidiariesVocento, S.A and SubsidiariesVocento, S.A and Subsidiaries
2009 Results Report
http://www.vocento.com 4
PRINT MEDIAPRINT MEDIAPRINT MEDIAPRINT MEDIA
REGIONAL PRESSREGIONAL PRESSREGIONAL PRESSREGIONAL PRESSNATIONALNATIONALNATIONALNATIONAL
PRESSPRESSPRESSPRESSFREEFREEFREEFREEPRESSPRESSPRESSPRESS
SUPPLEMENTS & SUPPLEMENTS & SUPPLEMENTS & SUPPLEMENTS & MAGAZINESMAGAZINESMAGAZINESMAGAZINES
� El Correo� El Diario Vasco� El Diario Montañés� La Verdad� Ideal� Hoy
� Diario ABC� IncluidingABC Sevilla
� Qué! � XL Semanal� Mujer Hoy� Mujer Hoy Corazón� Pantalla Semanal� Mi Cartera de Inversión� Colpisa
� Sur� La Rioja� El Norte de Castilla� El Comercio� Las Provincias� La Voz de Cádiz
AUDIOVISUALAUDIOVISUALAUDIOVISUALAUDIOVISUAL
LOCAL & REGIONALLOCAL & REGIONALLOCAL & REGIONALLOCAL & REGIONALDTTDTTDTTDTT
RADIORADIORADIORADIO CONTENTCONTENTCONTENTCONTENT
� Local TV
� Punto Radio� 2 digital radio licenses Production:
� BocaBoca� Europroducciones� Hill Valley� Videomedia (30%)
Distribution:� Tripictures
NATIONAL TELEVISIONNATIONAL TELEVISIONNATIONAL TELEVISIONNATIONAL TELEVISION
� TDT – Net TV- Disney Channel
INTERNETINTERNETINTERNETINTERNET
DIGITAL EDITIONSDIGITAL EDITIONSDIGITAL EDITIONSDIGITAL EDITIONS B2BB2BB2BB2BVERTICAL VERTICAL VERTICAL VERTICAL PORTALSPORTALSPORTALSPORTALS
CLASSIFIED & CLASSIFIED & CLASSIFIED & CLASSIFIED & DIRECTORIESDIRECTORIESDIRECTORIESDIRECTORIES
� 12 Local Portals� ABC.es� Que.es
� Mujerhoy.com� Finanzas.com� Hoy Cinema
Classified: � Pisos.com� Infoempleo� Autocasión�Tus anuncios
� Sarenet
OTHER BUSINESSESOTHER BUSINESSESOTHER BUSINESSESOTHER BUSINESSES
PRINTINGPRINTINGPRINTINGPRINTING DISTRIBUTIONDISTRIBUTIONDISTRIBUTIONDISTRIBUTION OTHEROTHEROTHEROTHER
� Comeco Impresión � Distribuciones Comecosa � Other regional multimediacompanies
� Veralia
� Regional DTT
Directories:� 11870
Vocento, S.A and SubsidiariesVocento, S.A and SubsidiariesVocento, S.A and SubsidiariesVocento, S.A and Subsidiaries
2009 Results Report
http://www.vocento.com 5
Highlights of the financial performance ofHighlights of the financial performance ofHighlights of the financial performance ofHighlights of the financial performance of the the the the businessesbusinessesbusinessesbusinesses
VOC VOC VOC VOC has endedhas endedhas endedhas ended 2009 2009 2009 2009 outoutoutoutperformperformperformperforminginginging the the the the advertising advertising advertising advertising market, both in the press and market, both in the press and market, both in the press and market, both in the press and on the Internet on the Internet on the Internet on the Internet
Growth in Growth in Growth in Growth in EBITDA exEBITDA exEBITDA exEBITDA excludingcludingcludingcluding no no no nonnnn----recurring recurring recurring recurring costscostscostscosts +2 +2 +2 +26666....0000%,%,%,%, restructuring impactingrestructuring impactingrestructuring impactingrestructuring impacting 2009200920092009 but enabling but enabling but enabling but enabling the the the the optimisation of the cost structure,optimisation of the cost structure,optimisation of the cost structure,optimisation of the cost structure, ----13131313....5%5%5%5%
ABC ABC ABC ABC is the only national daily to increase is the only national daily to increase is the only national daily to increase is the only national daily to increase circulationcirculationcirculationcirculation in 2009 in 2009 in 2009 in 2009 +2.0%, a +2.0%, a +2.0%, a +2.0%, andndndnd Internet Internet Internet Internet increase in unique monthly users increase in unique monthly users increase in unique monthly users increase in unique monthly users +58%+58%+58%+58%22222222
SoundSoundSoundSound financial position financial position financial position financial position: : : : net debtnet debtnet debtnet debt ----74,74,74,74,679 679 679 679 thousand eurosthousand eurosthousand eurosthousand euros,,,, and cash and cash and cash and cash and cash and cash and cash and cash equivalents of 125,518 thousand euros equivalents of 125,518 thousand euros equivalents of 125,518 thousand euros equivalents of 125,518 thousand euros
� Advertising inAdvertising inAdvertising inAdvertising in VO VO VO VOCENTO CENTO CENTO CENTO in in in in press and press and press and press and InterneInterneInterneInternet t t t isisisis outperform outperform outperform outperforminginginging the market, with the decline the market, with the decline the market, with the decline the market, with the decline slowing vs. 9M09: slowing vs. 9M09: slowing vs. 9M09: slowing vs. 9M09: Regional Press -23.3% and ABC -18.3% compared with -26.5% for the press market. Internet (represents 8.7% of total VOC advertising) +21.0%, compared with +3.1% for the market (Source: i2p report from Media Hot Line).
� EBITDAEBITDAEBITDAEBITDA growth excluding nongrowth excluding nongrowth excluding nongrowth excluding non----recurring recurring recurring recurring costscostscostscosts, despite the fall in advertising: efforts in cost , despite the fall in advertising: efforts in cost , despite the fall in advertising: efforts in cost , despite the fall in advertising: efforts in cost control and optimisation control and optimisation control and optimisation control and optimisation (-111,483 thousand euros) enable enable enable enable an an an an increase increase increase increase in EBITDA excluding in EBITDA excluding in EBITDA excluding in EBITDA excluding nonnonnonnon----recurring costrecurring costrecurring costrecurring costs s s s from 2008, from 2008, from 2008, from 2008, +26+26+26+26....0% (0% (0% (0% (36,36,36,36,880 880 880 880 thousand eurosthousand eurosthousand eurosthousand euros vs. vs. vs. vs. 29,273 thousand euros in 2008), absorbing a large part of the advertising decline: (i) Decline in advertising revenues of -76,307 thousand euros (2009 -21.7% vs. 9M09 -25.2%). (ii) Circulation revenues +1.6%, reflecting the positive performance of ABC, the only daily to
increase its circulation in 2009 +2.0% (vs. national market -10.2%), while also improving the add-ons margin.
(iii) Reduction in costs excluding non-recurring costs of -111,483 thousand euros (-13.5%), based on cost control and optimisation measures: restructuring in Print Media and Corporate Structure (EBITDA ex non-recurring costs +4,536 thousand euros), enabling a saving in personnel expenses ex non recurring costs 2009 of -11.6% vs. 9M09 -10.1%. - Non-recurring costs of -65,276 thousand euros.
� Audiovisual area Audiovisual area Audiovisual area Audiovisual area increases itsincreases itsincreases itsincreases its value value value value: improving efficiency with an improvement in recurring EBITDA ex non recurring costs of +14,427 thousand euros. Disney Channel is the leading DTT thematic channel (3.1% TNSofres Dec09), and new programming (Jan10) in Regional DTT after agreement with Viacom. Licenses awarded in Radio in Madrid, Castilla La Mancha and Extremadura.
� Internet Internet Internet Internet PositioningPositioningPositioningPositioning: VOC is the leading media company, according to Nielsen NetView2: - Digital Editions: leaders in news (migration of brand strength). ABC.es, +58%, the highest growth rate in its category and launch of Hemerotheque. VOCENTO, according to 4imn3, has 14 news portals in the top 20 news in Spain.
- Classified: Pisos.com in top #3 with 1.1m unique monthly users in one year. - Directories: 11870.com play for leisure business reaches 0.8 million u.m.u. (+67%).
� SSSSoooounununund financial position d financial position d financial position d financial position of of of of VOCENTO VOCENTO VOCENTO VOCENTO (net financial debt -74,679 thousand euros, cash and cash equivalents 125,518 thousand euros).
2 Nielsen Netview unique monthly users January 2010 (unique monthly users growth vs. January 2009) 3 4 International Media & Newspapers, excluding sporting and financial web sites.
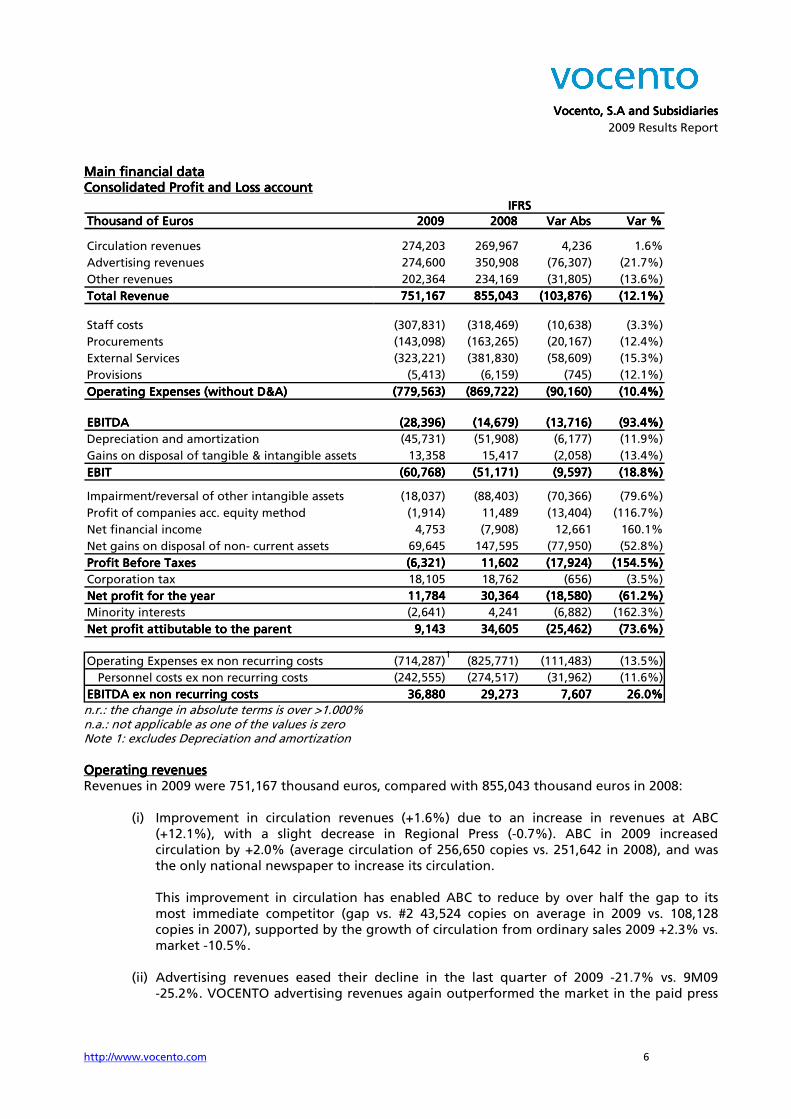
EBITDA EX NON RECURRING COSTSEBITDA EX NON RECURRING COSTSEBITDA EX NON RECURRING COSTSEBITDA EX NON RECURRING COSTS 2009200920092009 2008200820082008( Thousand of Euros)
31.061 36.252Audiovisual 10.938 (3.489) 14.427Internet (2.514) 1.852 (4.365)Other Businesses 13.687 15.486 (1.799)Corporate and Others (16.293) (20.829) 4.536
EBITDA ex no recurrentesEBITDA ex no recurrentesEBITDA ex no recurrentesEBITDA ex no recurrentes 36.88036.88036.88036.880 29.27329.27329.27329.273 7.6077.6077.6077.607
(65.276) (43.952) (21.324)
(28.396)(28.396)(28.396)(28.396) (14.679)(14.679)(14.679)(14.679) (13.716)(13.716)(13.716)(13.716)
2009200920092009 2008200820082008
31.061 36.252Audiovisual 10.938 (3.489) 14.427Internet (2.514) 1.852 (4.365)
13.687 15.486 (1.799)(16.293) (20.829) 4.536
EBITDA ex no recurrentesEBITDA ex no recurrentesEBITDA ex no recurrentesEBITDA ex no recurrentes 36.88036.88036.88036.880 29.27329.27329.27329.273 7.6077.6077.6077.607
(65.276) (43.952) (21.324)
(28.396)(28.396)(28.396)(28.396) (14.67(14.67(14.67(14.679)9)9)9) (13.716)(13.716)(13.716)(13.716)
2009200920092009 2008200820082008
31.061 36.252Audiovisual 10.938 (3.489) 14.427Internet (2.514) 1.852 (4.365)
13.687 15.486 (1.799)(16.293) (20.829) 4.536
EBITDA ex no recurrentesEBITDA ex no recurrentesEBITDA ex no recurrentesEBITDA ex no recurrentes 36.88036.88036.88036.880 29.27329.27329.27329.273 7.6077.6077.6077.607
(65.276) (43.952) (21.324)
(28.(28.(28.(28.396)396)396)396) (14.679)(14.679)(14.679)(14.679) (13.716)(13.716)(13.716)(13.716)
2009200920092009 2008200820082008
Print Media 31.061 36.252Audiovisual 10.938 (3.489) 14.427Internet (2.514) 1.852 (4.365)
13.687 15.486 (1.799)(16.293) (20.829) 4.536
EBITDA ex no recurrentesEBITDA ex no recurrentesEBITDA ex no recurrentesEBITDA ex no recurrentes 36.88036.88036.88036.880 29.27329.27329.27329.273 7.6077.6077.6077.607
(65.276) (43.952) (21.324)
(28.396)(28.396)(28.396)(28.396) (14.679)(14.679)(14.679)(14.679) (13.716)(13.716)(13.716)(13.716)
2009200920092009 2008200820082008
31.061 36.252Audiovisual 10.938 (3.489) 14.427Internet (2.514) 1.852 (4.365)
13.687 15.486 (1.799)(16.293) (20.829) 4.536
EBITDA ex EBITDA ex EBITDA ex EBITDA ex no recurrentesno recurrentesno recurrentesno recurrentes 36.88036.88036.88036.880 29.27329.27329.27329.273 7.6077.6077.6077.607
(65.276) (43.952) (21.324)
(28.396)(28.396)(28.396)(28.396) (14.679)(14.679)(14.679)(14.679) (13.716)(13.716)(13.716)(13.716)
2009200920092009 2008200820082008
31.061 36.252Audiovisual 10.938 (3.489) 14.427Internet (2.514) 1.852 (4.365)
13.687 15.486 (1.799)(16.293) (20.829) 4.536
EBITDA ex no recEBITDA ex no recEBITDA ex no recEBITDA ex no recurrentesurrentesurrentesurrentes 36.88036.88036.88036.880 29.27329.27329.27329.273 7.6077.6077.6077.607
(65.276) (43.952) (21.324)
(28.396)(28.396)(28.396)(28.396) (14.679)(14.679)(14.679)(14.679) (13.716)(13.716)(13.716)(13.716)
2009200920092009 2008200820082008
31.061 36.252Audiovisual 10.938 (3.489) 14.427Internet (2.514) 1.852 (4.365)
13.687 15.486 (1.799)(16.293) (20.829) 4.536
EBITDA ex no recurrentesEBITDA ex no recurrentesEBITDA ex no recurrentesEBITDA ex no recurrentes 36.88036.88036.88036.880 29.27329.27329.27329.273 7.6077.6077.6077.607
(65.276) (43.952) (21.324)
(28.396)(28.396)(28.396)(28.396) (14.679)(14.679)(14.679)(14.679) (13.716)(13.716)(13.716)(13.716)
2009200920092009 2008200820082008
31,061 36,252 (5,191)Audiovisual 10,938 (3,489) 14,427Internet (2,514) 1,852 (4,365)
13,687 15,486 (1,799)(16,293) (20,829) 4,536
EBITDA ex non EBITDA ex non EBITDA ex non EBITDA ex non recurringrecurringrecurringrecurring costscostscostscosts 36,88036,88036,88036,880 29,27329,27329,27329,273 7,6077,6077,6077,607
Non recurring costs (65,276) (43,952) (21,324)
(28,396)(28,396)(28,396)(28,396) (14,679)(14,679)(14,679)(14,679) (13,716)(13,716)(13,716)(13,716)
VarVarVarVar AbsAbsAbsAbsEBITDA EX NON RECURRING COSTSEBITDA EX NON RECURRING COSTSEBITDA EX NON RECURRING COSTSEBITDA EX NON RECURRING COSTS 2009200920092009 2008200820082008( Thousand of Euros)
31.061 36.252Audiovisual 10.938 (3.489) 14.427Internet (2.514) 1.852 (4.365)Other Businesses 13.687 15.486 (1.799)Corporate and Others (16.293) (20.829) 4.536
EBITDA ex no recurrentesEBITDA ex no recurrentesEBITDA ex no recurrentesEBITDA ex no recurrentes 36.88036.88036.88036.880 29.27329.27329.27329.273 7.6077.6077.6077.607
(65.276) (43.952) (21.324)
(28.396)(28.396)(28.396)(28.396) (14.679)(14.679)(14.679)(14.679) (13.716)(13.716)(13.716)(13.716)
2009200920092009 2008200820082008
31.061 36.252Audiovisual 10.938 (3.489) 14.427Internet (2.514) 1.852 (4.365)
13.687 15.486 (1.799)(16.293) (20.829) 4.536
EBITDA ex no recurrentesEBITDA ex no recurrentesEBITDA ex no recurrentesEBITDA ex no recurrentes 36.88036.88036.88036.880 29.27329.27329.27329.273 7.6077.6077.6077.607
(65.276) (43.952) (21.324)
(28.396)(28.396)(28.396)(28.396) (14.679)(14.679)(14.679)(14.679) (13.716)(13.716)(13.716)(13.716)
2009200920092009 2008200820082008
Print Media 31.061 36.252Audiovisual 10.938 (3.489) 14.427Internet (2.514) 1.852 (4.365)
13.687 15.486 (1.799)(16.293) (20.829) 4.536
EBITDA ex no recurrentesEBITDA ex no recurrentesEBITDA ex no recurrentesEBITDA ex no recurrentes 36.88036.88036.88036.880 29.27329.27329.27329.273 7.6077.6077.6077.607
(65.276) (43.952) (21.324)
(28.396)(28.396)(28.396)(28.396) (14.679)(14.679)(14.679)(14.679) (13.716)(13.716)(13.716)(13.716)
2009200920092009 2008200820082008
31.061 36.252Audiovisual 10.938 (3.489) 14.427Internet (2.514) 1.852 (4.365)
13.687 15.486 (1.799)(16.293) (20.829) 4.536
EBITDA ex no recurrentesEBITDA ex no recurrentesEBITDA ex no recurrentesEBITDA ex no recurrentes 36.88036.88036.88036.880 29.27329.27329.27329.273 7777.607.607.607.607
(65.276) (43.952) (21.324)
(28.396)(28.396)(28.396)(28.396) (14.679)(14.679)(14.679)(14.679) (13.716)(13.716)(13.716)(13.716)
2009200920092009 2008200820082008
31.061 36.252Audiovisual 10.938 (3.489) 14.427Internet (2.514) 1.852 (4.365)
13.687 15.486 (1.799)(16.293) (20.829) 4.536
EBITDA ex no recurrentesEBITDA ex no recurrentesEBITDA ex no recurrentesEBITDA ex no recurrentes 36.88036.88036.88036.880 29.27329.27329.27329.273 7.6077.6077.6077.607
(65.276) (43.952) (21.324)
(28.396)(28.396)(28.396)(28.396) (14.679)(14.679)(14.679)(14.679) (13.716)(13.716)(13.716)(13.716)
2009200920092009 2008200820082008
31.061 36.252Audiovisual 10.938 (3.489) 14.427Internet (2.514) 1.852 (4.365)
13.687 15.486 (1.799)(16.293) (20.829) 4.536
EBITDA ex no recurrentesEBITDA ex no recurrentesEBITDA ex no recurrentesEBITDA ex no recurrentes 36.88036.88036.88036.880 29.27329.27329.27329.273 7.6077.6077.6077.607
(65.276) (43.952) (21.324)
(28.396)(28.396)(28.396)(28.396) (14.679)(14.679)(14.679)(14.679) (13.716)(13.716)(13.716)(13.716)
2009200920092009 2008200820082008
31,061 36,252 (5,191)Audiovisual 10,938 (3,489) 14,427Internet (2,514) 1,852 (4,365)
13,687 15,486 (1,799)(16,293) (20,829) 4,536
EBITDA ex non EBITDA ex non EBITDA ex non EBITDA ex non recurringrecurringrecurringrecurring costscostscostscosts 36,88036,88036,88036,880 29,27329,27329,27329,273 7,6077,6077,6077,607
Non recurring costs (65,276) (43,952) (21,324)
(28,396)(28,396)(28,396)(28,396) (14,679)(14,679)(14,679)(14,679) (13,716)(13,716)(13,716)(13,716)
VarVarVarVar AbsAbsAbsAbs
EBITDAEBITDAEBITDAEBITDA
Vocento, S.A and SubsidiariesVocento, S.A and SubsidiariesVocento, S.A and SubsidiariesVocento, S.A and Subsidiaries
2009 Results Report
http://www.vocento.com 6
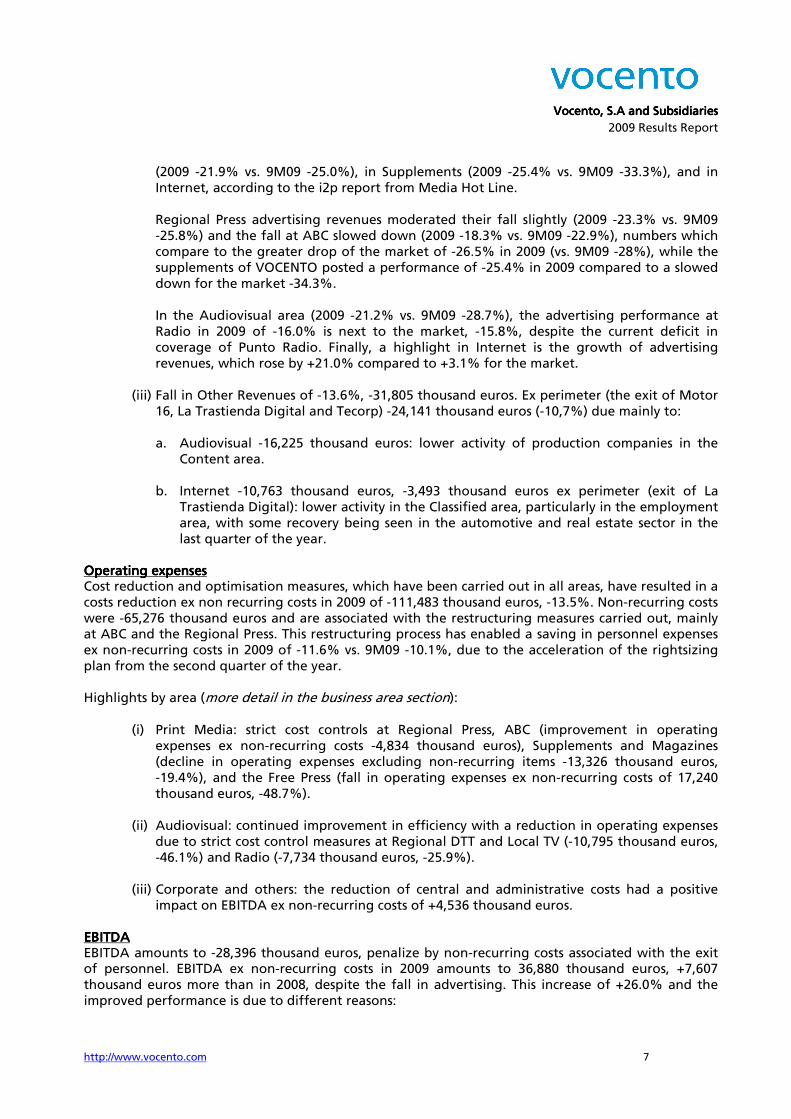
Main financial dataMain financial dataMain financial dataMain financial data CCCConsolidated onsolidated onsolidated onsolidated Profit Profit Profit Profit and Land Land Land Loss accountoss accountoss accountoss account
Thousand of EurosThousand of EurosThousand of EurosThousand of Euros 2009200920092009 2008200820082008 Var AbsVar AbsVar AbsVar Abs Var %Var %Var %Var %
Circulation revenues 274,203 269,967 4,236 1.6%
Advertising revenues 274,600 350,908 (76,307) (21.7%)
Other revenues 202,364 234,169 (31,805) (13.6%)
Total RevenueTotal RevenueTotal RevenueTotal Revenue 751,167751,167751,167751,167 855,043855,043855,043855,043 (103,876)(103,876)(103,876)(103,876) (12.1%)(12.1%)(12.1%)(12.1%)
Staff costs (307,831) (318,469) (10,638) (3.3%)
Procurements (143,098) (163,265) (20,167) (12.4%)
External Services (323,221) (381,830) (58,609) (15.3%)
Provisions (5,413) (6,159) (745) (12.1%)
Operating Expenses (without D&A)Operating Expenses (without D&A)Operating Expenses (without D&A)Operating Expenses (without D&A) (779,563)(779,563)(779,563)(779,563) (869,722)(869,722)(869,722)(869,722) (90,160)(90,160)(90,160)(90,160) (10.4%)(10.4%)(10.4%)(10.4%)
EBITDAEBITDAEBITDAEBITDA (28,396)(28,396)(28,396)(28,396) (14,679)(14,679)(14,679)(14,679) (13,716)(13,716)(13,716)(13,716) (93.4%)(93.4%)(93.4%)(93.4%)
Depreciation and amortization (45,731) (51,908) (6,177) (11.9%)
Gains on disposal of tangible & intangible assets 13,358 15,417 (2,058) (13.4%)
EBITEBITEBITEBIT (60,768)(60,768)(60,768)(60,768) (51,171)(51,171)(51,171)(51,171) (9,597)(9,597)(9,597)(9,597) (18.8%)(18.8%)(18.8%)(18.8%)
Impairment/reversal of other intangible assets (18,037) (88,403) (70,366) (79.6%)
Profit of companies acc. equity method (1,914) 11,489 (13,404) (116.7%)
Net financial income 4,753 (7,908) 12,661 160.1%
Net gains on disposal of non- current assets 69,645 147,595 (77,950) (52.8%)
Profit Before TaxesProfit Before TaxesProfit Before TaxesProfit Before Taxes (6,321)(6,321)(6,321)(6,321) 11,60211,60211,60211,602 (17,924)(17,924)(17,924)(17,924) (154.5%)(154.5%)(154.5%)(154.5%)
Corporation tax 18,105 18,762 (656) (3.5%)
Net profit for the yearNet profit for the yearNet profit for the yearNet profit for the year 11,78411,78411,78411,784 30,36430,36430,36430,364 (18,580)(18,580)(18,580)(18,580) (61.2%)(61.2%)(61.2%)(61.2%)
Minority interests (2,641) 4,241 (6,882) (162.3%)
Net profit attibutable to the parent Net profit attibutable to the parent Net profit attibutable to the parent Net profit attibutable to the parent 9,1439,1439,1439,143 34,60534,60534,60534,605 (25,462)(25,462)(25,462)(25,462) (73.6%)(73.6%)(73.6%)(73.6%)
Operating Expenses ex non recurring costs (714,287) (825,771) (111,483) (13.5%)
Personnel costs ex non recurring costs (242,555) (274,517) (31,962) (11.6%)
EBITDA ex non recurring costsEBITDA ex non recurring costsEBITDA ex non recurring costsEBITDA ex non recurring costs 36,88036,88036,88036,880 29,27329,27329,27329,273 7,6077,6077,6077,607 26.0%26.0%26.0%26.0%
IFRSIFRSIFRSIFRS
n.r.: the change in absolute terms is over >1.000% n.a.: not applicable as one of the values is zero Note 1: excludes Depreciation and amortization
Operating revenuesOperating revenuesOperating revenuesOperating revenues Revenues in 2009 were 751,167 thousand euros, compared with 855,043 thousand euros in 2008:
(i) Improvement in circulation revenues (+1.6%) due to an increase in revenues at ABC (+12.1%), with a slight decrease in Regional Press (-0.7%). ABC in 2009 increased circulation by +2.0% (average circulation of 256,650 copies vs. 251,642 in 2008), and was the only national newspaper to increase its circulation.
This improvement in circulation has enabled ABC to reduce by over half the gap to its most immediate competitor (gap vs. #2 43,524 copies on average in 2009 vs. 108,128 copies in 2007), supported by the growth of circulation from ordinary sales 2009 +2.3% vs. market -10.5%.
(ii) Advertising revenues eased their decline in the last quarter of 2009 -21.7% vs. 9M09
-25.2%. VOCENTO advertising revenues again outperformed the market in the paid press
1
Vocento, S.A and SubsidiariesVocento, S.A and SubsidiariesVocento, S.A and SubsidiariesVocento, S.A and Subsidiaries
2009 Results Report
http://www.vocento.com 7
(2009 -21.9% vs. 9M09 -25.0%), in Supplements (2009 -25.4% vs. 9M09 -33.3%), and in Internet, according to the i2p report from Media Hot Line. Regional Press advertising revenues moderated their fall slightly (2009 -23.3% vs. 9M09 -25.8%) and the fall at ABC slowed down (2009 -18.3% vs. 9M09 -22.9%), numbers which compare to the greater drop of the market of -26.5% in 2009 (vs. 9M09 -28%), while the supplements of VOCENTO posted a performance of -25.4% in 2009 compared to a slowed down for the market -34.3%. In the Audiovisual area (2009 -21.2% vs. 9M09 -28.7%), the advertising performance at Radio in 2009 of -16.0% is next to the market, -15.8%, despite the current deficit in coverage of Punto Radio. Finally, a highlight in Internet is the growth of advertising revenues, which rose by +21.0% compared to +3.1% for the market.
(iii) Fall in Other Revenues of -13.6%, -31,805 thousand euros. Ex perimeter (the exit of Motor
16, La Trastienda Digital and Tecorp) -24,141 thousand euros (-10,7%) due mainly to:
a. Audiovisual -16,225 thousand euros: lower activity of production companies in the Content area.
b. Internet -10,763 thousand euros, -3,493 thousand euros ex perimeter (exit of La
Trastienda Digital): lower activity in the Classified area, particularly in the employment area, with some recovery being seen in the automotive and real estate sector in the last quarter of the year.
Operating expensesOperating expensesOperating expensesOperating expenses Cost reduction and optimisation measures, which have been carried out in all areas, have resulted in a costs reduction ex non recurring costs in 2009 of -111,483 thousand euros, -13.5%. Non-recurring costs were -65,276 thousand euros and are associated with the restructuring measures carried out, mainly at ABC and the Regional Press. This restructuring process has enabled a saving in personnel expenses ex non-recurring costs in 2009 of -11.6% vs. 9M09 -10.1%, due to the acceleration of the rightsizing plan from the second quarter of the year. Highlights by area (more detail in the business area section):
(i) Print Media: strict cost controls at Regional Press, ABC (improvement in operating expenses ex non-recurring costs -4,834 thousand euros), Supplements and Magazines (decline in operating expenses excluding non-recurring items -13,326 thousand euros, -19.4%), and the Free Press (fall in operating expenses ex non-recurring costs of 17,240 thousand euros, -48.7%).
(ii) Audiovisual: continued improvement in efficiency with a reduction in operating expenses
due to strict cost control measures at Regional DTT and Local TV (-10,795 thousand euros, -46.1%) and Radio (-7,734 thousand euros, -25.9%).
(iii) Corporate and others: the reduction of central and administrative costs had a positive
impact on EBITDA ex non-recurring costs of +4,536 thousand euros. EBITDAEBITDAEBITDAEBITDA EBITDA amounts to -28,396 thousand euros, penalize by non-recurring costs associated with the exit of personnel. EBITDA ex non-recurring costs in 2009 amounts to 36,880 thousand euros, +7,607 thousand euros more than in 2008, despite the fall in advertising. This increase of +26.0% and the improved performance is due to different reasons:
Vocento, S.A and SubsidiariesVocento, S.A and SubsidiariesVocento, S.A and SubsidiariesVocento, S.A and Subsidiaries
2009 Results Report
http://www.vocento.com 8
(i) The impact of the current fall on advertising spends -76,307 thousand euros. (ii) The fall of operating expenses ex non-recurring costs of -13.5%, based on the cost control
and optimisation measures mentioned above, with a reduction in costs of -111,483 thousand euros, which more offsets the impact of the fall in revenues.
Gains on disposal of tangible and intangible fixed assetsGains on disposal of tangible and intangible fixed assetsGains on disposal of tangible and intangible fixed assetsGains on disposal of tangible and intangible fixed assets The net capital gain from the second stage of the sale of ABC land has been booked for 21,376 thousand euros (Relevant Fact of 10 July 2008). In addition, a reduction in the fixed asset base of -6,304 thousand euros has been made in the printing assets of ABC, because of the outsourcing of the printing plant, and the catalogue of Tripictures has been subject to accelerated amortization of -2,033 thousand euros. Operating profitOperating profitOperating profitOperating profit (EBIT) (EBIT) (EBIT) (EBIT)
Operating profit in 2009 was -60,768 thousand euros. Amortization in the period was -45,731 thousand euros, corresponding mainly to Content -17,387 thousand euros, Print Media -14,427 thousand euros, and to a lesser degree Printing -5,591 thousand euros and Internet -3,490 thousand euros. Impairment/reversal of other intangible assetsImpairment/reversal of other intangible assetsImpairment/reversal of other intangible assetsImpairment/reversal of other intangible assets During 2009 and based on the performance of the advertising market, the goodwill of various assets has been adjusted, for a total of -18,037 thousand euros, mainly corresponding to the free daily Qué! (-15,000 thousand euros). Net financial incomeNet financial incomeNet financial incomeNet financial income
Net financial income reflects, among others, the receipt of the dividend from Telecinco of 10,837 thousand euros on 14 May 2009, and lies in 4,753 thousand euros vs. -7,908 thousand euros in 2008. Net gains on disposal of nonNet gains on disposal of nonNet gains on disposal of nonNet gains on disposal of non----current assetscurrent assetscurrent assetscurrent assets The placing of 5.1% in Telecinco (as stated to the CNMV in the Relevant Facts of 30 and 31 July 2009) has generated pretax capital gains of 70,140 thousand euros. Corporation taxCorporation taxCorporation taxCorporation tax
The performance of operating profit, and deductions derived from the dividend payment and the capital gains generated from the sale of shares in Telecinco, explains the tax income (18,105 thousand euros). MinorityMinorityMinorityMinority interests interests interests interests
The variation of -6,882 thousand euros compared to 2008 corresponds mainly to the performance of Regional Press, National DTT, and Radio. Net profit attributable to the parent Net profit attributable to the parent Net profit attributable to the parent Net profit attributable to the parent companycompanycompanycompany Net profit was 9,143 thousand euros.
Vocento, S.A and SubsidiariesVocento, S.A and SubsidiariesVocento, S.A and SubsidiariesVocento, S.A and Subsidiaries
2009 Results Report
http://www.vocento.com 9
Consolidated Balance SheetConsolidated Balance SheetConsolidated Balance SheetConsolidated Balance Sheet
Thousand of EurosThousand of EurosThousand of EurosThousand of Euros 2009200920092009 2008200820082008 Var Abs.Var Abs.Var Abs.Var Abs. % Var% Var% Var% Var
Non current assetsNon current assetsNon current assetsNon current assets 701,167 701,167 701,167 701,167 766,806 766,806 766,806 766,806 (65,639) (65,639) (65,639) (65,639) (8.6%)(8.6%)(8.6%)(8.6%)
Intangible assets 277,267 293,003 (15,736) (5.4%)
Property, plant and equipment 230,352 214,972 15,381 7.2%
Investments accounted using equity method 20,019 19,116 903 4.7%
Other non current assets 173,529 239,716 (66,187) (27.6%)
Current assetsCurrent assetsCurrent assetsCurrent assets 349,339 349,339 349,339 349,339 347,033 347,033 347,033 347,033 2,306 2,306 2,306 2,306 0.7%0.7%0.7%0.7%
Cash and cash equivalents 125,518 85,131 40,387 47.4%
Other current assets 220,130 254,519 (34,389) (13.5%)
Assets held for sale 3,691 7,383 (3,691) (50.0%)
TOTAL ASSETSTOTAL ASSETSTOTAL ASSETSTOTAL ASSETS 1,050,506 1,050,506 1,050,506 1,050,506 1,113,839 1,113,839 1,113,839 1,113,839 (63,333) (63,333) (63,333) (63,333) (5.7%)(5.7%)(5.7%)(5.7%)
Of the Parent 424,115 484,836 (60,721) (12.5%)
Bank borrowings and other fin.liabilities 200,197 177,673 22,524 12.7%
Other liabilities 426,194 451,330 (25,136) (5.6%)
TOTAL EQUITY AND LIABILITIESTOTAL EQUITY AND LIABILITIESTOTAL EQUITY AND LIABILITIESTOTAL EQUITY AND LIABILITIES 1,050,506 1,050,506 1,050,506 1,050,506 1,113,839 1,113,839 1,113,839 1,113,839 (63,333) (63,333) (63,333) (63,333) (5.7%)(5.7%)(5.7%)(5.7%)
IFRSIFRSIFRSIFRS
n.r.: the difference is in absolute terms over 1.000% n.a.: not applicable as one of the values is zero Note: for comparative purposes, 2008 data include the early application of IFRS 3
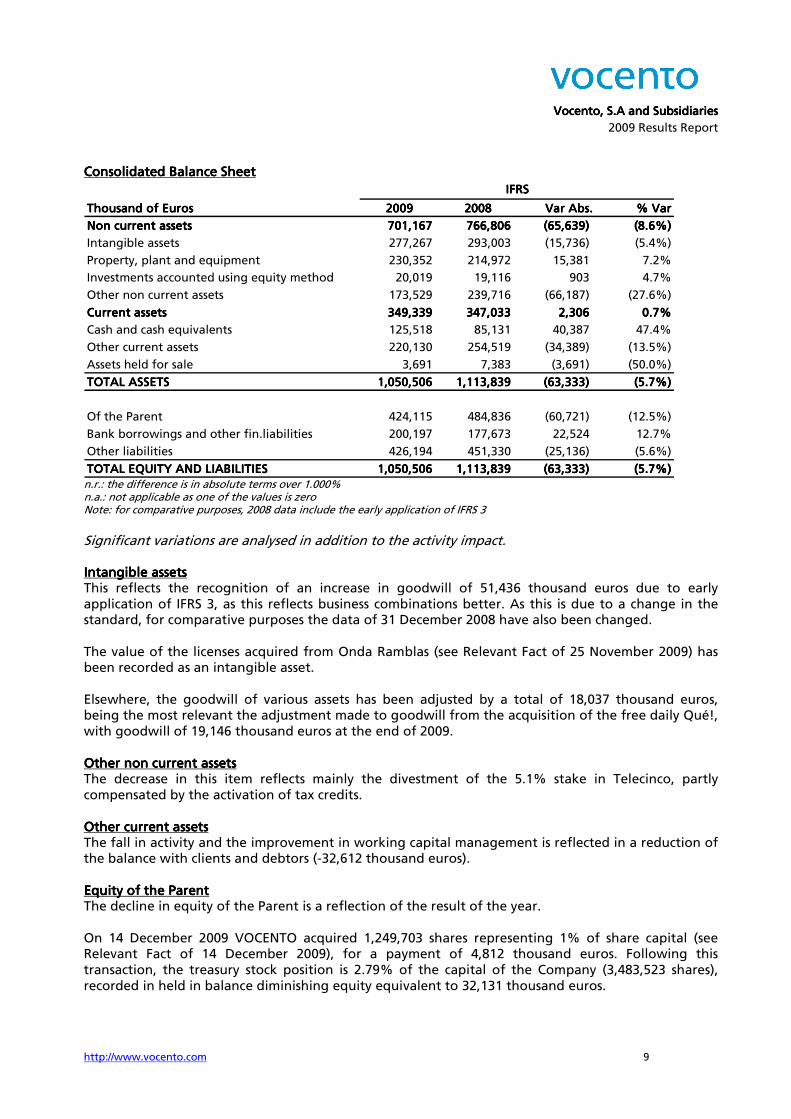
Significant variations are analysed in addition to the activity impact. Intangible assetsIntangible assetsIntangible assetsIntangible assets This reflects the recognition of an increase in goodwill of 51,436 thousand euros due to early application of IFRS 3, as this reflects business combinations better. As this is due to a change in the standard, for comparative purposes the data of 31 December 2008 have also been changed. The value of the licenses acquired from Onda Ramblas (see Relevant Fact of 25 November 2009) has been recorded as an intangible asset. Elsewhere, the goodwill of various assets has been adjusted by a total of 18,037 thousand euros, being the most relevant the adjustment made to goodwill from the acquisition of the free daily Qué!, with goodwill of 19,146 thousand euros at the end of 2009. Other non current assetsOther non current assetsOther non current assetsOther non current assets The decrease in this item reflects mainly the divestment of the 5.1% stake in Telecinco, partly compensated by the activation of tax credits. Other current assetsOther current assetsOther current assetsOther current assets The fall in activity and the improvement in working capital management is reflected in a reduction of the balance with clients and debtors (-32,612 thousand euros). Equity of the ParentEquity of the ParentEquity of the ParentEquity of the Parent The decline in equity of the Parent is a reflection of the result of the year. On 14 December 2009 VOCENTO acquired 1,249,703 shares representing 1% of share capital (see Relevant Fact of 14 December 2009), for a payment of 4,812 thousand euros. Following this transaction, the treasury stock position is 2.79% of the capital of the Company (3,483,523 shares), recorded in held in balance diminishing equity equivalent to 32,131 thousand euros.
Vocento, S.A and SubsidiariesVocento, S.A and SubsidiariesVocento, S.A and SubsidiariesVocento, S.A and Subsidiaries
2009 Results Report
http://www.vocento.com 10
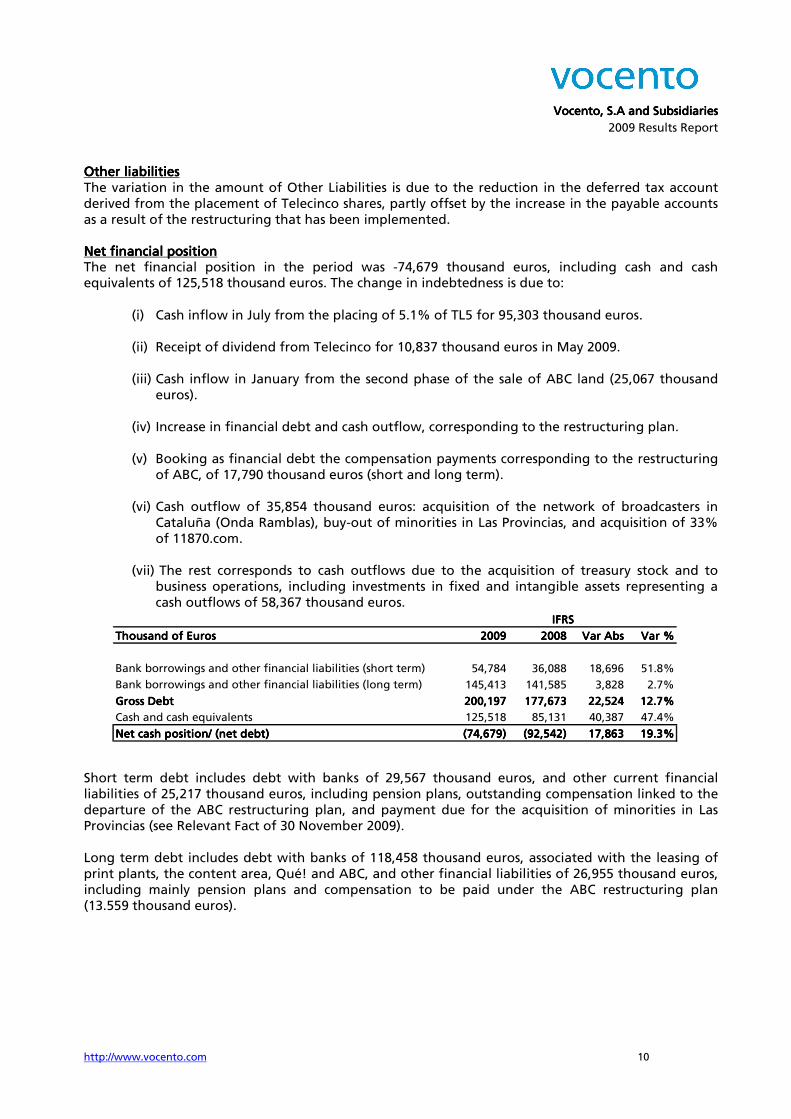
Other liabilitiesOther liabilitiesOther liabilitiesOther liabilities The variation in the amount of Other Liabilities is due to the reduction in the deferred tax account derived from the placement of Telecinco shares, partly offset by the increase in the payable accounts as a result of the restructuring that has been implemented. Net financial positionNet financial positionNet financial positionNet financial position The net financial position in the period was -74,679 thousand euros, including cash and cash equivalents of 125,518 thousand euros. The change in indebtedness is due to:
(i) Cash inflow in July from the placing of 5.1% of TL5 for 95,303 thousand euros. (ii) Receipt of dividend from Telecinco for 10,837 thousand euros in May 2009.
(iii) Cash inflow in January from the second phase of the sale of ABC land (25,067 thousand
euros). (iv) Increase in financial debt and cash outflow, corresponding to the restructuring plan.
(v) Booking as financial debt the compensation payments corresponding to the restructuring
of ABC, of 17,790 thousand euros (short and long term). (vi) Cash outflow of 35,854 thousand euros: acquisition of the network of broadcasters in
Cataluña (Onda Ramblas), buy-out of minorities in Las Provincias, and acquisition of 33% of 11870.com.
(vii) The rest corresponds to cash outflows due to the acquisition of treasury stock and to
business operations, including investments in fixed and intangible assets representing a cash outflows of 58,367 thousand euros.
Short term debt includes debt with banks of 29,567 thousand euros, and other current financial liabilities of 25,217 thousand euros, including pension plans, outstanding compensation linked to the departure of the ABC restructuring plan, and payment due for the acquisition of minorities in Las Provincias (see Relevant Fact of 30 November 2009). Long term debt includes debt with banks of 118,458 thousand euros, associated with the leasing of print plants, the content area, Qué! and ABC, and other financial liabilities of 26,955 thousand euros, including mainly pension plans and compensation to be paid under the ABC restructuring plan (13.559 thousand euros).
Thousand of EurosThousand of EurosThousand of EurosThousand of Euros 2009200920092009 2008200820082008 Var AbsVar AbsVar AbsVar Abs Var %Var %Var %Var %
Bank borrowings and other financial liabilities (short term) 54,784 36,088 18,696 51.8%
Bank borrowings and other financial liabilities (long term) 145,413 141,585 3,828 2.7%
Gross DebtGross DebtGross DebtGross Debt 200,197200,197200,197200,197 177,673177,673177,673177,673 22,52422,52422,52422,524 12.7%12.7%12.7%12.7%
Cash and cash equivalents 125,518 85,131 40,387 47.4%
Net cash position/ (net debt) Net cash position/ (net debt) Net cash position/ (net debt) Net cash position/ (net debt) (74,679)(74,679)(74,679)(74,679) (92,542)(92,542)(92,542)(92,542) 17,86317,86317,86317,863 19.3%19.3%19.3%19.3%
IFRSIFRSIFRSIFRS
Vocento, S.A and SubsidiariesVocento, S.A and SubsidiariesVocento, S.A and SubsidiariesVocento, S.A and Subsidiaries
2009 Results Report
http://www.vocento.com 11
Cash flow statementCash flow statementCash flow statementCash flow statement n.r.: the difference is in absolute terms over 1.000% n.a.: not applicable as one of the value is zero
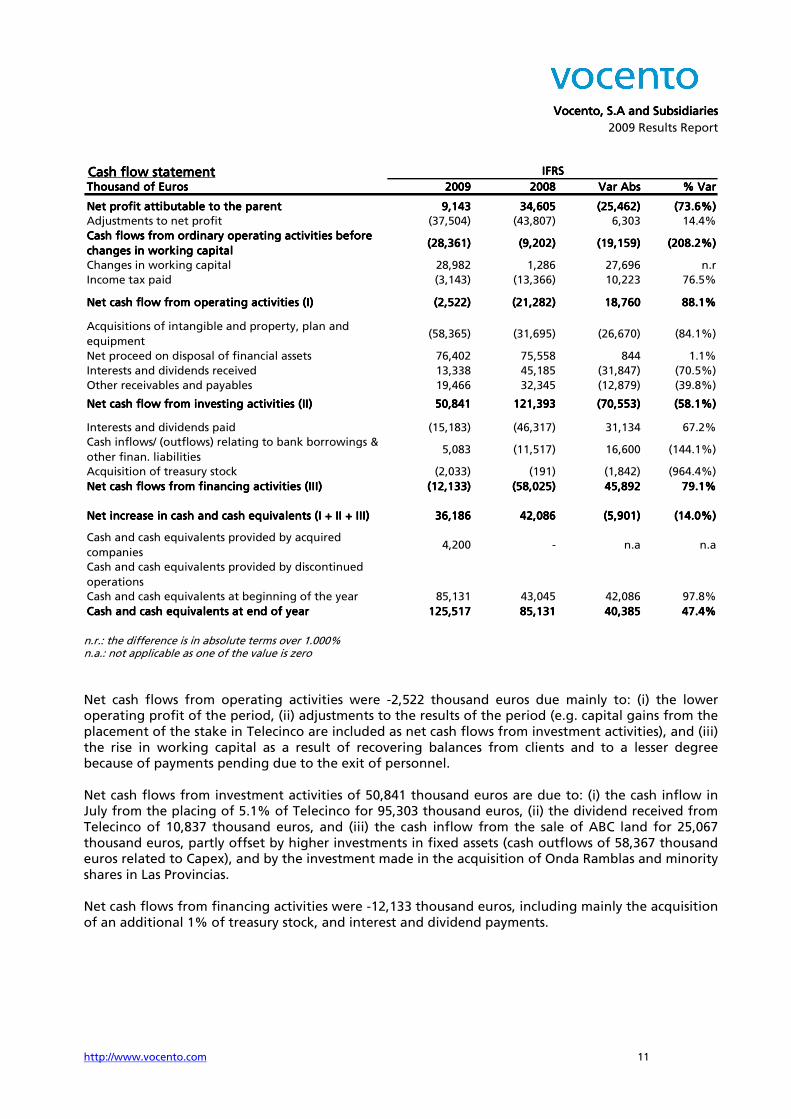
Net cash flows from operating activities were -2,522 thousand euros due mainly to: (i) the lower operating profit of the period, (ii) adjustments to the results of the period (e.g. capital gains from the placement of the stake in Telecinco are included as net cash flows from investment activities), and (iii) the rise in working capital as a result of recovering balances from clients and to a lesser degree because of payments pending due to the exit of personnel. Net cash flows from investment activities of 50,841 thousand euros are due to: (i) the cash inflow in July from the placing of 5.1% of Telecinco for 95,303 thousand euros, (ii) the dividend received from Telecinco of 10,837 thousand euros, and (iii) the cash inflow from the sale of ABC land for 25,067 thousand euros, partly offset by higher investments in fixed assets (cash outflows of 58,367 thousand euros related to Capex), and by the investment made in the acquisition of Onda Ramblas and minority shares in Las Provincias. Net cash flows from financing activities were -12,133 thousand euros, including mainly the acquisition of an additional 1% of treasury stock, and interest and dividend payments.
Thousand of EurosThousand of EurosThousand of EurosThousand of Euros 2009200920092009 2008200820082008 Var AbsVar AbsVar AbsVar Abs % Var% Var% Var% Var
Net profit attibutable to the parent Net profit attibutable to the parent Net profit attibutable to the parent Net profit attibutable to the parent 9,143 9,143 9,143 9,143 34,605 34,605 34,605 34,605 (25,462) (25,462) (25,462) (25,462) (73.6%)(73.6%)(73.6%)(73.6%)
Adjustments to net profit (37,504) (43,807) 6,303 14.4%
Cash flows from ordinary operating activities before Cash flows from ordinary operating activities before Cash flows from ordinary operating activities before Cash flows from ordinary operating activities before
changes in working capitalchanges in working capitalchanges in working capitalchanges in working capital(28,361) (28,361) (28,361) (28,361) (9,202) (9,202) (9,202) (9,202) (19,159) (19,159) (19,159) (19,159) (208.2%)(208.2%)(208.2%)(208.2%)
Changes in working capital 28,982 1,286 27,696 n.r
Income tax paid (3,143) (13,366) 10,223 76.5%
Net cash flow from operating activities (I)Net cash flow from operating activities (I)Net cash flow from operating activities (I)Net cash flow from operating activities (I) (2,522) (2,522) (2,522) (2,522) (21,282) (21,282) (21,282) (21,282) 18,760 18,760 18,760 18,760 88.1%88.1%88.1%88.1%
Acquisitions of intangible and property, plan and
equipment(58,365) (31,695) (26,670) (84.1%)
Net proceed on disposal of financial assets 76,402 75,558 844 1.1%
Interests and dividends received 13,338 45,185 (31,847) (70.5%)
Other receivables and payables 19,466 32,345 (12,879) (39.8%)
Net cash flow from investing activities (II)Net cash flow from investing activities (II)Net cash flow from investing activities (II)Net cash flow from investing activities (II) 50,841 50,841 50,841 50,841 121,393 121,393 121,393 121,393 (70,553) (70,553) (70,553) (70,553) (58.1%)(58.1%)(58.1%)(58.1%)
Interests and dividends paid (15,183) (46,317) 31,134 67.2%
Cash inflows/ (outflows) relating to bank borrowings &
other finan. liabilities5,083 (11,517) 16,600 (144.1%)
Acquisition of treasury stock (2,033) (191) (1,842) (964.4%)
Net cash flows from financing activities (III)Net cash flows from financing activities (III)Net cash flows from financing activities (III)Net cash flows from financing activities (III) (12,133) (12,133) (12,133) (12,133) (58,025) (58,025) (58,025) (58,025) 45,892 45,892 45,892 45,892 79.1%79.1%79.1%79.1%
Net increase in cash and cash equivalents (I + II + III)Net increase in cash and cash equivalents (I + II + III)Net increase in cash and cash equivalents (I + II + III)Net increase in cash and cash equivalents (I + II + III) 36,186 36,186 36,186 36,186 42,086 42,086 42,086 42,086 (5,901) (5,901) (5,901) (5,901) (14.0%)(14.0%)(14.0%)(14.0%)
Cash and cash equivalents provided by acquired
companies4,200 - n.a n.a
Cash and cash equivalents provided by discontinued
operations
Cash and cash equivalents at beginning of the year 85,131 43,045 42,086 97.8%
Cash and cash equivalents at end of yearCash and cash equivalents at end of yearCash and cash equivalents at end of yearCash and cash equivalents at end of year 125,517 125,517 125,517 125,517 85,131 85,131 85,131 85,131 40,385 40,385 40,385 40,385 47.4%47.4%47.4%47.4%
IFRSIFRSIFRSIFRS
Vocento, S.A and SubsidiariesVocento, S.A and SubsidiariesVocento, S.A and SubsidiariesVocento, S.A and Subsidiaries
2009 Results Report
http://www.vocento.com 12
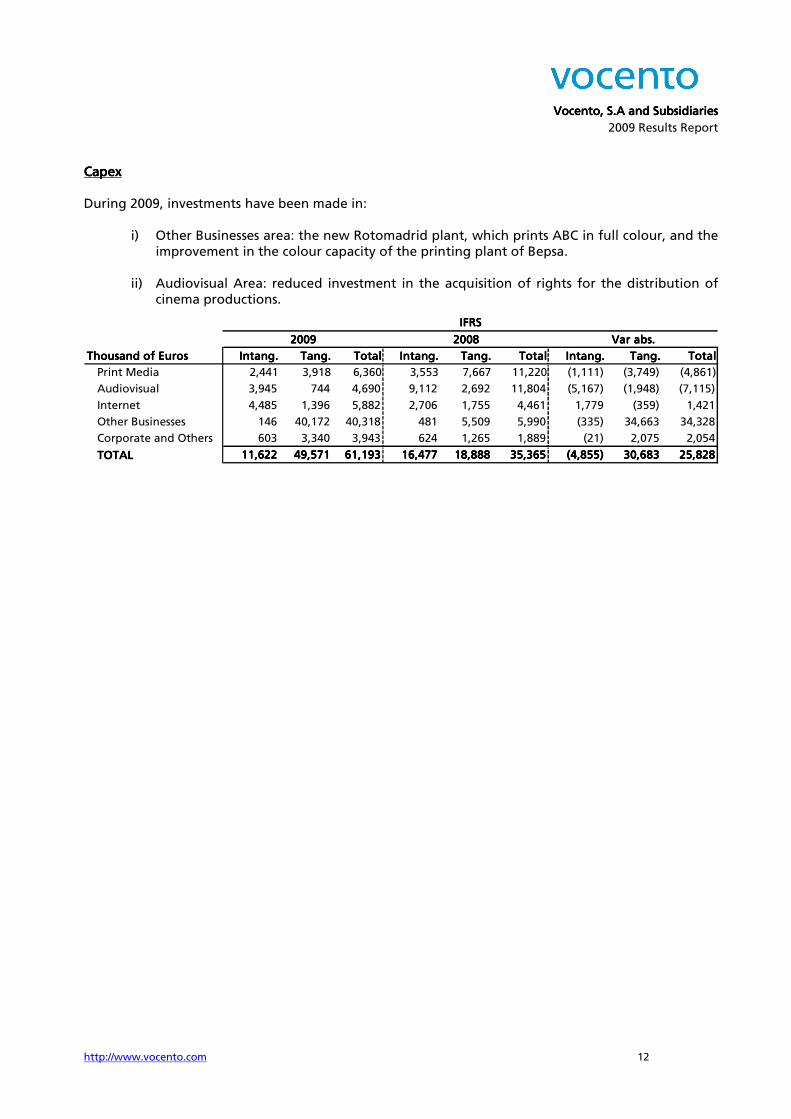
CapexCapexCapexCapex During 2009, investments have been made in:
i) Other Businesses area: the new Rotomadrid plant, which prints ABC in full colour, and the improvement in the colour capacity of the printing plant of Bepsa.
ii) Audiovisual Area: reduced investment in the acquisition of rights for the distribution of
cinema productions.
2009200920092009 2008200820082008 Var abs.Var abs.Var abs.Var abs.
Thousand of EurosThousand of EurosThousand of EurosThousand of Euros Intang.Intang.Intang.Intang. Tang.Tang.Tang.Tang. TotalTotalTotalTotal Intang.Intang.Intang.Intang. Tang.Tang.Tang.Tang. TotalTotalTotalTotal Intang.Intang.Intang.Intang. Tang.Tang.Tang.Tang. TotalTotalTotalTotal
Print Media 2,441 3,918 6,360 3,553 7,667 11,220 (1,111) (3,749) (4,861)
Audiovisual 3,945 744 4,690 9,112 2,692 11,804 (5,167) (1,948) (7,115)
Internet 4,485 1,396 5,882 2,706 1,755 4,461 1,779 (359) 1,421
Other Businesses 146 40,172 40,318 481 5,509 5,990 (335) 34,663 34,328
Corporate and Others 603 3,340 3,943 624 1,265 1,889 (21) 2,075 2,054
TOTALTOTALTOTALTOTAL 11,62211,62211,62211,622 49,57149,57149,57149,571 61,19361,19361,19361,193 16,47716,47716,47716,477 18,88818,88818,88818,888 35,36535,36535,36535,365 (4,855)(4,855)(4,855)(4,855) 30,68330,68330,68330,683 25,82825,82825,82825,828
IFRSIFRSIFRSIFRS
Vocento, S.A and SubsidiariesVocento, S.A and SubsidiariesVocento, S.A and SubsidiariesVocento, S.A and Subsidiaries
2009 Results Report
http://www.vocento.com 13
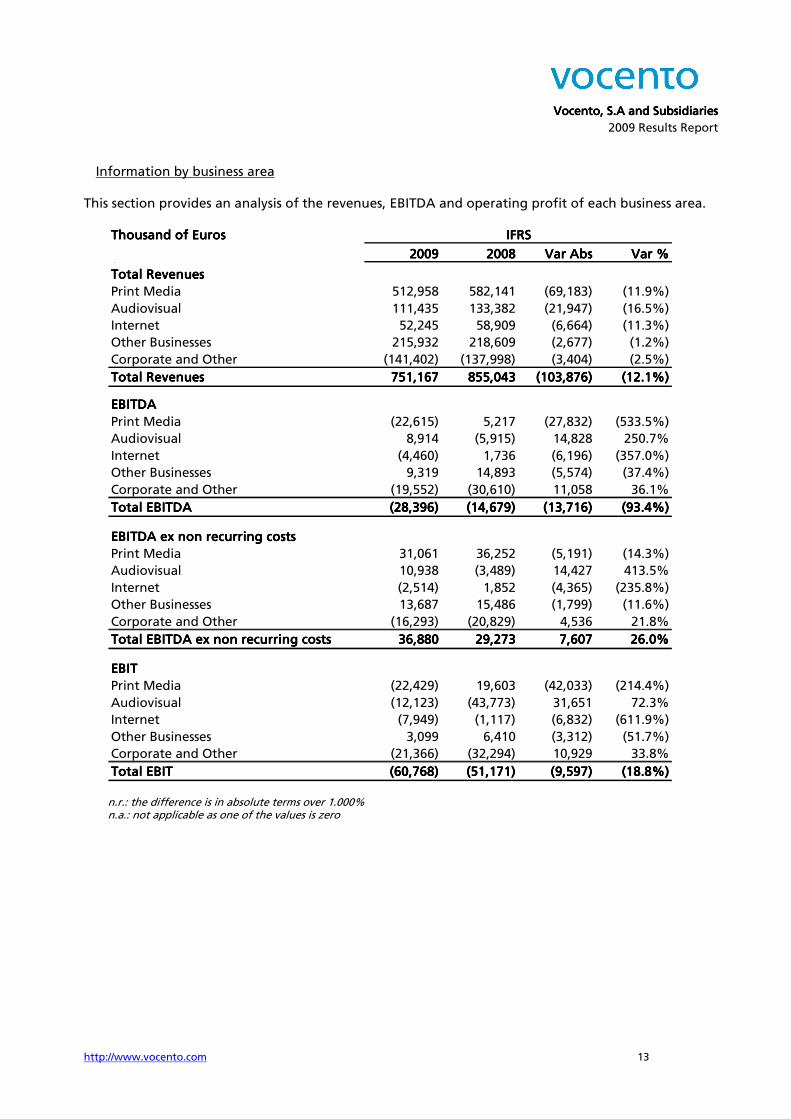
Information by business area This section provides an analysis of the revenues, EBITDA and operating profit of each business area.
n.r.: the difference is in absolute terms over 1.000% n.a.: not applicable as one of the values is zero
Thousand of EurosThousand of EurosThousand of EurosThousand of Euros
2009200920092009 2008200820082008 Var AbsVar AbsVar AbsVar Abs Var %Var %Var %Var %0000
Total RevenuesTotal RevenuesTotal RevenuesTotal Revenues
Print Media 512,958 582,141 (69,183) (11.9%)
Audiovisual 111,435 133,382 (21,947) (16.5%)
Internet 52,245 58,909 (6,664) (11.3%)
Other Businesses 215,932 218,609 (2,677) (1.2%)
Corporate and Other (141,402) (137,998) (3,404) (2.5%)
Total RevenuesTotal RevenuesTotal RevenuesTotal Revenues 751,167751,167751,167751,167 855,043855,043855,043855,043 (103,876)(103,876)(103,876)(103,876) (12.1%)(12.1%)(12.1%)(12.1%)
EBITDAEBITDAEBITDAEBITDA
Print Media (22,615) 5,217 (27,832) (533.5%)
Audiovisual 8,914 (5,915) 14,828 250.7%
Internet (4,460) 1,736 (6,196) (357.0%)
Other Businesses 9,319 14,893 (5,574) (37.4%)
Corporate and Other (19,552) (30,610) 11,058 36.1%
Total EBITDATotal EBITDATotal EBITDATotal EBITDA (28,396)(28,396)(28,396)(28,396) (14,679)(14,679)(14,679)(14,679) (13,716)(13,716)(13,716)(13,716) (93.4%)(93.4%)(93.4%)(93.4%)
EBITDA ex non recurring costsEBITDA ex non recurring costsEBITDA ex non recurring costsEBITDA ex non recurring costs
Print Media 31,061 36,252 (5,191) (14.3%)
Audiovisual 10,938 (3,489) 14,427 413.5%
Internet (2,514) 1,852 (4,365) (235.8%)
Other Businesses 13,687 15,486 (1,799) (11.6%)
Corporate and Other (16,293) (20,829) 4,536 21.8%
Total EBITDA ex non recurring costsTotal EBITDA ex non recurring costsTotal EBITDA ex non recurring costsTotal EBITDA ex non recurring costs 36,88036,88036,88036,880 29,27329,27329,27329,273 7,6077,6077,6077,607 26.0%26.0%26.0%26.0%
EBITEBITEBITEBIT
Print Media (22,429) 19,603 (42,033) (214.4%)
Audiovisual (12,123) (43,773) 31,651 72.3%
Internet (7,949) (1,117) (6,832) (611.9%)
Other Businesses 3,099 6,410 (3,312) (51.7%)
Corporate and Other (21,366) (32,294) 10,929 33.8%
Total EBITTotal EBITTotal EBITTotal EBIT (60,768)(60,768)(60,768)(60,768) (51,171)(51,171)(51,171)(51,171) (9,597)(9,597)(9,597)(9,597) (18.8%)(18.8%)(18.8%)(18.8%)
IFRSIFRSIFRSIFRS
Vocento, S.A and SubsidiariesVocento, S.A and SubsidiariesVocento, S.A and SubsidiariesVocento, S.A and Subsidiaries
2009 Results Report
http://www.vocento.com 14
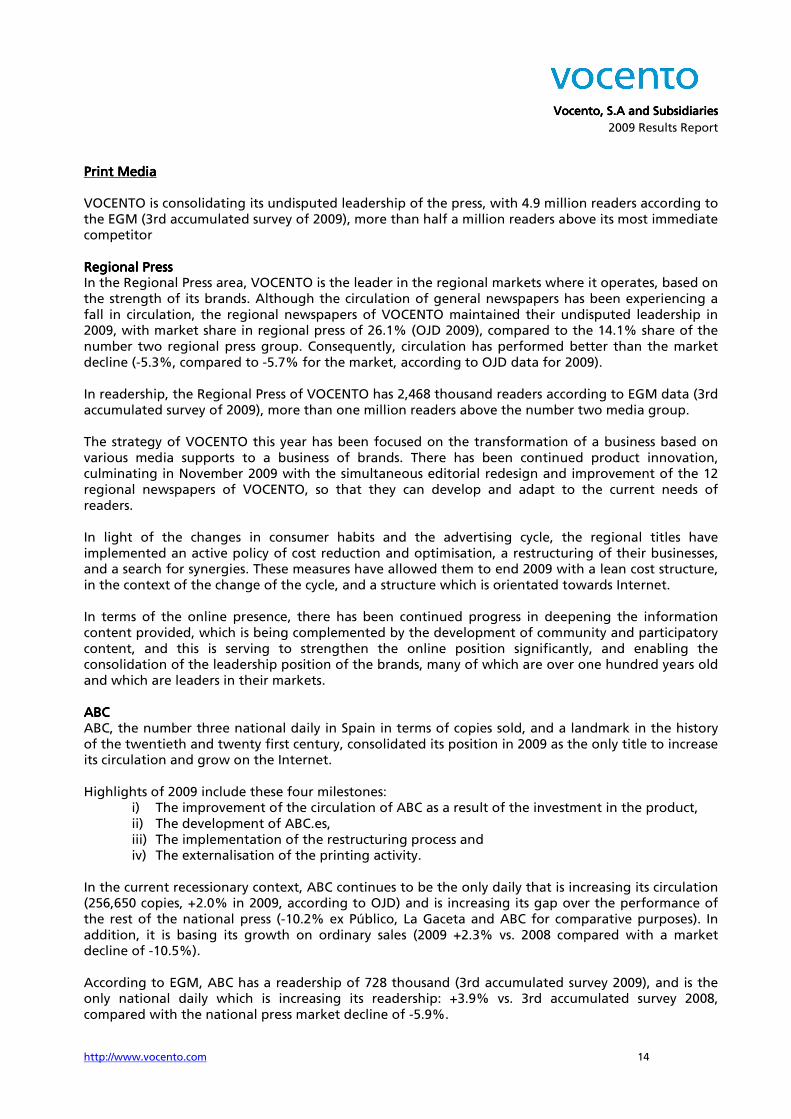
Print MediaPrint MediaPrint MediaPrint Media VOCENTO is consolidating its undisputed leadership of the press, with 4.9 million readers according to the EGM (3rd accumulated survey of 2009), more than half a million readers above its most immediate competitor Regional PressRegional PressRegional PressRegional Press In the Regional Press area, VOCENTO is the leader in the regional markets where it operates, based on the strength of its brands. Although the circulation of general newspapers has been experiencing a fall in circulation, the regional newspapers of VOCENTO maintained their undisputed leadership in 2009, with market share in regional press of 26.1% (OJD 2009), compared to the 14.1% share of the number two regional press group. Consequently, circulation has performed better than the market decline (-5.3%, compared to -5.7% for the market, according to OJD data for 2009). In readership, the Regional Press of VOCENTO has 2,468 thousand readers according to EGM data (3rd accumulated survey of 2009), more than one million readers above the number two media group. The strategy of VOCENTO this year has been focused on the transformation of a business based on various media supports to a business of brands. There has been continued product innovation, culminating in November 2009 with the simultaneous editorial redesign and improvement of the 12 regional newspapers of VOCENTO, so that they can develop and adapt to the current needs of readers. In light of the changes in consumer habits and the advertising cycle, the regional titles have implemented an active policy of cost reduction and optimisation, a restructuring of their businesses, and a search for synergies. These measures have allowed them to end 2009 with a lean cost structure, in the context of the change of the cycle, and a structure which is orientated towards Internet. In terms of the online presence, there has been continued progress in deepening the information content provided, which is being complemented by the development of community and participatory content, and this is serving to strengthen the online position significantly, and enabling the consolidation of the leadership position of the brands, many of which are over one hundred years old and which are leaders in their markets. ABCABCABCABC ABC, the number three national daily in Spain in terms of copies sold, and a landmark in the history of the twentieth and twenty first century, consolidated its position in 2009 as the only title to increase its circulation and grow on the Internet. Highlights of 2009 include these four milestones:
i) The improvement of the circulation of ABC as a result of the investment in the product, ii) The development of ABC.es, iii) The implementation of the restructuring process and iv) The externalisation of the printing activity.
In the current recessionary context, ABC continues to be the only daily that is increasing its circulation (256,650 copies, +2.0% in 2009, according to OJD) and is increasing its gap over the performance of the rest of the national press (-10.2% ex Público, La Gaceta and ABC for comparative purposes). In addition, it is basing its growth on ordinary sales (2009 +2.3% vs. 2008 compared with a market decline of -10.5%). According to EGM, ABC has a readership of 728 thousand (3rd accumulated survey 2009), and is the only national daily which is increasing its readership: +3.9% vs. 3rd accumulated survey 2008, compared with the national press market decline of -5.9%.
Vocento, S.A and SubsidiariesVocento, S.A and SubsidiariesVocento, S.A and SubsidiariesVocento, S.A and Subsidiaries
2009 Results Report
http://www.vocento.com 15
This improved operating performance is the result of the strategic commitment carried out by ABC, based on significant efforts in editorial, especially in the weekend edition (i.e. growth in circulation on Sundays of +9.3%, compared with a -12.3% decline in the national press market, according to OJD 2009). 2009 saw the fastest growth in the digital edition of ABC.es, supported by the launch of the online Hemerotheque (with over 100 years of history), the improvement of Web 2.0 and Web TV content, and pioneering new mobile services such as the iPhone application. The restructuring measures that have been carried out are enabling the cost structure to be adjusted and are facilitating the process of the convergence of online and offline editions. Another highlight has been that since the month of November the printing of ABC has been carried out a new plant (Rotomadrid), with start of the art technology that enables the commercial printing of the daily in full colour. ABC continued to pursue its intense social, cultural and institutional activity in 2009, including the award of the ABC Solidario Prizes and the XXI intake to the ABC-Universidad Complutense de Madrid Master’s in Journalism. ABC is facing the future from a position of a strong trend for growth in its market share, for both circulation and advertising, and with a cost structure that has been adapted to the current cycle. The Free Press The Free Press The Free Press The Free Press ---- Qué! Qué! Qué! Qué! The free press is a complementary business for VOCENTO, and enables it to access new audiences which give it significant critical mass of readers. According to the 3rd EGM accumulated survey of 2009, Qué! has a readership of 1,698 thousand readers. With the exit of other players in 2009, Qué! has increased its cost reduction efforts (-48.7% excluding non-recurring costs) and has focused its presence on the more interesting advertising markets, reaching commercial agreements with other publishers in response to the current advertising environment. Supplements and MagazinesSupplements and MagazinesSupplements and MagazinesSupplements and Magazines Each week, VOCENTO publishes the leading Sunday supplement in Spain, XL Semanal, and also the most read women’s supplement, Mujer Hoy. Highlights of 2009 include the following three milestones:
i) Leader in readership, which provides an alternative to television in terms of audience and a differentiated market niche,
ii) the development of leading brands on the Internet and iii) the restructuring of the magazines area.
According to EGM data, in 2009 VOCENTO reinforced its leadership in the sector of general supplements (XL Semanal, Mujer Hoy, Hoy Corazón and Pantalla Semanal) and in specialist magazines (Mi Cartera de Inversión). The Magazines and Supplements of VOCENTO according to EGM reach a readership of 6,522 thousand readers, with an increase in the readership of Supplements of +20.1% from 2008 (the figures from 2008 did not include either Hoy Corazón or Pantalla Semanal), more than its main competitors and more than the supplement market (+4.2% 3rd accumulated survey EGM 2008/9). The leadership of VOCENTO facilitates its online positioning, based on the development of integrated offers, which transfer the power of its offline brands to the vertical portals: Mi cartera de Inversión with finanzas.com, and Mujer Hoy with Mujerhoy.com
Vocento, S.A and SubsidiariesVocento, S.A and SubsidiariesVocento, S.A and SubsidiariesVocento, S.A and Subsidiaries
2009 Results Report
http://www.vocento.com 16
Faced with the new market situation after RTVE stopped carrying advertising, the offline and online brands of the VOCENTO supplements have become an alternative and effective means for advertisers to access audiences, because of their wide coverage and niche audiences. Finally, the portfolio of magazines has been reviewed, and there have been certain exits based on a criterion of profitability (i.e. Motor 16 and corporate magazines Tecorp).
Vocento, S.A and SubsidiariesVocento, S.A and SubsidiariesVocento, S.A and SubsidiariesVocento, S.A and Subsidiaries
2009 Results Report
http://www.vocento.com 17
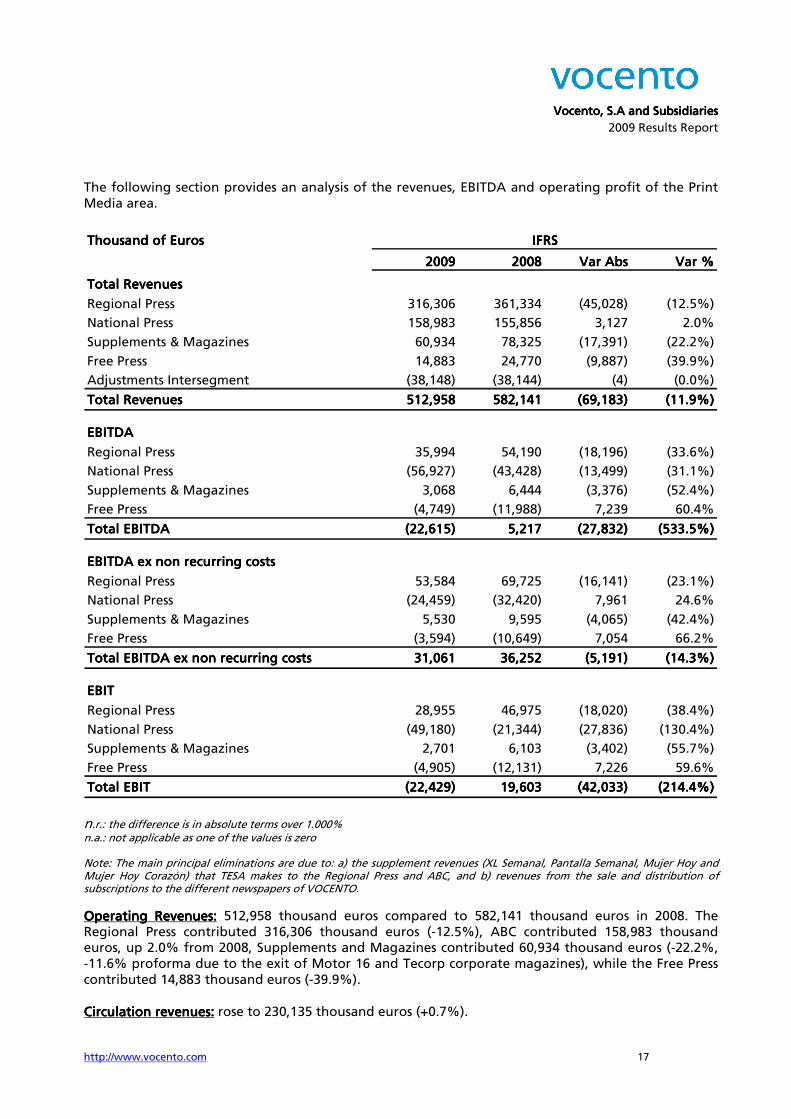
The following section provides an analysis of the revenues, EBITDA and operating profit of the Print Media area. n.r.: the difference is in absolute terms over 1.000% n.a.: not applicable as one of the values is zero Note: The main principal eliminations are due to: a) the supplement revenues (XL Semanal, Pantalla Semanal, Mujer Hoy and Mujer Hoy Corazón) that TESA makes to the Regional Press and ABC, and b) revenues from the sale and distribution of subscriptions to the different newspapers of VOCENTO.
Operating RevenuesOperating RevenuesOperating RevenuesOperating Revenues:::: 512,958 thousand euros compared to 582,141 thousand euros in 2008. The Regional Press contributed 316,306 thousand euros (-12.5%), ABC contributed 158,983 thousand euros, up 2.0% from 2008, Supplements and Magazines contributed 60,934 thousand euros (-22.2%, -11.6% proforma due to the exit of Motor 16 and Tecorp corporate magazines), while the Free Press contributed 14,883 thousand euros (-39.9%). Circulation revenuesCirculation revenuesCirculation revenuesCirculation revenues:::: rose to 230,135 thousand euros (+0.7%).
Thousand of EurosThousand of EurosThousand of EurosThousand of Euros
2009200920092009 2008200820082008 Var AbsVar AbsVar AbsVar Abs Var %Var %Var %Var %0000
Total RevenuesTotal RevenuesTotal RevenuesTotal Revenues
Regional Press 316,306 361,334 (45,028) (12.5%)
National Press 158,983 155,856 3,127 2.0%
Supplements & Magazines 60,934 78,325 (17,391) (22.2%)
Free Press 14,883 24,770 (9,887) (39.9%)
Adjustments Intersegment (38,148) (38,144) (4) (0.0%)
Total RevenuesTotal RevenuesTotal RevenuesTotal Revenues 512,958512,958512,958512,958 582,141582,141582,141582,141 (69,183)(69,183)(69,183)(69,183) (11.9%)(11.9%)(11.9%)(11.9%)
EBITDAEBITDAEBITDAEBITDA
Regional Press 35,994 54,190 (18,196) (33.6%)
National Press (56,927) (43,428) (13,499) (31.1%)
Supplements & Magazines 3,068 6,444 (3,376) (52.4%)
Free Press (4,749) (11,988) 7,239 60.4%
Total EBITDATotal EBITDATotal EBITDATotal EBITDA (22,615)(22,615)(22,615)(22,615) 5,2175,2175,2175,217 (27,832)(27,832)(27,832)(27,832) (533.5%)(533.5%)(533.5%)(533.5%)
EBITDA ex non recurring costsEBITDA ex non recurring costsEBITDA ex non recurring costsEBITDA ex non recurring costs
Regional Press 53,584 69,725 (16,141) (23.1%)
National Press (24,459) (32,420) 7,961 24.6%
Supplements & Magazines 5,530 9,595 (4,065) (42.4%)
Free Press (3,594) (10,649) 7,054 66.2%
Total EBITDA ex non recurring costsTotal EBITDA ex non recurring costsTotal EBITDA ex non recurring costsTotal EBITDA ex non recurring costs 31,06131,06131,06131,061 36,25236,25236,25236,252 (5,191)(5,191)(5,191)(5,191) (14.3%)(14.3%)(14.3%)(14.3%)
EBITEBITEBITEBIT
Regional Press 28,955 46,975 (18,020) (38.4%)
National Press (49,180) (21,344) (27,836) (130.4%)
Supplements & Magazines 2,701 6,103 (3,402) (55.7%)
Free Press (4,905) (12,131) 7,226 59.6%
Total EBITTotal EBITTotal EBITTotal EBIT (22,429)(22,429)(22,429)(22,429) 19,60319,60319,60319,603 (42,033)(42,033)(42,033)(42,033) (214.4%)(214.4%)(214.4%)(214.4%)
IFRSIFRSIFRSIFRS
Vocento, S.A and SubsidiariesVocento, S.A and SubsidiariesVocento, S.A and SubsidiariesVocento, S.A and Subsidiaries
2009 Results Report
http://www.vocento.com 18
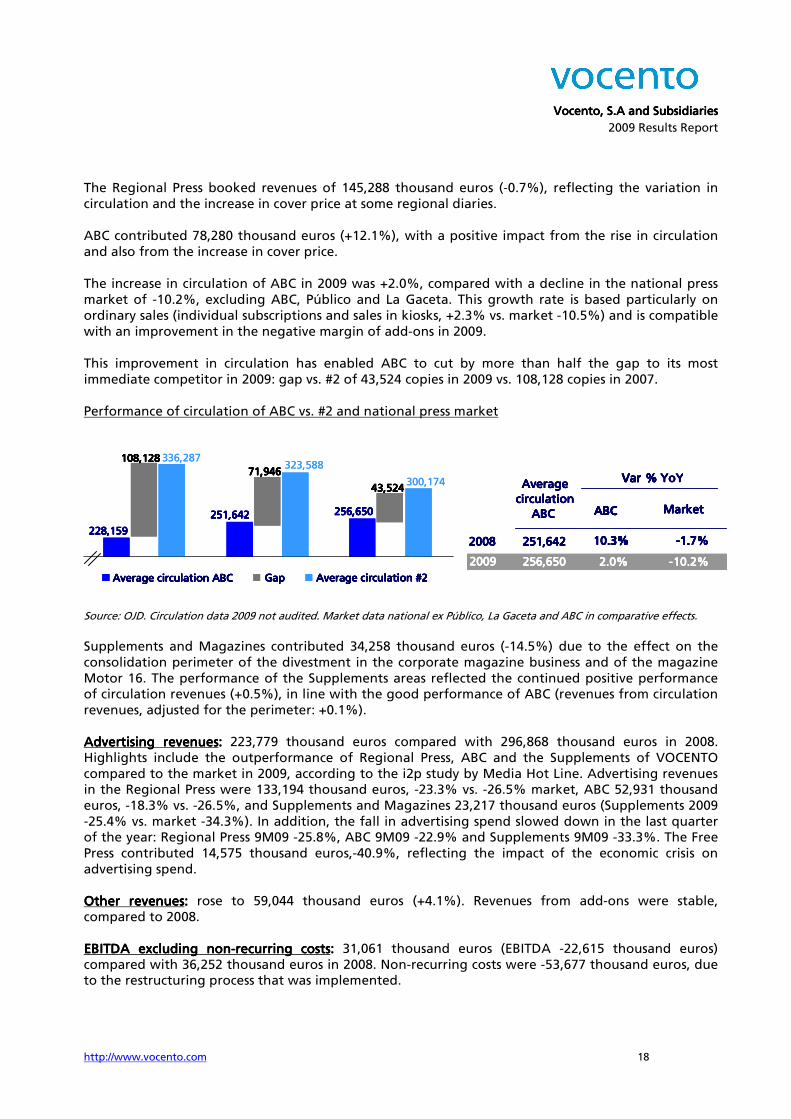
The Regional Press booked revenues of 145,288 thousand euros (-0.7%), reflecting the variation in circulation and the increase in cover price at some regional diaries. ABC contributed 78,280 thousand euros (+12.1%), with a positive impact from the rise in circulation and also from the increase in cover price. The increase in circulation of ABC in 2009 was +2.0%, compared with a decline in the national press market of -10.2%, excluding ABC, Público and La Gaceta. This growth rate is based particularly on ordinary sales (individual subscriptions and sales in kiosks, +2.3% vs. market -10.5%) and is compatible with an improvement in the negative margin of add-ons in 2009. This improvement in circulation has enabled ABC to cut by more than half the gap to its most immediate competitor in 2009: gap vs. #2 of 43,524 copies in 2009 vs. 108,128 copies in 2007. Performance of circulation of ABC vs. #2 and national press market
Source: OJD. Circulation data 2009 not audited. Market data national ex Público, La Gaceta and ABC in comparative effects.
Supplements and Magazines contributed 34,258 thousand euros (-14.5%) due to the effect on the consolidation perimeter of the divestment in the corporate magazine business and of the magazine Motor 16. The performance of the Supplements areas reflected the continued positive performance of circulation revenues (+0.5%), in line with the good performance of ABC (revenues from circulation revenues, adjusted for the perimeter: +0.1%). Advertising Advertising Advertising Advertising revenuesrevenuesrevenuesrevenues:::: 223,779 thousand euros compared with 296,868 thousand euros in 2008. Highlights include the outperformance of Regional Press, ABC and the Supplements of VOCENTO compared to the market in 2009, according to the i2p study by Media Hot Line. Advertising revenues in the Regional Press were 133,194 thousand euros, -23.3% vs. -26.5% market, ABC 52,931 thousand euros, -18.3% vs. -26.5%, and Supplements and Magazines 23,217 thousand euros (Supplements 2009 -25.4% vs. market -34.3%). In addition, the fall in advertising spend slowed down in the last quarter of the year: Regional Press 9M09 -25.8%, ABC 9M09 -22.9% and Supplements 9M09 -33.3%. The Free Press contributed 14,575 thousand euros,-40.9%, reflecting the impact of the economic crisis on advertising spend. Other revenuesOther revenuesOther revenuesOther revenues:::: rose to 59,044 thousand euros (+4.1%). Revenues from add-ons were stable, compared to 2008. EBITDAEBITDAEBITDAEBITDA excluding nonexcluding nonexcluding nonexcluding non----recurring recurring recurring recurring costscostscostscosts:::: 31,061 thousand euros (EBITDA -22,615 thousand euros) compared with 36,252 thousand euros in 2008. Non-recurring costs were -53,677 thousand euros, due to the restructuring process that was implemented.
ABCABCABCABC MarketMarketMarketMarket
2008200820082008
2009200920092009
AverageAverageAverageAverage
circulationcirculationcirculationcirculation
VarVarVarVar % % % % YoYYoYYoYYoY
251251251251,,,,642642642642 10.3%10.3%10.3%10.3% ----1.7%1.7%1.7%1.7%
256.650256.650256.650256.650 2,0%2,0%2,0%2,0% ----10,9%10,9%10,9%10,9%
ABCABCABCABC
2009200920092009
ABC ABC ABC ABC
VarVarVarVar % % % %
3%3%3%3% ----1.1.1.1.
256256256256,,,,650650650650 2.0%2.0%2.0%2.0% ----10.10.10.10.2%2%2%2%
336,287323,588
300,174
228,159228,159228,159228,159
251,642251,642251,642251,642
Average Average Average Average circulationcirculationcirculationcirculation ABCABCABCABC GapGapGapGap
256,650256,650256,650256,650
108,128108,128108,128108,128
77771,9461,9461,9461,946
43,52443,52443,52443,524
Average Average Average Average circulationcirculationcirculationcirculation #2#2#2#2
Vocento, S.A and SubsidiariesVocento, S.A and SubsidiariesVocento, S.A and SubsidiariesVocento, S.A and Subsidiaries
2009 Results Report
http://www.vocento.com 19
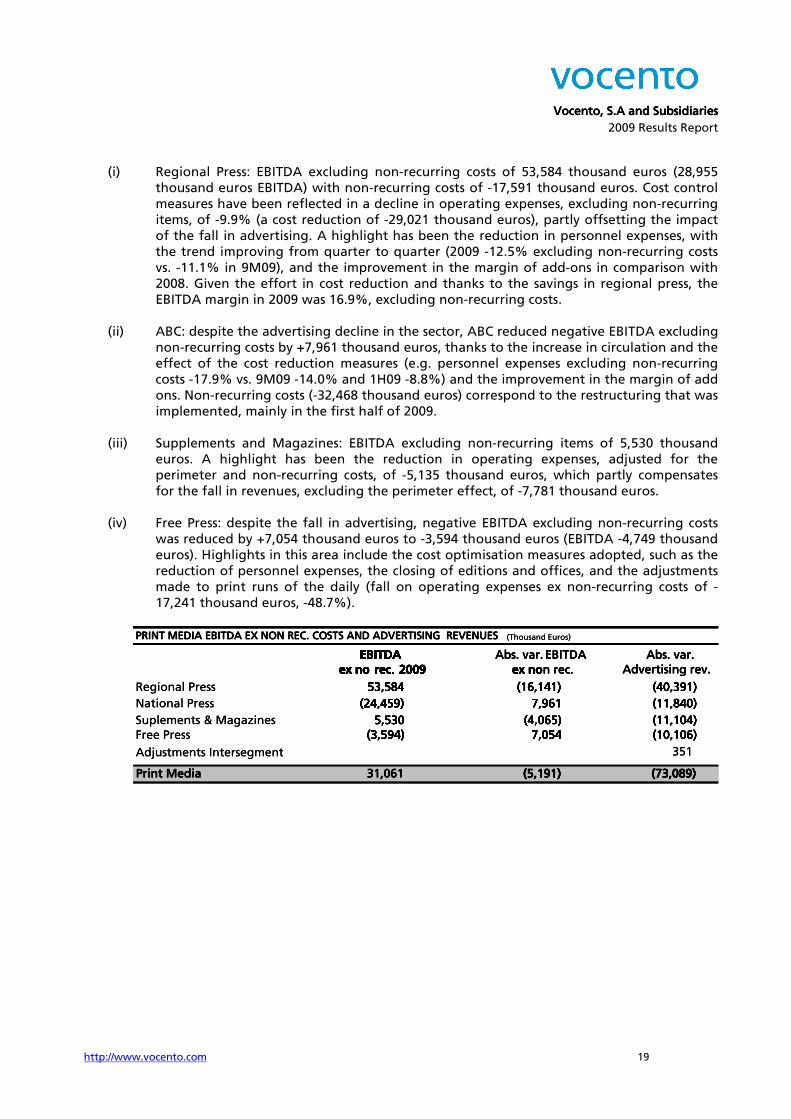
(i) Regional Press: EBITDA excluding non-recurring costs of 53,584 thousand euros (28,955 thousand euros EBITDA) with non-recurring costs of -17,591 thousand euros. Cost control measures have been reflected in a decline in operating expenses, excluding non-recurring items, of -9.9% (a cost reduction of -29,021 thousand euros), partly offsetting the impact of the fall in advertising. A highlight has been the reduction in personnel expenses, with the trend improving from quarter to quarter (2009 -12.5% excluding non-recurring costs vs. -11.1% in 9M09), and the improvement in the margin of add-ons in comparison with 2008. Given the effort in cost reduction and thanks to the savings in regional press, the EBITDA margin in 2009 was 16.9%, excluding non-recurring costs.
(ii) ABC: despite the advertising decline in the sector, ABC reduced negative EBITDA excluding
non-recurring costs by +7,961 thousand euros, thanks to the increase in circulation and the effect of the cost reduction measures (e.g. personnel expenses excluding non-recurring costs -17.9% vs. 9M09 -14.0% and 1H09 -8.8%) and the improvement in the margin of add ons. Non-recurring costs (-32,468 thousand euros) correspond to the restructuring that was implemented, mainly in the first half of 2009.
(iii) Supplements and Magazines: EBITDA excluding non-recurring items of 5,530 thousand
euros. A highlight has been the reduction in operating expenses, adjusted for the perimeter and non-recurring costs, of -5,135 thousand euros, which partly compensates for the fall in revenues, excluding the perimeter effect, of -7,781 thousand euros.
(iv) Free Press: despite the fall in advertising, negative EBITDA excluding non-recurring costs
was reduced by +7,054 thousand euros to -3,594 thousand euros (EBITDA -4,749 thousand euros). Highlights in this area include the cost optimisation measures adopted, such as the reduction of personnel expenses, the closing of editions and offices, and the adjustments made to print runs of the daily (fall on operating expenses ex non-recurring costs of -17,241 thousand euros, -48.7%).
EBITDA EBITDA EBITDA EBITDA
ex no ex no ex no ex no rec.rec.rec.rec. 2009200920092009
Abs. vAbs. vAbs. vAbs. varararar.... EBITDAEBITDAEBITDAEBITDA
ex no ex no ex no ex no
AAAAbsbsbsbs. var.. var.. var.. var.
AAAAdvertisingdvertisingdvertisingdvertising rev. rev. rev. rev.
Regional Press
National Press
Suplements & Magazines
Free Press
Medios impresosMedios impresosMedios impresosMedios impresos
53.584
(24.459)
5.530
(3.594)
(16.141)
7.961
(4.065)
7.054
(40.391)
(11.840)
(11.104)
(10.106)
351
(Thousand Euros)
EBITDA EBITDA EBITDA EBITDA
ex no ex no ex no ex no rec.rec.rec.rec. 2009200920092009 ex no ex no ex no ex no
Medios impresosMedios impresosMedios impresosMedios impresos
53.584
(24.459)
5.530
(3.594)
31.06131.06131.06131.061
53.584
(24.459)
5.530
(3.594)
31.06131.06131.06131.061
(16.141)
7.961
(4.065)
7.054
(5.191)(5.191)(5.191)(5.191)
(16,141)
7,961
(4,065)
7,054
(5.191)(5.191)(5.191)(5.191)
(40.391)
(11.840)
(11.104)
(10.106)
(73.089)(73.089)(73.089)(73.089)
(40,391)
(11,840)
(11,104)
(10,106)
(73.089)(73.089)(73.089)(73.089)
PRINT MEDIA EBITDA EX NON REC. COSTS AND ADVERTISING REVENUESPRINT MEDIA EBITDA EX NON REC. COSTS AND ADVERTISING REVENUESPRINT MEDIA EBITDA EX NON REC. COSTS AND ADVERTISING REVENUESPRINT MEDIA EBITDA EX NON REC. COSTS AND ADVERTISING REVENUES
Adjustments Intersegment
EBITDA EBITDA EBITDA EBITDA
ex no ex no ex no ex no rec.rec.rec.rec. 2009200920092009 ex no ex no ex no ex no
PrintPrintPrintPrint MediaMediaMediaMedia
53,584
(24,459)
5,530
(3,594)
EBITDA EBITDA EBITDA EBITDA
ex no ex no ex no ex no rec.rec.rec.rec. 2009200920092009 ex noex noex noex non rec.n rec.n rec.n rec.
Regional Press
National Press
Suplements & Magazines
Free Press
Medios impresosMedios impresosMedios impresosMedios impresos
53.584
(24.459)
5.530
(3.594)
(16.141)
7.961
(4.065)
7.054
(16.141)
7.961
(4.065)
7.054
(40.391)
(11.840)
(11.104)
(10.106)
351
(Thousand Euros)
EBITDA EBITDA EBITDA EBITDA
ex no ex no ex no ex no rec.rec.rec.rec. 2009200920092009
Print MediaPrint MediaPrint MediaPrint Media
53.584
(24.459)
5.530
(3.594)
31313131,,,,061061061061
53.584
(24.459)
5.530
(3.594)
(16.141)
7.961
(4.065)
7.054
(5.191)(5.191)(5.191)(5.191)
(16,141)
7,961
(4,065)
7,054
(5(5(5(5,,,,191)191)191)191)
(40.391)
(11.840)
(11.104)
(10.106)
(73.089)(73.089)(73.089)(73.089)
(40,391)
(11,840)
(11,104)
(10,106)
(73(73(73(73,,,,089)089)089)089)
Adjustments Intersegment
EBITDA EBITDA EBITDA EBITDA
ex noex noex noex no rec.rec.rec.rec. 2009200920092009
53,584
(24,459)
5,530
(3,594)
Vocento, S.A and SubsidiariesVocento, S.A and SubsidiariesVocento, S.A and SubsidiariesVocento, S.A and Subsidiaries
2009 Results Report
http://www.vocento.com 20
AudiovisualAudiovisualAudiovisualAudiovisual The strategic decisions made in the previous year in this area have enabled VOCENTO to position itself as a player in the audiovisual landscape. VOCENTO has an integrated strategy in the audiovisual market, with a national DTT license, several regional DTT licenses, a general radio station, Punto Radio, and stakes in content producers and a film distributor.
• DTTDTTDTTDTT---- Digital Terrestrial TelevisionDigital Terrestrial TelevisionDigital Terrestrial TelevisionDigital Terrestrial Television VOCENTO competes in the market with the support of national and regional DTT licenses, a scarce resource of high value, which enable it to position itself for the challenges that the sector will face from 2010, the year of the analogue switch-off. The National MarketThe National MarketThe National MarketThe National Market VOCENTO, via its indirect 55% stake in the share capital of Sociedad Gestora de Televisión Net TV S.A. (“NET TV”) is one of six private operators to have a national DTT license, and it currently operates two DTT channels: Disney Channel and Intereconomía TV. A highlight has been the gradual rise in both the consumption and the penetration of DTT. Consumption of DTT now represents a majority of total television viewing, according to TN Sofres data for December, with market share of 52.8% (+30.9 p.p. compared to December 2008). In addition, DTT now covers over 12 million households and has a penetration of 73.8% according to the 3rd EGM survey of 2009 (+28.6 p.p. from 3rd EGM survey 2008). The Spanish government has announced that it expects to end analogue broadcasting on 3 April 2010. Vocento’s partner in the capital of NET TV is The Walt Disney Company Iberia, S.L. (20%). Disney Channel had accumulated audience in December 2009 of over 4 million viewers, with DTT market share of 3.1%, and was the leading theme channel. Regional MarketRegional MarketRegional MarketRegional Market VOCENTO is in a privileged position, as it has licenses in the most important advertising markets in the advertising point of view: Madrid, Comunidad de Valencia, Andalucía, and a presence in La Rioja and Murcia. In June, a strategic agreement was reached with Viacom, based on which the regional channels of VOCENTO will be supplied with high quality content from one of the world’s leading suppliers, with major brands such as MTV, Nickelodeon, Paramount Comedy, VH1, Comedy Central and Spike.
• RadioRadioRadioRadio Punto Radio is a nationwide radio station that operates by using owned radio licenses and in association with third parties. The most relevant milestones in 2009 were in the following three areas:
i) The extension of territorial coverage with new concessions, ii) the development of the schedules, and iii) the restructuring of operations in response to the economic crisis that is impacting the
sector. In terms of extending coverage, the first highlight to mention is the acquisition of the network of broadcasters in Cataluña (Onda Ramblas) by Punto Radio, and with this the ownership of the network of Catalan concessions which until then were operated as a joint venture; and secondly, the award of a significant number of licenses in the regions of Madrid, Castilla La Mancha and Extremadura. As a result, the station has increased its network, with 17 new broadcasters, including some in such strategic areas as Madrid and Barcelona.
Vocento, S.A and SubsidiariesVocento, S.A and SubsidiariesVocento, S.A and SubsidiariesVocento, S.A and Subsidiaries
2009 Results Report
http://www.vocento.com 21
The gradual rollout in other regions, combined with the good results obtained by Punto Radio in those regions where tenders have already been held, is a cause for optimism about future improvements to coverage. In terms of improvements to programming, highlights include the incorporation of Félix Madero in the morning schedule, in the programme “Protagonistas”, during what is prime time for radio consumption, and of María José Sastre in the late evening/night in the programme “de Costa a Costa”. As a result of these actions, Punto Radio consolidated its audience in 2009 by over 530,000 listeners, with a growth rate of +3% from the previous year (according to the average of EGM studies 2008/9). Finally, and turning to the cost control measures, which are particularly important given the current advertising environment, efforts have been focused on adjusting programming costs. Finally, the situation of digital radio should be mentioned. VOCENTO has two digital radio licenses, at Punto Radio and at Corporación de Medios Radiofónicos Digitales, S.A.
• Audiovisual Production and DistributionAudiovisual Production and DistributionAudiovisual Production and DistributionAudiovisual Production and Distribution.... The presence of VOCENTO in the audiovisual production sector (the production of entertainment and fiction programmes and the distribution of films) is based on Veralia, a holding company for audiovisual production companies, which includes BocaBoca Producciones, Europroducciones with a presence in Italy through its subsidiary Europroduzione Italia), Hill Valley (a 70% stake) and Videomedia (with a 30% stake), and the film distributor Tripictures. The targets for 2009 can be summarised in two aspects: diversification of clients at the production companies, and obtaining cost synergies. The production companies of Vocento have had successes this year, with the production of Grand Prix (broadcast in Spain and Portugal), Guinness (broadcast in Italy, Poland and Greece), Se llama Copla, A tu Vera, Un beso y una flor, 21 Días, La hora de José Mota, Hospital Central, Muchachada Nui and Miniseries productions for TV such as El Pacto and Adolfo Suárez. In the future, the arrival of new national and regional DTT channels, and new forms of content distribution using ADSL, mobile phones, and wireless equipment, will lead to a surge in television supply, and could represent a business opportunity, given the demand for new content.
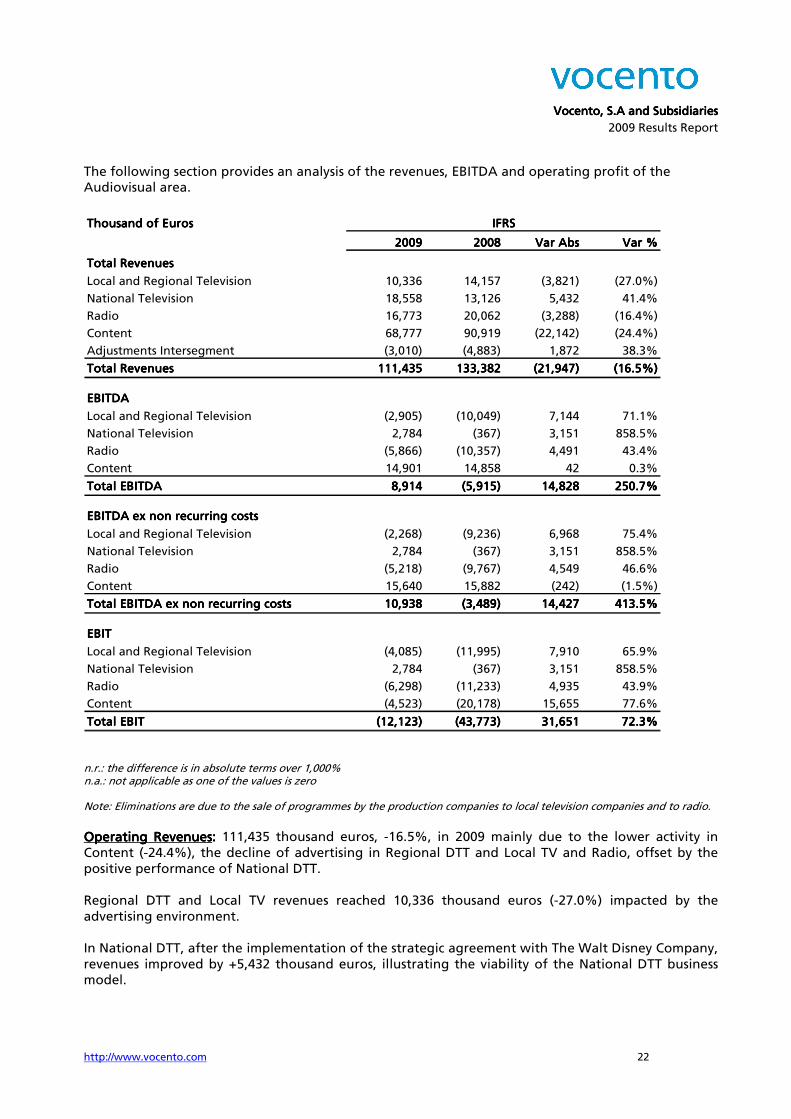
Vocento, S.A and SubsidiariesVocento, S.A and SubsidiariesVocento, S.A and SubsidiariesVocento, S.A and Subsidiaries
2009 Results Report
http://www.vocento.com 22
The following section provides an analysis of the revenues, EBITDA and operating profit of the Audiovisual area.
Thousand of EurosThousand of EurosThousand of EurosThousand of Euros
2009200920092009 2008200820082008 Var AbsVar AbsVar AbsVar Abs Var %Var %Var %Var %0000
Total RevenuesTotal RevenuesTotal RevenuesTotal Revenues
Local and Regional Television 10,336 14,157 (3,821) (27.0%)
National Television 18,558 13,126 5,432 41.4%
Radio 16,773 20,062 (3,288) (16.4%)
Content 68,777 90,919 (22,142) (24.4%)
Adjustments Intersegment (3,010) (4,883) 1,872 38.3%
Total RevenuesTotal RevenuesTotal RevenuesTotal Revenues 111,435111,435111,435111,435 133,382133,382133,382133,382 (21,947)(21,947)(21,947)(21,947) (16.5%)(16.5%)(16.5%)(16.5%)
EBITDAEBITDAEBITDAEBITDA
Local and Regional Television (2,905) (10,049) 7,144 71.1%
National Television 2,784 (367) 3,151 858.5%
Radio (5,866) (10,357) 4,491 43.4%
Content 14,901 14,858 42 0.3%
Total EBITDATotal EBITDATotal EBITDATotal EBITDA 8,9148,9148,9148,914 (5,915)(5,915)(5,915)(5,915) 14,82814,82814,82814,828 250.7%250.7%250.7%250.7%
EBITDA ex non recurring costsEBITDA ex non recurring costsEBITDA ex non recurring costsEBITDA ex non recurring costs
Local and Regional Television (2,268) (9,236) 6,968 75.4%
National Television 2,784 (367) 3,151 858.5%
Radio (5,218) (9,767) 4,549 46.6%
Content 15,640 15,882 (242) (1.5%)
Total EBITDA ex non recurring costsTotal EBITDA ex non recurring costsTotal EBITDA ex non recurring costsTotal EBITDA ex non recurring costs 10,93810,93810,93810,938 (3,489)(3,489)(3,489)(3,489) 14,42714,42714,42714,427 413.5%413.5%413.5%413.5%
EBITEBITEBITEBIT
Local and Regional Television (4,085) (11,995) 7,910 65.9%
National Television 2,784 (367) 3,151 858.5%
Radio (6,298) (11,233) 4,935 43.9%
Content (4,523) (20,178) 15,655 77.6%
Total EBITTotal EBITTotal EBITTotal EBIT (12,123)(12,123)(12,123)(12,123) (43,773)(43,773)(43,773)(43,773) 31,65131,65131,65131,651 72.3%72.3%72.3%72.3%
IFRSIFRSIFRSIFRS
n.r.: the difference is in absolute terms over 1,000% n.a.: not applicable as one of the values is zero Note: Eliminations are due to the sale of programmes by the production companies to local television companies and to radio.
Operating RevenuesOperating RevenuesOperating RevenuesOperating Revenues: : : : 111,435 thousand euros, -16.5%, in 2009 mainly due to the lower activity in Content (-24.4%), the decline of advertising in Regional DTT and Local TV and Radio, offset by the positive performance of National DTT. Regional DTT and Local TV revenues reached 10,336 thousand euros (-27.0%) impacted by the advertising environment. In National DTT, after the implementation of the strategic agreement with The Walt Disney Company, revenues improved by +5,432 thousand euros, illustrating the viability of the National DTT business model.
Vocento, S.A and SubsidiariesVocento, S.A and SubsidiariesVocento, S.A and SubsidiariesVocento, S.A and Subsidiaries
2009 Results Report
http://www.vocento.com 23
Radio revenues were 16,773 thousand euros, due mainly to the fall in advertising revenues, the decline of which slowed: (2009 -16.0% vs. 9M09 -26.6%) and which fell in 2009 at a similar rate to the market (-15.8% according to the i2p report from Media Hot Line) despite the current deficit in the coverage of Punto Radio. The performance at Content (68,777 thousand euros) is partly due to the lower activity of the production companies. EBITDA EBITDA EBITDA EBITDA excluding nonexcluding nonexcluding nonexcluding non----recurring itemsrecurring itemsrecurring itemsrecurring items:::: gradually improving efficiency, with a rise in EBITDA excluding non-recurring costs of +14,427 thousand euros to 10,938 thousand euros (EBITDA 8,914 thousand euros), thanks to the positive impact of cost reductions:
(i) Regional DTT and Local TV: generalised cost reduction measures (focused on
programming and production) and selective divestments of local television stations have practically halved the cost base, and enabled an improvement in EBITDA excluding non-recurring costs of +6,968 thousand euros in a difficult advertising environment.
(ii) National DTT: positive EBITDA of 2,784 thousand euros and an improvement of +3,151
thousand euros, illustrating the viability of the business model for DTT and its profitability, ahead of the imminent analogue switch-off.
(iii) Radio: EBITDA excluding non-recurring costs of +4,549 thousand euros, which represents
almost halving the negative EBITDA of the previous year, based on the cost reduction programme, and in spite of the adverse performance of advertising in most of the year.
(iv) Content: EBITDA excluding non-recurring costs 15,640 thousand euros, the same level as in
2008 thanks to an improvement in profitability (EBITDA margin 22.7%, +5.3 p.p.), a consequence of the centralisation of corporate services and the reduction of costs.
OperaOperaOperaOperating Profitting Profitting Profitting Profit:::: (because of the level of amortization in this area, it is more appropriate to analyse the operating profit line) was -12,123 thousand euros, including amortisation of -17,387 thousand euros in the Content area.
Vocento, S.A and SubsidiariesVocento, S.A and SubsidiariesVocento, S.A and SubsidiariesVocento, S.A and Subsidiaries
2009 Results Report
http://www.vocento.com 24
InternetInternetInternetInternet The Internet market in Spain remains in a growth stage, in terms of both penetration in society and in the use of broadband (44.6% in 2008 compared with 39.2% in 2007, according to the eEspaña 2009 report of the INE), and also in terms of usage by individuals and by advertisers. The current growth trend is expected to continue in the medium term: according to research by Atos Consulting, 73% of Spanish households will have broadband access in 2012. In response to the current changes in the ways of accessing information and to the requirement for instantaneous information and for interactivity, VOCENTO, supported by the strength of its brands, has reinforced its positioning on the Internet, based on: Digital editions (news portals which include the Local Portals, ABC.es and Que.es), Vertical Portals (finanzas.com and mujerhoy.com), Classified (infoempleo.com, pisos.com and Autocasion.com) and Directories (11870.com). The Internet is more than just a strategic commitment, it is a reality for VOCENTO, which sees the Internet as a privileged platform for its brands, and as a media channel which all of the company titles have now adapted to, and which has enabled the creation of new national brands for local consumption. The leading position of the portals of VOCENTO is reflected in the research of 4 International Media & Newspapers, which gives it six portals in the top 10 (ABC.es, Que.es, and the digital editions of El Correo, El Diario Vasco, La Verdad and Diario Sur), with its 14 news portals in the top 20 most visited portals in Spain (excluding sports and financial portals). In 2009, VOCENTO entered the directories business with the acquisition of a 33% stake in 11870.com, which is an innovative play that is differentiated from traditional directories due to the leadership position of VOCENTO in local markets and the participation of users in the configuration of the sites and services on offer. 11870.com reaches 0.8 million unique monthly users, +67% January 2010 vs. January 2009, according to Nielsen Netview in January 2010. The online presence is completed by the B2B activity of Sarenet, which provides companies with connectivity solutions. In the Digital Editions of the regional media, there has been a significant redesign of the local portals, with a clear commitment to both user interactivity and the coverage of local news and events, illustrated by audiovisual content, and this has allowed the twelve local portals to consolidate their leadership in their areas of influence. At ABC.es, which has outperformed its competition on the Internet (+58% January 2010 vs. January 2009 vs. category +8% and winning +6 p.p. market share in the top #3, to 23%), significant events in the second half of the year include the launch of the online Hemeroteque, which contains more than five million documents dating back to over one hundred years, new Web 2.0 contents, Web TV, and a pioneering mobile application for smart phones (the iPhone and the Android operating system of Google). For its part, Que.es has created the first news based social network in Spain, reaching 1.3 million unique monthly users in one year.
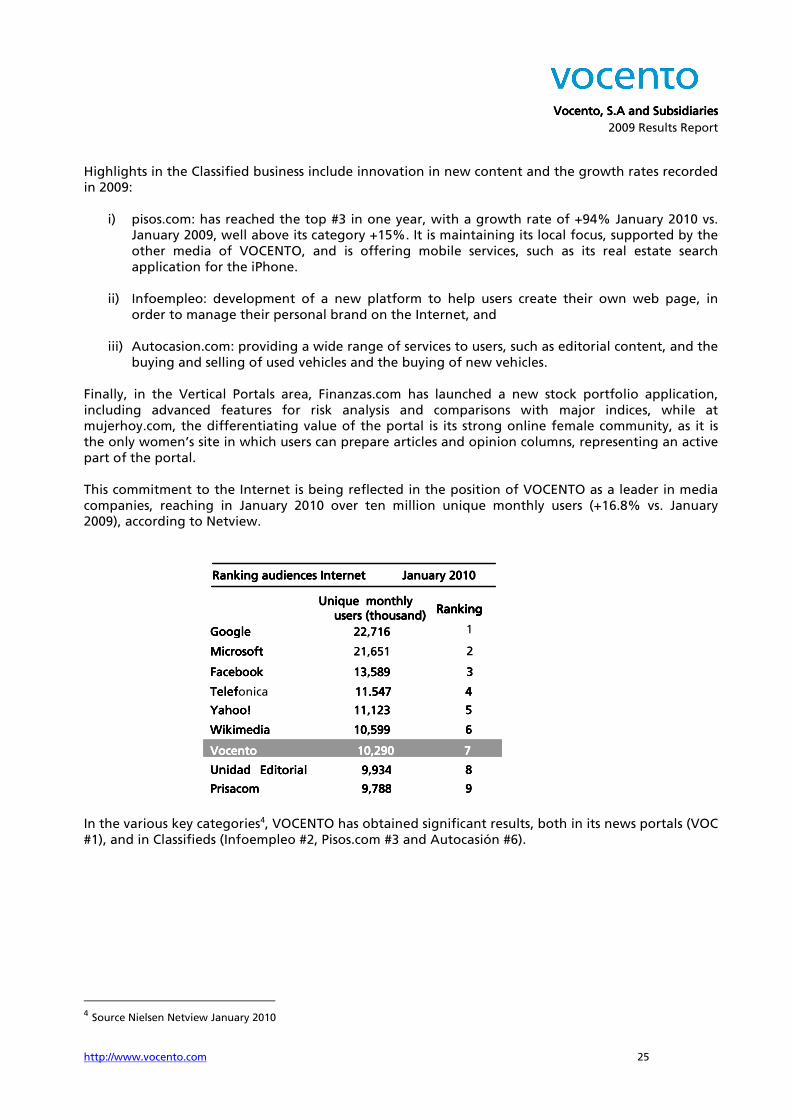
Vocento, S.A and SubsidiariesVocento, S.A and SubsidiariesVocento, S.A and SubsidiariesVocento, S.A and Subsidiaries
2009 Results Report
http://www.vocento.com 25
Highlights in the Classified business include innovation in new content and the growth rates recorded in 2009:
i) pisos.com: has reached the top #3 in one year, with a growth rate of +94% January 2010 vs. January 2009, well above its category +15%. It is maintaining its local focus, supported by the other media of VOCENTO, and is offering mobile services, such as its real estate search application for the iPhone.
ii) Infoempleo: development of a new platform to help users create their own web page, in
order to manage their personal brand on the Internet, and iii) Autocasion.com: providing a wide range of services to users, such as editorial content, and the
buying and selling of used vehicles and the buying of new vehicles. Finally, in the Vertical Portals area, Finanzas.com has launched a new stock portfolio application, including advanced features for risk analysis and comparisons with major indices, while at mujerhoy.com, the differentiating value of the portal is its strong online female community, as it is the only women’s site in which users can prepare articles and opinion columns, representing an active part of the portal. This commitment to the Internet is being reflected in the position of VOCENTO as a leader in media companies, reaching in January 2010 over ten million unique monthly users (+16.8% vs. January 2009), according to Netview. In the various key categories4, VOCENTO has obtained significant results, both in its news portals (VOC #1), and in Classifieds (Infoempleo #2, Pisos.com #3 and Autocasión #6).
4 Source Nielsen Netview January 2010
Microsoft
Facebook 13.589 3
Telef 11.547 4
Yahoo! 11.123 5
Wikimedia 10.599 6
VocentoVocentoVocentoVocento 10.290 710.290 710.290 710.290 7
Unidad Editorial 9.934 8
Prisacom 9.788 9
Ranking audiences Internet January 2010Ranking audiences Internet January 2010Ranking audiences Internet January 2010Ranking audiences Internet January 2010
Unique monthlyUnique monthlyUnique monthlyUnique monthlyRankingRankingRankingRanking
users (thousand)users (thousand)users (thousand)users (thousand)
Google 22.716
Microsoft 21.651
Facebook 13.589 3
Telef 11.547 4
Yahoo! 11.123 5
Wikimedia 10.599 6
VocentoVocentoVocentoVocento 10.290 710.290 710.290 710.290 7
Unidad Editorial 9.934 8
Prisacom 9.788 9
2
Google 22.716
Microsoft
Facebook 13.589 3
Telefonica 11.547 4
Yahoo! 11.123 5
Wikimedia 10.599 6
VocentoVocentoVocentoVocento 10.290 710.290 710.290 710.290 7
Unidad Editorial 9.934 8
Prisacom 9.788 9
RankingRankingRankingRanking
Google 22,716
Microsoft 21,651
Facebook 13,589 3
11.547 4
Yahoo! 11,123 5
Wikimedia 10,599 6
VocentoVocentoVocentoVocento 10,290 10,290 10,290 10,290 7 7 7 7
Unidad Editorial 9,934 8
Prisacom 9,788 9
2
1
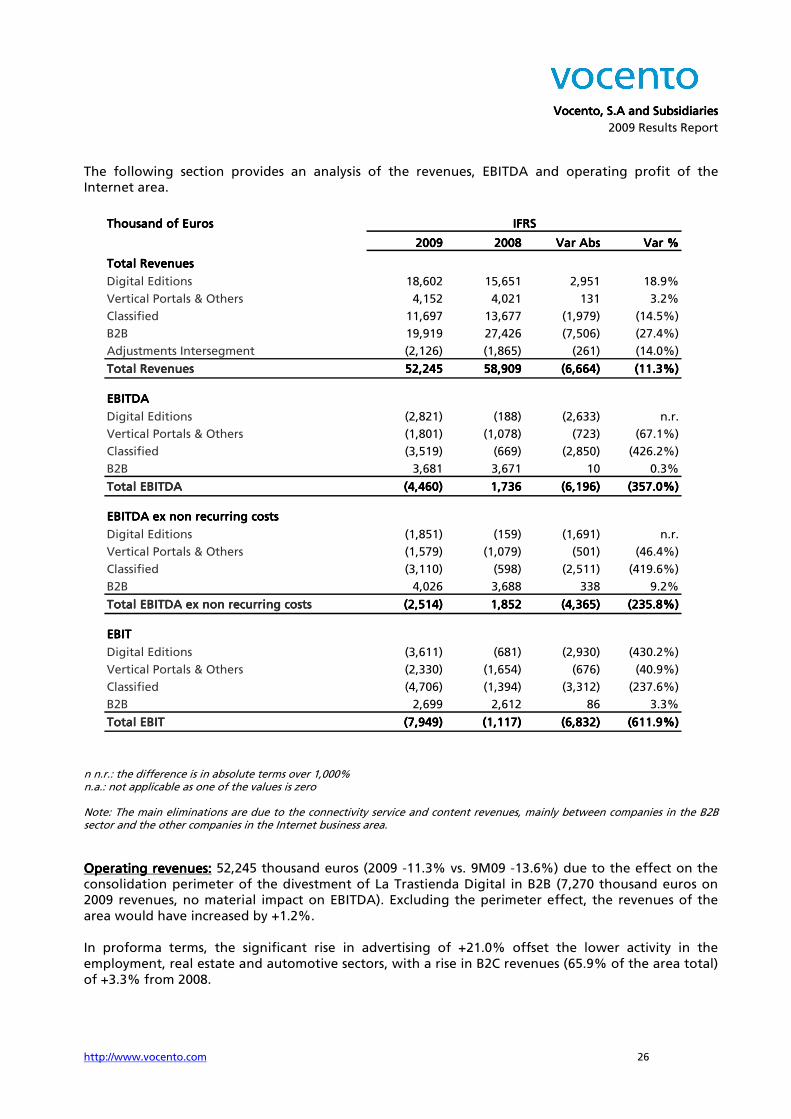
Vocento, S.A and SubsidiariesVocento, S.A and SubsidiariesVocento, S.A and SubsidiariesVocento, S.A and Subsidiaries
2009 Results Report
http://www.vocento.com 26
The following section provides an analysis of the revenues, EBITDA and operating profit of the Internet area. n n.r.: the difference is in absolute terms over 1,000% n.a.: not applicable as one of the values is zero Note: The main eliminations are due to the connectivity service and content revenues, mainly between companies in the B2B sector and the other companies in the Internet business area.
Operating revenuesOperating revenuesOperating revenuesOperating revenues:::: 52,245 thousand euros (2009 -11.3% vs. 9M09 -13.6%) due to the effect on the consolidation perimeter of the divestment of La Trastienda Digital in B2B (7,270 thousand euros on 2009 revenues, no material impact on EBITDA). Excluding the perimeter effect, the revenues of the area would have increased by +1.2%. In proforma terms, the significant rise in advertising of +21.0% offset the lower activity in the employment, real estate and automotive sectors, with a rise in B2C revenues (65.9% of the area total) of +3.3% from 2008.
Thousand of EurosThousand of EurosThousand of EurosThousand of Euros
2009200920092009 2008200820082008 Var AbsVar AbsVar AbsVar Abs Var %Var %Var %Var %
Total RevenuesTotal RevenuesTotal RevenuesTotal Revenues
Digital Editions 18,602 15,651 2,951 18.9%
Vertical Portals & Others 4,152 4,021 131 3.2%
Classified 11,697 13,677 (1,979) (14.5%)
B2B 19,919 27,426 (7,506) (27.4%)
Adjustments Intersegment (2,126) (1,865) (261) (14.0%)
Total RevenuesTotal RevenuesTotal RevenuesTotal Revenues 52,24552,24552,24552,245 58,90958,90958,90958,909 (6,664)(6,664)(6,664)(6,664) (11.3%)(11.3%)(11.3%)(11.3%)
EBITDAEBITDAEBITDAEBITDA
Digital Editions (2,821) (188) (2,633) n.r.
Vertical Portals & Others (1,801) (1,078) (723) (67.1%)
Classified (3,519) (669) (2,850) (426.2%)
B2B 3,681 3,671 10 0.3%
Total EBITDATotal EBITDATotal EBITDATotal EBITDA (4,460)(4,460)(4,460)(4,460) 1,7361,7361,7361,736 (6,196)(6,196)(6,196)(6,196) (357.0%)(357.0%)(357.0%)(357.0%)
EBITDA ex non recurring costsEBITDA ex non recurring costsEBITDA ex non recurring costsEBITDA ex non recurring costs
Digital Editions (1,851) (159) (1,691) n.r.
Vertical Portals & Others (1,579) (1,079) (501) (46.4%)
Classified (3,110) (598) (2,511) (419.6%)
B2B 4,026 3,688 338 9.2%
Total EBITDA ex non recurring costsTotal EBITDA ex non recurring costsTotal EBITDA ex non recurring costsTotal EBITDA ex non recurring costs (2,514)(2,514)(2,514)(2,514) 1,8521,8521,8521,852 (4,365)(4,365)(4,365)(4,365) (235.8%)(235.8%)(235.8%)(235.8%)
EBITEBITEBITEBIT
Digital Editions (3,611) (681) (2,930) (430.2%)
Vertical Portals & Others (2,330) (1,654) (676) (40.9%)
Classified (4,706) (1,394) (3,312) (237.6%)
B2B 2,699 2,612 86 3.3%
Total EBITTotal EBITTotal EBITTotal EBIT (7,949)(7,949)(7,949)(7,949) (1,117)(1,117)(1,117)(1,117) (6,832)(6,832)(6,832)(6,832) (611.9%)(611.9%)(611.9%)(611.9%)
IFRSIFRSIFRSIFRS

Vocento, S.A and SubsidiariesVocento, S.A and SubsidiariesVocento, S.A and SubsidiariesVocento, S.A and Subsidiaries
2009 Results Report
http://www.vocento.com 27
Advertising Advertising Advertising Advertising revenuesrevenuesrevenuesrevenues:::: up +21.0% to 23,986 thousand euros, now representing 8.7% of the total advertising revenues of VOCENTO (+3.1 p.p. vs. 2008). The improvement in unique monthly users and the major presence in news portals (a market niche which is increasingly valued by advertisers, because of its appeal to users), is reflected in B2C advertising revenues (+23.7%), which in the current advertising environment compares with market growth of +3.1%, according to the estimates of the i2p study of Media Hot Line. By business segment, the growth rate of advertising revenues has been as follows: Digital Editions +25.3% and Classified +31.1%, despite the difficult situation of their markets. Other rOther rOther rOther revenuesevenuesevenuesevenues:::: 28,142 thousand euros, down -27.7%, due to the effect on the consolidation perimeter of the divestment of La Trastienda Digital in B2B (proforma other revenues -11.0%) and the impact of the current recession on the labour market. EBITDA EBITDA EBITDA EBITDA excluding nonexcluding nonexcluding nonexcluding non----recurring itemsrecurring itemsrecurring itemsrecurring items:::: -2,514 thousand euros, excluding non-recurring costs (EBITDA -4,460 thousand euros), as a result of the strategic commitment to Classified and the continued development of the Digital Editions.

Vocento, S.A and SubsidiariesVocento, S.A and SubsidiariesVocento, S.A and SubsidiariesVocento, S.A and Subsidiaries
2009 Results Report
http://www.vocento.com 28
Other BusinessesOther BusinessesOther BusinessesOther Businesses In addition to its businesses in Print Media, Audiovisual, and the Internet, mentioned above, VOCENTO also has the following businesses: Printing, Distribution, and Other Subsidiaries linked to the regional multimedia. Major businesses include Comeco Impresión and Distribuciones Comecosa, whose activity is related to the Print Media business. At the end of 2006, a plan was implemented which segregated the printing centres for various regional newspapers with other publishing groups, or by themselves, in order to free up the publishers from industrial activities, and also to carry out a technological upgrade of the equipment, in order to improve the quality of printing and to enable inserts. As part of this segregation process, in November 2009, the printing of ABC moved to the new plant of Rotomadrid, which allows for the commercial printing of the daily newspaper in full colour. The following section provides an analysis of the revenues, EBITDA and operating profit of the Other Businesses area.
n.r.: the difference is in absolute terms over 1,000% n.a.: not applicable as one of the values is zero
Note: Eliminations are due to: a) the distribution of free dailies by the distribution companies, and b) the printing of the free dailies.
Thousand of EurosThousand of EurosThousand of EurosThousand of Euros
2009200920092009 2008200820082008 Var AbsVar AbsVar AbsVar Abs Var %Var %Var %Var %0000
Total RevenuesTotal RevenuesTotal RevenuesTotal Revenues
Distribution 172,714 173,992 (1,278) (0.7%)
Printing 31,974 32,024 (50) (0.2%)
Others 12,137 13,882 (1,745) (12.6%)
Adjustments Intersegment (893) (1,288) 395 30.7%
Total RevenuesTotal RevenuesTotal RevenuesTotal Revenues 215,932215,932215,932215,932 218,609218,609218,609218,609 (2,677)(2,677)(2,677)(2,677) (1.2%)(1.2%)(1.2%)(1.2%)
EBITDAEBITDAEBITDAEBITDA
Distribution 3,032 3,173 (141) (4.5%)
Printing 8,693 11,313 (2,620) (23.2%)
Others (2,406) 407 (2,813) (691.2%)
Total EBITDATotal EBITDATotal EBITDATotal EBITDA 9,3199,3199,3199,319 14,89314,89314,89314,893 (5,574)(5,574)(5,574)(5,574) (37.4%)(37.4%)(37.4%)(37.4%)
EBITDA ex non recurring costsEBITDA ex non recurring costsEBITDA ex non recurring costsEBITDA ex non recurring costs
Distribution 3,055 3,329 (274) (8.2%)
Printing 10,739 11,410 (672) (5.9%)
Others (106) 747 (853) (114.2%)
Total EBITDA ex non recurring costsTotal EBITDA ex non recurring costsTotal EBITDA ex non recurring costsTotal EBITDA ex non recurring costs 13,68713,68713,68713,687 15,48615,48615,48615,486 (1,799)(1,799)(1,799)(1,799) (11.6%)(11.6%)(11.6%)(11.6%)
EBITEBITEBITEBIT
Distribution 2,539 2,694 (155) (5.8%)
Printing 3,102 3,549 (447) (12.6%)
Others (2,542) 167 (2,709) n.r.
Total EBITTotal EBITTotal EBITTotal EBIT 3,0993,0993,0993,099 6,4106,4106,4106,410 (3,312)(3,312)(3,312)(3,312) (51.7%)(51.7%)(51.7%)(51.7%)
IFRSIFRSIFRSIFRS

Vocento, S.A and SubsidiariesVocento, S.A and SubsidiariesVocento, S.A and SubsidiariesVocento, S.A and Subsidiaries
2009 Results Report
http://www.vocento.com 29
Operating RevenuesOperating RevenuesOperating RevenuesOperating Revenues:::: 215,932 thousand euros, -1.2%, reflecting the ties of the Printing and Distribution area to the Print Media area. EBITDAEBITDAEBITDAEBITDA ex ex ex excludingcludingcludingcluding nonnonnonnon----recurring itemsrecurring itemsrecurring itemsrecurring items:::: 13,687 thousand euros, with 10,739 thousand euros in the Printing area (EBITDA of the Rotomadrid plant 761 thousand euros) and 3,055 thousand euros in the Distribution area excluding non-recurring costs, with the lower activity in the Print Media area offset by a cost control effort and by the diversification in product distribution in the Distribution area.
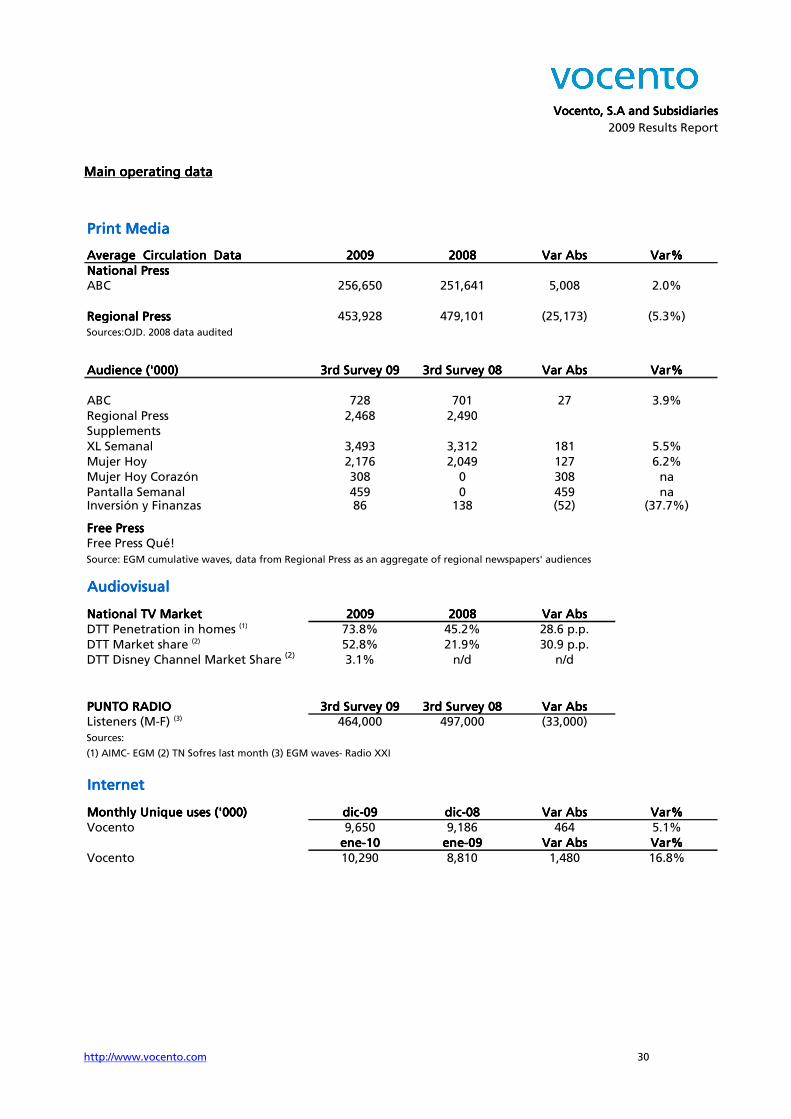
Vocento, S.A and SubsidiariesVocento, S.A and SubsidiariesVocento, S.A and SubsidiariesVocento, S.A and Subsidiaries
2009 Results Report
http://www.vocento.com 30
Main operating dataMain operating dataMain operating dataMain operating data
Print MediaPrint MediaPrint MediaPrint Media
Average Circulation DataAverage Circulation DataAverage Circulation DataAverage Circulation Data 2009200920092009 2008200820082008 Var AbsVar AbsVar AbsVar Abs Var%Var%Var%Var%
National PressNational PressNational PressNational Press
ABC 256,650 251,641 5,008 2.0%
Regional PressRegional PressRegional PressRegional Press 453,928 479,101 (25,173) (5.3%)
Sources:OJD. 2008 data audited
Audience ('000)Audience ('000)Audience ('000)Audience ('000) 3rd Survey 093rd Survey 093rd Survey 093rd Survey 09 3rd Survey 083rd Survey 083rd Survey 083rd Survey 08 Var AbsVar AbsVar AbsVar Abs Var%Var%Var%Var%
ABC 728 701 27 3.9%
Regional Press 2,468 2,490
Supplements
XL Semanal 3,493 3,312 181 5.5%
Mujer Hoy 2,176 2,049 127 6.2%
Mujer Hoy Corazón 308 0 308 na
Pantalla Semanal 459 0 459 naInversión y Finanzas 86 138 (52) (37.7%)
Free PressFree PressFree PressFree Press
Free Press Qué!
Source: EGM cumulative waves, data from Regional Press as an aggregate of regional newspapers' audiences
AudiovisualAudiovisualAudiovisualAudiovisual
National TV MarketNational TV MarketNational TV MarketNational TV Market 2009200920092009 2008200820082008 Var AbsVar AbsVar AbsVar Abs
DTT Penetration in homes (1) 73.8% 45.2% 28.6 p.p.
DTT Market share (2) 52.8% 21.9% 30.9 p.p.
DTT Disney Channel Market Share (2) 3.1% n/d n/d
PUNTO RADIOPUNTO RADIOPUNTO RADIOPUNTO RADIO 3rd Survey 093rd Survey 093rd Survey 093rd Survey 09 3rd Survey 083rd Survey 083rd Survey 083rd Survey 08 Var AbsVar AbsVar AbsVar Abs
Listeners (M-F) (3) 464,000 497,000 (33,000)
Sources:
(1) AIMC- EGM (2) TN Sofres last month (3) EGM waves- Radio XXI
InternetInternetInternetInternet
Monthly Unique uses ('000)Monthly Unique uses ('000)Monthly Unique uses ('000)Monthly Unique uses ('000) dic-09dic-09dic-09dic-09 dic-08dic-08dic-08dic-08 Var AbsVar AbsVar AbsVar Abs Var%Var%Var%Var%
Vocento 9,650 9,186 464 5.1%
ene-10ene-10ene-10ene-10 ene-09ene-09ene-09ene-09 Var AbsVar AbsVar AbsVar Abs Var%Var%Var%Var%
Vocento 10,290 8,810 1,480 16.8%
Vocento, S.A and SubsidiariesVocento, S.A and SubsidiariesVocento, S.A and SubsidiariesVocento, S.A and Subsidiaries
2009 Results Report
http://www.vocento.com 31
LEGAL DISCLAIMERLEGAL DISCLAIMERLEGAL DISCLAIMERLEGAL DISCLAIMER
This document contains statements that constitute forward looking statements in its general meaning and within the meaning of the Private Securities Litigation Reform Act of 1995. These statements appear in a number of places in this document and include statements regarding future growth in the different business lines and the global business, market share, financial results and other aspects of the activity and situation relating to the Company. Analysts and investors should bear in mind that such estimates do not amount to any warranty as to the future behaviour or results of the Company, and they shall bear all risks and uncertainties with regard to relevant aspects, and thus, the real future results and behaviour of the Company might be substantially different from what is stated in the said predictions or estimates. Analysts and investors are cautioned not to place undue reliance on those forward looking statements which speak only as of the date of this presentation. Vocento. S.A. undertakes no obligation to release publicly the results of any revisions to these forward looking statements which may be made to reflect events and circumstances after the date of this presentation, including, without limitation, changes in Vocento’s business or acquisition strategy or to reflect the occurrence of unanticipated events. Analysts and investors are encouraged to consult the Company's Annual Report as well as periodic filings filed with the Spanish Market Regulator. The financial information contained in this document has been prepared under International Financial Reporting Standards (IFRS). This financial information is unaudited and. therefore. is subject to potential future modifications. This document is only provided for information purposes and does not constitute. nor may it be interpreted as. an offer to sell or exchange or acquire. or solicitation for offers to purchase any share in the Company. Translation of a report originally issued in Spanish, In the event of a discrepancy, the Spanish-language version prevails.
CONTACT DATACONTACT DATACONTACT DATACONTACT DATA
Investor Investor Investor Investor Relations Relations Relations Relations C/ Juan Ignacio Luca de Tena, 7 28027 Madrid Tel.: +34 91.743.81.04 Fax: +34 91.742.63.52 e-mail: [email protected]