vodacom consolidated annual financial statements · 2018-07-03 · the consolidated annual...
TRANSCRIPT

Vodacom G
roup Limited
Consolidated annual financial statements for the year ended 31 M
arch 2016
Consolidated annual financial statements
Vodacom
for the year ended 31 March 2016

01 Directors’ statement of responsibility
01 Certificate by the Company Secretary
02 Independent auditor’s report on the consolidated annual financial statements
03 Directors’ report
10 Report of the Audit, Risk and Compliance Committee
13 Consolidated income statement
14 Consolidated statement of comprehensive income
15 Consolidated statement of financial position
16 Consolidated statement of changes in equity
18 Consolidated statement of cash flows
19 Notes to the consolidated annual financial statements
The preparation of these consolidated annual financial statements was supervised by the Chief Financial Officer, Dr. phil. T. Streichert and they have been audited by the independent auditor, PricewaterhouseCoopers Inc..
Summarised Company financial statements88 Independent auditor’s report on the summarised Company
financial statements
89 Summarised Company income statement
89 Summarised Company statement of comprehensive income
90 Summarised Company statement of financial position
91 Summarised Company statement of changes in equity
92 Summarised Company statement of cash flows
93 Notes to the Summarised Company financial statements
97 Addendum A: Interest in material subsidiaries
Vodacom Group Limited Consolidated annual financial statements for the year ended 31 March 2016
Consolidated annual financial statements
Contents
The directors are responsible for the preparation, integrity and fair presentation of the consolidated annual financial statements of Vodacom Group Limited, its subsidiaries, joint venture, associate and special purpose entities (‘the Group’).
The consolidated annual financial statements have been audited by the independent accounting firm PricewaterhouseCoopers Inc. which was given unrestricted access to all financial records and related data, including minutes of meetings of shareholders, the Board and committees of the Board. The directors believe that all representations made to the independent auditors during their audit were valid and appropriate. The report of the auditors is presented on the next page.
The consolidated annual financial statements for the year ended 31 March 2016 presented on pages 03 to 87 have been prepared in accordance with International Financial Reporting Standards (‘IFRS’) as issued by the International Accounting Standards Board (‘IASB’), the Financial Reporting Guides as issued by the South African Institute of Chartered Accountants (‘SAICA’) Accounting Practices Committee, Financial Pronouncements as issued by the Financial Reporting Standards Council, the JSE Listings Requirements and the requirements of the Companies Act of 2008, as amended. They are based on appropriate accounting policies which have been consistently applied and which are supported by reasonable and prudent judgements, including judgements involving estimations. The going concern basis has been adopted in preparing the consolidated annual financial statements. The directors have no reason to believe that the Group will not be a going concern in the foreseeable future based on forecasts and available cash resources.
The directors are also responsible for the Group’s system of internal controls. These are designed to provide reasonable, but not absolute, assurance as to the reliability of the consolidated annual financial statements and to adequately safeguard, verify and maintain accountability of assets. These controls are monitored throughout the Group by management and employees with the necessary segregation of authority and duties. Processes are in place to monitor internal controls, to identify material breakdowns and implement timely corrective action.
The consolidated annual financial statements were approved by the Board on 3 June 2016 and are signed on its behalf by:
MP Moyo MS Aziz Joosub T StreichertChairman Chief Executive Officer Chief Financial Officer
In terms of section 88(2)(e) of the Companies Act of 2008, as amended, I certify that, to the best of my knowledge and belief, Vodacom Group Limited has lodged with the Registrar of Companies for the financial year ended 31 March 2016, all such returns and notices as are required of a public company in terms of the Companies Act of 2008, as amended, and that all such returns and notices are true, correct and up to date.
SF LinfordCompany Secretary
3 June 2016
01
Directors’ statement of responsibility
Certificate by the Company Secretary

To the shareholders of Vodacom Group Limited
Report on the financial statementsWe have audited the consolidated financial statements of Vodacom Group Limited (‘the Group’) set out on pages 13 to 87, which comprise the consolidated statement of financial position as at 31 March 2016, and the consolidated income statement, consolidated statement of comprehensive income, consolidated statement of changes in equity and consolidated statement of cash flows for the year then ended, and the notes, comprising a summary of significant accounting policies and other explanatory information.
Directors’ responsibility for the consolidated financial statementsThe Group’s directors are responsible for the preparation and fair presentation of these consolidated financial statements in accordance with International Financial Reporting Standards and the requirements of the Companies Act of South Africa, and for such internal control as the directors determine is necessary to enable the preparation of consolidated financial statements that are free from material misstatement, whether due to fraud or error.
Auditors’ responsibilityOur responsibility is to express an opinion on these consolidated financial statements based on our audit. We conducted our audit in accordance with International Standards on Auditing. Those standards require that we comply with ethical requirements and plan and perform the audit to obtain reasonable assurance about whether the consolidated financial statements are free from material misstatement.
An audit involves performing procedures to obtain audit evidence about the amounts and disclosures in the financial statements. The procedures selected depend on the auditor’s judgement, including the assessment of the risks of material misstatement of the consolidated financial statements, whether due to fraud or error. In making those risk assessments, the auditor considers internal control relevant to the entity’s preparation and fair presentation of the consolidated financial statements in order to design audit procedures that are appropriate in the circumstances, but not for the purpose of expressing an opinion on the effectiveness of the entity’s internal control. An audit also includes evaluating the appropriateness of accounting policies used and the reasonableness of accounting estimates made by management, as well as evaluating the overall presentation of the consolidated financial statements.
We believe that the audit evidence we have obtained is sufficient and appropriate to provide a basis for our audit opinion.
OpinionIn our opinion, the consolidated financial statements present fairly, in all material respects, the consolidated financial position of the Group as at 31 March 2016, and its consolidated financial performance and its consolidated cash flows for the year then ended in accordance with International Financial Reporting Standards and the requirements of the Companies Act of South Africa.
Other reports required by the Companies Act As part of our audit of the consolidated financial statements for the year ended 31 March 2016, we have read the Directors’ report, the report of the Audit, Risk and Compliance Committee and the certificate by the Company Secretary for the purpose of identifying whether there are material inconsistencies between these reports and the audited consolidated financial statements. These reports are the responsibility of the respective preparers. Based on reading these reports we have not identified material inconsistencies between these reports and the audited consolidated financial statements. However, we have not audited these reports and accordingly do not express an opinion on these reports.
Report on other legal and regulatory requirementsIn terms of the IRBA Rule published in Government Gazette Number 39475 dated 4 December 2015, we report that PricewaterhouseCoopers Inc. has been the auditor of Vodacom Group Limited for 2 years.
PricewaterhouseCoopers Inc. Director: D.B. von HoesslinRegistered Auditor Pretoria3 June 2016
Vodacom Group Limited Consolidated annual financial statements for the year ended 31 March 2016
02
Independent auditor’s report on the consolidated annual financial statements
Nature of businessVodacom Group Limited (‘the Company’) is an investment holding company. Its principal subsidiaries are engaged in the provision of a wide range of communications products and services including but not limited to voice, messaging, converged services, broadband and data connectivity.
There have been no material changes to the nature of the Group’s business from the prior year.
Financial resultsEarnings attributable to equity holders of the Group for the year ended 31 March 2016 were R12 917 million (2015: R12 672 million) representing basic earnings per share of 881 cents (2015: 864 cents).
Full details on the financial position and results of the Group are set out in these consolidated annual financial statements.
Dividends
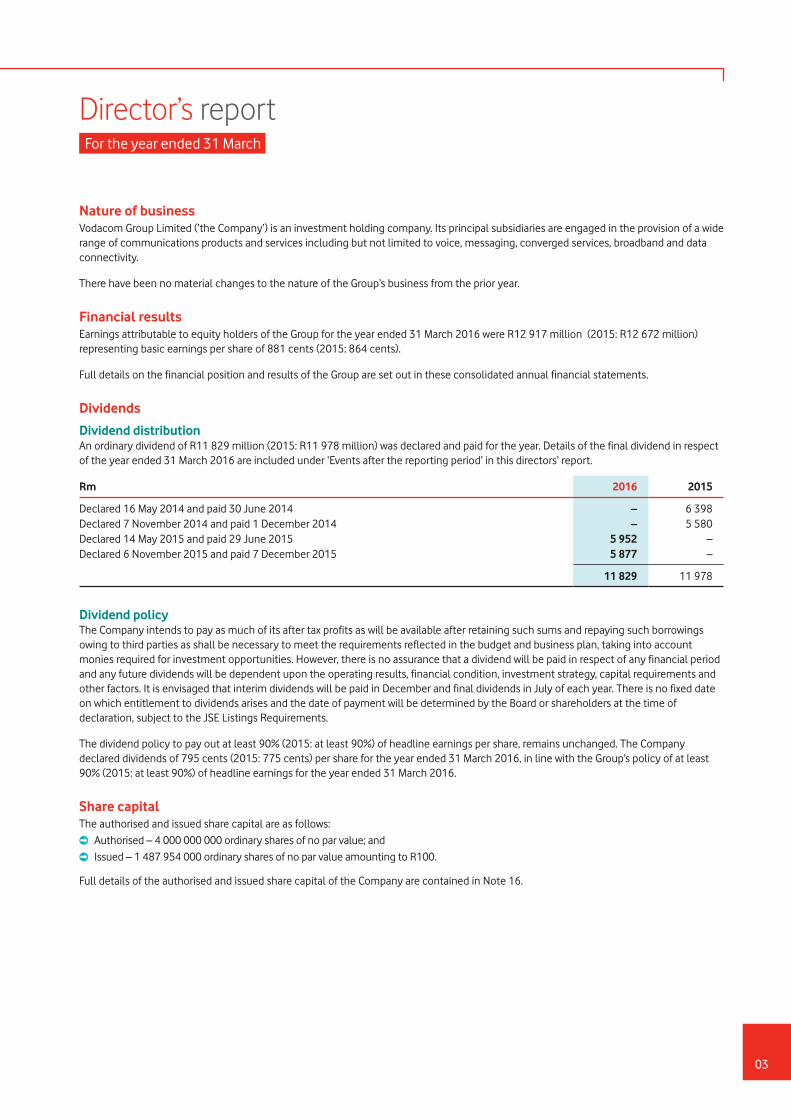
Dividend distributionAn ordinary dividend of R11 829 million (2015: R11 978 million) was declared and paid for the year. Details of the final dividend in respect of the year ended 31 March 2016 are included under ‘Events after the reporting period’ in this directors’ report.
Rm 2016 2015
Declared 16 May 2014 and paid 30 June 2014 – 6 398Declared 7 November 2014 and paid 1 December 2014 – 5 580Declared 14 May 2015 and paid 29 June 2015 5 952 –Declared 6 November 2015 and paid 7 December 2015 5 877 –
11 829 11 978
Dividend policyThe Company intends to pay as much of its after tax profits as will be available after retaining such sums and repaying such borrowings owing to third parties as shall be necessary to meet the requirements reflected in the budget and business plan, taking into account monies required for investment opportunities. However, there is no assurance that a dividend will be paid in respect of any financial period and any future dividends will be dependent upon the operating results, financial condition, investment strategy, capital requirements and other factors. It is envisaged that interim dividends will be paid in December and final dividends in July of each year. There is no fixed date on which entitlement to dividends arises and the date of payment will be determined by the Board or shareholders at the time of declaration, subject to the JSE Listings Requirements.
The dividend policy to pay out at least 90% (2015: at least 90%) of headline earnings per share, remains unchanged. The Company declared dividends of 795 cents (2015: 775 cents) per share for the year ended 31 March 2016, in line with the Group’s policy of at least 90% (2015: at least 90%) of headline earnings for the year ended 31 March 2016.
Share capitalThe authorised and issued share capital are as follows:
À Authorised – 4 000 000 000 ordinary shares of no par value; and
À Issued – 1 487 954 000 ordinary shares of no par value amounting to R100.
Full details of the authorised and issued share capital of the Company are contained in Note 16.
Director’s report For the year ended 31 March
03

Share capital continuedRepurchase of sharesShareholders approved a special resolution granting a general authority for the repurchase of ordinary shares by the Group, to a maximum of 5.0% (2015: 5.0%) of shares in issue, at the annual general meeting held on Thursday 16 July 2015, subject to the JSE Listings Requirements and the provisions of the Companies Act of 2008, as amended. Any shares that may be repurchased for the time being shall be in connection with awards made in the normal course in respect of the Group’s forfeitable share plan. Approval to renew this general authority will be sought at the forthcoming annual general meeting on Tuesday 19 July 2016.
Treasury shares are held by Wheatfields Investments 276 (Pty) Limited (‘Wheatfields’), a wholly-owned subsidiary and do not carry any voting rights.
Forfeitable share plan (‘FSP’)During the year the Group allocated 1 765 229 (2015:1 529 808) shares to eligible employees under its FSP and no restricted shares were allocated (2015: 48 210). Further details may be found in the ‘Remuneration report’ included in the integrated report as well as in Note 17.
Shareholder analysisThe Group’s shareholder analysis as at 31 March 2016 was as follows:
Shareholder spreadNumber of
shareholdings %Number of
shares %
1 – 100 shares 12 503 22.79 549 395 0.04101 – 1000 shares 33 436 60.95 12 069 102 0.811 001 – 10 000 shares 7 612 13.88 21 913 342 1.4710 001 – 50 000 shares 872 1.59 19 298 565 1.3050 001 – 100 000 shares 164 0.30 11 515 415 0.77100 001 – 1 000 000 shares 219 0.40 70 303 356 4.721 000 001 shares and above 52 0.09 1 352 304 825 90.89
54 858 100 1 487 954 000 100
Distribution of shareholdersHolding companies 1 0.00 967 170 100 65.00Organs of state 7 0.01 2 267 192 0.15Custodians 268 0.49 177 280 610 11.91Retirement benefit funds 330 0.60 202 868 098 13.63Collective investment schemes 333 0.61 39 844 493 2.68Individuals 47 906 87.35 33 788 996 2.29Private companies1 627 1.14 4 197 445 0.28Trusts 4 409 8.04 10 338 272 0.69Insurance companies 121 0.22 13 130 560 0.88Wholly owned subsidiaries 2 0.00 15 421 231 1.04Public companies 21 0.04 12 032 014 0.81Stockbrokers and nominees 18 0.03 2 675 059 0.18Scrip lending 13 0.02 2 897 871 0.19Foundations and charitable funds 167 0.30 1 455 930 0.10Close corporations 260 0.47 573 982 0.03Other corporations 105 0.19 596 325 0.04Medical aid funds 30 0.05 313 435 0.02Hedge funds 9 0.02 862 241 0.06Investment partnerships 219 0.40 155 902 0.01Treasury 1 0.00 82 473 0.01Unclaimed assets 11 0.02 1 771 0.00
54 858 100 1 487 954 000 100
Note:1. Includes treasury shares held by wholly-owned subsidiary, Wheatfields.
Vodacom Group Limited Consolidated annual financial statements for the year ended 31 March 2016
04
Directors’ report continued
Share capital continued
Non-public and public shareholdersNumber of
shareholdings %Number of
shares %
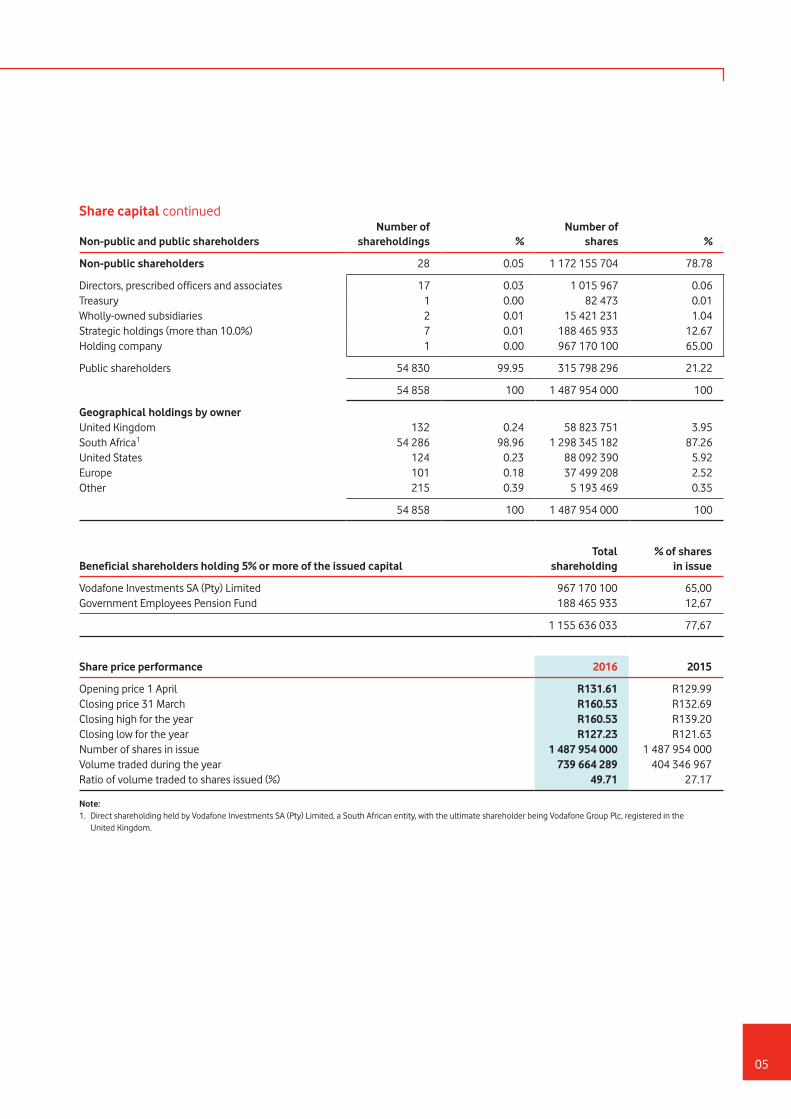
Non-public shareholders 28 0.05 1 172 155 704 78.78
Directors, prescribed officers and associates 17 0.03 1 015 967 0.06Treasury 1 0.00 82 473 0.01Wholly-owned subsidiaries 2 0.01 15 421 231 1.04Strategic holdings (more than 10.0%) 7 0.01 188 465 933 12.67Holding company 1 0.00 967 170 100 65.00
Public shareholders 54 830 99.95 315 798 296 21.22
54 858 100 1 487 954 000 100
Geographical holdings by ownerUnited Kingdom 132 0.24 58 823 751 3.95South Africa1 54 286 98.96 1 298 345 182 87.26United States 124 0.23 88 092 390 5.92Europe 101 0.18 37 499 208 2.52Other 215 0.39 5 193 469 0.35
54 858 100 1 487 954 000 100
Beneficial shareholders holding 5% or more of the issued capitalTotal
shareholding% of shares
in issue
Vodafone Investments SA (Pty) Limited 967 170 100 65,00Government Employees Pension Fund 188 465 933 12,67
1 155 636 033 77,67
Share price performance 2016 2015
Opening price 1 April R131.61 R129.99Closing price 31 March R160.53 R132.69Closing high for the year R160.53 R139.20Closing low for the year R127.23 R121.63Number of shares in issue 1 487 954 000 1 487 954 000Volume traded during the year 739 664 289 404 346 967Ratio of volume traded to shares issued (%) 49.71 27.17
Note:1. Direct shareholding held by Vodafone Investments SA (Pty) Limited, a South African entity, with the ultimate shareholder being Vodafone Group Plc, registered in the
United Kingdom.
05

BorrowingsDuring the current year, the Group obtained an additional loan from Vodafone Investments Luxembourg s.a.r.l. with a nominal value of R2 000 million which was utilised to settle short-term overnight borrowings. The loan bears interest payable quarterly at three-month JIBAR plus 1.15%, is unsecured, and is repayable on 16 July 2018.
A loan from Old Mutual Specialised Financing (Pty) Limited and Minervois Trading No. 2 (Pty) Limited with a nominal value of R1 000 million was repaid on 30 September 2015. The repayment was funded by a drawdown of R1 000 million on an overall loan facility of R4 000 million from Vodafone Investments Luxembourg s.a.r.l. that was approved during the year. The new loan facility is unsecured and has a three year tenure with a repayment date of 28 September 2018. The loan bears interest at a fixed rate of 8.64% payable quarterly.
The residual R3 000 million drawdown on the R4 000 million facility was used to refinance a R3 000 million term loan provided by Vodafone Investments Luxembourg s.a.r.l. which matured on 22 March 2016. The repayment date for the new term loan is 22 March 2019 and the loan bears interest at a fixed rate of 9.39% per annum.
Capital expenditure and commitmentsDetails of the Group’s capital expenditure are set out in Notes 9 and 10, and commitments are set out in Note 25.
Holding company and ultimate holding companyThe Group is ultimately controlled by Vodafone Group Plc which owns 65.0% of the issued shares through Vodafone Investments SA (Pty) Limited.
Vodafone Group Plc is incorporated and domiciled in the United Kingdom.
Directorate and secretaryMovements in the directorate during the year under review:
Appointments
1 August 2015 T Streichert1 October 2015 M Pieters
Resignations
31 July 2015 IP Dittrich30 September 2015 HMG Dowidar
In terms of the Company’s memorandum of incorporation, Messrs T Streichert and M Pieters, having been appointed since the last annual general meeting of the Company, retire at the forthcoming annual general meeting to be held on Tuesday 19 July 2016. In terms of the memorandum of incorporation, Ms S Timuray and Messrs JWL Otty, PJ Moleketi and MS Aziz Joosub retire by rotation. All retiring directors are eligible and available for re-election. Their profiles appear in the ‘Notice of annual general meeting’ included in the integrated report.
Vodacom Group Limited Consolidated annual financial statements for the year ended 31 March 2016
06
Directors’ report continued
Directorate and secretary continuedAs at the date of this report, the directors of the Company were as follows:
Independent non-executiveMP Moyo (Chairman), DH Brown, BP Mabelane, TM Mokgosi-Mwantembe, PJ Moleketi.
Non-executiveM Joseph*, JWL Otty^, M Pieters•, RAW Schellekens•, S Timuray~.
ExecutiveMS Aziz Joosub (Chief Executive Officer), T Streichert (Chief Financial Officer)@.
The Company Secretary is SF Linford and her business and postal addresses appear on the ‘Corporate information sheet’ included in the integrated report.* American, ^ British, •Dutch, @ German, ~ Turkish
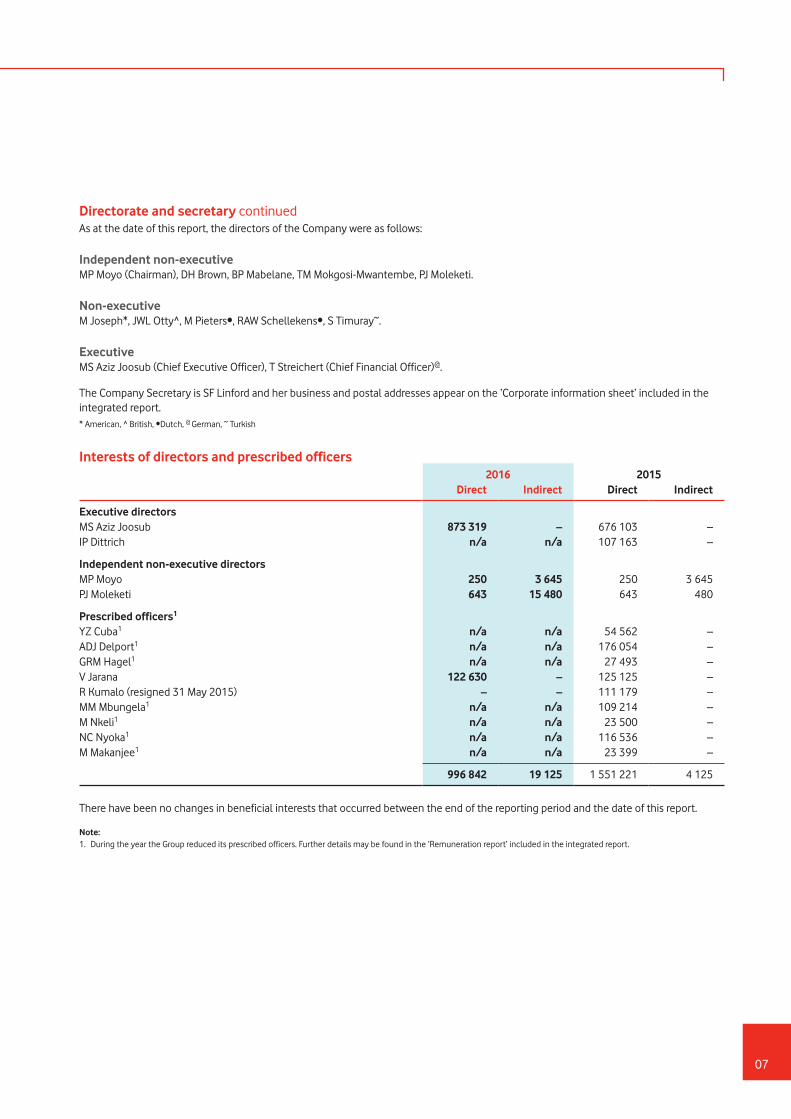
Interests of directors and prescribed officers2016 2015
Direct Indirect Direct Indirect
Executive directorsMS Aziz Joosub 873 319 – 676 103 –IP Dittrich n/a n/a 107 163 –
Independent non-executive directorsMP Moyo 250 3 645 250 3 645PJ Moleketi 643 15 480 643 480
Prescribed officers1
YZ Cuba1 n/a n/a 54 562 –ADJ Delport1 n/a n/a 176 054 –GRM Hagel1 n/a n/a 27 493 –V Jarana 122 630 – 125 125 –R Kumalo (resigned 31 May 2015) – – 111 179 –MM Mbungela1 n/a n/a 109 214 –M Nkeli1 n/a n/a 23 500 –NC Nyoka1 n/a n/a 116 536 –M Makanjee1 n/a n/a 23 399 –
996 842 19 125 1 551 221 4 125
There have been no changes in beneficial interests that occurred between the end of the reporting period and the date of this report.
Note:1. During the year the Group reduced its prescribed officers. Further details may be found in the ‘Remuneration report’ included in the integrated report.
07
Regulatory matters
Call termination rates (‘CTR’)The application submitted by Cell C (Pty) Limited (‘Cell C’) with the High Court to review and set aside the Independent Communications Authority of South Africa’s (‘Icasa’) decision on CTR’s has been withdrawn by Cell C.
Competition Commission complaint lodged by Cell COn 8 October 2013 a complaint was lodged at the Competition Commission in which it is alleged that the Group’s South African segment has abused their market dominance in contravention of Section 8 of the Competition Act of 1998. Investigations on this complaint are ongoing and the Group is in the process of complying with new information requests in this regard.
Customer registrationIn each country where the Group is subject to customer registration requirements, the industry is engaging with authorities to improve the process to ensure customer registration. The difficulties experienced by the Group in the registration process include; limited number of national identity cards, the inefficiency of a paper based process, and the inability of mass market distribution partners to complete the registration processes correctly. Tanzania and Mozambique have replaced the paper based process with an electronic registration process. The Group is continuing to actively register customers and has action plans in each country to achieve full compliance. Further details may be found on page 14 of the Integrated Report.
Implementation of Numbering Plan Regulations 2016Icasa published Numbering Plan Regulations (‘Regulations’), in terms of section 68 of the Electronic Communications Act, 2005 (Act 36 of 2005), as amended, on 24 March 2016. The Group is in the process of implementing these Regulations.
Broad Based Black Economic Empowerment (‘BBBEE’)On 29 February 2016, the Department of Trade and Industry (‘dti’) published the revised draft information and communication technology (‘ICT’) Sector Code for a 60 day public comment period. This code follows the May 2015 implementation of the revised generic dti Codes on BBBEE, which saw a complete overhaul of the current targets and requirements. The revised codes are expected to be finalised in June 2016, with the effective date being 1 April 2016.
In February 2016, the North Gauteng High Court made the following order on the matter of regulatory requirements emanating from the Electronic Communications Act: Compliance with the 30% equity ownership to be held by historically disadvantaged persons (‘HDI’) is peremptory and that Icasa does not have any discretion to either waive or relax the immediate requirement to comply with the minimum 30% HDI equity ownership threshold.
Audit, Risk and Compliance Committee (‘ARC Committee’)The ARC Committee discharged all of those functions delegated to it in terms of its mandate, section 94(7) of the Companies Act of 2008, as amended and the JSE Listings Requirements. Further details on the role and function of the ARC Committee may be found in the ‘Risk management report’ included in the integrated report.
The auditors’ business and postal address appear on the ‘Corporate information’ sheet included in the integrated report.
Competence, appropriateness and experience of the Company SecretaryIn compliance with JSE Listings Requirements, the Board has considered and is satisfied that Ms Sandi Linford, the company secretary, is competent, has the relevant qualifications and experience and maintains an arm’s length relationship with the Board. In evaluating these qualities, the Board has considered the prescribed duties and responsibilities of a company secretary which includes the Companies Act of 2008, as amended, JSE Listings Requirements and governance requirements as set out in King III.
Vodacom Group Limited Consolidated annual financial statements for the year ended 31 March 2016
08
Directors’ report continued

Other matters
Shared Networks Tanzania Limited (‘Shared Networks’)Vodacom Tanzania Limited has entered into an agreement with the shareholders of Shared Networks to acquire 100% of their issued share capital for US$15 million. The acquisition will be funded through available cash resources. The transaction remains subject to the fulfilment of a number of conditions precedent, including the requisite regulatory approvals.
Neotel (Pty) Limited (‘Neotel’)The Group and Neotel have confirmed that the agreement between the parties has lapsed due to regulatory complexities in concluding the transaction as well as certain conditions not being fulfilled. Accordingly, the parties have agreed that the proposed restructured transaction can no longer be progressed.
Vodacom Payment Services (Pty) LimitedIn March 2016, a decision was taken to phase out the South African M-Pesa product offering during the course of the 2017 financial year.
Events after the reporting period
Kenneth MakateOn 26 April 2016, the Constitutional Court overturned the South Gauteng High Court’s decision to dismiss Makate’s case, and instructed the Group to enter into negotiations for compensation. Further details may be found in Note 26 and 28.
Final dividendA final dividend of R5 952 million (400 cents per ordinary share) for the year ended 31 March 2016, was declared on Friday 13 May 2016, payable on Monday 27 June 2016 to shareholders recorded in the register at the close of business on Friday 24 June 2016. The net dividend after taking into account dividend withholding tax for those shareholders not exempt from dividend withholding tax is 340.00000 cents per share.
Other mattersThe Board is not aware of any matter or circumstance arising since the end of the reporting period, not otherwise dealt with in the consolidated annual financial statements, which significantly affects the financial position of the Group as at 31 March 2015 or the results of its operations or cash flows for the year then ended.
AuditorsDuring the current year, PricewaterhouseCoopers Inc. (‘PwC’) were appointed as the Group’s auditors. At the annual general meeting on Tuesday 19 July 2016, shareholders will be requested to appoint PwC as the Group’s auditors for the 2017 financial year and it will be noted that Mr DB von Hoesslin will be the individual registered auditor who will undertake the audit.
09
Mandate and terms of referenceThe Group’s Audit, Risk and Compliance Committee (‘ARC Committee’) operates within a Board approved mandate and terms of reference. In line with the Companies Act of 2008, as amended, the members of the Committee were appointed at the annual general meeting that was held on Thursday 17 July 2015.
The ARC Committee’s responsibilities include the following:
À Reviewing the Group’s consolidated interim results, preliminary results, integrated report and annual financial statements;
À Monitoring compliance with statutory and the JSE Listings Requirements;
À Reporting to the Board on the quality and acceptability of the Group’s accounting policies and practices, including, without limitation, critical accounting policies and practices;
À Providing oversight of the integrated reporting process;
À Considering the appointment and/or termination of the external auditors, including their audit fee, independence and objectivity and determining the nature and extent of any non-audit services;
À Approving the internal audit plan for the year;
À Receiving and dealing appropriately with any complaints, internally and externally, relating either to the accounting practices and internal audit or to the content or auditing of all entities within the Group’s annual financial statements or related matters;
À Reviewing and monitoring the management and reporting of tax-related matters;
À Monitoring the risk management function and processes and assessing the Group’s most significant risks;
À Monitoring the technology governance framework and associated risks; and
À Monitoring the effectiveness of the processes to create awareness and develop an understanding of relevant legislation and regulation to ensure compliance by management.
Membership
Members: DH Brown (Chairman), BP Mabelane, PJ MoleketiThe Chief Executive Officer and Chief Financial Officer, as well as the head of internal audit, the Chief Risk Officer and the external auditors, attend ARC Committee meetings by invitation. The primary role of the ARC Committee is to ensure the integrity of the financial reporting and the audit process and that a sound risk management and internal control system is maintained. In pursuing these objectives the ARC Committee oversees relations with the external auditors and reviews the effectiveness of the internal audit function.
The internal and external auditors have unlimited access to the Chairman of the ARC Committee. The internal audit department reports directly to the ARC Committee and is also responsible to the Chief Financial Officer on day-to-day administrative matters.
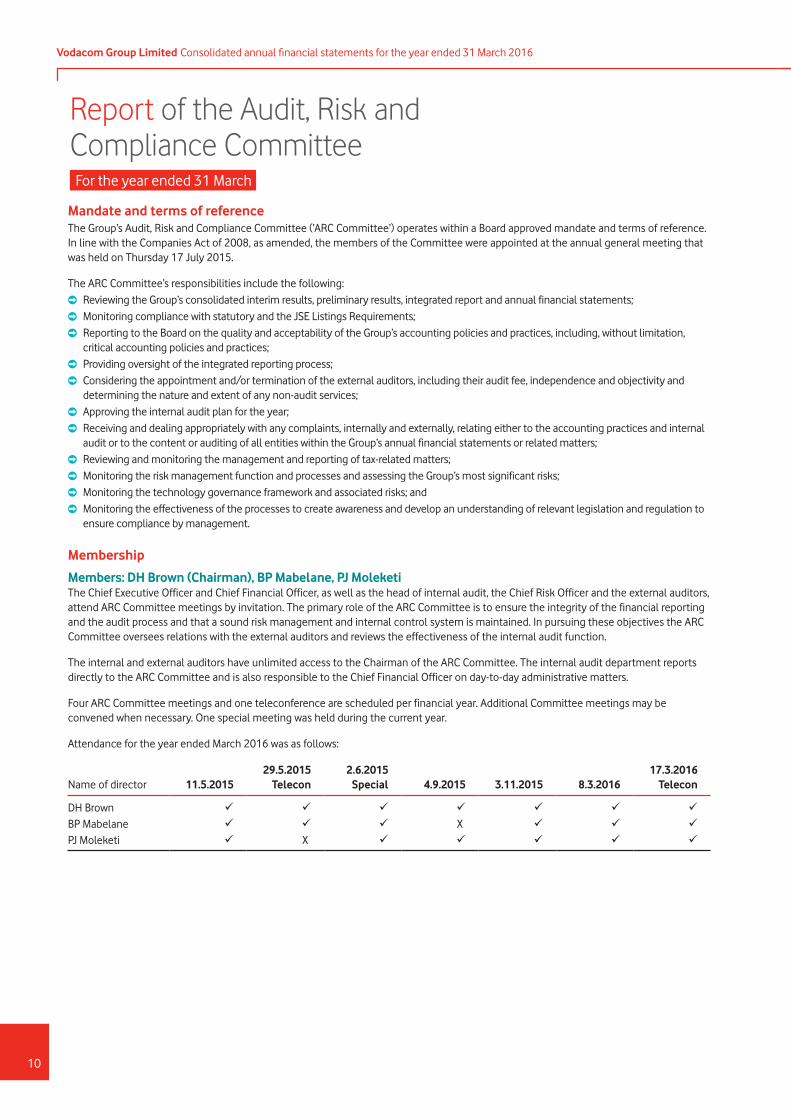
Four ARC Committee meetings and one teleconference are scheduled per financial year. Additional Committee meetings may be convened when necessary. One special meeting was held during the current year.
Attendance for the year ended March 2016 was as follows:
Name of director 11.5.201529.5.2015
Telecon2.6.2015
Special 4.9.2015 3.11.2015 8.3.201617.3.2016
Telecon
DH Brown BP Mabelane X PJ Moleketi X
Report of the Audit, Risk and Compliance CommitteeFor the year ended 31 March
Vodacom Group Limited Consolidated annual financial statements for the year ended 31 March 2016
10
Statutory dutiesThe ARC Committee discharged all of those functions delegated to it in terms of its mandate, section 94(7) of the Companies Act of 2008, as amended, (‘the Act’) and the JSE Listings Requirements as listed below:
À Considered and satisfied itself that the external auditors are independent;
À Nominated the external auditors for appointment for the 2016 financial year;
À Determined the fees paid to the external auditors for the 2016 financial year;
À Reviewed the nature of non-audit services that were provided by the external auditors during the year;
À Confirmed the payment of non-audit services which the external auditors performed during the year under review;
À Approved the internal audit plan for the year;
À Monitoring and providing oversight of the internal audit function;
À Held separate meetings with management and the external auditors to discuss any reserved matters;
À Ensured the ARC Committee complied with the membership criteria as set out in the Act;
À Considered the appropriateness and experience of the Chief Financial Officer as required by the JSE Listings Requirements;
À Reviewed the consolidated and Company annual financial statements of Vodacom Group Limited;
À Reviewed the appropriateness of any amendments to accounting policies and internal financial controls; and
À Reviewed the integrated reporting process.
Internal controlInternal controls comprise systematic measures, policies, procedures and business rules adopted by management to provide reasonable assurance in safeguarding assets, prevention and detection of error, accuracy and completeness of accounting records, and reliability of annual financial statements of all entities within the Group. In addition, Vodafone Group Plc (‘Vodafone’) is required to comply with Section 404 of the Sarbanes-Oxley Act (‘SOX’) due to its listing on the NASDAQ stock exchange. With combined efforts between the Group and Vodafone, specific processes were identified that had to be brought in line with SOX requirements as part of the Group’s South African SOX compliance efforts.
During the year, management revisited the accounting judgements applied in accounting for finance deals, which resulted in the restatement of certain lines in the consolidated annual financial statements (Note 21). Management has adequately responded to the restatement and with the exception of the aforementioned, concluded that the internal controls over financial reporting as at 31 March 2016 were effective.
The internal audit function is governed by the internal audit charter, as approved by the ARC Committee. The internal audit function serves management and the Board by performing independent evaluations of the adequacy and effectiveness of the Group’s internal controls, financial reporting mechanisms and records, information systems and operations.
Risk managementReviews of the Group’s risk management, enterprise risk management programmes, business continuity and forensic services are performed by the Group’s Risk Management Committee which reports to the ARC Committee through the Chief Risk Officer. Critical and high strategic risks which are ranked in relation to a scale from catastrophic to negligible, are presented annually to the ARC Committee and are then reported to and considered by the Board. Further details of the Group’s key risks are reported in the risk management report included in Vodacom’s Integrated Report and online at www.vodacom.com.
From 1 April 2015 to 31 March 2016, the Group’s forensic services department investigated over 6 344 cases of which 5 983 related to external cases and 361 to internal cases. These cases were reported through various channels, including direct reports received from customers, service providers, online reports, referrals from business and external whistle blowing. Over the same period, 51 reports were received via the whistle blowing line.
11
Combined assuranceThe integrated assurance model aims to optimise the assurance coverage attained from management (first line of defence), internal assurance providers (second line of defence) and independent assurance providers (third line of defence) in mitigating the risk areas affecting the Group. The Group has adopted an integrated assurance model which identifies the key risk areas affecting the Group, and maps the level of assurance being provided by the different lines of defence to mitigate these risks.
Effectiveness of the finance functionIn accordance with King III requirements, the ARC Committee has concluded that the finance function is adequately resourced with technically competent individuals, and that it is effective.
Effectiveness of the risk management functionIn alignment with King III, the ARC Committee has satisfied itself that the following areas have been appropriately addressed:
À Financial reporting risk;
À Internal financial controls;
À Fraud risk as it relates to financial reporting; and
À Information technology risk as it relates to financial reporting.
Appropriateness and experience of Chief Financial OfficerThe ARC Committee confirms that it is satisfied that Dr. phil. T Streichert, the current Chief Financial Officer, possesses the appropriate expertise and experience to meet the responsibilities of this position.
Non-audit function policyPer the Group’s policy for non-audit services, the external auditors may only be considered as a supplier for such service where:
À There is no other alternative supplier for these services;
À Where there is no other commercially viable alternative; or
À Where the non-audit service is related to and would add value to the external audit.
The total amount of fees earned during the year by the external auditors in respect of non-audit services was R626 642.
Integrated reportThe ARC Committee has overseen the integrated reporting process, reviewed the report and has recommended the 2016 Integrated Report and consolidated Annual Financial Statements for approval by the Board on 3 June 2016.
DH BrownChairmanAudit, Risk and Compliance Committee
Vodacom Group Limited Consolidated annual financial statements for the year ended 31 March 2016
12
Report of the Audit, Risk and Compliance Committee continued
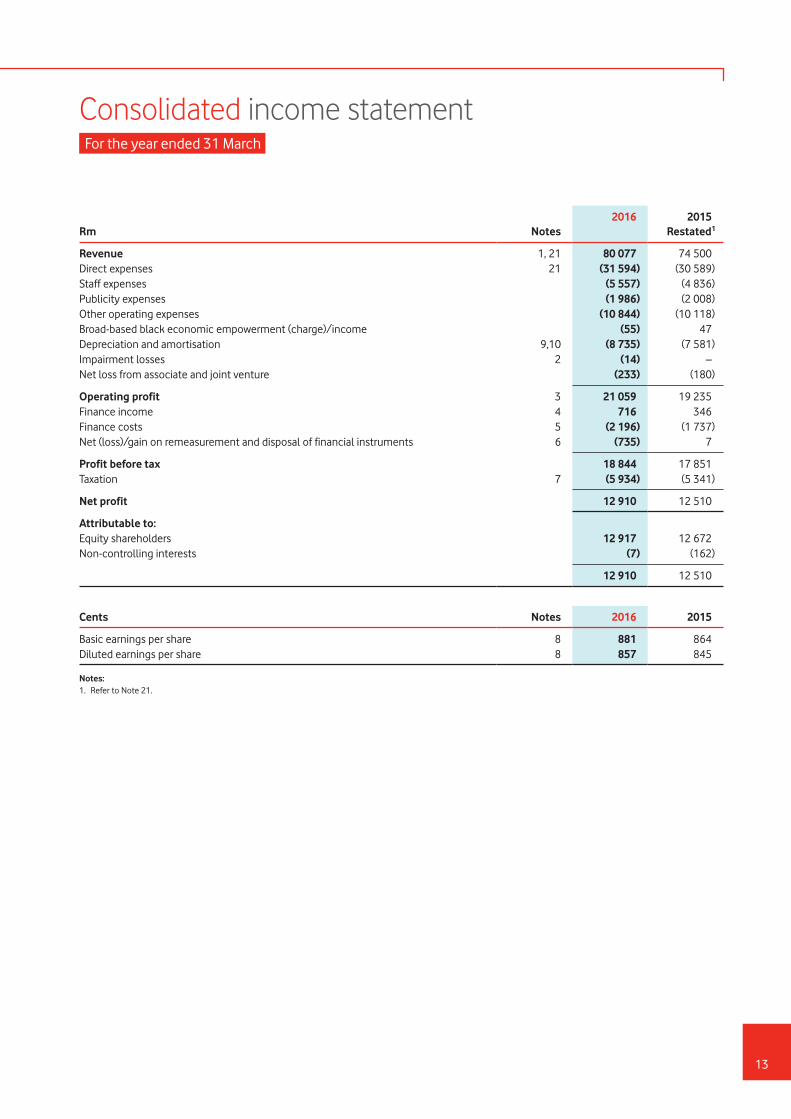
Rm Notes2016 2015
Restated1
Revenue 1, 21 80 077 74 500 Direct expenses 21 (31 594) (30 589)Staff expenses (5 557) (4 836)Publicity expenses (1 986) (2 008)Other operating expenses (10 844) (10 118)Broad-based black economic empowerment (charge)/income (55) 47 Depreciation and amortisation 9,10 (8 735) (7 581)Impairment losses 2 (14) – Net loss from associate and joint venture (233) (180)
Operating profit 3 21 059 19 235 Finance income 4 716 346 Finance costs 5 (2 196) (1 737)Net (loss)/gain on remeasurement and disposal of financial instruments 6 (735) 7
Profit before tax 18 844 17 851 Taxation 7 (5 934) (5 341)
Net profit 12 910 12 510
Attributable to:Equity shareholders 12 917 12 672 Non-controlling interests (7) (162)
12 910 12 510
Cents Notes 2016 2015
Basic earnings per share 8 881 864 Diluted earnings per share 8 857 845
Notes:1. Refer to Note 21.
Consolidated income statement For the year ended 31 March
13
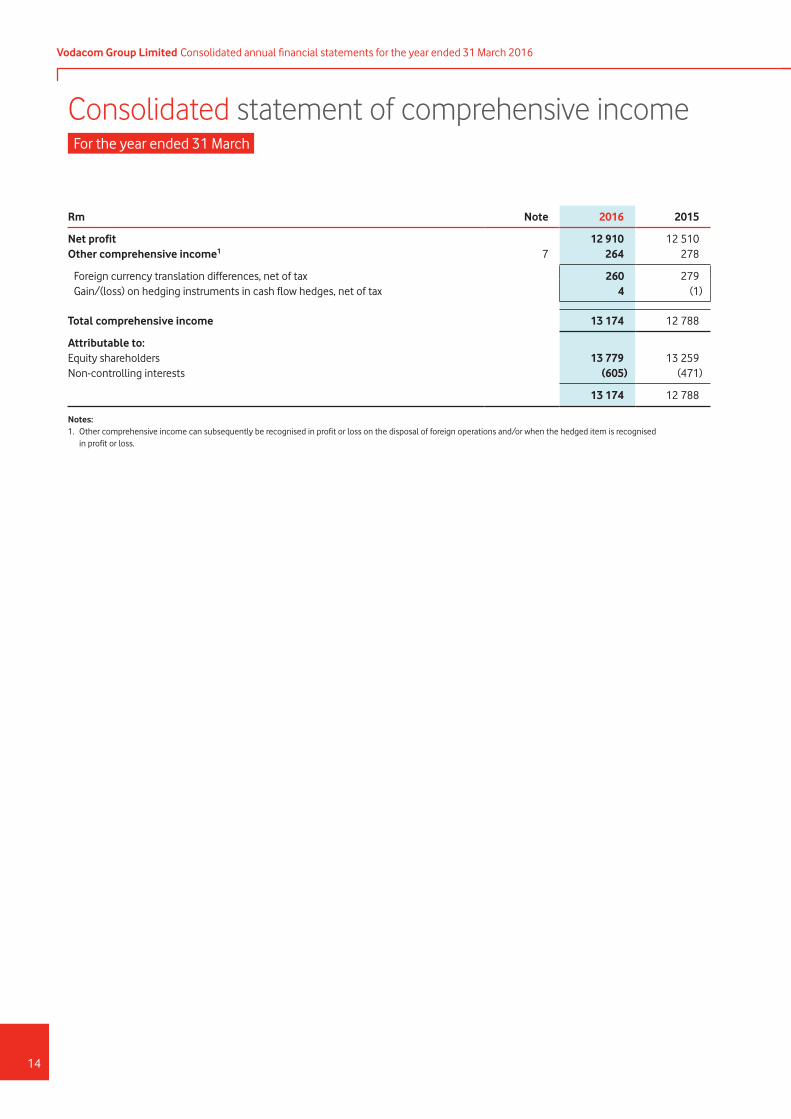
Rm Note 2016 2015
Net profit 12 910 12 510 Other comprehensive income1 7 264 278
Foreign currency translation differences, net of tax 260 279 Gain/(loss) on hedging instruments in cash flow hedges, net of tax 4 (1)
Total comprehensive income 13 174 12 788
Attributable to:Equity shareholders 13 779 13 259 Non-controlling interests (605) (471)
13 174 12 788
Notes:1. Other comprehensive income can subsequently be recognised in profit or loss on the disposal of foreign operations and/or when the hedged item is recognised
in profit or loss.
Consolidated statement of comprehensive incomeFor the year ended 31 March
Vodacom Group Limited Consolidated annual financial statements for the year ended 31 March 2016
14

Rm Notes 2016 2015
AssetsNon-current assets 51 085 45 954
Property, plant and equipment 9 39 744 35 959 Intangible assets 10 9 517 7 603 Financial assets 11 280 605 Investment in associate 12 – 306 Investment in joint venture 4 4 Trade and other receivables 14 754 763 Finance receivables 15 761 696 Deferred tax 7 25 18
Current assets 27 618 25 353
Financial assets 11 2 641 2 016 Inventory 13 1 675 1 189 Trade and other receivables 14 13 275 11 559 Non-current assets held for sale 12 589 94 Finance receivables 15 1 390 1 122 Tax receivable 114 123 Bank and cash balances 24 7 934 9 250
Total assets 78 703 71 307
Equity and liabilitiesFully paid share capital 16 * * Treasury shares 16 (1 658) (1 606)Retained earnings 24 635 23 378 Other reserves 17 1 181 290
Equity attributable to owners of the parent 24 158 22 062 Non-controlling interests (1 134) (419)
Total equity 23 024 21 643 Non-current liabilities 29 909 23 050
Borrowings 18 26 658 20 308 Trade and other payables 19 815 759 Provisions 20 164 225 Deferred tax 7 2 272 1 758
Current liabilities 25 770 26 614
Borrowings 18 2 284 5 351 Trade and other payables 19 22 845 20 589 Provisions 20 92 91 Tax payable 344 182 Dividends payable 22 21 Bank overdrafts 24 183 380
Total equity and liabilities 78 703 71 307
* Fully paid share capital of R100.
Consolidated statement of financial positionFor the year ended 31 March
15

Other comprehensive income
Rm NotesFully paid
share capital Treasury
shares
Share-basedpayment
reserve1Retained earnings
Change of interests in
subsidiaries
Profit on sale of
treasury shares
Foreign currency
translation reserve
Cash flow hedge
reserve
Equity attributable to owners of
the parent
Non-controlling
interestsTotal
equity
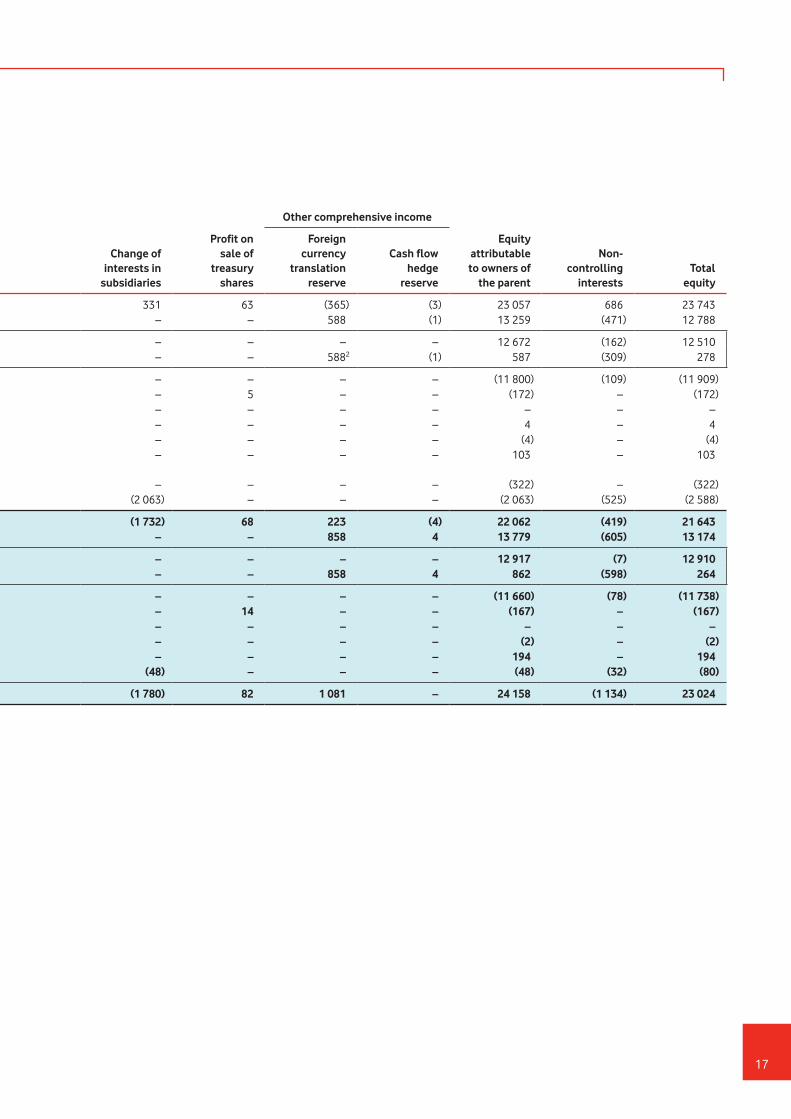
31 March 2014 * (1 589) 2 114 22 506 331 63 (365) (3) 23 057 686 23 743 Total comprehensive income – – – 12 672 – – 588 (1) 13 259 (471) 12 788
Net profit – – – 12 672 – – – – 12 672 (162) 12 510 Other comprehensive income 7 – – – – – – 5882 (1) 587 (309) 278
Dividends 8 – – – (11 800) – – – – (11 800) (109) (11 909)Repurchase and sale of shares 16 – (177) – – – 5 – – (172) – (172)Share-based payment vesting – 160 (160) – – – – – – – – Restricted share plan3 – – 4 – – – – – 4 – 4 Share-based payment – deferred tax – – (4) – – – – – (4) – (4)Share-based payment expense 8,17 – – 103 – – – – – 103 – 103 Reclassification of BBBEE reserve to liability – – (322) – – – – – (322) – (322)Changes in subsidiary holdings – – – – (2 063) – – – (2 063) (525) (2 588)
31 March 2015 * (1 606) 1 735 23 378 (1 732) 68 223 (4) 22 062 (419) 21 643 Total comprehensive income – – – 12 917 – – 858 4 13 779 (605) 13 174
Net profit – – – 12 917 – – – – 12 917 (7) 12 910 Other comprehensive income 7 – – – – – – 858 4 862 (598) 264
Dividends 8 – – – (11 660) – – – – (11 660) (78) (11 738)Repurchase and sale of shares 16 – (181) – – – 14 – – (167) – (167)Share-based payment vesting – 129 (129) – – – – – – – – Share-based payment – deferred tax – – (2) – – – – – (2) – (2)Share-based payment expense 8,17 – – 194 – – – – – 194 – 194 Changes in subsidiary holdings – – – – (48) – – – (48) (32) (80)
31 March 2016 * (1 658) 1 798 24 635 (1 780) 82 1 081 – 24 158 (1 134) 23 024
Notes:1. Includes the broad-based black economic empowerment reserve of R1 644 million (2015: R1 562 million) and other employee share-based payment scheme reserves of
R154 million (2015: R173 million).2. Includes foreign exchange gains of R427 million (2015: R269 million), net of tax, relating to foreign-denominated loans to subsidiaries classified as part of the net investments
in these foreign operations.3. Refer to Note 17.1.2* Fully paid share capital of R100.
Vodacom Group Limited Consolidated annual financial statements for the year ended 31 March 2016
16
Consolidated statement of changes in equityFor the year ended 31 March
Other comprehensive income
Rm NotesFully paid
share capital Treasury
shares
Share-basedpayment
reserve1Retained earnings
Change of interests in
subsidiaries
Profit on sale of
treasury shares
Foreign currency
translation reserve
Cash flow hedge
reserve
Equity attributable to owners of
the parent
Non-controlling
interestsTotal
equity
31 March 2014 * (1 589) 2 114 22 506 331 63 (365) (3) 23 057 686 23 743 Total comprehensive income – – – 12 672 – – 588 (1) 13 259 (471) 12 788
Net profit – – – 12 672 – – – – 12 672 (162) 12 510 Other comprehensive income 7 – – – – – – 5882 (1) 587 (309) 278
Dividends 8 – – – (11 800) – – – – (11 800) (109) (11 909)Repurchase and sale of shares 16 – (177) – – – 5 – – (172) – (172)Share-based payment vesting – 160 (160) – – – – – – – – Restricted share plan3 – – 4 – – – – – 4 – 4 Share-based payment – deferred tax – – (4) – – – – – (4) – (4)Share-based payment expense 8,17 – – 103 – – – – – 103 – 103 Reclassification of BBBEE reserve to liability – – (322) – – – – – (322) – (322)Changes in subsidiary holdings – – – – (2 063) – – – (2 063) (525) (2 588)
31 March 2015 * (1 606) 1 735 23 378 (1 732) 68 223 (4) 22 062 (419) 21 643 Total comprehensive income – – – 12 917 – – 858 4 13 779 (605) 13 174
Net profit – – – 12 917 – – – – 12 917 (7) 12 910 Other comprehensive income 7 – – – – – – 858 4 862 (598) 264
Dividends 8 – – – (11 660) – – – – (11 660) (78) (11 738)Repurchase and sale of shares 16 – (181) – – – 14 – – (167) – (167)Share-based payment vesting – 129 (129) – – – – – – – – Share-based payment – deferred tax – – (2) – – – – – (2) – (2)Share-based payment expense 8,17 – – 194 – – – – – 194 – 194 Changes in subsidiary holdings – – – – (48) – – – (48) (32) (80)
31 March 2016 * (1 658) 1 798 24 635 (1 780) 82 1 081 – 24 158 (1 134) 23 024
Notes:1. Includes the broad-based black economic empowerment reserve of R1 644 million (2015: R1 562 million) and other employee share-based payment scheme reserves of
R154 million (2015: R173 million).2. Includes foreign exchange gains of R427 million (2015: R269 million), net of tax, relating to foreign-denominated loans to subsidiaries classified as part of the net investments
in these foreign operations.3. Refer to Note 17.1.2* Fully paid share capital of R100.
17

Rm Notes 2016 2015
Cash generated from operations1 22 29 800 26 198 Tax paid (5 456) (4 979)
Net cash flows from operating activities 24 344 21 219
Cash flows from investing activitiesAdditions to property, plant and equipment and intangible assets (13 565) (12 810)Proceeds on disposal of property, plant and equipment and intangible assets 336 528 Business combinations 23 (573) (1 018)Finance income received 683 598 Repayment of loans granted and equity investments (39) 172 Other investing activities2 (522) (601)
Net cash flows utilised in investing activities (13 680) (13 131)
Cash flows from financing activitiesBorrowings incurred 6 789 11 424 Borrowings repaid (4 004) (63)Finance costs paid (2 397) (1 751)Dividends paid – equity shareholders (11 658) (11 800)Dividends paid – non-controlling interests (78) (109)Repurchase and sale of shares (167) (168)Acquisition of additional interest in subsidiary (129) (2 576)
Net cash flows utilised in financing activities (11 644) (5 043)
Net (decrease)/increase in cash and cash equivalents (980) 3 045 Cash and cash equivalents at the beginning of the year 8 870 5 792 Effect of foreign exchange rate changes (139) 33
Cash and cash equivalents at the end of the year 24 7 751 8 870
Notes:1. The Group changed the presentation of its statement of cash flows from the direct method to the indirect method in order to align with the Group’s ultimate parent, Vodafone
Group Plc.2. Consists mainly of the movement in cash restricted deposits as a result of M-Pesa related activities
Vodacom Group Limited Consolidated annual financial statements for the year ended 31 March 2016
18
Consolidated statement of cash flowsFor the year ended 31 March
Basis of preparationThe consolidated annual financial statements of the Group have been prepared in accordance with IFRS as issued by the IASB and comply with the SAICA Financial Reporting Guides as issued by the SAICA Accounting Practices Committee, Financial Pronouncements as issued by the Financial Reporting Standards Council, the JSE Listings Requirements and the requirements of the Companies Act of 2008, as amended.
The preparation of the consolidated annual financial statements in conformity with IFRS requires management to make estimates and assumptions that affect the reported amounts of assets and liabilities and disclosure of contingent liabilities at the reporting date and the reported amounts of revenue and expenses during the reporting period. For a discussion on the Group’s critical accounting judgements, see ‘Critical accounting judgements’ on pages 32 to 36. Revisions to accounting estimates are recognised in the period in which the estimate is revised if the revision affects only that period or in the period of the revision and future periods if the revision affects both current and future periods.
The consolidated annual financial statements are presented in South African rand, which is the parent company’s functional and presentation currency.
The significant accounting policies are consistent in all material respects with those applied in the previous year. During the year, management revisited the accounting judgements applied in accounting for finance deals. Refer to Note 21 for more details. There have been no other material changes in judgements or estimates of amounts reported in prior reporting periods.
Significant accounting policies
Accounting conventionThe consolidated annual financial statements are prepared on a historical cost basis, except for certain financial instruments which are measured at fair value or at amortised cost.
Consolidation
Basis of consolidationThe consolidated annual financial statements incorporate the annual financial statements of Vodacom Group Limited, its subsidiaries, joint arrangement, associate and structured entities up to 31 March 2016.
Business combinationsAcquisitions of subsidiaries are accounted for using the acquisition method. The cost of the acquisition is measured at the aggregate of the fair values, at the date of exchange, of assets given, liabilities incurred by the Group to the former owners of the acquiree, and equity instruments issued by the Group in exchange for control of the acquiree. Acquisition-related costs are recognised in profit or loss as incurred.
Goodwill is measured as the excess of the sum of the consideration transferred, the amount of any non-controlling interests in the acquiree and the fair value of the Group’s previously held equity interest in the acquiree, if any, over the net of the acquisition-date amounts of the identifiable assets acquired and liabilities assumed.
Where applicable, the consideration transferred includes any asset or liability resulting from a contingent consideration arrangement, measured at its acquisition-date fair value. Changes in fair value that qualify as measurement period adjustments are adjusted retrospectively, with corresponding adjustments against goodwill. Changes in fair value that do not qualify as measurement period adjustments are adjusted prospectively, with the corresponding gain or loss being recognised in profit or loss.
Components of non-controlling interests that are current ownership interests and entitle their holders to a proportionate share of the acquiree’s net assets in the event of liquidation are measured at the acquisition date at either:
À Fair value; or
À The non-controlling interest’s proportionate share of the acquiree’s identifiable net assets.
The choice of measurement basis is made on an acquisition-by-acquisition basis.
19
Notes to the consolidated annual financial statementsFor the year ended 31 March

Consolidation continuedBusiness combinations continuedAll other components of non-controlling interests are measured at their acquisition-date fair values, unless another measurement basis is required by IFRS.
The difference between the proceeds and the carrying amount of the net assets and liabilities disposed of, adjusted for any related carrying amount of goodwill, is recognised as the profit or loss on disposal of subsidiaries. The same principle applies to a joint arrangement.
Accounting for subsidiariesA subsidiary is an entity controlled by the Group. Control is achieved where the Group has existing rights that give it the current ability to direct the activities that affect the Company’s returns and exposure or rights to variable returns from the entity.
The results of subsidiaries are included in profit or loss from the effective date of acquisition up to the effective date of disposal. Where necessary, adjustments are made to the financial statements of subsidiaries to align their accounting policies with those of the Group.
All intra-group transactions, balances, income and expenses are eliminated on consolidation.
Non-controlling interests in the net assets of consolidated subsidiaries are identified separately from the Group’s equity therein. Non-controlling interests consist of the amount of those interests at the date of the original business combination and the non-controlling interest’s share of changes in equity since the date of the combination. Total comprehensive income is attributed to non-controlling interests even if this results in the non-controlling interests having a deficit balance.
Transactions with non-controlling interestsIn transactions with non-controlling interests that do not result in a change in control, the difference between the fair value of the consideration paid or received and the amount by which the non-controlling interest is adjusted is recognised in equity. Where control is lost, any interest retained by the Group is remeasured to fair value. The profit or loss on disposal is calculated as the difference between:
À The aggregate of the fair value of the consideration received and the fair value of any retained interest; and
À The previous carrying amounts of the assets, including goodwill, and liabilities of the subsidiary, reduced by any non-controlling interests.
Investments in associates and joint venturesAn associate is an entity over which the Group has significant influence. Significant influence is the power to participate in the financial and operating policy decisions of the investee but is not control or joint control over those policies.
A joint venture is a joint arrangement whereby the parties that have joint control of the arrangement have rights to the net assets of the arrangement.
The results, assets and liabilities of associates or joint ventures are incorporated in the consolidated annual financial statements from the date on which the Group has significant influence or joint control, respectively up to the date on which the Group ceases to have such influence, using the equity method of accounting.
Under the equity method, investments in associates or joint ventures are carried in the consolidated statement of financial position at cost as adjusted for post-acquisition changes in the Group’s share of the net assets of the associate, less any impairment in the value of the investment. Losses of an associate or joint venture in excess of the Group’s interest in that associate are not recognised. Additional losses are provided for, and a liability is recognised, only to the extent that the Group has incurred legal or constructive obligations or made payments on behalf of the associate or joint venture.
Any excess of the cost of acquisition over the Group’s share of the net fair value of the identifiable assets, liabilities and contingent liabilities of the associate or joint venture recognised at the date of acquisition is recognised as goodwill. The goodwill is included within the carrying amount of the investment.
The Group’s share of intra-group unrealised profits or losses, between Group companies, joint ventures and associate entities are eliminated upon equity accounting of the entities.
Vodacom Group Limited Consolidated annual financial statements for the year ended 31 March 2016
20
Notes to the consolidated annual financial continued
Operating segmentsThe Group discloses its operating segments according to the entity components regularly reviewed by the Group Executive Committee. The components comprise of operating segments located in South Africa and internationally.
Segment information is prepared in conformity with the measure that is reported to the Group Executive Committee and has been reconciled to the consolidated annual financial statements. The measure reported by the Group is in accordance with the significant accounting policies adopted for preparing and presenting the consolidated annual financial statements.
The segment assets and liabilities comprise all assets and liabilities of the different segments that are employed by the segment and that either are directly attributable to the segment, or can be allocated to the segment on a reasonable basis.
Capital expenditure in property, plant and equipment and intangible assets has been allocated to the segments to which it relates.
Foreign currencies
Transactions and balancesThe consolidated annual financial statements are presented in South African rand, which is the parent company’s functional and presentation currency. Each entity in the Group determines its own functional currency and items included in the financial statements of each entity are measured using that functional currency.
Transactions in foreign currencies are initially recorded at the foreign exchange rates prevailing at the date of the transaction. Monetary assets and liabilities denominated in foreign currencies are translated into the respective functional currency of the entity at the rates prevailing at the reporting date. Exchange differences on the settlement or translation of monetary assets and liabilities identified as being part of operating activities are included in operating profit, while exchange differences on the settlement or translation of monetary assets and liabilities which are not considered as being part of operating activities are included in net loss on remeasurement and disposal of financial instruments in profit or loss in the period in which they arise.
Non-monetary items carried at fair value that are denominated in foreign currencies are translated at the rates prevailing on the date when the fair value was determined. Non-monetary items measured at historical cost in a foreign currency are not retranslated. When a gain or loss on a non-monetary item is recognised directly in other comprehensive income, any exchange component of that gain or loss is recognised directly in other comprehensive income. When a gain or loss on a non-monetary item is recognised in profit or loss, any exchange component of that gain or loss is recognised in profit or loss.
Foreign operationsFor the purpose of presenting consolidated annual financial statements, the assets and liabilities of entities with a functional currency other than rand are expressed in rand using exchange rates prevailing on the reporting date. Income and expense items and cash flows are translated at the foreign exchange rates on the transaction dates or the average exchange rates for the period and exchange differences arising are recognised directly in other comprehensive income. On disposal of a foreign operation, the cumulative amount previously recognised in other comprehensive income relating to that particular foreign operation is recognised in profit or loss.
Goodwill and fair value adjustments arising on the acquisition of a foreign operation are treated as assets and liabilities of the foreign operation and translated accordingly.
Exchange differences arising on monetary items that form part of the Group’s net investment in foreign operations, being monetary items receivable from or payable to foreign entities for which settlement is neither planned nor likely to occur in the foreseeable future, are recognised in other comprehensive income. Taxation on the foreign currency translation reserve relates only to monetary items that form part of the Group’s net investment in foreign operations.
21

Property, plant and equipmentProperty, plant and equipment is stated at cost less accumulated depreciation and accumulated impairment loss, if any. Land is not depreciated and is stated at cost less accumulated impairment losses, if any.
Land and buildings in which the Group occupies more than 25.0% of the floor space or for which the primary purpose is the service and connection of customers are classified as property, plant and equipment.
Assets in the course of construction are carried at cost, less any impairment loss. Depreciation of these assets commences when the assets are ready for their intended use.
The cost of property, plant and equipment includes directly attributable costs incurred in the acquisition and installation of such assets, as well as the present value of the estimated cost of dismantling, removal or site restoration costs if applicable, so as to bring the assets to the location and condition necessary for them to be capable of operating in the manner intended by management.
The cost of small parts that do not meet the definition of property, plant and equipment, as well as repairs and maintenance costs are recognised in profit or loss as incurred.
Depreciation is recognised in profit or loss on a straight-line basis over the shorter of the lease term, if applicable, or the estimated useful life and ceases at the earlier of the date the asset is classified as held for sale or the date it is derecognised. Depreciation is not ceased when assets are idle.
Useful lives, residual values and depreciation methods are reviewed on an annual basis with the effect of any changes in estimate accounted for on a prospective basis.
Property, plant and equipment acquired in exchange for non-monetary assets is measured at fair value unless the exchange transaction lacks commercial substance or the fair value of neither the asset received nor the asset given up is reliably measurable. If the acquired item is not measured at fair value, its cost is measured at the carrying amount of the asset given up.
The difference between the proceeds and the carrying amount of an item of property, plant and equipment is recognised as the profit or loss on disposal.
Government grantsThe Group may be entitled to receive grants from national or regional government which are primarily for the purpose of purchasing property, plant and equipment (‘capital grants’).
Government grants are recognised when there is reasonable assurance that the Group will comply with any condition on which payment or retention of the grant is dependent and the grant will be paid.
It is the Group’s policy to deduct capital grants from the cost of the assets acquired which will result in the depreciation expense for the related assets being reduced during the useful life of the related assets.
In the event that a capital grant becomes repayable, the cost of the related assets are increased by the amount of the repayment and cumulative depreciation that would have been recognised in profit or loss had the repaid amount not originally been recorded will be recognised immediately in the profit or loss.
Government grants related to income are recognised in profit or loss on a systematic basis over the periods in which the Group recognises the related costs as expenses, for which the grant is intended to compensate.
Vodacom Group Limited Consolidated annual financial statements for the year ended 31 March 2016
22
Notes to the consolidated annual financial continued
Intangible assetsThe following are the main categories of intangible assets:
Intangible assets with an indefinite useful lifeGoodwill is initially recognised at cost and subsequently stated at cost less accumulated impairment losses, if any. Goodwill is not amortised, but is tested for impairment on an annual basis.
Goodwill is denominated in the currency of the acquired entity and revalued to the closing rate at each reporting date.
Intangible assets with finite useful livesIntangible assets with finite useful lives are stated at cost, less accumulated amortisation and accumulated impairment losses, if any.
Amortisation is recognised in profit or loss on a straight-line basis over the estimated useful life, and commences when the intangible asset is available for use and ceases at the earlier of the date the asset is classified as held for sale or the date it is derecognised.
Useful lives and amortisation methods are reviewed on an annual basis, with the effect of any changes in estimate accounted for on a prospective basis.
The Group’s intangible assets with finite useful lives are as follows:
À Licences;
À Trademarks, patents and other;
À Customer bases; and
À Computer software.
Expenditure incurred to develop, maintain and renew internally generated trademarks and patents is recognised as an expense in the period it is incurred.
Computer software that is not considered to form an integral part of any hardware equipment is recorded as an intangible asset.
The difference between the proceeds and the carrying amount of an intangible asset is recognised as the profit or loss on disposal.
Impairment of assetsAn impairment loss is recognised immediately in profit or loss if the recoverable amount of an asset is less than its carrying amount. Recoverable amount is the higher of an asset’s fair value less costs of disposal and value in use. In assessing value in use, the estimated future cash flows from continuing use and ultimate disposal of the asset are discounted to their present value using a pre-tax discount rate that reflects current market assessments of the time value of money and the risks specific to the asset for which the estimates of future cash flows have not been adjusted.
Assets that do not generate cash inflows largely independent of those from other assets are grouped at the lowest levels for which there are separately identifiable cash flows, known as cash-generating units. If the recoverable amount of the cash-generating unit is less than the carrying amount of the unit, the impairment loss is allocated first to reduce the carrying amount of any goodwill allocated to the cash-generating unit and then to the other assets of the unit pro rata on the basis of the carrying amount of each asset in the unit.
Where an impairment loss subsequently reverses, the carrying amount of the asset or cash-generating unit is increased to the revised estimate of its recoverable amount, limited to the carrying amount that would have been determined had no impairment loss been recognised for the asset or cash-generating unit in prior periods. A reversal of an impairment loss is recognised immediately in profit or loss. Goodwill impairment losses are not reversible in subsequent periods.
23

Impairment of assets continuedAssets with an indefinite useful life and intangible assets not yet available for useGoodwill and intangible assets not yet available for use are tested annually for impairment and when events or changes in circumstances indicate that the carrying amounts may not be recoverable.
Property, plant and equipment and intangible assets with finite useful livesThe Group annually reviews the carrying amounts of its property, plant and equipment and intangible assets with finite useful lives in order to determine whether there is any indication that those assets have suffered an impairment loss. If any such indication exists, the recoverable amounts of the assets are estimated in order to determine the extent, if any, of the impairment loss.
Financial instrumentsFinancial assets and liabilities, in respect of financial instruments, are recognised on the Group’s statement of financial position when the Group becomes a party to the contractual provisions of the instrument.
All financial assets and liabilities are initially measured at fair value, including transaction costs except for those classified as at fair value through profit or loss which are initially measured at fair value, excluding transaction costs.
The fair value of a financial instrument on initial recognition is normally the transaction price unless the fair value is evident from observable market data.
Financial assets, excluding derivative financial instrumentsFinancial assets are recognised and derecognised on trade date where the purchase or sale of the financial asset is under a contract whose terms require delivery of the instrument within the time frame established by the market concerned.
Subsequent to initial recognition, these instruments are measured as follows:
À Financial assets at fair value through profit or loss and available-for-sale are subsequently stated at fair value. Where securities are held for trading, gains and losses arising from changes in fair value are included in profit or loss. For available-for-sale financial assets, gains and losses arising from changes in fair value are recognised directly in other comprehensive income, until the security is disposed of, it is determined to be impaired or the equity interest is increased, resulting in the asset no longer being accounted for as an available-for-sale financial asset, at which time the cumulative gain or loss previously recognised in other comprehensive income is reclassified to profit or loss. The net gain or loss recognised in profit or loss incorporates any gains or losses on remeasurement transferred from other comprehensive income to profit or loss, dividends and finance income on the financial asset.
À Loans receivable are subsequently stated at amortised cost using the effective interest rate method, less any impairment losses. The terms of loans granted are renegotiated on a case-by-case basis if circumstances required renegotiation.
À Trade receivables (excluding assets created by statutory requirements, prepayments, deferred cost and operating lease receivables) do not carry any interest and are subsequently reduced by appropriate allowances for estimated irrecoverable amounts.
À Other receivables are subsequently stated at their nominal values.
À Finance lease receivables are subsequently stated at amortised cost using the effective interest rate method, less any impairment losses.
Impairment of financial assetsFinancial assets, other than those at fair value through profit or loss, are assessed for indicators of impairment at each reporting date.
Certain categories of financial assets, such as trade receivables, that are assessed not to be impaired individually, are subsequently assessed for impairment on a collective basis.
Financial assets carried at amortised costFor financial assets carried at amortised cost, with the exception of trade and other receivables, the amount of the impairment loss is the difference between the asset’s carrying amount and the present value of estimated future cash flows, discounted at the financial asset’s original effective interest rate. For trade and other receivables, the amount of the impairment loss is the irrecoverable amount estimated by management.
Vodacom Group Limited Consolidated annual financial statements for the year ended 31 March 2016
24
Notes to the consolidated annual financial continued

Financial instruments continuedFinancial assets carried at amortised cost continuedThe carrying amount is reduced directly by the impairment loss, with the exception of trade receivables where the carrying amount is reduced through the use of an allowance account.
If, in a subsequent period, the amount of the impairment loss decreases and the decrease can be related objectively to an event occurring after the impairment loss was recognised, the previously recognised impairment loss is reversed, either directly or by adjusting the allowance account, through profit or loss. The carrying amount of the financial asset at the date the impairment loss is reversed will not exceed what the amortised cost would have been had the impairment loss not been recognised.
Available-for-sale financial assetsWhere there is objective evidence that a decline in the fair value of an available-for-sale financial asset that has been recognised directly in other comprehensive income is as a result of impairment, the cumulative loss is removed from other comprehensive income and recognised as an impairment loss in profit or loss. The amount of the cumulative loss removed is the difference between the acquisition cost and current fair value, less any impairment loss previously recognised in profit or loss.
A reversal of previously recognised impairment losses on available-for-sale equity investments is recognised directly in other comprehensive income.
Financial liabilities, excluding derivative financial instruments, and equity instrumentsFinancial liabilities and equity instruments issued by the Group are classified according to the substance of the contractual arrangements entered into and the applicable definitions. An equity instrument is any contract that evidences a residual interest in the assets of the Group after deducting all of its liabilities and includes no obligation to deliver cash or other financial asset.
Equity instruments issued by the Group are recorded at the proceeds received, net of direct issuance costs. Own equity instruments that are reacquired (treasury shares) are recognised at cost, including transaction costs, and deducted from equity. No gain or loss is recognised in profit or loss on the purchase, sale, issue or cancellation of the Group’s own equity instruments. Any difference between the carrying amount and the consideration, if reissued, is recognised in equity.
Subsequent to initial recognition, these instruments are measured as follows:
À Borrowings are subsequently stated at amortised cost, using the effective interest rate method. Any difference between the proceeds net of transaction costs and the settlement or redemption of borrowings is recognised over the term of the borrowings.
À Trade and other payables (excluding liabilities created by statutory requirements, revenue charged in advance, deferred revenue and reduced subscriptions) as well as dividends payable are not interest bearing and are subsequently stated at their nominal values.
Derivative financial instrumentsThe Group’s activities expose it to the financial risks of changes in foreign exchange rates and interest rates, which it manages using derivative financial instruments. The Group’s principal derivative financial instruments are option contracts, interest rate swaps and foreign exchange forward contracts.
The use of derivative financial instruments is governed by the Group’s policies approved by the Board, which provide written principles consistent with the Group’s risk management strategy. The Group does not use derivative financial instruments for speculative purposes.
Derivative financial instruments are initially measured at fair value on contract date and are subsequently remeasured to fair value at each reporting date. Changes in fair value are recorded in profit or loss as they arise unless the derivative is designated and effective as a hedging instrument, in which event the timing of recognition in profit or loss depends on the nature of the hedge relationship. Changes in values of all derivatives of a financing nature are included within net gain/(loss) on remeasurement and disposal of financial instruments in profit or loss.
Derivatives embedded in other financial instruments or other host contracts are treated as separate derivatives unless the risks and characteristics are closely related to those host contracts and the host contracts are carried at fair value with changes in fair value recognised in profit or loss.
Derivatives are classified as current assets or current liabilities if the remaining maturity of the instruments is less than 12 months and is expected to be realised or settled within 12 months.
25
Financial instruments continuedHedge accountingThe Group designates certain interest rate swaps as cash flow hedges to hedge its exposure to variability in cash flows that is attributable to changes in interest rates.
The effective portion of changes in the fair value of the designated interest rate swaps is recognised in other comprehensive income. The gain or loss relating to the ineffective portion is recognised immediately in profit or loss and included in net gain/(loss) on remeasurement and disposal of financial instruments.
Amounts previously recognised in other comprehensive income are reclassified to profit or loss in the periods when the hedged item is recognised in profit or loss.
Similarly, the Group designates certain foreign exchange forward contracts as fair value hedges to hedge its exposure to variability in fair value that is attributable to changes in foreign exchange rates.
Changes in the fair value of derivatives that are designated and qualify as fair value hedges are immediately recognised in profit or loss, together with any changes in the fair value of the hedged asset or liability that are attributable to the hedged risk. For unrecognised firm commitments, the change in the fair value of the hedging instrument and the change in the hedged item attributable to the hedged risk are recognised in profit or loss and included in the line item relating to the hedging instrument. The initial carrying amount of the asset or liability that results from the entity meeting the firm commitment is adjusted to include the cumulative change in the fair value of the firm commitment attributable to the hedged risk that was recognised in the statement of financial position. For recognised hedged assets or liabilities, the change in the fair value of the hedging instrument and the change in the hedged item attributable to the hedged risk are recognised in profit or loss in the line item relating to the hedged item.
Hedge accounting is discontinued when the Group revokes the hedging relationship, when the hedging instrument expires or is sold, terminated, or exercised, or when it no longer qualifies for hedge accounting. If a forecast transaction is no longer expected to occur, the gain or loss accumulated in equity is recognised immediately in profit or loss.
OffsetWhere a legally enforceable right of offset exists for recognised financial assets and liabilities, and there is an intention to settle the liability and realise the asset simultaneously, or to settle on a net basis, all related financial effects are offset.
Leases
Lease classificationLeases are classified as finance leases when the terms of the lease transfer substantially all the risks and rewards of ownership of the asset to the lessee. All other leases are classified as operating leases.
A lease of land and buildings is classified by considering the land and buildings elements separately. Minimum lease payments are allocated between the land and buildings elements in proportion to the relative fair values of the leasehold interest in the land and buildings elements of the lease at inception of the lease.
Group as lessee
Finance leasesAssets held under finance leases are recognised at their fair value at the inception of the lease or, if lower, at the present value of the minimum lease payments as determined at the inception of the lease. The corresponding liability to the lessor is included in the statement of financial position as a finance lease obligation. Lease payments are apportioned between finance charges and reduction of the lease obligation so as to achieve a constant rate of interest on the remaining balance of the liability. Finance charges are recognised in profit or loss.
In sale and leaseback transactions that result in finance leases any profit or loss is deferred and amortised over the lease term.
Vodacom Group Limited Consolidated annual financial statements for the year ended 31 March 2016
26
Notes to the consolidated annual financial continued
Leases continuedGroup as lessee continuedOperating leasesOperating lease payments, including benefits received and receivable as an incentive to enter into the lease, are expensed on a straight-line basis over the lease term. Early termination penalties are expensed in the period in which the termination occurs.
In sale and leaseback transactions that result in operating leases and the transaction is priced at fair value, any profit or loss is recognised on the effective date of the sale. If the sale price is below fair value, any profit or loss is recognised on the effective date of the sale except that, if a loss is compensated for by future lease payments at below market price, it is deferred and amortised in proportion to the lease payments over the period during which the asset is expected to be used. If the sale price is above fair value, the excess over fair value is deferred and amortised over the period for which the asset is expected to be used. If the fair value at the time of a sale and leaseback transaction is less than the carrying amount of the asset, a loss equal to the amount of the difference between the carrying amount and fair value is recognised immediately.
Group as lessor
Finance leasesAmounts due from lessees under finance leases are recorded as receivables at the amount of the Group’s net investment in the leases. Finance lease income is allocated to accounting periods so as to reflect a constant periodic rate of return on the Group’s net investment outstanding in respect of the leases.
Operating leasesOperating lease income is recognised in profit or loss on a straight-line basis over the lease term. Leased assets are included under property, plant and equipment and depreciated in accordance with its accounting policy.
InventoryInventory is stated at the lower of cost and net realisable value. Cost is determined by the first-in, first-out method and comprises direct materials and those overheads that have been incurred in bringing the inventories to their present location and condition.
Non-current assets held for saleNon-current assets (or disposal groups) are classified as assets held for sale when their carrying amount is to be recovered principally through a sale transaction and a sale is considered highly probable. They are stated at the lower of carrying amount and fair value less costs to sell.
Cash and cash equivalentsCash and cash equivalents comprise cash on hand and call deposits, net of bank overdrafts, all of which are available for use by the Group unless otherwise stated.
Cash on hand is initially recognised at fair value and subsequently stated at its face value.
ProvisionsProvisions are recognised when the Group has a present legal or constructive obligation as a result of a past event, it is probable that the Group will be required to settle that obligation and a reliable estimate of the amount of the obligation can be made. Provisions are measured at management’s best estimate of the expenditure required to settle the obligation at the reporting date and are discounted to present value where the effect of the time value of money is material.
TaxationTaxation represents the sum of current tax and deferred tax.
Tax is charged or credited to profit or loss, except when it relates to items charged or credited directly to other comprehensive income or directly to equity, in which case the tax is also recognised directly in other comprehensive income or in equity.
27

Taxation continuedTax assets and liabilities are offset when there is a legally enforceable right to set off tax assets against tax liabilities and when they either relate to income taxes levied by the same tax authority on either the same taxable entity or on different taxable entities which intend to settle the tax assets and liabilities on a net basis.
Current taxCurrent tax payable or receivable is based on taxable profit for the year. Taxable profit differs from profit as reported in the consolidated income statement because some items of income or expense are taxable or deductible in different years or may never be taxable or deductible. The Group’s liability for current tax is calculated using tax rates and laws that have been enacted or substantively enacted by the reporting date.
Deferred taxDeferred tax is the tax expected to be payable or recoverable in the future arising from temporary differences between the carrying amounts of assets and liabilities in the financial statements and the corresponding tax bases used in the computation of taxable profit. It is accounted for using the liability method.
Deferred tax liabilities are generally recognised for all taxable temporary differences and deferred tax assets are recognised to the extent that it is probable that the deductible temporary difference will reverse in the foreseeable future and taxable profits will be available against which deductible temporary differences can be utilised. Such assets and liabilities are not recognised if the temporary difference arises from the initial recognition, other than in a business combination, of assets and liabilities in a transaction that affects neither the taxable profit nor the accounting profit. Deferred tax liabilities are not recognised to the extent they arise from the initial recognition of goodwill.
Deferred tax liabilities are recognised for taxable temporary differences arising on investments in subsidiaries and associates and joint arrangements, except where the Group is able to control the reversal of the temporary difference and it is probable that the temporary difference will not reverse in the foreseeable future.
A deferred tax asset for the carry forward of unused tax losses and tax credits is only recognised to the extent that it is probable that future taxable profit will be available against which the unused tax losses and tax credits can be utilised.
The carrying amount of deferred tax assets is reviewed at each reporting date and adjusted to reflect changes in the probability that sufficient taxable profits will be available to allow all or part of the asset to be recovered.
Deferred tax is calculated at tax rates that are expected to apply in the period when the liability is settled or the asset realised, based on tax rates that have been enacted or substantively enacted by the reporting date.
Exchange differences arising from the translation of foreign tax assets and liabilities of foreign entities, where the functional currency is different to the local currency, are classified as a deferred tax expense or income.
Revenue recognitionRevenue is recognised to the extent the Group has delivered goods or rendered services under an agreement, provided the amount of revenue can be measured reliably and it is probable that the economic benefits associated with the transaction will flow to the Group. Revenue is measured at the fair value of the consideration received or receivable, exclusive of sales taxes and discounts.
The Group principally obtains revenue from providing the following telecommunication services: access charges, airtime usage, messaging, interconnect fees, data services and information provision, connection fees and the sale of equipment. Products and services may be sold separately or in bundled packages.
Revenue for access charges, airtime usage, and messaging by contract customers is recognised as services are performed. Unbilled revenue resulting from services already provided are accrued at the end of each period and unearned revenue from services to be provided in future periods are deferred. Revenue from the sale of prepaid credit is deferred until such time as the customer uses the airtime, or the credit expires.
Revenue from interconnect fees is recognised on a usage basis at the time the services are performed.
Revenue from data services and information provision is recognised when the Group has performed the related service.
Vodacom Group Limited Consolidated annual financial statements for the year ended 31 March 2016
28
Notes to the consolidated annual financial continued

Revenue recognition continuedCustomer connection revenue is recognised together with the related equipment revenue to the extent that the aggregate equipment and connection revenue does not exceed the fair value of the equipment delivered to the customer. Any customer connection revenue not recognised together with related equipment revenue is deferred and recognised over the period in which services are expected to be provided to the customer.
Revenue from the sale of equipment is recognised when the equipment is delivered to the customer and the significant risks and rewards of ownership have transferred. For equipment sales made to intermediaries, revenue is recognised if the significant risks and rewards of ownership are transferred and the intermediary has no general right of return. If the significant risks and rewards of ownership are not transferred, revenue recognition is deferred until sale of the equipment to an end-customer by the intermediary or the expiry of the right of return.
In revenue arrangements including more than one deliverable, the arrangements are divided into separate units of accounting. Deliverables are considered separate units of accounting if the following two conditions are met:
À The deliverable has value to the customer on a stand-alone basis; and
À There is evidence of the fair value of the undelivered item.
The arrangement consideration is allocated to each separate unit of accounting based on its relative fair value on a stand-alone basis as a percentage of the aggregated fair value of the individual deliverables. Revenue allocated to deliverables is restricted to the amount that is receivable without the delivery of additional goods or services. This restriction typically applies to revenue recognised for devices provided to customers, including handsets.
Other incomeDividends from investments are recognised when the Group’s right to receive payment has been established.
Interest is recognised on a time proportion basis with reference to the principal amount receivable and the effective interest rate applicable.
Presentation: gross versus netWhere the Group’s role in a transaction is that of principal, revenue is recognised on a gross basis. This requires revenue to comprise the gross value of the transaction billed to the customer, after trade discounts, with any related administrative fees charged as an operating cost.
Where the Group’s role in a transaction is that of an agent, revenue is recognised on a net basis, with revenue representing the margin earned.
CommissionsIntermediaries are given cash incentives by the Group to connect new customers and upgrade existing customers.
For intermediaries who do not purchase products and services from the Group, such cash incentives are accounted for as an expense. Cash incentives to intermediaries who purchase products and services from the Group are also accounted for as an expense if:
À The Group receives an identifiable benefit in exchange for the cash incentive that is separable from sales transactions to that intermediary; and
À The Group can reliably estimate the fair value of that benefit.
Cash incentives that do not meet these criteria are recognised as a reduction of the related revenue.
Distribution incentives paid to service providers and dealers for exclusivity are deferred and expensed over the contractual relationship period.
29

ExpensesExpenses are recognised as they are incurred. Prepaid expenses are deferred and recognised in periods to which they relate.
Restraint of trade payments are made to limit an executive’s post-employment activities and are expensed as incurred.
Borrowing costsBorrowing costs directly attributable to the acquisition, construction or production of qualifying assets are capitalised as part of the cost of those assets.
Borrowing costs include exchange differences arising from foreign currency borrowings to the extent that they are regarded as an adjustment to interest costs. The portion of exchange differences to be capitalised is estimated based on interest rates on similar borrowings in the entity’s functional currency. Foreign exchange gains and losses are assessed cumulatively over the construction period.
Other borrowing costs are expensed as they are incurred.
Employee benefits
Post-employment benefitsThe Group contributes to defined contribution funds for the benefit of employees and these contributions are expensed as they fall due. The Group is not liable for contributions to the medical aid of retired employees.
Short-term and long-term benefitsThe cost of all short-term employee benefits, such as salaries, employee entitlements to leave pay, bonuses, medical aid and other contributions, are expensed in the period in which the employee renders the related service.
Long-term employee benefits payable to eligible employees are expensed in the period in which the employee renders the related service.
Share-based paymentsThe Group has share-based payment compensation plans for certain eligible employees.
Equity-settled share-based paymentsEquity-settled shared-based payments are measured at the grant date fair value of the equity instruments granted, and are expensed on a straight-line basis over the vesting period, with a corresponding increase in equity. The annual expense is based on the Group’s estimate of the shares that will eventually vest, adjusted for the effect of non-market vesting conditions.
Cash-settled share-based paymentsCash-settled share-based payment liabilities are initially measured at fair value and subsequently remeasured to fair value at each reporting date as well as at the date of settlement, with any changes in fair value recognised in profit or loss. The expense is recognised on a straight-line basis over the vesting period, with a corresponding increase in the liability.
Broad-based black economic empowerment (‘BBBEE’) transactionWhere equity instruments are issued to a BBBEE partner at less than fair value, these are accounted for as share-based payments.
The difference between the fair value of the equity instruments issued and the consideration received is accounted for as an expense in profit or loss on the transaction date, with a corresponding increase in equity. No service or other conditions exist for BBBEE partners. A restriction on the BBBEE partner to transfer the equity instrument subsequent to its vesting is not treated as a vesting condition, but is factored into the fair value determination of the instrument.
ComparativesRefer to Note 21 for the line items restated.
Vodacom Group Limited Consolidated annual financial statements for the year ended 31 March 2016
30
Notes to the consolidated annual financial continued
New accounting pronouncementsAccounting pronouncements adoptedOn 1 April 2015, the Group adopted the following new accounting policies to comply with amendments to IFRS:
À IAS 19: Defined Benefit Plans: Employee Contributions;
À Improvements to IFRS 2010 to 2012 cycle amendment to IFRS 8: Operating Segments; and
À Improvements to IFRS 2011 to 2013 cycle.
These changes have no material impact on the results, financial position or cash flows of the Group.
New accounting pronouncements to be adopted 1 April 2016The Group has not yet adopted the following pronouncements, which have been issued by the IASB. The Group does not currently believe the adoption of these pronouncements will have a material impact on its results, financial position or cash flows:
À Amendments to IAS 1: Presentation of financial statements;
À Amendments to IAS 16: Property, Plant and Equipment and IAS 38: Intangible Assets, clarification of acceptable methods of depreciation and amortisation;
À Amendments to IAS 27: Separate Financial Statements, equity method in separate financial statements;
À Amendments to IFRS 11: Joint Arrangements, accounting for acquisitions of interests in joint operations; and
À Improvements to IFRS 2012 to 2014 Cycle.
New accounting pronouncements to be adopted on or after 1 April 2017The Group is currently assessing the impact of the following new pronouncements, which have been issued by the IASB. Unless otherwise stated, the Group does not currently believe the adoption of these pronouncements will have a material impact on its results, financial position or cash flows:
À Amendments to IAS 12: Income Taxes, recognition of deferred tax assets for unrealised losses, effective for annual periods beginning on or after 1 January 2017;
À Amendments to IAS 7: Statement of Cash Flows, disclosure initiative, effective for annual periods beginning on or after 1 January 2017;
À IFRS 15: Revenue from Contracts with Customers, which is effective for annual periods beginning on or after 1 January 2018. IFRS 15 will have a material impact on the Group’s reporting of revenue and costs as follows:
• IFRS 15 will require the Group to identify deliverables in contracts with customers that qualify as “performance obligations”. The transaction price receivable from customers must be allocated between the performance obligations under the contracts on a relative standalone selling price basis. Currently revenue allocated to deliverables is restricted to the amount that is receivable without the delivery of additional goods or services; this restriction will no longer be applied under IFRS 15. The primary impact on revenue reporting will be that when the Group sells subsidised devices together with airtime service agreements to customers, revenue allocated to equipment and recognised when control of the device passes to the customer will increase and revenue recognised as services are delivered will reduce. Where additional up-front unbilled revenue is recorded for the sale of devices, this will be reflected in the balance sheet as a contract asset;
• Under IFRS 15, certain incremental costs incurred in acquiring a contract with a customer will be deferred on the balance sheet and amortised as revenue is recognised under the related contract; this will generally lead to the later recognition of charges for some commissions payable to third party dealers and employees; and
• Certain costs incurred in fulfilling customer contracts will be deferred on the balance sheet under IFRS 15 and recognised as related revenue is recognised under the related contract. Such deferred costs are likely to relate to the provision of deliverables to customers that do not qualify as performance obligations and for which revenue is not recognised; currently such costs are generally expensed as incurred.
The Group is continuing to assess the impact of these and other accounting changes that will arise under IFRS 15; however, the changes highlighted above will have a material impact on the consolidated income statement and consolidated statement of financial position after the Group adopts IFRS 15 on 1 April 2018.
31

New accounting pronouncements continuedNew accounting pronouncements to be adopted on or after 1 April 2017 continuedWhen IFRS 15 is adopted, it can be applied either on a fully retrospective basis, requiring the restatement of the comparative periods presented in the financial statements, or with the cumulative retrospective impact of IFRS 15 applied as an adjustment to equity on the date of adoption; when the latter approach is applied it is necessary to disclose the impact of IFRS 15 on each line item in the financial statements in the reporting period. The Group currently intends to reflect the cumulative impact of IFRS 15 in equity on the date of adoption.
À IFRS 9: Financial Instruments was issued in July 2014 to replace IAS 39: Financial Instruments: Recognition and Measurement. The standard will impact the classification and measurement of the Group’s financial instruments and will require certain additional disclosures. The changes to recognition and measurement of financial instruments and changes to hedge accounting rules are not currently considered likely to have any major impact on the Group’s current accounting treatment or hedging activities. The standard is effective for annual periods beginning on or after 1 January 2018.
À IFRS 16: Leases was issued in January 2016 to replace IAS 17: Leases. The standard is effective for accounting periods beginning on or after 1 January 2019 with early adoption permitted if IFRS 15: Revenue from Contracts with Customers has been adopted.
IFRS 16 will primarily change lease accounting for lessees; lease agreements will give rise to the recognition of an asset representing the right to use the leased item and a loan obligation for future lease payables. Lease costs will be recognised in the form of depreciation of the right to use asset and interest on the lease liability. Lessee accounting under IFRS 16 will be similar to existing IAS 17 accounting for finance leases, but will be substantively different for operating leases where rental charges are currently recognised on straight-line basis and no lease asset or lease loan obligation is recognised.
Lessor accounting under IFRS 16 is similar to existing IAS 17 accounting. The Group is assessing the impact of the accounting changes that will arise under IFRS 16; however, the changes are expected to have a material impact on the consolidated income statement and consolidated statement of financial position.
The Group has not yet decided whether to adopt IFRS 16 when IFRS 15 is adopted, on 1 April 2018, or on 1 April 2019.
Critical accounting judgements including those involving estimationsThe Group prepares its consolidated annual financial statements in accordance with IFRS as issued by the IASB, the application of which often requires management to make judgements when formulating the Group’s financial position and results. Judgements, including those involving estimations, made in the process of applying the Group’s accounting policies are discussed below. Management considers these judgements to have a material effect on the consolidated annual financial statements.
The determination of estimates requires the exercise of judgement based on various assumptions and other factors such as historical experience, current and expected economic conditions. Although estimates are based on management’s best knowledge of current events and actions they may undertake in the future, actual results ultimately may differ from these estimates. Accounting estimates and the underlying assumptions are reviewed on an ongoing basis.
The discussion below should also be read in conjunction with the Group’s disclosure of ‘Significant accounting policies’, which is provided on page 19.
Management has presented its critical accounting judgements and associated disclosures to the Audit, Risk and Compliance Committee who has recommended it to the Board.
Investment in subsidiaries, associates and joint venturesJudgement is required in the assessment of whether the Group has control or significant influence in terms of the variability of returns from the Group’s involvement in the investee, the ability to use power to affect those returns and the significance of the Group’s investment in the investee. The Group classified its investment considering this assessment of control or significant influence (Note 12 and 29).
The Group concluded that its cell captive arrangement does not satisfy the criteria to be a ‘deemed separate entity’ and accordingly is not subject to consolidation. Similarly, the Group assessed its broad-based black economic empowerment transactions, to determine whether the Group has control over the entities it has partnered with in the transactions, resulting in the consolidation of these entities.
Vodacom Group Limited Consolidated annual financial statements for the year ended 31 March 2016
32
Notes to the consolidated annual financial continued
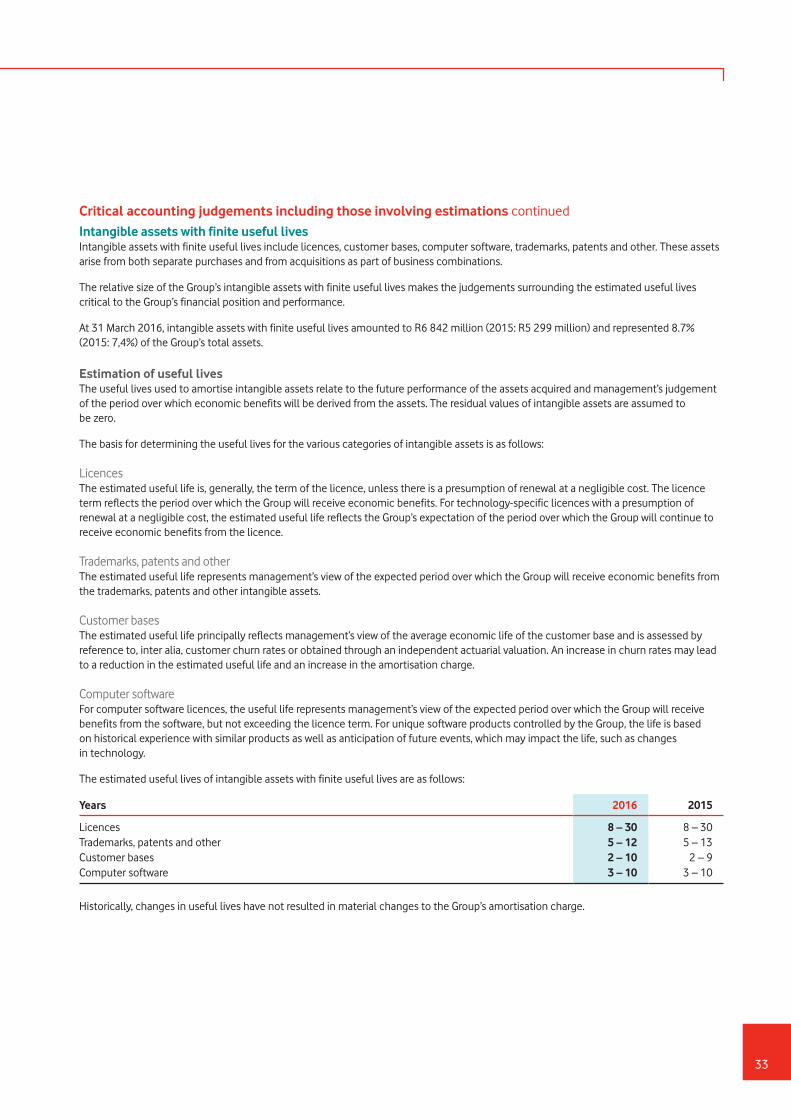
Critical accounting judgements including those involving estimations continuedIntangible assets with finite useful livesIntangible assets with finite useful lives include licences, customer bases, computer software, trademarks, patents and other. These assets arise from both separate purchases and from acquisitions as part of business combinations.
The relative size of the Group’s intangible assets with finite useful lives makes the judgements surrounding the estimated useful lives critical to the Group’s financial position and performance.
At 31 March 2016, intangible assets with finite useful lives amounted to R6 842 million (2015: R5 299 million) and represented 8.7% (2015: 7,4%) of the Group’s total assets.
Estimation of useful livesThe useful lives used to amortise intangible assets relate to the future performance of the assets acquired and management’s judgement of the period over which economic benefits will be derived from the assets. The residual values of intangible assets are assumed to be zero.
The basis for determining the useful lives for the various categories of intangible assets is as follows:
LicencesThe estimated useful life is, generally, the term of the licence, unless there is a presumption of renewal at a negligible cost. The licence term reflects the period over which the Group will receive economic benefits. For technology-specific licences with a presumption of renewal at a negligible cost, the estimated useful life reflects the Group’s expectation of the period over which the Group will continue to receive economic benefits from the licence.
Trademarks, patents and otherThe estimated useful life represents management’s view of the expected period over which the Group will receive economic benefits from the trademarks, patents and other intangible assets.
Customer basesThe estimated useful life principally reflects management’s view of the average economic life of the customer base and is assessed by reference to, inter alia, customer churn rates or obtained through an independent actuarial valuation. An increase in churn rates may lead to a reduction in the estimated useful life and an increase in the amortisation charge.
Computer softwareFor computer software licences, the useful life represents management’s view of the expected period over which the Group will receive benefits from the software, but not exceeding the licence term. For unique software products controlled by the Group, the life is based on historical experience with similar products as well as anticipation of future events, which may impact the life, such as changes in technology.
The estimated useful lives of intangible assets with finite useful lives are as follows:
Years 2016 2015
Licences 8 – 30 8 – 30Trademarks, patents and other 5 – 12 5 – 13Customer bases 2 – 10 2 – 9Computer software 3 – 10 3 – 10
Historically, changes in useful lives have not resulted in material changes to the Group’s amortisation charge.
33
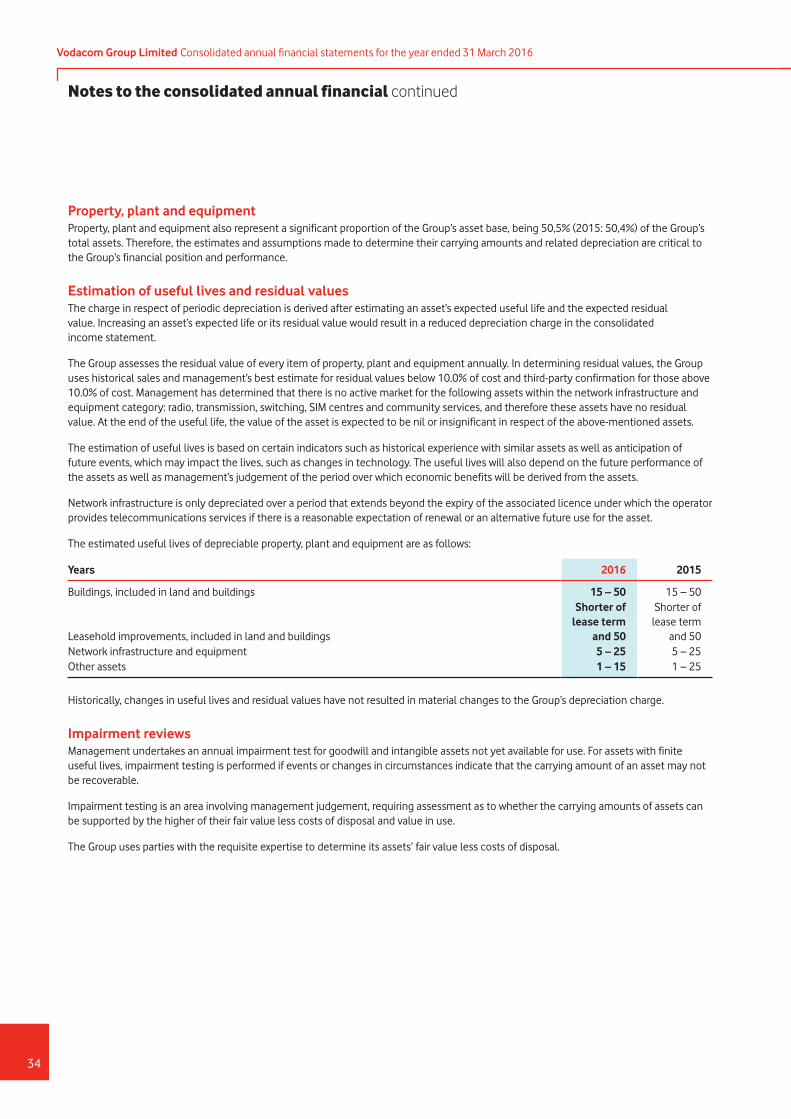
Property, plant and equipmentProperty, plant and equipment also represent a significant proportion of the Group’s asset base, being 50,5% (2015: 50,4%) of the Group’s total assets. Therefore, the estimates and assumptions made to determine their carrying amounts and related depreciation are critical to the Group’s financial position and performance.
Estimation of useful lives and residual valuesThe charge in respect of periodic depreciation is derived after estimating an asset’s expected useful life and the expected residual value. Increasing an asset’s expected life or its residual value would result in a reduced depreciation charge in the consolidated income statement.
The Group assesses the residual value of every item of property, plant and equipment annually. In determining residual values, the Group uses historical sales and management’s best estimate for residual values below 10.0% of cost and third-party confirmation for those above 10.0% of cost. Management has determined that there is no active market for the following assets within the network infrastructure and equipment category: radio, transmission, switching, SIM centres and community services, and therefore these assets have no residual value. At the end of the useful life, the value of the asset is expected to be nil or insignificant in respect of the above-mentioned assets.
The estimation of useful lives is based on certain indicators such as historical experience with similar assets as well as anticipation of future events, which may impact the lives, such as changes in technology. The useful lives will also depend on the future performance of the assets as well as management’s judgement of the period over which economic benefits will be derived from the assets.
Network infrastructure is only depreciated over a period that extends beyond the expiry of the associated licence under which the operator provides telecommunications services if there is a reasonable expectation of renewal or an alternative future use for the asset.
The estimated useful lives of depreciable property, plant and equipment are as follows:
Years 2016 2015
Buildings, included in land and buildings 15 – 50 15 – 50
Leasehold improvements, included in land and buildings
Shorter of lease term
and 50
Shorter of lease term
and 50 Network infrastructure and equipment 5 – 25 5 – 25Other assets 1 – 15 1 – 25
Historically, changes in useful lives and residual values have not resulted in material changes to the Group’s depreciation charge.
Impairment reviewsManagement undertakes an annual impairment test for goodwill and intangible assets not yet available for use. For assets with finite useful lives, impairment testing is performed if events or changes in circumstances indicate that the carrying amount of an asset may not be recoverable.
Impairment testing is an area involving management judgement, requiring assessment as to whether the carrying amounts of assets can be supported by the higher of their fair value less costs of disposal and value in use.
The Group uses parties with the requisite expertise to determine its assets’ fair value less costs of disposal.
Vodacom Group Limited Consolidated annual financial statements for the year ended 31 March 2016
34
Notes to the consolidated annual financial continued
Impairment reviews continuedValue in use is calculated as the net present value of future cash flows derived from assets using cash flow projections which have been discounted at appropriate discount rates. In calculating the net present value of the future cash flows, certain assumptions are required to be made in respect of highly uncertain matters including management’s expectations of:
À Growth in EBITDA, calculated as earnings before interest, taxation, depreciation, amortisation, impairment losses, BBBEE charge, profit or loss on disposal of property, plant and equipment, intangible assets and investment properties;
À Timing and quantum of future capital expenditure;
À Long-term growth rates; and
À The selection of appropriate discount rates to reflect the risks involved.
Details of the basis for determining values assigned to key assumptions are provided in Note 2.
The Group prepares and annually approves formal five-year management plans for its operations, which are used in the value in use calculations.
Changing the assumptions selected by management, in particular the discount rate and growth rate assumptions used in the cash flow projections, could significantly affect the Group’s impairment evaluation and consequently its results.
The Group’s review includes a sensitivity analysis of the key assumptions related to the cash flow projections as disclosed in Note 2.
Fair valuesThe determination of the fair value of assets and liabilities often requires complex estimations and is based, to a considerable extent, on management’s judgement.
Business combinationsThe amount of goodwill initially recognised as a result of a business combination is dependent on the allocation of the consideration transferred to the fair value of the identifiable assets acquired and the liabilities assumed.
The Group uses external parties with the requisite expertise to determine the acquisition-date fair values of certain identifiable assets acquired.
The fair value of assets is determined by discounting estimated future net cash flows generated by the assets, where no active market for the assets exists. The use of different discount rates as well as assumptions for the expectation of future cash flows would change the valuation of the asset.
Allocation of the consideration transferred affects the Group’s results as property, plant and equipment as well as intangible assets with finite useful lives are respectively depreciated and amortised, whereas land and goodwill are not. This could result in differing depreciation and amortisation charges based on the allocation.
Financial instrumentsThe fair value of financial instruments, excluding derivative instruments, not traded in active, liquid and organised financial markets is determined using a variety of valuation methods and assumptions that are based on market conditions and risks existing at the reporting date, including independent appraisals and discounted cash flow methods.
BBBEE transactionThe fair value of the BBBEE transaction was measured using the Monte-Carlo option pricing valuation model. Refer to Note 17 for assumptions used.
Forfeitable share planThe share-based payment expense relating to awards of performance shares to the Group’s executive directors and selected employees is based on the achievement of financial performance and customer targets. The probability of these financial performance targets being achieved is estimated using the Monte-Carlo simulation model. Please refer to forfeitable share plan note (Note 17).
35
TaxationThe Group’s tax charge on ordinary activities is the sum of the current and deferred tax charges. The calculation of the Group’s total taxation charge necessarily involves judgements, including those involving estimations, in respect of certain matters where the tax impact is uncertain until a conclusion has been reached with the relevant tax authority or, as appropriate, through a formal legal process. The final resolution of some of these items may give rise to material profits, losses and/or cash flows.
The complexity of the Group’s structure, considering its geographic presence, makes the degree of judgement more challenging. The resolution of issues is not always within the Group’s control and it is often dependent on the efficiency of the legal processes in the relevant tax jurisdictions in which the Group operates. Issues can, and often do, take many years to resolve. Payments in respect of tax liabilities for an accounting period result from payments on account and on the final resolution of open items. As a result, there can be substantial differences between the taxation charge in the consolidated income statement and tax payments.
Significant items on which the Group has exercised judgement include various matters disclosed in Note 26. Due to the inherent uncertainty surrounding the outcome of these items, eventual resolution could differ from the accounting estimates and therefore impact the Group’s results and cash flows.
Recognition of deferred tax assetsThe recognition of deferred tax assets, particularly in respect of tax losses and tax credits, is based upon whether it is probable that there will be sufficient and suitable taxable profits in the relevant legal entity or tax group against which to utilise the assets in the future. Management therefore exercises judgement in assessing the future financial performance of the particular entity or tax group in which the deferred tax asset is to be recognised.
Revenue recognition and presentation
Revenue arrangements including more than one deliverableIn revenue arrangements including more than one deliverable, the deliverables are assigned to one or more separate units of accounting and the arrangement consideration is allocated to each unit of accounting based on its relative fair value. The fair values determined for deliverables may impact the timing of the recognition of revenue.
Determining the fair value of each deliverable can require complex estimates due to the nature of the goods and services provided. The Group generally determines the fair value of individual elements based on prices at which the deliverable is regularly sold on a stand-alone basis, after considering volume discounts where appropriate.
Presentation: gross versus netDetermining whether the Group is acting as a principal or as an agent requires judgement and consideration of all relevant facts and circumstances. When deciding the most appropriate basis for presenting the revenue or related costs, both the legal form and substance of the agreement between the Group and its business partners are reviewed to determine each party’s respective role in the transaction. Such judgements impact the amount of reported revenue and operating expenses but do not impact reported assets, liabilities or net cash flows from operating activities.
Provisions and contingent liabilitiesThe Group exercises judgements in measuring and recognising provisions and the exposure to contingent liabilities related to pending litigation or other outstanding claims subject to negotiated settlement, mediation, arbitration or government regulation, as well as other contingent liabilities (Note 25). Judgements, including those involving estimations, are necessary in assessing the likelihood that a pending claim will succeed, or a liability will arise, and to quantify the possible range of the financial settlement.
Foreign operationsThe Group exercises judgements in determining whether monetary items receivable from or payable to foreign entities form part of the Group’s net investment in foreign operations. Judgements, including those involving estimations, are necessary in assessing whether settlement of the monetary items receivable or payable is likely to occur in the foreseeable future. Included in other comprehensive income are exchange gains of R427 million (2015: R269 million) net of tax, relating to foreign-denominated loans to subsidiaries classified as net investments in foreign operations.
Vodacom Group Limited Consolidated annual financial statements for the year ended 31 March 2016
36
Notes to the consolidated annual financial continued
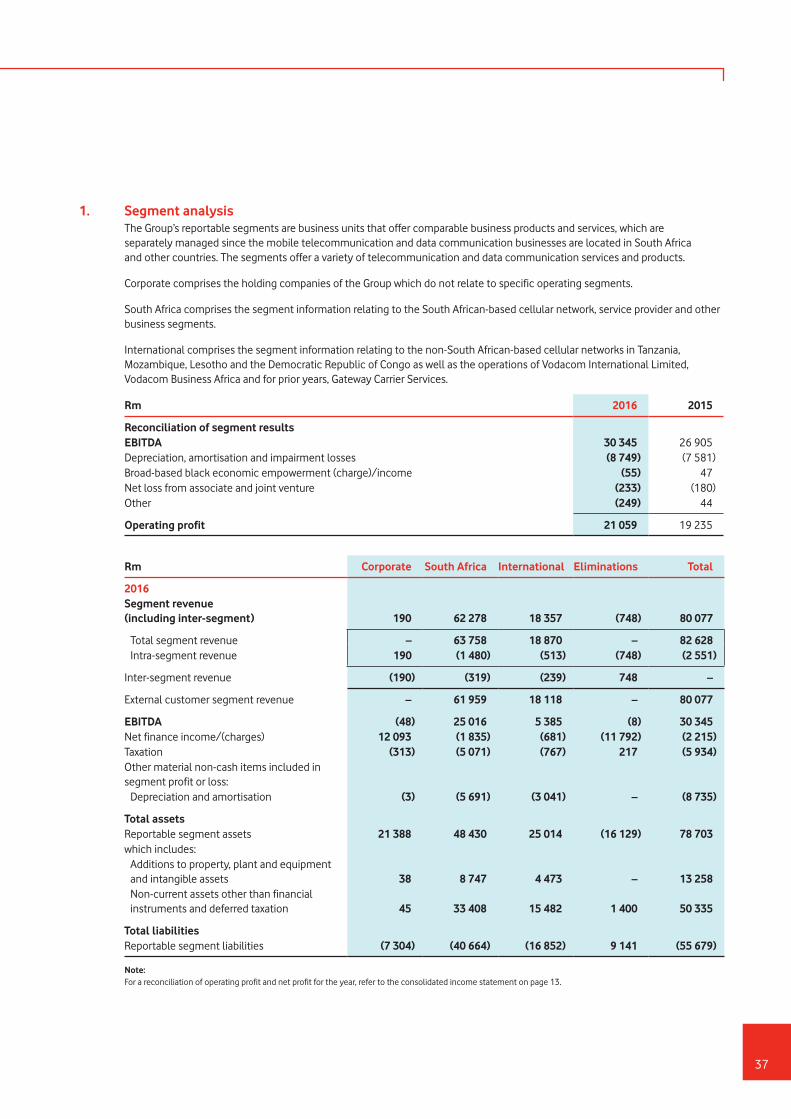
1. Segment analysis The Group’s reportable segments are business units that offer comparable business products and services, which are
separately managed since the mobile telecommunication and data communication businesses are located in South Africa and other countries. The segments offer a variety of telecommunication and data communication services and products.
Corporate comprises the holding companies of the Group which do not relate to specific operating segments.
South Africa comprises the segment information relating to the South African-based cellular network, service provider and other business segments.
International comprises the segment information relating to the non-South African-based cellular networks in Tanzania, Mozambique, Lesotho and the Democratic Republic of Congo as well as the operations of Vodacom International Limited, Vodacom Business Africa and for prior years, Gateway Carrier Services.
Rm 2016 2015
Reconciliation of segment resultsEBITDA 30 345 26 905 Depreciation, amortisation and impairment losses (8 749) (7 581)Broad-based black economic empowerment (charge)/income (55) 47 Net loss from associate and joint venture (233) (180)Other (249) 44
Operating profit 21 059 19 235
Rm Corporate South Africa International Eliminations Total
2016Segment revenue (including inter-segment) 190 62 278 18 357 (748) 80 077
Total segment revenue – 63 758 18 870 – 82 628 Intra-segment revenue 190 (1 480) (513) (748) (2 551)
Inter-segment revenue (190) (319) (239) 748 –
External customer segment revenue – 61 959 18 118 – 80 077
EBITDA (48) 25 016 5 385 (8) 30 345 Net finance income/(charges) 12 093 (1 835) (681) (11 792) (2 215)Taxation (313) (5 071) (767) 217 (5 934)Other material non-cash items included in segment profit or loss: Depreciation and amortisation (3) (5 691) (3 041) – (8 735)
Total assetsReportable segment assets 21 388 48 430 25 014 (16 129) 78 703 which includes: Additions to property, plant and equipment
and intangible assets 38 8 747 4 473 – 13 258 Non-current assets other than financial
instruments and deferred taxation 45 33 408 15 482 1 400 50 335
Total liabilitiesReportable segment liabilities (7 304) (40 664) (16 852) 9 141 (55 679)
Note: For a reconciliation of operating profit and net profit for the year, refer to the consolidated income statement on page 13.
37

Rm CorporateSouth Africa1
Restated International Eliminations Total
1. Segment analysis continued2015Segment revenue (including inter-segment) 114 59 203 15 747 (564) 74 500
Total segment revenue – 60 451 16 097 – 76 549 Intra-segment revenue 114 (1 248) (350) (564) (2 049)
Inter-segment revenue (114) (326) (124) 564 –
External customer segment revenue1 – 58 877 15 623 – 74 500
EBITDA (36) 22 837 4 104 – 26 905 Net finance income/(charges) 9 661 (1 186) (473) (9 386) (1 384)Taxation (220) (4 621) (622) 122 (5 341)Other material non-cash items included in segment profit or loss: Depreciation and amortisation (3) (5 161) (2 429) 12 (7 581)
Total assetsReportable segment assets 22 682 46 354 21 861 (19 590) 71 307 which includes: Additions to property, plant and equipment
and intangible assets 5 8 724 4 680 – 13 409 Non-current assets other than financial
instruments and deferred taxation 58 29 629 13 774 1 386 44 847
Total liabilitiesReportable segment liabilities (8 637) (39 112) (14 438) 12 523 (49 664)
Note: 1. The classification of revenue changed during the year in the South African segment. Refer to Note 21.
Rm 2016 2015
2. ImpairmentImpairment lossesImpairment losses recognised are as follows:Intangible assets (Note 10) (10) – Property, plant and equipment (Note 9) (4) –
(14) –
Goodwill impairment testingCarrying amount of goodwill is as follows:Vodacom (Pty) Limited 2 549 2 185 Other1 126 119
2 675 2 304
Note: 1. This constitutes the aggregate carrying amount of goodwill allocated across multiple cash-generating units of which the amounts so allocated to each cash-
generating unit is insignificant compared to the total carrying amount of goodwill.
Vodacom Group Limited Consolidated annual financial statements for the year ended 31 March 2016
38
Notes to the consolidated annual financial continued
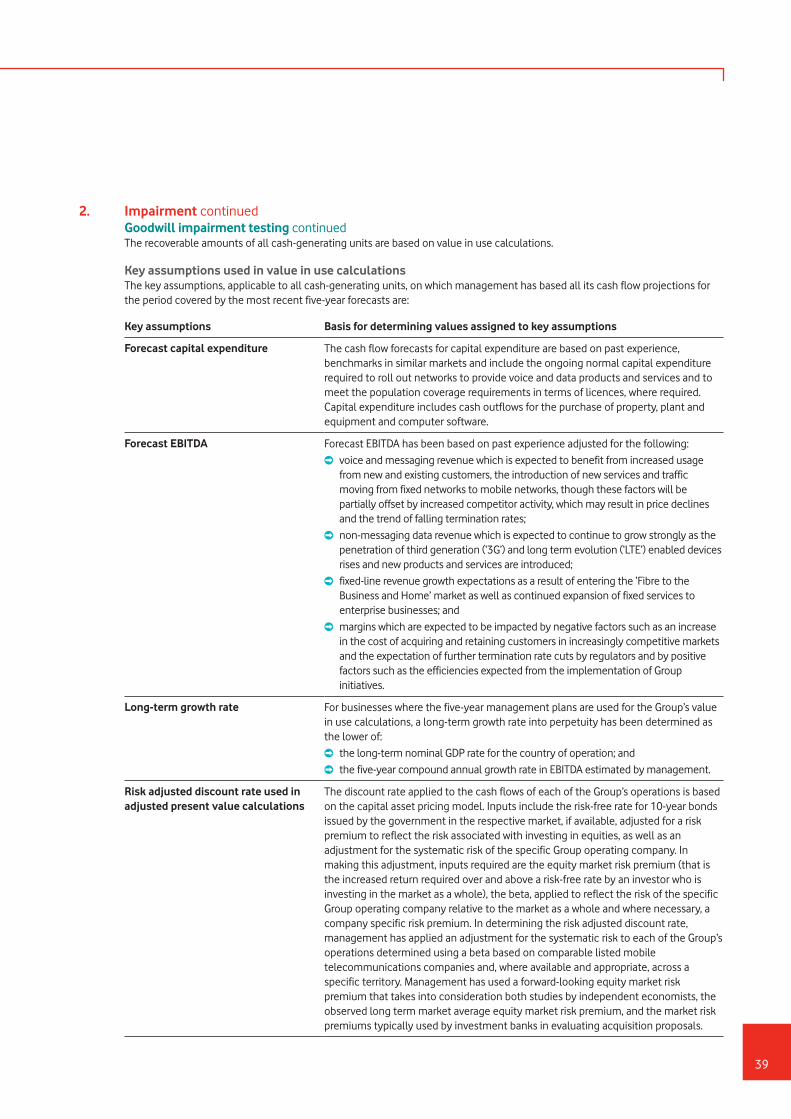
2. Impairment continued Goodwill impairment testing continued The recoverable amounts of all cash-generating units are based on value in use calculations.
Key assumptions used in value in use calculations The key assumptions, applicable to all cash-generating units, on which management has based all its cash flow projections for
the period covered by the most recent five-year forecasts are:
Key assumptions Basis for determining values assigned to key assumptions
Forecast capital expenditure The cash flow forecasts for capital expenditure are based on past experience, benchmarks in similar markets and include the ongoing normal capital expenditure required to roll out networks to provide voice and data products and services and to meet the population coverage requirements in terms of licences, where required. Capital expenditure includes cash outflows for the purchase of property, plant and equipment and computer software.
Forecast EBITDA Forecast EBITDA has been based on past experience adjusted for the following:
À voice and messaging revenue which is expected to benefit from increased usage from new and existing customers, the introduction of new services and traffic moving from fixed networks to mobile networks, though these factors will be partially offset by increased competitor activity, which may result in price declines and the trend of falling termination rates;
À non-messaging data revenue which is expected to continue to grow strongly as the penetration of third generation (‘3G’) and long term evolution (‘LTE’) enabled devices rises and new products and services are introduced;
À fixed-line revenue growth expectations as a result of entering the ‘Fibre to the Business and Home’ market as well as continued expansion of fixed services to enterprise businesses; and
À margins which are expected to be impacted by negative factors such as an increase in the cost of acquiring and retaining customers in increasingly competitive markets and the expectation of further termination rate cuts by regulators and by positive factors such as the efficiencies expected from the implementation of Group initiatives.
Long-term growth rate For businesses where the five-year management plans are used for the Group’s value in use calculations, a long-term growth rate into perpetuity has been determined as the lower of:
À the long-term nominal GDP rate for the country of operation; and
À the five-year compound annual growth rate in EBITDA estimated by management.
Risk adjusted discount rate used in adjusted present value calculations
The discount rate applied to the cash flows of each of the Group’s operations is based on the capital asset pricing model. Inputs include the risk-free rate for 10-year bonds issued by the government in the respective market, if available, adjusted for a risk premium to reflect the risk associated with investing in equities, as well as an adjustment for the systematic risk of the specific Group operating company. In making this adjustment, inputs required are the equity market risk premium (that is the increased return required over and above a risk-free rate by an investor who is investing in the market as a whole), the beta, applied to reflect the risk of the specific Group operating company relative to the market as a whole and where necessary, a company specific risk premium. In determining the risk adjusted discount rate, management has applied an adjustment for the systematic risk to each of the Group’s operations determined using a beta based on comparable listed mobile telecommunications companies and, where available and appropriate, across a specific territory. Management has used a forward-looking equity market risk premium that takes into consideration both studies by independent economists, the observed long term market average equity market risk premium, and the market risk premiums typically used by investment banks in evaluating acquisition proposals.
39

2. Impairment continued Goodwill impairment testing continued
% Vodacom (Pty) Limited
31 March 2016Long-term growth rate 2,9Risk adjusted discount rate 12.4
31 March 2015Long-term growth rate 3.6Risk adjusted discount rate 10.9
Sensitivity to changes in key assumptions Vodacom (Pty) Limited is the only cash-generating unit for which the carrying amount of goodwill allocated to that unit is
significant in comparison with the Group’s total carrying amount of goodwill.
Management believes that no reasonable possible change in any of the aforementioned key assumptions would cause the carrying amount of any cash-generating unit to which a significant amount of goodwill has been allocated, to exceed its recoverable amount.
Rm 2016 2015
3. Operating profitThe operating profit has been arrived at after (charging)/crediting:Net (loss)/profit on disposal of property, plant and equipment and intangible assets (50) 110Auditor’s remuneration – audit fees (31) (26)Auditor’s remuneration – other services (1) (1)Professional fees for consultancy services (354) (321)Operating lease rentals (3 226) (2 914)
Network infrastructure (2 700) (2 423) Other (526) (491)
Bad debts (479) (697)Inventory written off (38) (9)Net foreign exchange gains/(losses) 383 (174)
Direct expenses include customer acquisition- and retention-related expenses, interconnect expenses, commissions, converged solutions expenses and various other direct expenses. Other operating expenses include network operational expenses and all administrative expenses.
Rm 2016 2015
4. Finance incomeInterest income Banks 408 175 Loans receivable 116 8 Tax authorities 14 – Other 178 163
716 346
Interest income on financial assets not at fair value through profit or loss amounted to R700 million (2015: R334 million).
Vodacom Group Limited Consolidated annual financial statements for the year ended 31 March 2016
40
Notes to the consolidated annual financial continued
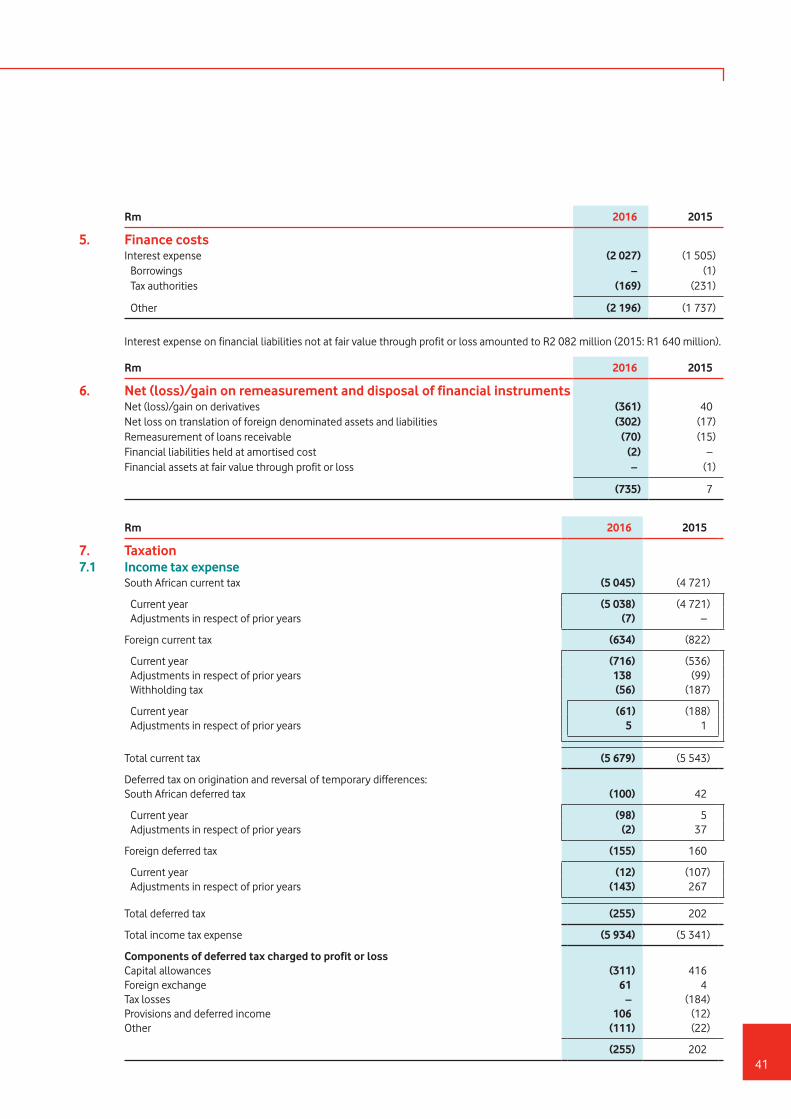
Rm 2016 2015
5. Finance costsInterest expense (2 027) (1 505) Borrowings – (1) Tax authorities (169) (231)
Other (2 196) (1 737)
Interest expense on financial liabilities not at fair value through profit or loss amounted to R2 082 million (2015: R1 640 million).
Rm 2016 2015
6. Net (loss)/gain on remeasurement and disposal of financial instrumentsNet (loss)/gain on derivatives (361) 40 Net loss on translation of foreign denominated assets and liabilities (302) (17)Remeasurement of loans receivable (70) (15)Financial liabilities held at amortised cost (2) – Financial assets at fair value through profit or loss – (1)
(735) 7
Rm 2016 2015
7. Taxation7.1 Income tax expense
South African current tax (5 045) (4 721)
Current year (5 038) (4 721) Adjustments in respect of prior years (7) –
Foreign current tax (634) (822)
Current year (716) (536) Adjustments in respect of prior years 138 (99) Withholding tax (56) (187)
Current year (61) (188) Adjustments in respect of prior years 5 1
Total current tax (5 679) (5 543)
Deferred tax on origination and reversal of temporary differences:South African deferred tax (100) 42
Current year (98) 5 Adjustments in respect of prior years (2) 37
Foreign deferred tax (155) 160
Current year (12) (107) Adjustments in respect of prior years (143) 267
Total deferred tax (255) 202
Total income tax expense (5 934) (5 341)
Components of deferred tax charged to profit or lossCapital allowances (311) 416 Foreign exchange 61 4 Tax losses – (184)Provisions and deferred income 106 (12)Other (111) (22)
(255) 202 41
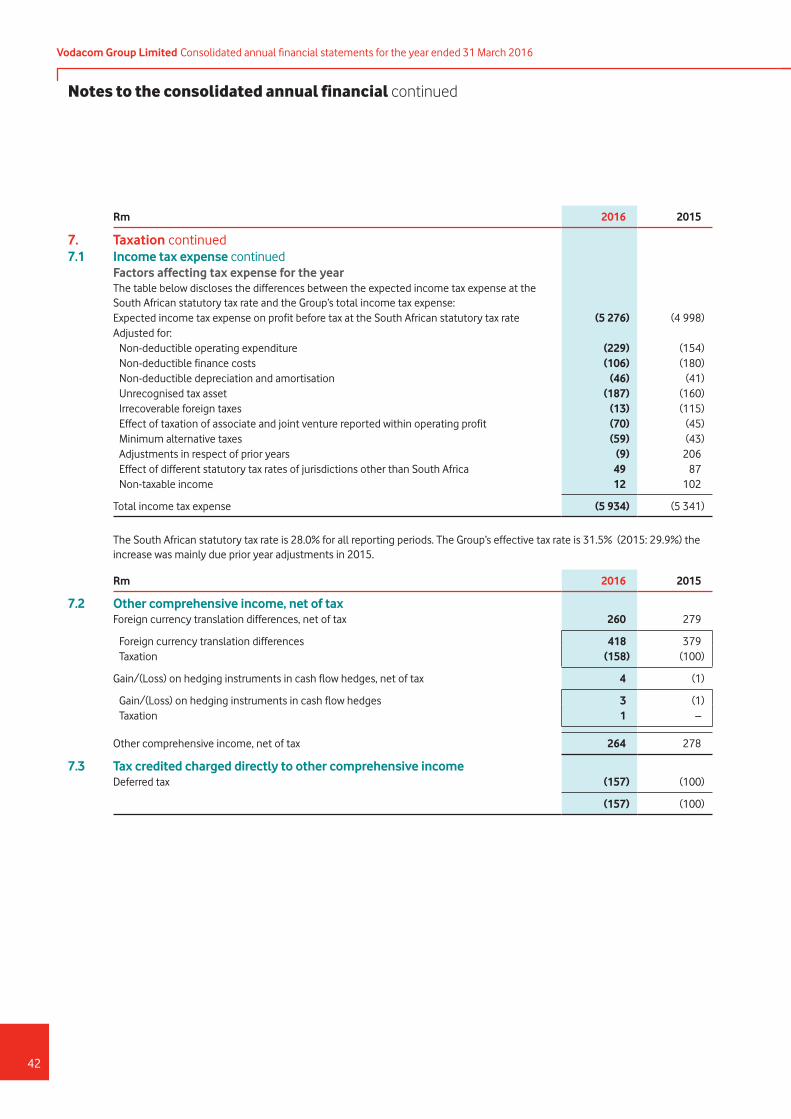
Rm 2016 2015
7. Taxation continued7.1 Income tax expense continued
Factors affecting tax expense for the yearThe table below discloses the differences between the expected income tax expense at the South African statutory tax rate and the Group’s total income tax expense:Expected income tax expense on profit before tax at the South African statutory tax rate (5 276) (4 998)Adjusted for: Non-deductible operating expenditure (229) (154) Non-deductible finance costs (106) (180) Non-deductible depreciation and amortisation (46) (41) Unrecognised tax asset (187) (160) Irrecoverable foreign taxes (13) (115) Effect of taxation of associate and joint venture reported within operating profit (70) (45) Minimum alternative taxes (59) (43) Adjustments in respect of prior years (9) 206 Effect of different statutory tax rates of jurisdictions other than South Africa 49 87 Non-taxable income 12 102
Total income tax expense (5 934) (5 341)
The South African statutory tax rate is 28.0% for all reporting periods. The Group’s effective tax rate is 31.5% (2015: 29.9%) the increase was mainly due prior year adjustments in 2015.
Rm 2016 2015
7.2 Other comprehensive income, net of taxForeign currency translation differences, net of tax 260 279
Foreign currency translation differences 418 379 Taxation (158) (100)
Gain/(Loss) on hedging instruments in cash flow hedges, net of tax 4 (1)
Gain/(Loss) on hedging instruments in cash flow hedges 3 (1) Taxation 1 –
Other comprehensive income, net of tax 264 278
7.3 Tax credited charged directly to other comprehensive incomeDeferred tax (157) (100)
(157) (100)
Vodacom Group Limited Consolidated annual financial statements for the year ended 31 March 2016
42
Notes to the consolidated annual financial continued
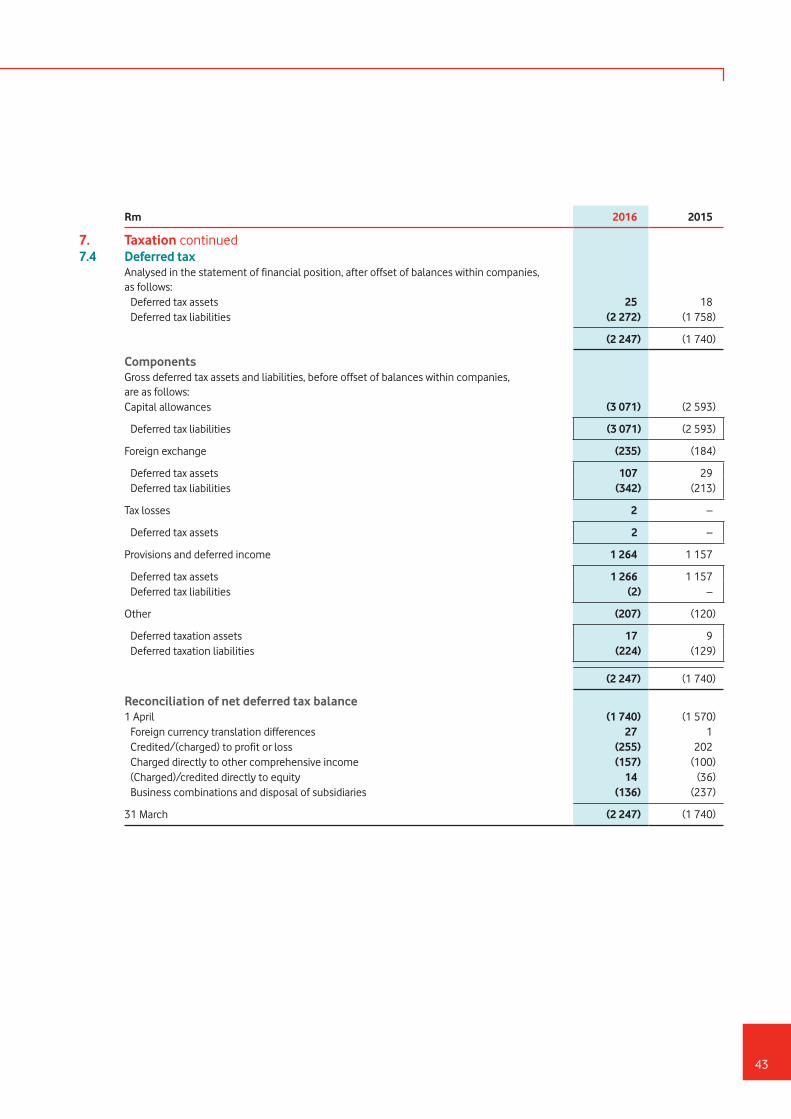
Rm 2016 2015
7. Taxation continued7.4 Deferred tax
Analysed in the statement of financial position, after offset of balances within companies, as follows: Deferred tax assets 25 18 Deferred tax liabilities (2 272) (1 758)
(2 247) (1 740)
ComponentsGross deferred tax assets and liabilities, before offset of balances within companies, are as follows:Capital allowances (3 071) (2 593)
Deferred tax liabilities (3 071) (2 593)
Foreign exchange (235) (184)
Deferred tax assets 107 29 Deferred tax liabilities (342) (213)
Tax losses 2 –
Deferred tax assets 2 –
Provisions and deferred income 1 264 1 157
Deferred tax assets 1 266 1 157 Deferred tax liabilities (2) –
Other (207) (120)
Deferred taxation assets 17 9 Deferred taxation liabilities (224) (129)
(2 247) (1 740)
Reconciliation of net deferred tax balance1 April (1 740) (1 570) Foreign currency translation differences 27 1 Credited/(charged) to profit or loss (255) 202 Charged directly to other comprehensive income (157) (100) (Charged)/credited directly to equity 14 (36) Business combinations and disposal of subsidiaries (136) (237)
31 March (2 247) (1 740)
43
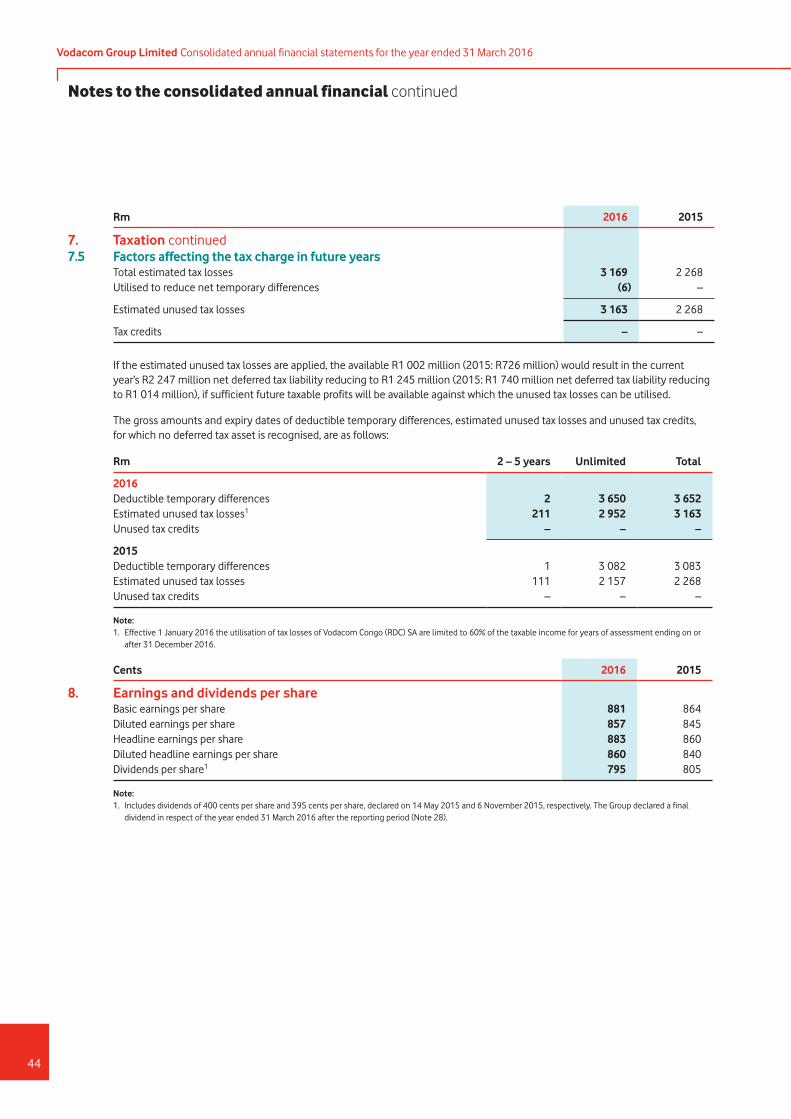
Rm 2016 2015
7. Taxation continued7.5 Factors affecting the tax charge in future years
Total estimated tax losses 3 169 2 268 Utilised to reduce net temporary differences (6) –
Estimated unused tax losses 3 163 2 268
Tax credits – –
If the estimated unused tax losses are applied, the available R1 002 million (2015: R726 million) would result in the current year’s R2 247 million net deferred tax liability reducing to R1 245 million (2015: R1 740 million net deferred tax liability reducing to R1 014 million), if sufficient future taxable profits will be available against which the unused tax losses can be utilised.
The gross amounts and expiry dates of deductible temporary differences, estimated unused tax losses and unused tax credits, for which no deferred tax asset is recognised, are as follows:
Rm 2 – 5 years Unlimited Total
2016Deductible temporary differences 2 3 650 3 652 Estimated unused tax losses1 211 2 952 3 163 Unused tax credits – – –
2015Deductible temporary differences 1 3 082 3 083 Estimated unused tax losses 111 2 157 2 268 Unused tax credits – – –
Note: 1. Effective 1 January 2016 the utilisation of tax losses of Vodacom Congo (RDC) SA are limited to 60% of the taxable income for years of assessment ending on or
after 31 December 2016.
Cents 2016 2015
8. Earnings and dividends per shareBasic earnings per share 881 864 Diluted earnings per share 857 845 Headline earnings per share 883 860 Diluted headline earnings per share 860 840 Dividends per share1 795 805
Note: 1. Includes dividends of 400 cents per share and 395 cents per share, declared on 14 May 2015 and 6 November 2015, respectively. The Group declared a final
dividend in respect of the year ended 31 March 2016 after the reporting period (Note 28).
Vodacom Group Limited Consolidated annual financial statements for the year ended 31 March 2016
44
Notes to the consolidated annual financial continued
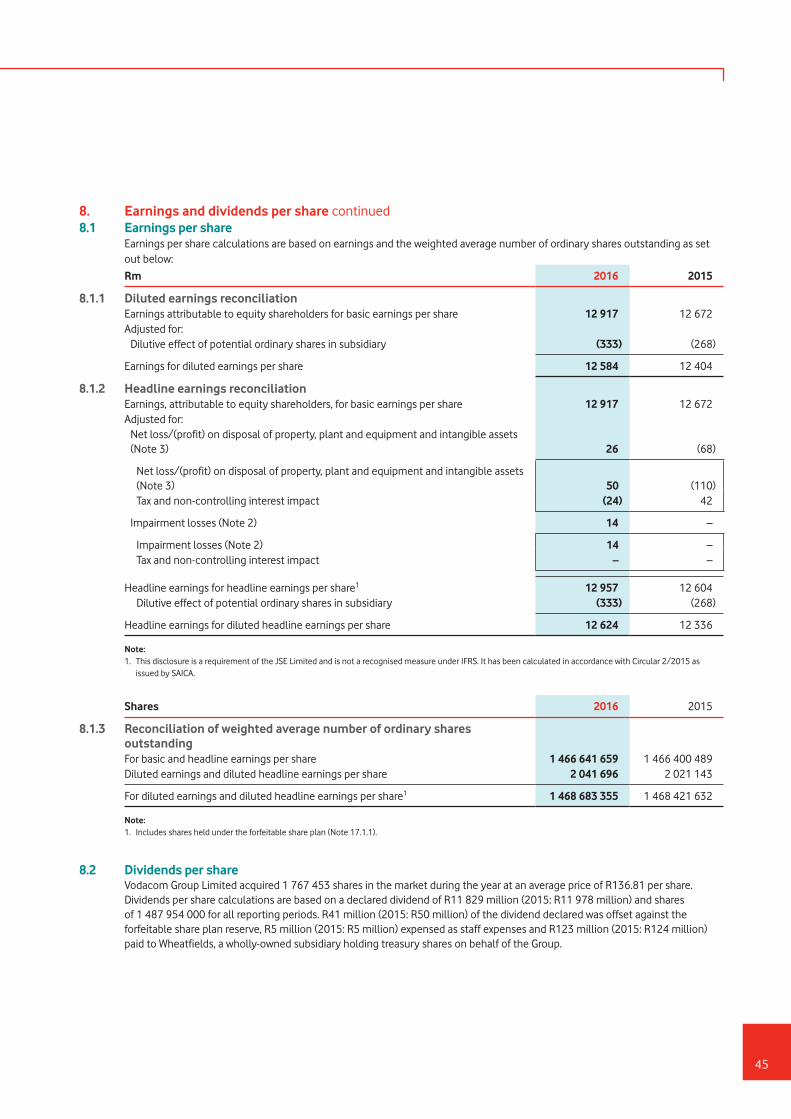
8. Earnings and dividends per share continued8.1 Earnings per share Earnings per share calculations are based on earnings and the weighted average number of ordinary shares outstanding as set
out below:
Rm 2016 2015
8.1.1 Diluted earnings reconciliationEarnings attributable to equity shareholders for basic earnings per share 12 917 12 672 Adjusted for: Dilutive effect of potential ordinary shares in subsidiary (333) (268)
Earnings for diluted earnings per share 12 584 12 404
8.1.2 Headline earnings reconciliationEarnings, attributable to equity shareholders, for basic earnings per share 12 917 12 672 Adjusted for: Net loss/(profit) on disposal of property, plant and equipment and intangible assets
(Note 3) 26 (68)
Net loss/(profit) on disposal of property, plant and equipment and intangible assets (Note 3) 50 (110)
Tax and non-controlling interest impact (24) 42
Impairment losses (Note 2) 14 –
Impairment losses (Note 2) 14 – Tax and non-controlling interest impact – –
Headline earnings for headline earnings per share1 12 957 12 604 Dilutive effect of potential ordinary shares in subsidiary (333) (268)
Headline earnings for diluted headline earnings per share 12 624 12 336
Note: 1. This disclosure is a requirement of the JSE Limited and is not a recognised measure under IFRS. It has been calculated in accordance with Circular 2/2015 as
issued by SAICA.
Shares 2016 2015
8.1.3 Reconciliation of weighted average number of ordinary shares outstandingFor basic and headline earnings per share 1 466 641 659 1 466 400 489 Diluted earnings and diluted headline earnings per share 2 041 696 2 021 143
For diluted earnings and diluted headline earnings per share1 1 468 683 355 1 468 421 632
Note: 1. Includes shares held under the forfeitable share plan (Note 17.1.1).
8.2 Dividends per share Vodacom Group Limited acquired 1 767 453 shares in the market during the year at an average price of R136.81 per share.
Dividends per share calculations are based on a declared dividend of R11 829 million (2015: R11 978 million) and shares of 1 487 954 000 for all reporting periods. R41 million (2015: R50 million) of the dividend declared was offset against the forfeitable share plan reserve, R5 million (2015: R5 million) expensed as staff expenses and R123 million (2015: R124 million) paid to Wheatfields, a wholly-owned subsidiary holding treasury shares on behalf of the Group.
45

RmLand and
buildings
Network infrastructure
& equipmentOther
assets Total
9. Property, plant and equipment31 March 2014 2 969 27 385 448 30 802
Cost 4 644 56 347 1 294 62 285 Accumulated depreciation and impairment losses (1 675) (28 962) (846) (31 483)
Additions 459 10 548 302 11 309 Disposals (4) (208) (10) (222)Foreign currency translation differences 17 368 10 395 Depreciation (226) (5 963) (145) (6 334)Net transfer to intangible assets (Note 10) (45) (72) 47 (70)Transfer to non-current assets held for sale (Note 12) (5) (21) – (26)Category and other transfers – 100 5 105
31 March 2015 3 165 32 137 657 35 959
Cost 5 078 62 955 1 592 69 625 Accumulated depreciation and impairment losses (1 913) (30 818) (935) (33 666)
Additions 352 10 174 318 10 844 Disposals – (94) (7) (101)Foreign currency translation differences 17 423 6 446 Depreciation (249) (6 796) (166) (7 211)Impairment losses (Note 2) – (4) – (4)Net transfer to intangible assets (Note 10) (2) (20) (2) (24)Transfer to non-current assets held for sale (Note 12) – (165) – (165)Category and other transfers 44 (5) (39) –
31 March 2016 3 327 35 650 767 39 744
Cost 5 554 69 398 1 823 76 775 Accumulated depreciation and impairment losses (2 227) (33 748) (1 056) (37 031)
The carrying amount of network infrastructure and equipment includes R1 446 million (2015: R1 327 million) in relation to assets held under finance leases (Note 18).
The Group’s South African operations pledged certain of its property, plant and equipment with a carrying amount of R1 446 million (2015: R1 327 million) as security against borrowings with a fair value of R1 423 million (2015: R1 322 million) (Note 18). The respective pledges are limited to the carrying amount of the borrowings.
Included in the carrying amount of network infrastructure and equipment and other assets are assets in the course of construction, which are not depreciated, with a cost of R573 million (2015: R748 million) and R79 million (2015: RNil) respectively.
Certain of the Group’s operations received government grants to advance universal access to communications by constructing telecommunication infrastructure. Unfulfilled conditions relate to the completion of the asset.
In the current year, directly attributable staff expenses of R687 million (2015: R646 million) were capitalised.
Vodacom Group Limited Consolidated annual financial statements for the year ended 31 March 2016
46
Notes to the consolidated annual financial continued
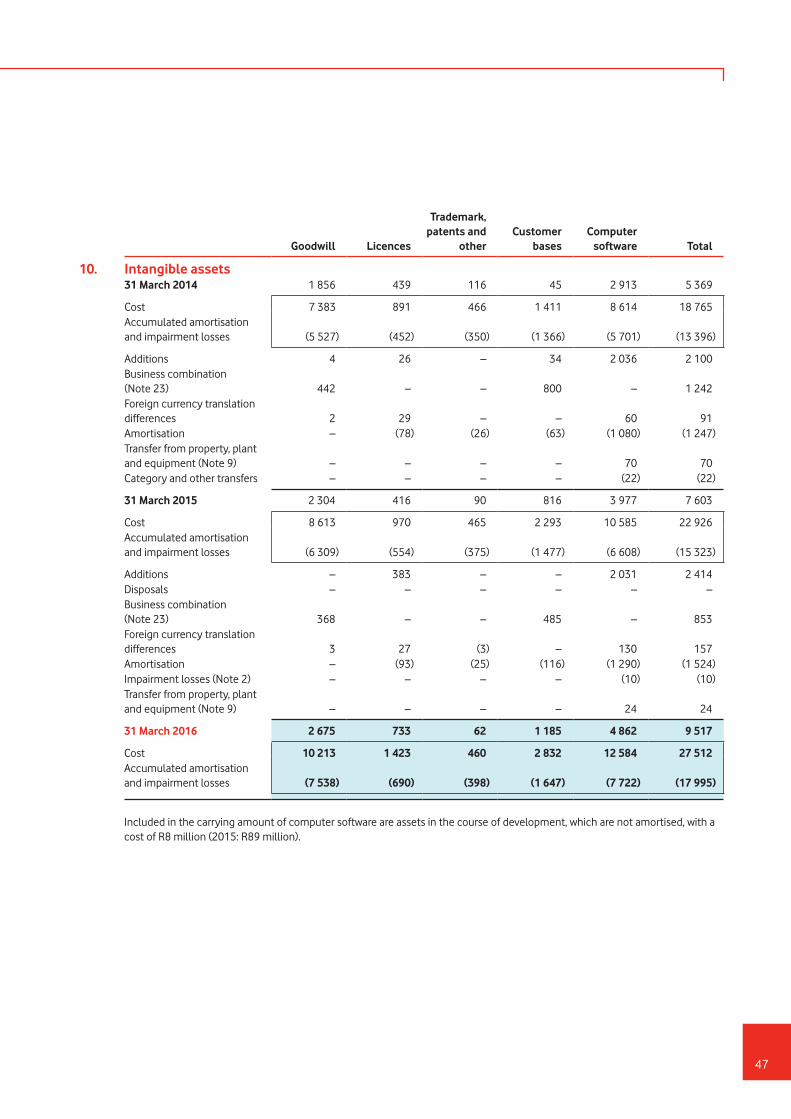
Goodwill Licences
Trademark, patents and
otherCustomer
basesComputer software Total
10. Intangible assets31 March 2014 1 856 439 116 45 2 913 5 369
Cost 7 383 891 466 1 411 8 614 18 765 Accumulated amortisation and impairment losses (5 527) (452) (350) (1 366) (5 701) (13 396)
Additions 4 26 – 34 2 036 2 100 Business combination (Note 23) 442 – – 800 – 1 242 Foreign currency translation differences 2 29 – – 60 91 Amortisation – (78) (26) (63) (1 080) (1 247)Transfer from property, plant and equipment (Note 9) – – – – 70 70 Category and other transfers – – – – (22) (22)
31 March 2015 2 304 416 90 816 3 977 7 603
Cost 8 613 970 465 2 293 10 585 22 926 Accumulated amortisation and impairment losses (6 309) (554) (375) (1 477) (6 608) (15 323)
Additions – 383 – – 2 031 2 414 Disposals – – – – – – Business combination (Note 23) 368 – – 485 – 853 Foreign currency translation differences 3 27 (3) – 130 157 Amortisation – (93) (25) (116) (1 290) (1 524)Impairment losses (Note 2) – – – – (10) (10)Transfer from property, plant and equipment (Note 9) – – – – 24 24
31 March 2016 2 675 733 62 1 185 4 862 9 517
Cost 10 213 1 423 460 2 832 12 584 27 512 Accumulated amortisation and impairment losses (7 538) (690) (398) (1 647) (7 722) (17 995)
Included in the carrying amount of computer software are assets in the course of development, which are not amortised, with a cost of R8 million (2015: R89 million).
47

2016 2015
11. Financial assetsNon-currentLoans receivable (Note 11.1.1) 68 393 Financial assets at fair value through profit or loss (Note 11.2) 173 173 Available-for-sale financial assets (Note 11.3) 39 39
280 605
Current Financial assets at fair value through profit or loss (Note 11.2) 187 73 Cash held in restricted deposits (Note 11.1.2) 2 454 1 943
2 641 2 016
11.1 Financial assets measured at amortised cost11.1.1 Loans receivable
Helios Towers Tanzania Limited – 296 The loan with a nominal value of US$22 million (2015: US$22 million), bears interest at 15.0%, is unsecured and is repayable on 31 December 2019. This loan is associated with non-current assets held for sale. Refer to Note 12.Other loans receivable 68 97
68 393
11.1.2 Cash held in restricted deposits 2 454 1 943
The carrying amount approximates fair value and is mainly represented by cash from M-Pesa activities which is held in accounts with reputable financial institutions.
11.2 Financial assets at fair value through profit or lossUnit trust investments 187 73 Equity linked notes 173 173
360 246
Fair value of unit trust investments are determined with reference to quoted market prices while the fair value of the equity linked notes are determined using valuation models.
11.3 Available-for-sale financial assetsUnlisted equity investments 39 39
The carrying amount of available-for-sale financial assets carried at cost, approximates its fair value. A register with details of the entities and the percentages of share capital and voting power, if different, held in each unlisted investment is available for inspection at the Group’s registered office.
12. Investment in associate As at 31 March 2016, the Group held an 23.78% (2015: 23.45%) equity accounted interest in Helios Towers Tanzania Limited
(‘Helios’), an independent telecommunications tower operator. This holding was acquired as part of a sale and leaseback transaction of Vodacom Tanzania Limited’s telecommunications towers to HTT Infraco Limited (‘HTT’), a subsidiary of Helios.
During the year, the Board approved a plan to exit its investment in Helios through a sale of shares which is expected to be completed within the next financial year. The investment, which was equity accounted, was classified as a non-current asset held for sale, and the associated shareholder’s loan was classified to current assets. Both are presented in the International reportable segment (Note 1). The Group has not recognised any impairment losses in respect of its investment, since the proceeds are expected to exceed the carrying value of the investment and loan receivable. Refer to Note 11 for details of the loan granted to Helios.
Vodacom Group Limited Consolidated annual financial statements for the year ended 31 March 2016
48
Notes to the consolidated annual financial continued
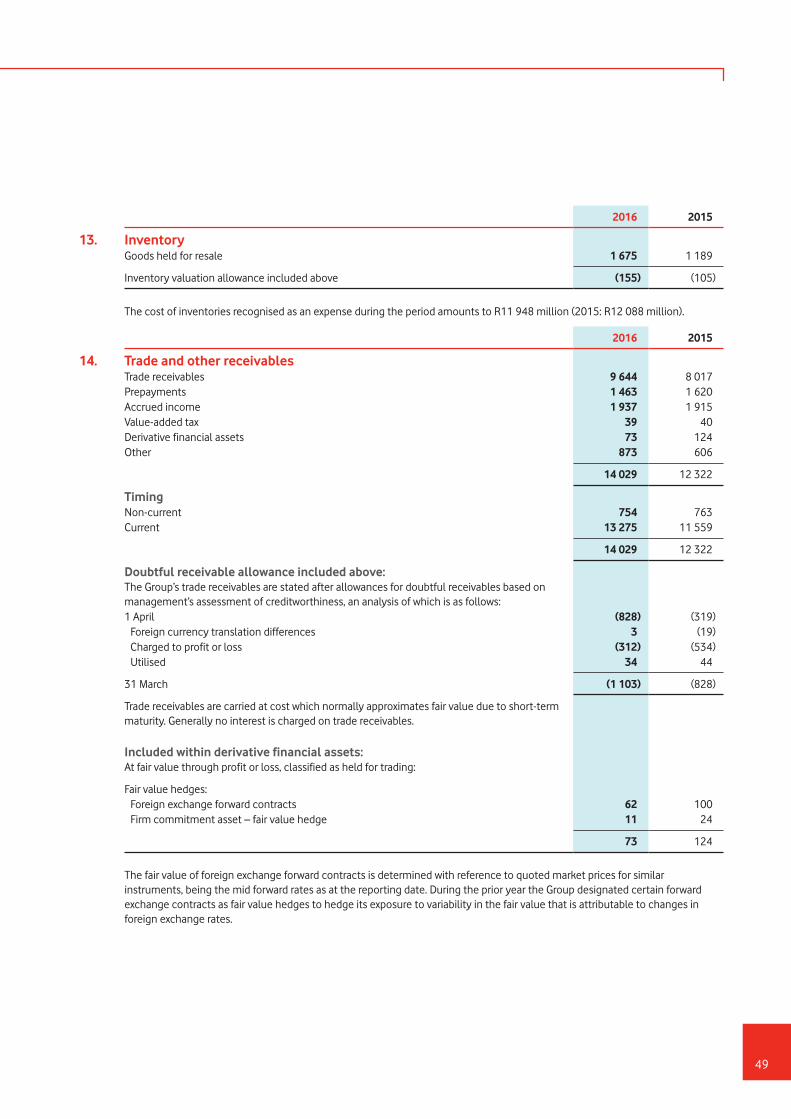
2016 2015
13. InventoryGoods held for resale 1 675 1 189
Inventory valuation allowance included above (155) (105)
The cost of inventories recognised as an expense during the period amounts to R11 948 million (2015: R12 088 million).
2016 2015
14. Trade and other receivablesTrade receivables 9 644 8 017 Prepayments 1 463 1 620 Accrued income 1 937 1 915 Value-added tax 39 40 Derivative financial assets 73 124 Other 873 606
14 029 12 322
TimingNon-current 754 763 Current 13 275 11 559
14 029 12 322
Doubtful receivable allowance included above:The Group’s trade receivables are stated after allowances for doubtful receivables based on management’s assessment of creditworthiness, an analysis of which is as follows:1 April (828) (319) Foreign currency translation differences 3 (19) Charged to profit or loss (312) (534) Utilised 34 44
31 March (1 103) (828)
Trade receivables are carried at cost which normally approximates fair value due to short-term maturity. Generally no interest is charged on trade receivables.
Included within derivative financial assets:At fair value through profit or loss, classified as held for trading:
Fair value hedges: Foreign exchange forward contracts 62 100 Firm commitment asset – fair value hedge 11 24
73 124
The fair value of foreign exchange forward contracts is determined with reference to quoted market prices for similar instruments, being the mid forward rates as at the reporting date. During the prior year the Group designated certain forward exchange contracts as fair value hedges to hedge its exposure to variability in the fair value that is attributable to changes in foreign exchange rates.
49

15. Finance receivables The Group provides financing to customers to acquire equipment at an additional contractual charge.
RmWithin
one year
Between one and
five yearsAfter
five years Total
2016Future minimum payments receivable 1 659 820 – 2 479 Unearned finance income (269) (59) – (328)
Present value of minimum payments receivable 1 390 761 – 2 151
2015Future minimum payments receivable 1 308 743 7 2 058 Unearned finance income (186) (53) (1) (240)
Present value of minimum payments receivable 1 122 690 6 1 818
2016 2015
16. Share capitalAuthorised 4 000 000 000 ordinary shares with no par valueIssuedFully paid share capital 1 487 954 000 ordinary shares with no par value * *Treasury shares 21 306 094 (2015: 21 321 726) ordinary shares with no par value 1 658 1 606
1 658 1 606
Shares 2016 2015
Movements in the number of ordinary shares outstanding:1 April 1 466 632 274 1 466 174 994
Statutory shares in issue 1 487 954 000 1 487 954 000 Treasury shares (21 321 726) (21 779 006)
Repurchase of shares1 (1 767 453) (1 578 018)Forfeited shares sold 522 693 280 516 Vesting of shares 1 260 392 1 754 782
31 March 1 466 647 906 1 466 632 274
Statutory shares in issue 1 487 954 000 1 487 954 000 Treasury shares (21 306 094) (21 321 726)
Treasury shares held by:Vodacom Group Limited 5 884 863 5 900 495 Subsidiaries 15 421 231 15 421 231
21 306 094 21 321 726
The unissued share capital is under the control of the current shareholders and the directors do not have the authority to issue any unissued shares.
Notes * Fully paid share capital of R100. 1. Forfeitable and restricted shares held by employees are treated as treasury shares for accounting in terms of IAS 32: Financial Instruments: Presentation, since
shares awarded under the forfeitable share plan have not fully vested for the purposes of IFRS 2: Share-based Payment until the potential forfeiture period has expired (Note 17).
Vodacom Group Limited Consolidated annual financial statements for the year ended 31 March 2016
50
Notes to the consolidated annual financial continued
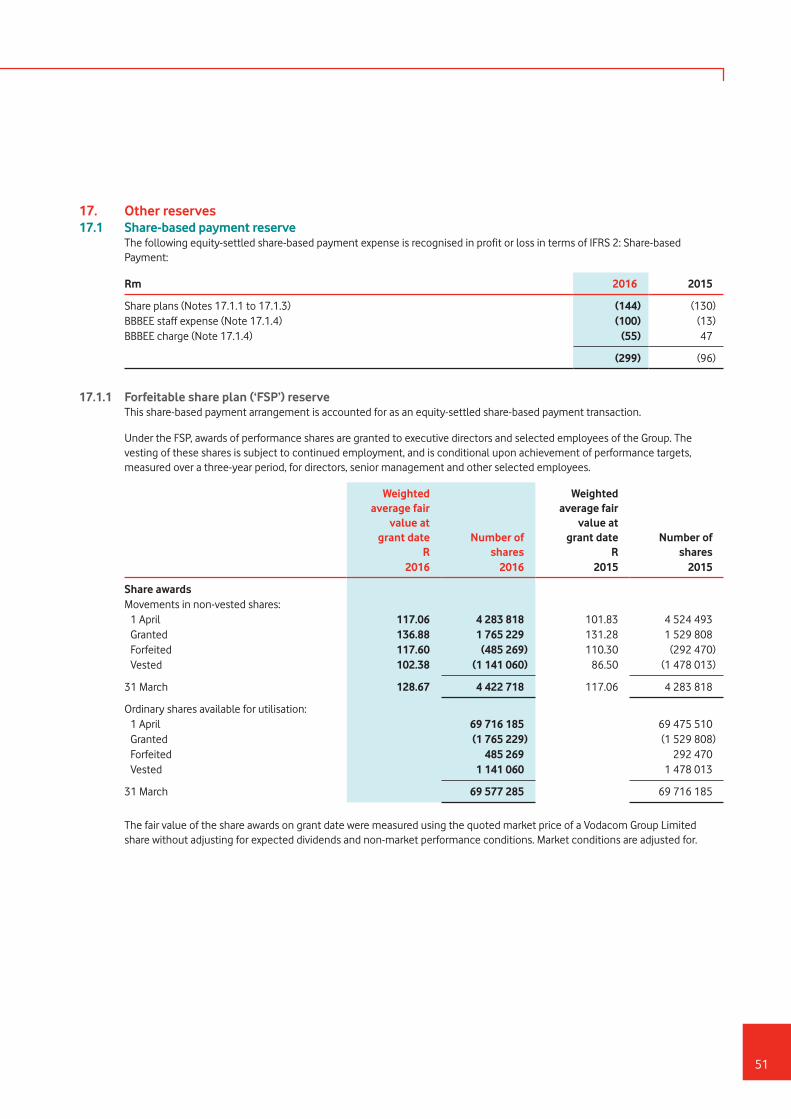
17. Other reserves17.1 Share-based payment reserve The following equity-settled share-based payment expense is recognised in profit or loss in terms of IFRS 2: Share-based
Payment:
Rm 2016 2015
Share plans (Notes 17.1.1 to 17.1.3) (144) (130)BBBEE staff expense (Note 17.1.4) (100) (13)BBBEE charge (Note 17.1.4) (55) 47
(299) (96)
17.1.1 Forfeitable share plan (‘FSP’) reserve This share-based payment arrangement is accounted for as an equity-settled share-based payment transaction.
Under the FSP, awards of performance shares are granted to executive directors and selected employees of the Group. The vesting of these shares is subject to continued employment, and is conditional upon achievement of performance targets, measured over a three-year period, for directors, senior management and other selected employees.
Weighted average fair
value at grant date
R Number of
shares
Weighted average fair
value at grant date
RNumber of
shares2016 2016 2015 2015
Share awardsMovements in non-vested shares: 1 April 117.06 4 283 818 101.83 4 524 493 Granted 136.88 1 765 229 131.28 1 529 808 Forfeited 117.60 (485 269) 110.30 (292 470) Vested 102.38 (1 141 060) 86.50 (1 478 013)
31 March 128.67 4 422 718 117.06 4 283 818
Ordinary shares available for utilisation: 1 April 69 716 185 69 475 510 Granted (1 765 229) (1 529 808) Forfeited 485 269 292 470 Vested 1 141 060 1 478 013
31 March 69 577 285 69 716 185
The fair value of the share awards on grant date were measured using the quoted market price of a Vodacom Group Limited share without adjusting for expected dividends and non-market performance conditions. Market conditions are adjusted for.
51
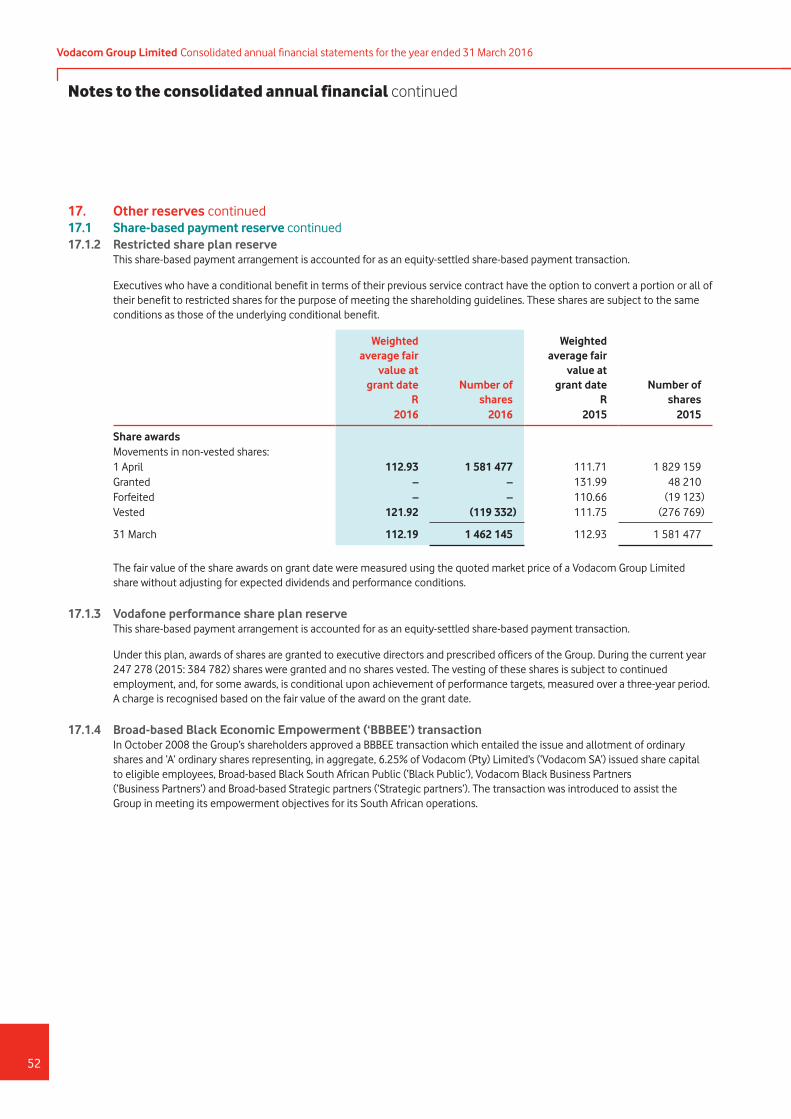
17. Other reserves continued17.1 Share-based payment reserve continued17.1.2 Restricted share plan reserve This share-based payment arrangement is accounted for as an equity-settled share-based payment transaction.
Executives who have a conditional benefit in terms of their previous service contract have the option to convert a portion or all of their benefit to restricted shares for the purpose of meeting the shareholding guidelines. These shares are subject to the same conditions as those of the underlying conditional benefit.
Weighted average fair
value at grant date
R Number of
shares
Weighted average fair
value at grant date
RNumber of
shares2016 2016 2015 2015
Share awardsMovements in non-vested shares:1 April 112.93 1 581 477 111.71 1 829 159 Granted – – 131.99 48 210 Forfeited – – 110.66 (19 123)Vested 121.92 (119 332) 111.75 (276 769)
31 March 112.19 1 462 145 112.93 1 581 477
The fair value of the share awards on grant date were measured using the quoted market price of a Vodacom Group Limited share without adjusting for expected dividends and performance conditions.
17.1.3 Vodafone performance share plan reserve This share-based payment arrangement is accounted for as an equity-settled share-based payment transaction.
Under this plan, awards of shares are granted to executive directors and prescribed officers of the Group. During the current year 247 278 (2015: 384 782) shares were granted and no shares vested. The vesting of these shares is subject to continued employment, and, for some awards, is conditional upon achievement of performance targets, measured over a three-year period. A charge is recognised based on the fair value of the award on the grant date.
17.1.4 Broad-based Black Economic Empowerment (‘BBBEE’) transaction In October 2008 the Group’s shareholders approved a BBBEE transaction which entailed the issue and allotment of ordinary
shares and ‘A’ ordinary shares representing, in aggregate, 6.25% of Vodacom (Pty) Limited’s (‘Vodacom SA’) issued share capital to eligible employees, Broad-based Black South African Public (‘Black Public’), Vodacom Black Business Partners (‘Business Partners’) and Broad-based Strategic partners (‘Strategic partners’). The transaction was introduced to assist the Group in meeting its empowerment objectives for its South African operations.
Vodacom Group Limited Consolidated annual financial statements for the year ended 31 March 2016
52
Notes to the consolidated annual financial continued

17. Other reserves continued17.1 Share-based payment reserve continued17.1.4 Broad-based Black Economic Empowerment (‘BBBEE’) transaction continued
Components of the transaction Notes
Percentage allocated
%
Transaction value
Rm
Cash received
Rm
Employees: YeboYethu Employee Participation Trust (‘the Trust’) 17.1.4.1 1.56 1 875 – Black Public and Business Partners: YeboYethu Limited 17.1.4.3 1.88 2 250 360 Strategic Partner: Royal Bafokeng Holdings (Pty) Limited 17.1.4.4 1.97 2 366 378 Strategic Partner: Thebe Investment Corporation (Pty) Limited 17.1.4.4 0.84 1 009 162
6.25 7 500 900
Rm 2016 2015
Summary of the financial impact of share based payment arrangements
Cash-settled share based payment liability Employees (Refer Note 17.1.4.1) (103) (59) Innovator Trust (Refer Note 17.1.4.6) (234) (232)
(337) (291)
Equity-settled share based payment reserve Employees (Refer Note 17.1.4.1) (66) (17) Black Public and Business Partners (Refer Note 17.1.4.3) (622) (622) Strategic Partners (Refer Note 17.1.4.4) (923) (923) Storage Technologies Services (Pty) Limited (Refer Note 17.1.4.8) (32) –
(1 643) (1 562)
53

17. Other reserves continued17.1 Share-based payment reserve continued17.1.4 Broad-based Black Economic Empowerment (‘BBBEE’) transaction continued 17.1.4.1 Employees An employee ownership trust1 (‘the Trust’), was established for the benefit of all eligible employees. The Trust holds ‘A’ ordinary
shares in Vodacom SA through its interest in YeboYethu Limited. The ‘A’ ordinary shares are a separate class of shares in Vodacom SA, ranking pari passu with the ordinary shares except that they do not entitle the holder to dividends in cash until a notional loan is repaid.
Employees participated in the transaction by being allocated units in the Trust based on a varying percentage of their guaranteed total cost of employment per annum taking into account their employment level and racial and gender classification.
As at 31 March 2016, all units were allocated and are 100.0% vested. The total forfeited units available as at 31 August 2015 (18.96%) were allocated effective 14 March 2016 with a grant date of 14 March 2016 to employees in proportion to the number of units held on this date.
The cash-settled share based payment liability as at 31 March 2016 is R103 million (2015: R59 million) and the equity-settled share based payment reserve as at 31 March 2016 is R66 million (2015: R17 million).
Note: 1. Consolidated by the Group as a structured entity in terms of IFRS 10: Consolidated Financial Statements, as issued by the IASB.
17.1.4.2 Share rights2016 2015
Movements in non-vested share rights: 1 April 286 012 319 285 782 839 Granted 13 987 681 535 560 Forfeited – (306 080)
31 March 300 000 000 286 012 319
Vesting period of share rights granted: Vested 300 000 000 284 814 468 Within one year – 1 197 851
300 000 000 286 012 319
No share rights are currently exercisable through the notional funding mechanism. Since the funded portion of the fair value is repaid through notional dividends on the ‘A’ ordinary shares issued, the exercise price at the date the share rights become exercisable can vary depending to what extent the notional amounts outstanding have been recouped.
Vodacom Group Limited Consolidated annual financial statements for the year ended 31 March 2016
54
Notes to the consolidated annual financial continued
17. Other reserves continued17.1 Share-based payment reserve continued17.1.4 Broad-based Black Economic Empowerment (‘BBBEE’) transaction continued 17.1.4.3 Black Public and Business Partners The Black Public and Business Partners hold ordinary and ‘A’ ordinary shares in Vodacom SA through YeboYethu Limited1. For the
first five years the Black Public and Business Partners will not be entitled to sell their ordinary and ‘A’ ordinary shares in Vodacom SA. After the fifth anniversary until the expiry of the 10 year lock-in period they will be entitled to sell or transfer these shares to approved BBBEE parties. After the expiry of the 10 year lock-in period the Black Public and Business Partners will be entitled to freely trade the ordinary and ‘A’ ordinary shares. The over-the-counter (‘OTC’) trading commenced on 3 February 2014. The equity-settled share based payment reserve remained unchanged.
Note: 1. Consolidated by the Group as a structured entity in terms of IFRS 10: Consolidated Financial Statements, as issued by the IASB.
17.1.4.4 Strategic Partners: Royal Bafokeng Holdings (Pty) Limited and Thebe Investment Corporation (Pty) Limited The two Strategic Partners respectively hold ordinary and ‘A’ ordinary shares in Vodacom SA through two wholly-owned
ring-fenced private companies named Lisinfo 209 Investments (Pty) Limited¹ and Main Street 661 (Pty) Limited¹.
The Strategic Partners will not be able to trade their shares during the first seven years of the 10 year lock-in period. After the seventh anniversary and until the expiry of the lock-in period, the Strategic Partners will be entitled to trade their shares subject to Vodacom SA having a first pre-emptive right to repurchase, and other Strategic Partners, if introduced with Vodacom SA’s approval, having a second ranking pre-emptive right to purchase the shares. If none of the parties exercise their right, the Strategic Partners will be entitled to sell their shares to any other party with a similar or higher BBBEE rating than themselves, subject to Vodacom SA approval. After the expiry of the 10 year lock-in period the Strategic Partners will be entitled to freely trade their shares. The equity-settled share based payment reserve remained unchanged.
Note: 1. Consolidated by the Group as a structured entity in terms of IFRS 10: Consolidated Financial Statements, as issued by the IASB.
17.1.4.5 Funding The difference between the value of the shares allocated and the proceeds received was funded by Vodacom SA on a notional
funding basis. Initially the loan carried a notional interest rate of 9.8%, representing a nominal annual rate compounded daily (‘NACD’) with a maturity date of 30 September 2015. In October 2014, the interest rate on the loan was amended to 8.0% NACD and the maturity date was extended to 30 September 2018.
The BBBEE participants receive a notional dividend on the ‘A’ ordinary shares, which is used as a notional payment against the notional loan. If the notional loan has not been fully repaid by the notional dividends, Vodacom SA has the right to repurchase a variable number of shares from the BBBEE participants at par value. The variable number of shares will be calculated based on a specified formula which takes into account the outstanding balance of the notional loan and the underlying value of the shares held in Vodacom SA. This repurchase feature is a mechanism to redeem any outstanding notional loan balances and therefore results in an in-substance option in terms of IFRS 2, to issue a variable number of shares to the BBBEE participants in the future. Since there is no obligation on Vodacom SA to repurchase any shares, it does not render the share-based payment to be cash-settled, nor does it impact the vesting rights.
The notional funding closing balance for employees amounted to R1 620 million (2015: R1 669 million), for Black Public and Business Partners R1 385 million (2015: R1 470 million) and for Strategic Partners R2 077 million (2015: R2 205 million).
To compensate current employees and employees previously employed (collectively employees) for the reduced liquidity as a result of the extension of the notional loan maturity date to 30 September 2018, the Group provided employees with the option to subscribe for an interest free loan, repayable 1 March 2019.
55

17. Other reserves continued17.1 Share-based payment reserve continued17.1.4 Broad-based Black Economic Empowerment (‘BBBEE’) transaction continued 17.1.4.6 Innovator trust1
During the 2015 financial year, the Innovator Trust, a consolidated structured entity1, acquired shares from the existing BBBEE shareholders through the OTC trading platform of YeboYethu. The objectives of the Innovator Trust include facilitating enterprise development.
The ability of the Innovator Trust to purchase YeboYethu shares provides the Group with a choice of settlement to the BBBEE shareholders, for up to 34.0% of the YeboYethu shares. The Group can either settle the award in YeboYethu shares or repurchase the equity instruments and thereby settle the transaction in cash. With the first purchase of YeboYethu shares by the Innovator Trust in the prior year, the Group created a past practice of settling the awards in cash and recognised its present obligation to settle in cash as a deduction from equity.
The cash-settled share based payment liability as at 31 March 2016 is R234 million (2015: R232 million).
Note: 1. Consolidated by the Group as a structured entity in terms of IFRS 10: Consolidated Financial Statements, as issued by the IASB.
17.1.4.7 BBBEE valuation Equity-settled share based payment transaction BBBEE credentials are not separable and cannot be valued other than by reference to the fair value of the equity instruments
granted. The share-based payment expense was calculated using the Monte-Carlo option pricing model, which is reflective of the underlying characteristics of the BBBEE transaction, using the following assumptions at grant dates for the grants made during the 2015 and 2016 financial year:
2016 2015
Risk-free rate (%)1 6.8 – 7.9 5.5 – 7.1Expected volatility (%)2 22.7 22.0Vesting period (years) – 1.0Contractual life (years) 2.5 1.0Original grant valuation (Rm) 102 102Final grant fair value (Rm) 69 –
Notes: 1. Determined from the South African swap curve. 2. Determined using historical share prices of Vodacom Group Limited.
Vodacom Group Limited Consolidated annual financial statements for the year ended 31 March 2016
56
Notes to the consolidated annual financial continued
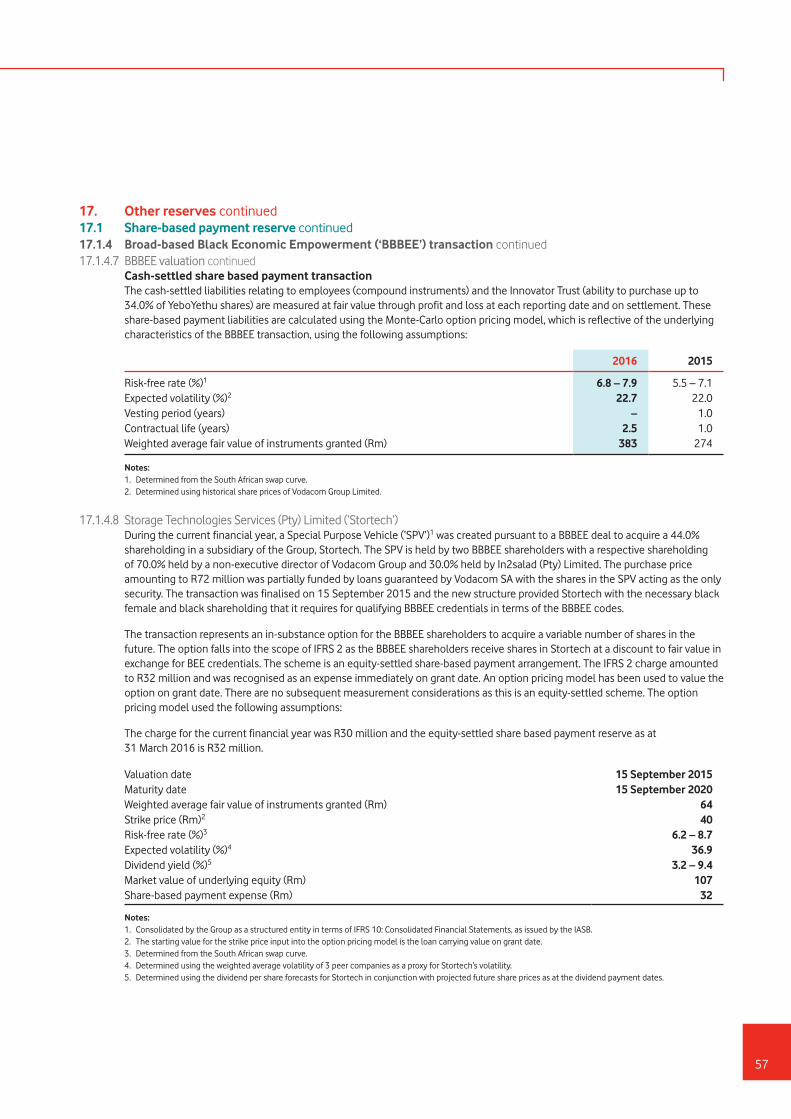
17. Other reserves continued17.1 Share-based payment reserve continued17.1.4 Broad-based Black Economic Empowerment (‘BBBEE’) transaction continued 17.1.4.7 BBBEE valuation continued Cash-settled share based payment transaction The cash-settled liabilities relating to employees (compound instruments) and the Innovator Trust (ability to purchase up to
34.0% of YeboYethu shares) are measured at fair value through profit and loss at each reporting date and on settlement. These share-based payment liabilities are calculated using the Monte-Carlo option pricing model, which is reflective of the underlying characteristics of the BBBEE transaction, using the following assumptions:
2016 2015
Risk-free rate (%)1 6.8 – 7.9 5.5 – 7.1Expected volatility (%)2 22.7 22.0Vesting period (years) – 1.0Contractual life (years) 2.5 1.0Weighted average fair value of instruments granted (Rm) 383 274
Notes: 1. Determined from the South African swap curve. 2. Determined using historical share prices of Vodacom Group Limited.
17.1.4.8 Storage Technologies Services (Pty) Limited (‘Stortech’) During the current financial year, a Special Purpose Vehicle (‘SPV’)1 was created pursuant to a BBBEE deal to acquire a 44.0%
shareholding in a subsidiary of the Group, Stortech. The SPV is held by two BBBEE shareholders with a respective shareholding of 70.0% held by a non-executive director of Vodacom Group and 30.0% held by In2salad (Pty) Limited. The purchase price amounting to R72 million was partially funded by loans guaranteed by Vodacom SA with the shares in the SPV acting as the only security. The transaction was finalised on 15 September 2015 and the new structure provided Stortech with the necessary black female and black shareholding that it requires for qualifying BBBEE credentials in terms of the BBBEE codes.
The transaction represents an in-substance option for the BBBEE shareholders to acquire a variable number of shares in the future. The option falls into the scope of IFRS 2 as the BBBEE shareholders receive shares in Stortech at a discount to fair value in exchange for BEE credentials. The scheme is an equity-settled share-based payment arrangement. The IFRS 2 charge amounted to R32 million and was recognised as an expense immediately on grant date. An option pricing model has been used to value the option on grant date. There are no subsequent measurement considerations as this is an equity-settled scheme. The option pricing model used the following assumptions:
The charge for the current financial year was R30 million and the equity-settled share based payment reserve as at 31 March 2016 is R32 million.
Valuation date 15 September 2015Maturity date 15 September 2020Weighted average fair value of instruments granted (Rm) 64 Strike price (Rm)2 40 Risk-free rate (%)3 6.2 – 8.7Expected volatility (%)4 36.9 Dividend yield (%)5 3.2 – 9.4Market value of underlying equity (Rm) 107 Share-based payment expense (Rm) 32
Notes: 1. Consolidated by the Group as a structured entity in terms of IFRS 10: Consolidated Financial Statements, as issued by the IASB. 2. The starting value for the strike price input into the option pricing model is the loan carrying value on grant date. 3. Determined from the South African swap curve. 4. Determined using the weighted average volatility of 3 peer companies as a proxy for Stortech’s volatility. 5. Determined using the dividend per share forecasts for Stortech in conjunction with projected future share prices as at the dividend payment dates.
57
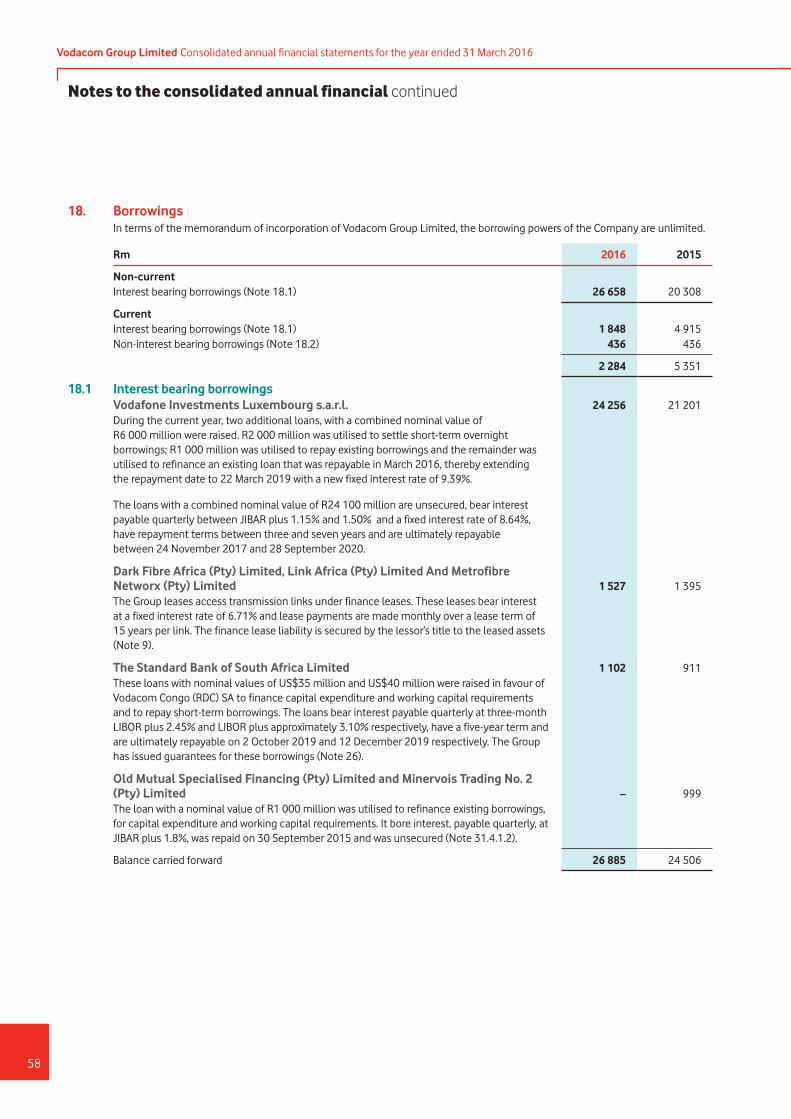
18. Borrowings In terms of the memorandum of incorporation of Vodacom Group Limited, the borrowing powers of the Company are unlimited.
Rm 2016 2015
Non-currentInterest bearing borrowings (Note 18.1) 26 658 20 308
CurrentInterest bearing borrowings (Note 18.1) 1 848 4 915 Non-interest bearing borrowings (Note 18.2) 436 436
2 284 5 351
18.1 Interest bearing borrowingsVodafone Investments Luxembourg s.a.r.l. 24 256 21 201 During the current year, two additional loans, with a combined nominal value of R6 000 million were raised. R2 000 million was utilised to settle short-term overnight borrowings; R1 000 million was utilised to repay existing borrowings and the remainder was utilised to refinance an existing loan that was repayable in March 2016, thereby extending the repayment date to 22 March 2019 with a new fixed interest rate of 9.39%.
The loans with a combined nominal value of R24 100 million are unsecured, bear interest payable quarterly between JIBAR plus 1.15% and 1.50% and a fixed interest rate of 8.64%, have repayment terms between three and seven years and are ultimately repayable between 24 November 2017 and 28 September 2020.
Dark Fibre Africa (Pty) Limited, Link Africa (Pty) Limited And Metrofibre Networx (Pty) Limited 1 527 1 395 The Group leases access transmission links under finance leases. These leases bear interest at a fixed interest rate of 6.71% and lease payments are made monthly over a lease term of 15 years per link. The finance lease liability is secured by the lessor’s title to the leased assets (Note 9).
The Standard Bank of South Africa Limited 1 102 911 These loans with nominal values of US$35 million and US$40 million were raised in favour of Vodacom Congo (RDC) SA to finance capital expenditure and working capital requirements and to repay short-term borrowings. The loans bear interest payable quarterly at three-month LIBOR plus 2.45% and LIBOR plus approximately 3.10% respectively, have a five-year term and are ultimately repayable on 2 October 2019 and 12 December 2019 respectively. The Group has issued guarantees for these borrowings (Note 26).
Old Mutual Specialised Financing (Pty) Limited and Minervois Trading No. 2 (Pty) Limited – 999 The loan with a nominal value of R1 000 million was utilised to refinance existing borrowings, for capital expenditure and working capital requirements. It bore interest, payable quarterly, at JIBAR plus 1.8%, was repaid on 30 September 2015 and was unsecured (Note 31.4.1.2).
Balance carried forward 26 885 24 506
Vodacom Group Limited Consolidated annual financial statements for the year ended 31 March 2016
58
Notes to the consolidated annual financial continued
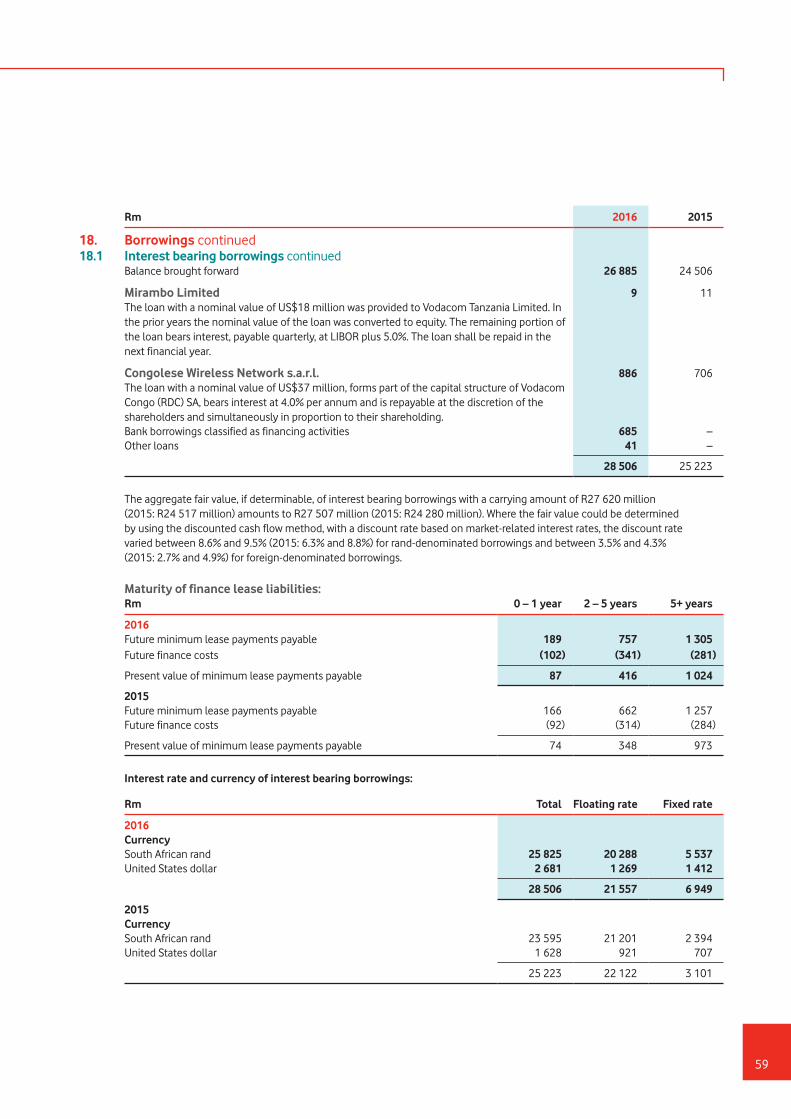
Rm 2016 2015
18. Borrowings continued18.1 Interest bearing borrowings continued
Balance brought forward 26 885 24 506
Mirambo Limited 9 11 The loan with a nominal value of US$18 million was provided to Vodacom Tanzania Limited. In the prior years the nominal value of the loan was converted to equity. The remaining portion of the loan bears interest, payable quarterly, at LIBOR plus 5.0%. The loan shall be repaid in the next financial year.
Congolese Wireless Network s.a.r.l. 886 706 The loan with a nominal value of US$37 million, forms part of the capital structure of Vodacom Congo (RDC) SA, bears interest at 4.0% per annum and is repayable at the discretion of the shareholders and simultaneously in proportion to their shareholding.Bank borrowings classified as financing activities 685 – Other loans 41 –
28 506 25 223
The aggregate fair value, if determinable, of interest bearing borrowings with a carrying amount of R27 620 million (2015: R24 517 million) amounts to R27 507 million (2015: R24 280 million). Where the fair value could be determined by using the discounted cash flow method, with a discount rate based on market-related interest rates, the discount rate varied between 8.6% and 9.5% (2015: 6.3% and 8.8%) for rand-denominated borrowings and between 3.5% and 4.3% (2015: 2.7% and 4.9%) for foreign-denominated borrowings.
Maturity of finance lease liabilities:Rm 0 – 1 year 2 – 5 years 5+ years
2016Future minimum lease payments payable 189 757 1 305 Future finance costs (102) (341) (281)
Present value of minimum lease payments payable 87 416 1 024
2015Future minimum lease payments payable 166 662 1 257 Future finance costs (92) (314) (284)
Present value of minimum lease payments payable 74 348 973
Interest rate and currency of interest bearing borrowings:
Rm Total Floating rate Fixed rate
2016CurrencySouth African rand 25 825 20 288 5 537 United States dollar 2 681 1 269 1 412
28 506 21 557 6 949
2015CurrencySouth African rand 23 595 21 201 2 394 United States dollar 1 628 921 707
25 223 22 122 3 101
59

Rm 2016 2015
18. Borrowings continued18.2 Non-interest bearing borrowings
Royal Bafokeng Holdings (Pty) Limited 436 436
436 436
Due to the absence of repayment dates, fair value is not determinable.
19. Trade and other payablesTrade payables 9 335 7 918 Capital expenditure creditors 3 963 4 088 Value added tax 1 268 1 175 Accruals 4 883 3 962 Deferred revenue 3 306 3 332 Derivative financial liabilities 169 95 Other 736 778
23 660 21 348
Timing Non-current 815 759 Current 22 845 20 589
23 660 21 348
Trade payables are carried at cost which normally approximates fair value due to short-term maturity.
Included within derivative financial liabilities:Cash flow hedges: Interest rate swaps – 6 Fair value hedges: Foreign exchange forward contracts 132 43 Firm commitment liability – fair value hedge 37 46
169 95
The fair value of foreign exchange forward contracts is determined with reference to quoted market prices for similar instruments, being the mid forward rates as at the reporting dates. During the prior year the Group designated certain foreign exchange forward contracts as fair value hedges to hedge its exposure to variability in the fair value that is attributable to changes in foreign exchange rates.
Vodacom Group Limited Consolidated annual financial statements for the year ended 31 March 2016
60
Notes to the consolidated annual financial continued
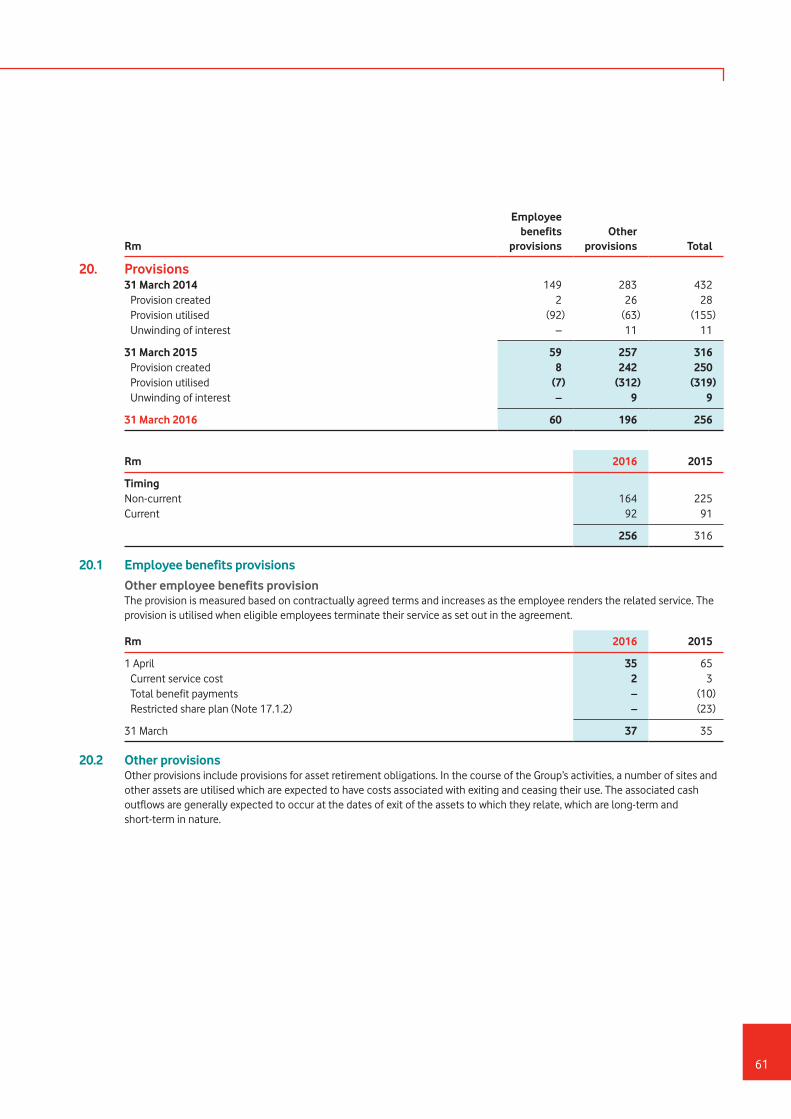
Rm
Employee benefits
provisionsOther
provisions Total
20. Provisions31 March 2014 149 283 432 Provision created 2 26 28 Provision utilised (92) (63) (155) Unwinding of interest – 11 11
31 March 2015 59 257 316 Provision created 8 242 250 Provision utilised (7) (312) (319) Unwinding of interest – 9 9
31 March 2016 60 196 256
Rm 2016 2015
TimingNon-current 164 225 Current 92 91
256 316
20.1 Employee benefits provisions
Other employee benefits provision The provision is measured based on contractually agreed terms and increases as the employee renders the related service. The
provision is utilised when eligible employees terminate their service as set out in the agreement.
Rm 2016 2015
1 April 35 65 Current service cost 2 3 Total benefit payments – (10) Restricted share plan (Note 17.1.2) – (23)
31 March 37 35
20.2 Other provisions Other provisions include provisions for asset retirement obligations. In the course of the Group’s activities, a number of sites and
other assets are utilised which are expected to have costs associated with exiting and ceasing their use. The associated cash outflows are generally expected to occur at the dates of exit of the assets to which they relate, which are long-term and short-term in nature.
61
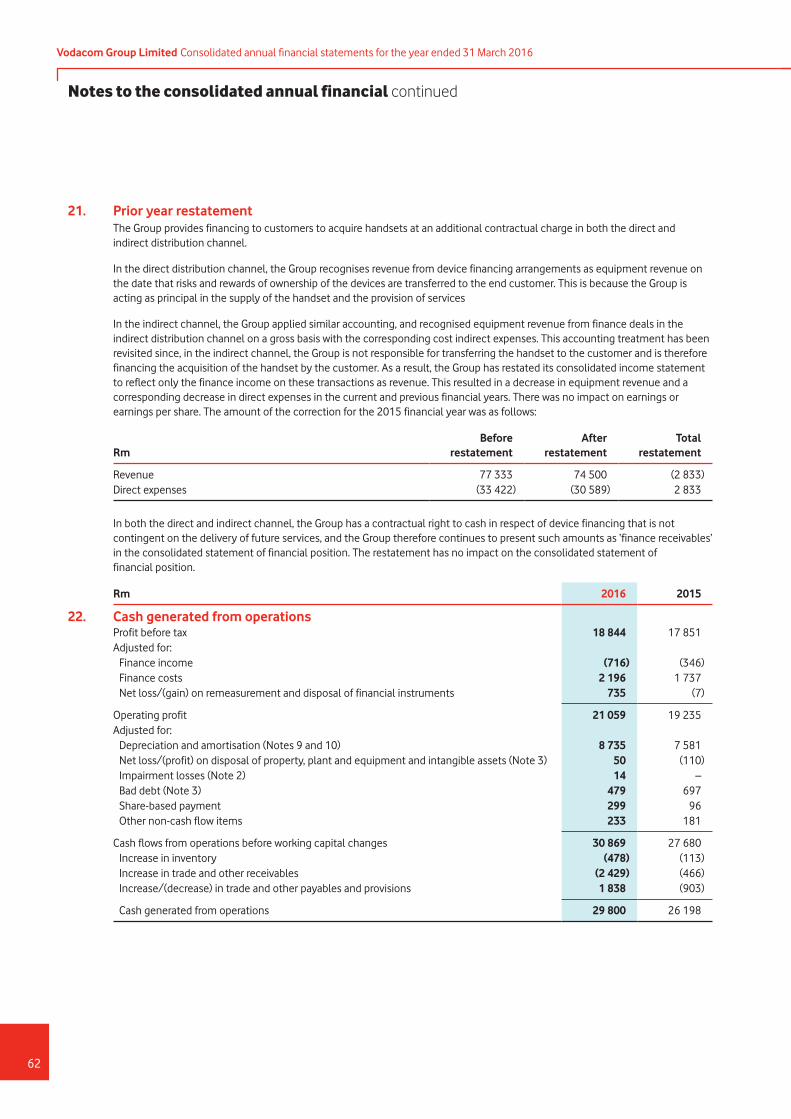
21. Prior year restatement The Group provides financing to customers to acquire handsets at an additional contractual charge in both the direct and
indirect distribution channel.
In the direct distribution channel, the Group recognises revenue from device financing arrangements as equipment revenue on the date that risks and rewards of ownership of the devices are transferred to the end customer. This is because the Group is acting as principal in the supply of the handset and the provision of services
In the indirect channel, the Group applied similar accounting, and recognised equipment revenue from finance deals in the indirect distribution channel on a gross basis with the corresponding cost indirect expenses. This accounting treatment has been revisited since, in the indirect channel, the Group is not responsible for transferring the handset to the customer and is therefore financing the acquisition of the handset by the customer. As a result, the Group has restated its consolidated income statement to reflect only the finance income on these transactions as revenue. This resulted in a decrease in equipment revenue and a corresponding decrease in direct expenses in the current and previous financial years. There was no impact on earnings or earnings per share. The amount of the correction for the 2015 financial year was as follows:
RmBefore
restatementAfter
restatementTotal
restatement
Revenue 77 333 74 500 (2 833)Direct expenses (33 422) (30 589) 2 833
In both the direct and indirect channel, the Group has a contractual right to cash in respect of device financing that is not contingent on the delivery of future services, and the Group therefore continues to present such amounts as ‘finance receivables’ in the consolidated statement of financial position. The restatement has no impact on the consolidated statement of financial position.
Rm 2016 2015
22. Cash generated from operationsProfit before tax 18 844 17 851 Adjusted for: Finance income (716) (346) Finance costs 2 196 1 737 Net loss/(gain) on remeasurement and disposal of financial instruments 735 (7)
Operating profit 21 059 19 235 Adjusted for: Depreciation and amortisation (Notes 9 and 10) 8 735 7 581 Net loss/(profit) on disposal of property, plant and equipment and intangible assets (Note 3) 50 (110) Impairment losses (Note 2) 14 – Bad debt (Note 3) 479 697 Share-based payment 299 96 Other non-cash flow items 233 181
Cash flows from operations before working capital changes 30 869 27 680 Increase in inventory (478) (113) Increase in trade and other receivables (2 429) (466) Increase/(decrease) in trade and other payables and provisions 1 838 (903)
Cash generated from operations 29 800 26 198
Vodacom Group Limited Consolidated annual financial statements for the year ended 31 March 2016
62
Notes to the consolidated annual financial continued
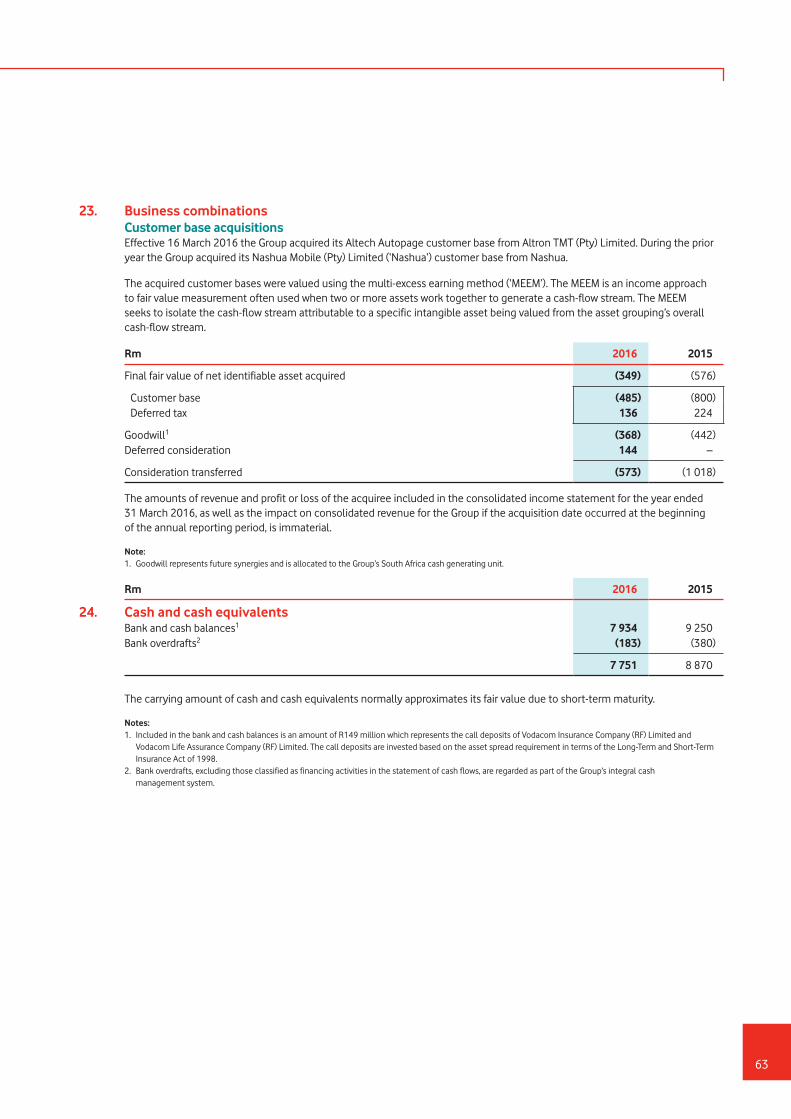
23. Business combinations Customer base acquisitions Effective 16 March 2016 the Group acquired its Altech Autopage customer base from Altron TMT (Pty) Limited. During the prior
year the Group acquired its Nashua Mobile (Pty) Limited (‘Nashua’) customer base from Nashua.
The acquired customer bases were valued using the multi-excess earning method (‘MEEM’). The MEEM is an income approach to fair value measurement often used when two or more assets work together to generate a cash-flow stream. The MEEM seeks to isolate the cash-flow stream attributable to a specific intangible asset being valued from the asset grouping’s overall cash-flow stream.
Rm 2016 2015
Final fair value of net identifiable asset acquired (349) (576)
Customer base (485) (800) Deferred tax 136 224
Goodwill1 (368) (442)Deferred consideration 144 –
Consideration transferred (573) (1 018)
The amounts of revenue and profit or loss of the acquiree included in the consolidated income statement for the year ended 31 March 2016, as well as the impact on consolidated revenue for the Group if the acquisition date occurred at the beginning of the annual reporting period, is immaterial.
Note: 1. Goodwill represents future synergies and is allocated to the Group’s South Africa cash generating unit.
Rm 2016 2015
24. Cash and cash equivalentsBank and cash balances1 7 934 9 250 Bank overdrafts2 (183) (380)
7 751 8 870
The carrying amount of cash and cash equivalents normally approximates its fair value due to short-term maturity.
Notes: 1. Included in the bank and cash balances is an amount of R149 million which represents the call deposits of Vodacom Insurance Company (RF) Limited and
Vodacom Life Assurance Company (RF) Limited. The call deposits are invested based on the asset spread requirement in terms of the Long-Term and Short-Term Insurance Act of 1998.
2. Bank overdrafts, excluding those classified as financing activities in the statement of cash flows, are regarded as part of the Group’s integral cash management system.
63
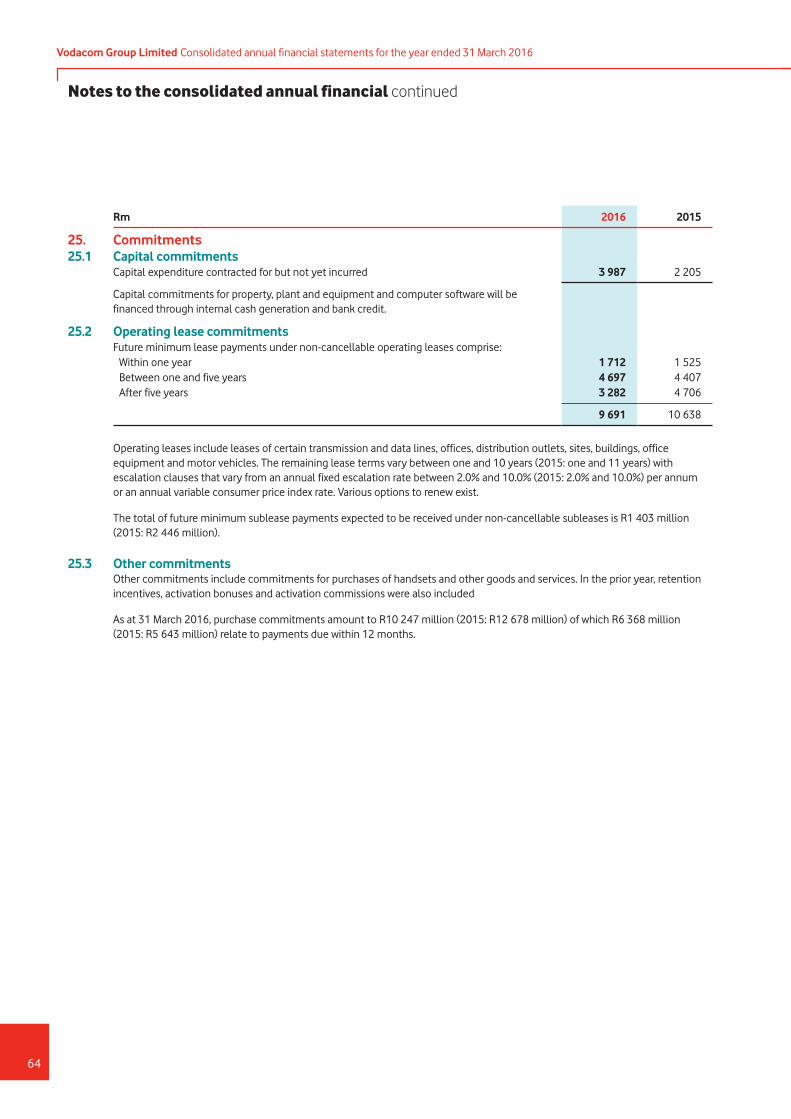
Rm 2016 2015
25. Commitments25.1 Capital commitments
Capital expenditure contracted for but not yet incurred 3 987 2 205
Capital commitments for property, plant and equipment and computer software will be financed through internal cash generation and bank credit.
25.2 Operating lease commitmentsFuture minimum lease payments under non-cancellable operating leases comprise: Within one year 1 712 1 525 Between one and five years 4 697 4 407 After five years 3 282 4 706
9 691 10 638
Operating leases include leases of certain transmission and data lines, offices, distribution outlets, sites, buildings, office equipment and motor vehicles. The remaining lease terms vary between one and 10 years (2015: one and 11 years) with escalation clauses that vary from an annual fixed escalation rate between 2.0% and 10.0% (2015: 2.0% and 10.0%) per annum or an annual variable consumer price index rate. Various options to renew exist.
The total of future minimum sublease payments expected to be received under non-cancellable subleases is R1 403 million (2015: R2 446 million).
25.3 Other commitments Other commitments include commitments for purchases of handsets and other goods and services. In the prior year, retention
incentives, activation bonuses and activation commissions were also included
As at 31 March 2016, purchase commitments amount to R10 247 million (2015: R12 678 million) of which R6 368 million (2015: R5 643 million) relate to payments due within 12 months.
Vodacom Group Limited Consolidated annual financial statements for the year ended 31 March 2016
64
Notes to the consolidated annual financial continued

26. Contingent liabilities and legal proceedings26.1 Unresolved tax matters The Group is regularly subject to an evaluation by tax authorities of its direct and indirect tax filings. The consequence of such
reviews is that disputes can arise with tax authorities over the interpretation or application of certain tax rules applicable to the Group’s business. These disputes may not necessarily be resolved in a manner that is favourable to the Group. Additionally, the resolution of the disputes could result in an obligation to the Group. The Group has made sufficient provision for any losses arising from tax exposures that are more likely to occur than not.
The Group has discussions with relevant tax authorities on specific matters regarding the application and interpretation of tax legislation affecting the Group and the industry in which it operates. All reliable assessments of tax exposure identified have been quantified and accounted for as appropriate.
The Group has considered all matters in dispute with tax authorities and has accounted for any exposure identified, if required.
26.2 Various legal contingencies The Group is currently involved in various legal proceedings and has, in consultation with its legal counsel, assessed the outcome
of these proceedings. Following this assessment, the Group’s management has determined, after assessing recoverability, that adequate provision has been made in respect of these legal proceedings as at 31 March 2016.
26.3 G.H. Investments (‘GHI’) and Vodacom Congo (RDC) SA (‘Vodacom Congo’) Vodacom Congo contracted with GHI to install ultra-low cost base stations on a revenue share basis. After rolling out three sites,
GHI stopped and sought to renegotiate the terms. Vodacom Congo refused. GHI accused it of bad faith and infringement of intellectual property rights. In April 2015, GHI issued a letter of demand claiming payment for a sum of US$1.16 billion, even though there does not seem to be a proper basis nor any substantiation for the compensation claimed. The dispute has been submitted to mediation under the International Chamber of Commerce. A mediator was appointed in September 2015 who convened a first meeting which took place in early November 2015. A follow-up mediation meeting was scheduled for December 2015, but has been postponed without a new date having been fixed.
26.4 Vodacom Congo (RDC) SA and Vodacom International Limited (‘VIL’) There are various legal matters relating to the Group’s investment in Vodacom Congo, the most recent of which is a claim
brought by Mr Alieu Badara Mohamed Conteh (‘Conteh’) in the Commercial Court of Kinshasa/Gombe against VIL and Vodacom Congo. Conteh is the controlling shareholder of Congolese Wireless Network s.a.r.l (‘CWN’), a company incorporated in the DRC. CWN is a minority shareholder in Vodacom Congo. These proceedings seek to invalidate a court decision removing Conteh as the statutory manager of CWN, as well as the liquidation of Vodacom Congo and the payment of various sums to CWN and Conteh. The action also includes an unsubstantiated claim for US$14 billion against VIL for its alleged role in helping to undermine Conteh’s position as former statutory manager of CWN. The Court of Appeal of Kinshasa/Gombe in December 2015 dismissed Conteh’s case against VIL on the grounds of a lack of proper service of legal process.
26.5 Kenneth Makate vs Vodacom (Pty) Limited Refer to Note 28.2.
26.6 Guarantees The Group issued various guarantees, relating to external financial obligations of its subsidiaries, which amounted to
R113 million (2015: R113 million)
Foreign denominated guarantees amounting to R1 102 million (2015: R911 million) were issued in 2015 in support of Vodacom Congo (RDC) SA, relating to liabilities included in the consolidated statement of financial position.
Vodacom (Pty) Limited provides a guarantee for borrowings entered into by Vodacom Group Limited. At 31 March 2016, and in prior years, none of the borrowings under guarantee were utilised.
27. Post-employment benefits The Group operates a number of pension plans for the benefit of all its employees throughout the Group, which vary depending
on the conditions and practices in the countries concerned. The Group’s pension plans are provided through defined contribution schemes. Defined contribution schemes offer employees individual funds that are converted into benefits at the time of retirement. Current contributions to the defined contribution schemes amounted to R258 million (2015: R247 million). South African funds are governed in terms of the Pension Funds Act of 1956. The assets in the funds are held in separate accounts and funds are raised through payments from employees and the Group.
65

28. Events after the reporting period28.1 Dividend declared after the reporting period and not recognised as a liability A final dividend of R5 952 million (400 cents per ordinary share) was declared for the year ended 31 March 2016, payable on
Monday 27 June 2016 to shareholders recorded in the register at the close of business on Friday 24 June 2016. The net dividend after taking into account dividend withholding tax for those shareholders not exempt from dividend withholding tax is 340.00000 cents per share.
28.2 Kenneth Makate (‘Mr Makate’) vs Vodacom (Pty) Limited (‘the Company’) In 2008, Mr Makate instituted legal proceedings to claim compensation for a business idea that led to a product known as
‘Please Call Me’. On 1 July 2014, the South Gauteng High Court, Johannesburg (‘the High Court’) found that Mr Makate had proven the existence of a contract. However, the High Court ruled that the Company was not bound by that contract because the responsible director of product development and services did not have authority to enter into any such agreement on the Company’s behalf. The High Court also rejected Mr Makate’s claim on the basis that it had lapsed in terms of the Prescription Act 68 of 1969.
The High Court and Supreme Court of Appeal (‘the Supreme Court’) turned down Mr Makate’s application for leave to appeal on 11 December 2014 and 2 March 2015, respectively. Mr Makate applied for leave to appeal in the Constitutional Court. On 26 April 2016, after having heard the application on 1 September 2015, the Constitutional Court granted leave to appeal and upheld Mr Makate’s appeal. In doing so, the Constitutional Court ordered that:
À the Company is bound by the agreement concluded between Mr Makate and the then director of product development and services;
À the Company is to commence negotiations in good faith with Mr Makate to determine reasonable compensation; and
À in the event of the parties failing to agree on the reasonable compensation, the matter must be submitted to Vodacom’s Chief Executive Officer for determination of the amount within a reasonable time.
Negotiations between the Company and Mr Makate have commenced, in accordance with the order of the Constitutional Court.
On 1 June 2016, an application was issued in the North Gauteng High Court, Pretoria seeking to interdict Mr Makate from negotiating with the Company to the exclusion of Raining Men Trade (Pty) Limited (‘RMT’). RMT funded Mr Makate’s litigation expenses in relation to this claim. RMT is also asking the North Gauteng High Court to direct the Company not to pay any sum of money to Mr Makate until a pronouncement on the legal validity of the funding agreement between Mr Makate and RMT is made, in separate legal proceedings either before an arbitrator or another High Court. The RMT application will be heard in the North Gauteng High Court on 14 June 2016.
Vodacom Group Limited Consolidated annual financial statements for the year ended 31 March 2016
66
Notes to the consolidated annual financial continued
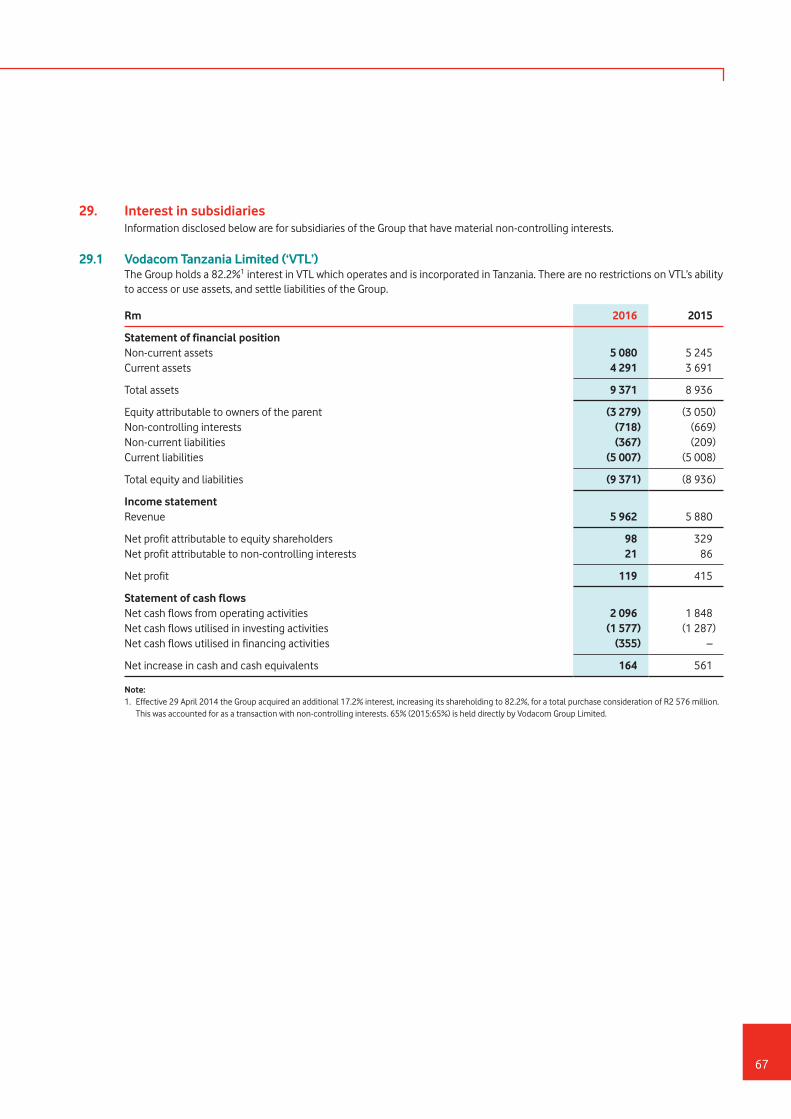
29. Interest in subsidiaries Information disclosed below are for subsidiaries of the Group that have material non-controlling interests.
29.1 Vodacom Tanzania Limited (‘VTL’) The Group holds a 82.2%1 interest in VTL which operates and is incorporated in Tanzania. There are no restrictions on VTL’s ability
to access or use assets, and settle liabilities of the Group.
Rm 2016 2015
Statement of financial positionNon-current assets 5 080 5 245 Current assets 4 291 3 691
Total assets 9 371 8 936
Equity attributable to owners of the parent (3 279) (3 050)Non-controlling interests (718) (669)Non-current liabilities (367) (209)Current liabilities (5 007) (5 008)
Total equity and liabilities (9 371) (8 936)
Income statementRevenue 5 962 5 880
Net profit attributable to equity shareholders 98 329 Net profit attributable to non-controlling interests 21 86
Net profit 119 415
Statement of cash flowsNet cash flows from operating activities 2 096 1 848 Net cash flows utilised in investing activities (1 577) (1 287)Net cash flows utilised in financing activities (355) –
Net increase in cash and cash equivalents 164 561
Note: 1. Effective 29 April 2014 the Group acquired an additional 17.2% interest, increasing its shareholding to 82.2%, for a total purchase consideration of R2 576 million.
This was accounted for as a transaction with non-controlling interests. 65% (2015:65%) is held directly by Vodacom Group Limited.
67
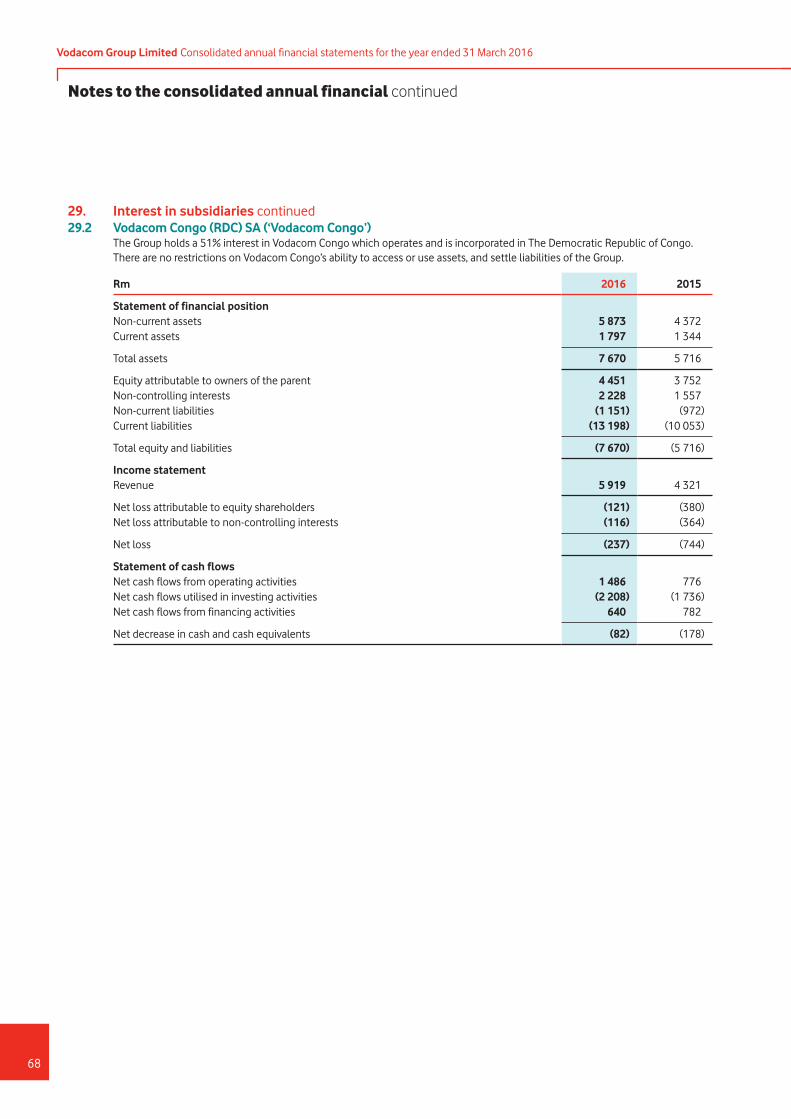
29. Interest in subsidiaries continued29.2 Vodacom Congo (RDC) SA (‘Vodacom Congo’) The Group holds a 51% interest in Vodacom Congo which operates and is incorporated in The Democratic Republic of Congo.
There are no restrictions on Vodacom Congo’s ability to access or use assets, and settle liabilities of the Group.
Rm 2016 2015
Statement of financial positionNon-current assets 5 873 4 372 Current assets 1 797 1 344
Total assets 7 670 5 716
Equity attributable to owners of the parent 4 451 3 752 Non-controlling interests 2 228 1 557 Non-current liabilities (1 151) (972)Current liabilities (13 198) (10 053)
Total equity and liabilities (7 670) (5 716)
Income statementRevenue 5 919 4 321
Net loss attributable to equity shareholders (121) (380)Net loss attributable to non-controlling interests (116) (364)
Net loss (237) (744)
Statement of cash flowsNet cash flows from operating activities 1 486 776 Net cash flows utilised in investing activities (2 208) (1 736)Net cash flows from financing activities 640 782
Net decrease in cash and cash equivalents (82) (178)
Vodacom Group Limited Consolidated annual financial statements for the year ended 31 March 2016
68
Notes to the consolidated annual financial continued
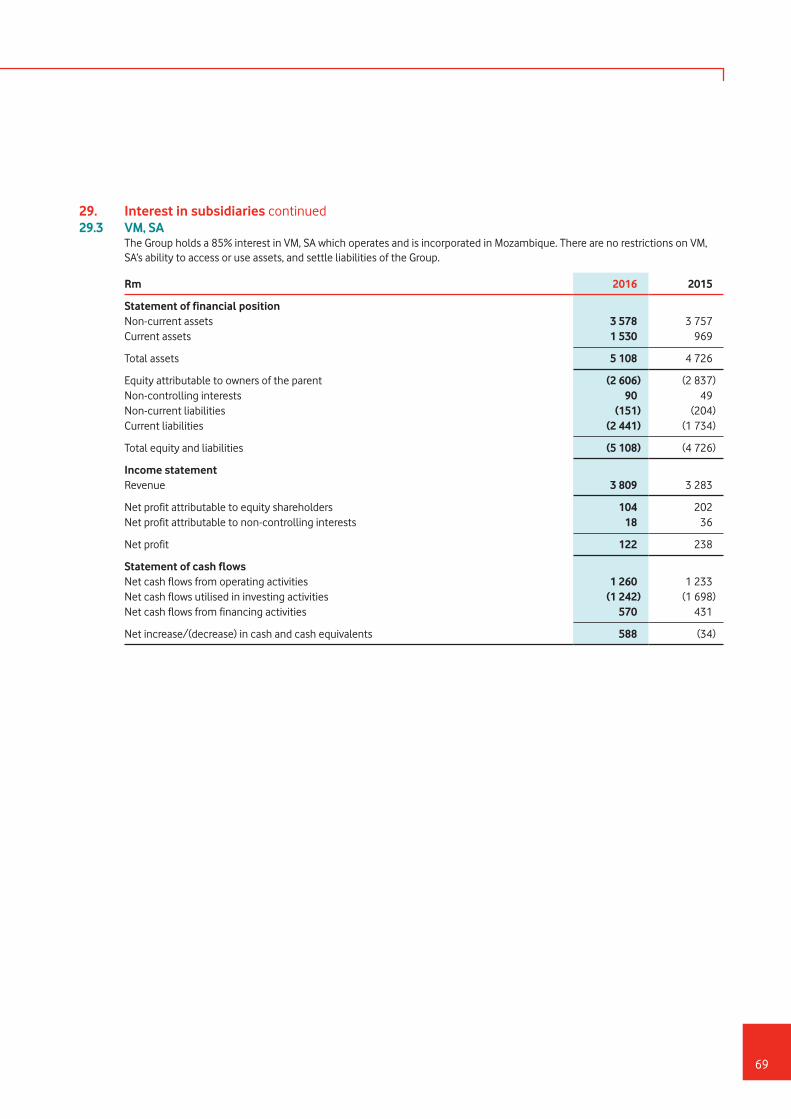
29. Interest in subsidiaries continued29.3 VM, SA The Group holds a 85% interest in VM, SA which operates and is incorporated in Mozambique. There are no restrictions on VM,
SA’s ability to access or use assets, and settle liabilities of the Group.
Rm 2016 2015
Statement of financial positionNon-current assets 3 578 3 757 Current assets 1 530 969
Total assets 5 108 4 726
Equity attributable to owners of the parent (2 606) (2 837)Non-controlling interests 90 49 Non-current liabilities (151) (204)Current liabilities (2 441) (1 734)
Total equity and liabilities (5 108) (4 726)
Income statementRevenue 3 809 3 283
Net profit attributable to equity shareholders 104 202 Net profit attributable to non-controlling interests 18 36
Net profit 122 238
Statement of cash flowsNet cash flows from operating activities 1 260 1 233 Net cash flows utilised in investing activities (1 242) (1 698)Net cash flows from financing activities 570 431
Net increase/(decrease) in cash and cash equivalents 588 (34)
69

29. Interest in subsidiaries continued29.4 Vodacom Lesotho (Pty) Limited (‘Vodacom Lesotho’) The Group holds a 80% interest in Vodacom Lesotho which operates and is incorporated in Lesotho. There are no restrictions on
Vodacom Lesotho’s ability to access or use assets, and settle liabilities of the Group.
Rm 2016 2015
Statement of financial positionNon-current assets 694 580 Current assets 192 211
Total assets 886 791
Equity attributable to owners of the parent (527) (454)Non-controlling interests1 (132) (114)Non-current liabilities (17) (12)Current liabilities (209) (211)
Total equity and liabilities (885) (791)
Income statementRevenue 1 027 849
Net profit attributable to equity shareholders 232 174 Net profit attributable to non-controlling interests 58 44
Net profit 290 218
Statement of cash flowsNet cash flows from operating activities 391 336 Net cash flows utilised in investing activities (234) (194)Net cash flows utilised in financing activities (199) (99)
Net (decrease)/increase in cash and cash equivalents (42) 43
Note: 1. Dividend paid to non-controlling interest amounted to R40 million (2015: R20 million).
30. Related parties The Group’s related parties are its parent, joint venture, associate, pension schemes (Note 27) and key management including
directors (Note 30.3). Further details regarding the related party relationship with a non-executive director of the Group may be found in Note 17.1.4.8.
Rm 2016 2015
30.1 Balances with related partiesAccounts receivable Vodafone Group Plc and subsidiaries 72 50 Other 17 10 Accounts payable Vodafone Group Plc and subsidiaries (833) (1 007) Other 2 (1)
The outstanding balances listed above are unsecured and will be settled in cash in the ordinary course of business. No guarantees or provision for doubtful debts have been recognised.
Borrowings Vodafone Investments Luxembourg s.a.r.l (Note 18) 24 256 21 201
Vodacom Group Limited Consolidated annual financial statements for the year ended 31 March 2016
70
Notes to the consolidated annual financial continued

Rm 2016 2015
30. Related parties continued30.2 Transactions with related parties
Vodafone Group Plc and subsidiaries1 (10 560) (9 912)
Revenue 202 73 Direct expenses (173) (277) Secondment fees (26) (48) Other operating expenses (1 109) (771) Finance costs (1 765) (1 103) Dividends declared (7 689) (7 786)
Other (23) (18)
Revenue 11 7 Direct expenses (5) (5) Other operating expenses (29) (20)
Transactions with entities in which related parties have an interest (23) (20)
Note: 1. An amount of R189 million (2015: R228 million) relating to procurement costs was capitalised during the current year.
Rm 2016 2015
30.3 Key management personnel and directors’ remuneration Key management Short-term employee benefits (22) (74) Post-employment benefits1 (1) (2) Other long-term employee benefits (1) – Share-based payments (5) (13)
Key management’s remuneration incurred by the Group3 (29)5 (89)Key management’s remuneration incurred by Vodafone Group Plc4 (1) (5)
(30) (94)
DirectorsExecutive directors (52) (36)
Short-term employee benefits (35) (22) Post-employment benefits2 (2) (1) Termination benefits – – Share-based payments (15) (13)
Non-executive directors (7) (7)
Directors’ fees (7) (7)
Directors’ remuneration incurred by the Group (59) (43)Directors’ remuneration incurred by Vodafone Group Plc4 (6) (4)
(65) (47)
Note: 1. Included in ‘Post-employment benefits’ is an amount of RNil million (2015:R0.4 million) relating to contributions to provident funds made annually from
bonus allocations. 2. Included in ‘Post-employment benefits’ is an amount of R0.6 million (2015: R0.7 million) relating to contributions to provident funds made annually from
bonus allocations. 3. Includes key management personnel paid by subsidiaries. 4. Includes long-term employee benefits for MS Aziz Joosub: R4 million (2015: R4 million); T Streichert: R2 million (2015: R2 million) and V Mathur: R1 million (2015: RNil).
Also included in the prior year is long-term employee benefits for N Gough of R1 million and PP Kesha Patel of R2 million. 5. Various role changes and the way the Executive Committee functions resulted in changes in the key management personnel of the Group. Further details may be
found in the remuneration report.71
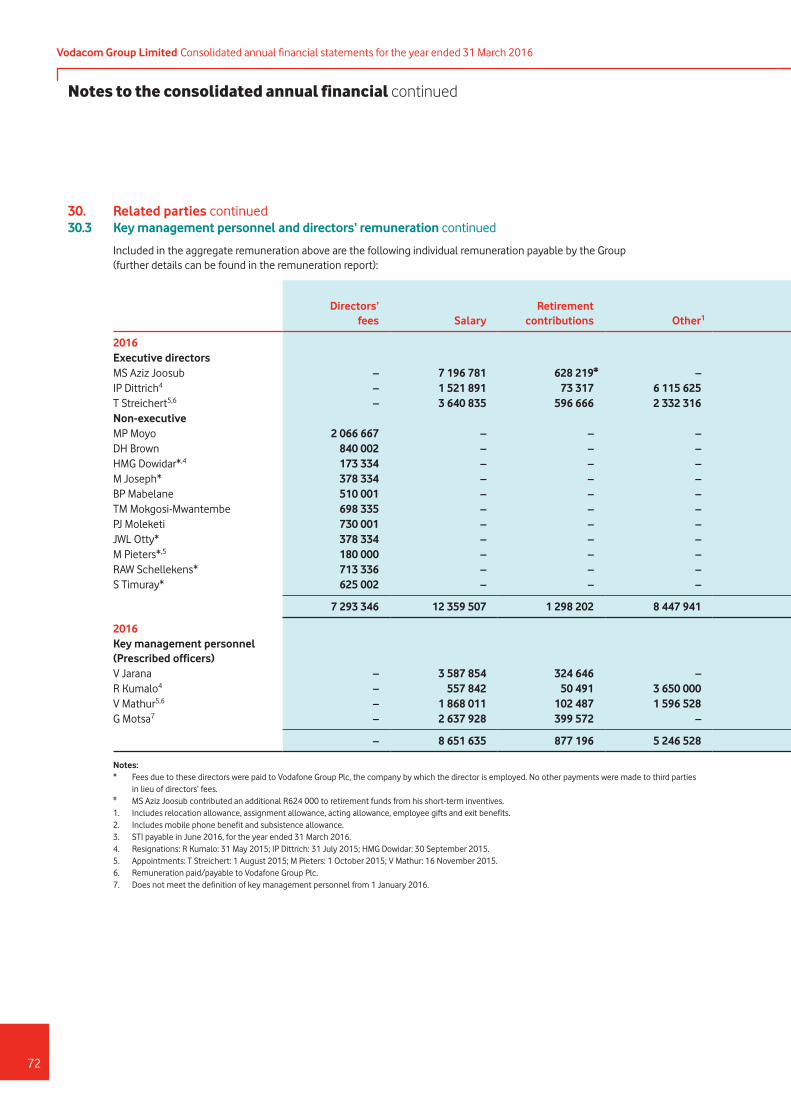
30. Related parties continued30.3 Key management personnel and directors’ remuneration continued
Included in the aggregate remuneration above are the following individual remuneration payable by the Group (further details can be found in the remuneration report):
Directors’ fees Salary
Retirementcontributions Other1
Expenseallowances2
Short-term incentives
(‘STI’)3Remuneration
reportActuals vsprovisions
Long-termincentives and other Total
2016Executive directorsMS Aziz Joosub – 7 196 781 628 219# – 3 600 13 968 000 21 796 600 (1 488 000) 13 727 582 34 036 182 IP Dittrich4 – 1 521 891 73 317 6 115 625 1 600 – 7 712 433 – 1 138 982 8 851 415 T Streichert5,6 – 3 640 835 596 666 2 332 316 5 424 4 098 908 10 674 149 (1 707 542) – 8 966 607 Non-executiveMP Moyo 2 066 667 – – – – – 2 066 667 – – 2 066 667 DH Brown 840 002 – – – – – 840 002 – – 840 002 HMG Dowidar*,4 173 334 – – – – – 173 334 – – 173 334 M Joseph* 378 334 – – – – – 378 334 – – 378 334BP Mabelane 510 001 – – – – – 510 001 – – 510 001 TM Mokgosi-Mwantembe 698 335 – – – – – 698 335 – – 698 335 PJ Moleketi 730 001 – – – – – 730 001 – – 730 001JWL Otty* 378 334 – – – – – 378 334 – – 378 334M Pieters*,5 180 000 – – – – – 180 000 – – 180 000 RAW Schellekens* 713 336 – – – – – 713 336 – – 713 336 S Timuray* 625 002 – – – – – 625 002 – – 625 002
7 293 346 12 359 507 1 298 202 8 447 941 10 624 18 066 908 47 476 528 (3 195 542) 14 866 564 59 147 550
2016Key management personnel (Prescribed officers)V Jarana – 3 587 854 324 646 – 6 180 5 031 480 8 950 160 (839 480) 3 496 805 11 607 485 R Kumalo4 – 557 842 50 491 3 650 000 800 – 4 259 133 – 724 619 4 983 752 V Mathur5,6 – 1 868 011 102 487 1 596 528 – 1 143 844 4 710 870 (1 143 844) – 3 567 026 G Motsa7 – 2 637 928 399 572 – 4 290 – 3 041 790 3 379 800 2 344 565 8 766 155
– 8 651 635 877 196 5 246 528 11 270 6 175 324 20 961 953 1 396 476 6 565 989 28 924 418
Notes: * Fees due to these directors were paid to Vodafone Group Plc, the company by which the director is employed. No other payments were made to third parties
in lieu of directors’ fees. # MS Aziz Joosub contributed an additional R624 000 to retirement funds from his short-term inventives. 1. Includes relocation allowance, assignment allowance, acting allowance, employee gifts and exit benefits. 2. Includes mobile phone benefit and subsistence allowance. 3. STI payable in June 2016, for the year ended 31 March 2016. 4. Resignations: R Kumalo: 31 May 2015; IP Dittrich: 31 July 2015; HMG Dowidar: 30 September 2015. 5. Appointments: T Streichert: 1 August 2015; M Pieters: 1 October 2015; V Mathur: 16 November 2015. 6. Remuneration paid/payable to Vodafone Group Plc. 7. Does not meet the definition of key management personnel from 1 January 2016.
Vodacom Group Limited Consolidated annual financial statements for the year ended 31 March 2016
72
Notes to the consolidated annual financial continued
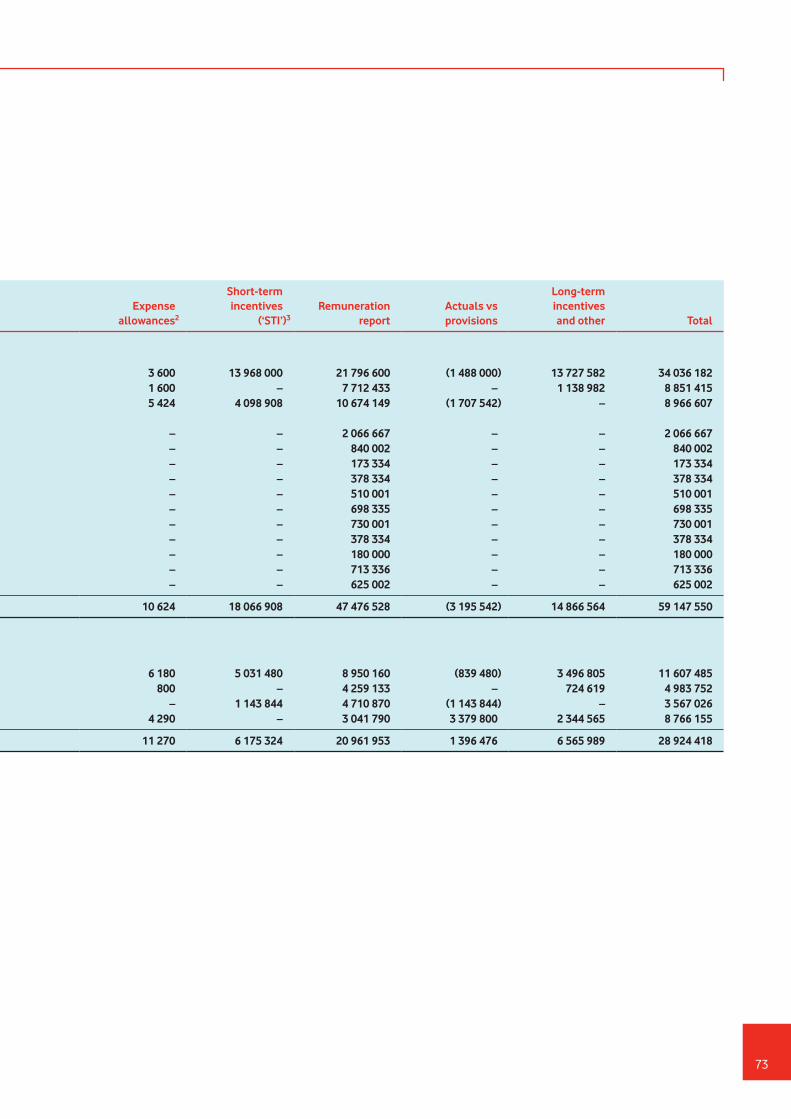
30. Related parties continued30.3 Key management personnel and directors’ remuneration continued
Included in the aggregate remuneration above are the following individual remuneration payable by the Group (further details can be found in the remuneration report):
Directors’ fees Salary
Retirementcontributions Other1
Expenseallowances2
Short-term incentives
(‘STI’)3Remuneration
reportActuals vsprovisions
Long-termincentives and other Total
2016Executive directorsMS Aziz Joosub – 7 196 781 628 219# – 3 600 13 968 000 21 796 600 (1 488 000) 13 727 582 34 036 182 IP Dittrich4 – 1 521 891 73 317 6 115 625 1 600 – 7 712 433 – 1 138 982 8 851 415 T Streichert5,6 – 3 640 835 596 666 2 332 316 5 424 4 098 908 10 674 149 (1 707 542) – 8 966 607 Non-executiveMP Moyo 2 066 667 – – – – – 2 066 667 – – 2 066 667 DH Brown 840 002 – – – – – 840 002 – – 840 002 HMG Dowidar*,4 173 334 – – – – – 173 334 – – 173 334 M Joseph* 378 334 – – – – – 378 334 – – 378 334BP Mabelane 510 001 – – – – – 510 001 – – 510 001 TM Mokgosi-Mwantembe 698 335 – – – – – 698 335 – – 698 335 PJ Moleketi 730 001 – – – – – 730 001 – – 730 001JWL Otty* 378 334 – – – – – 378 334 – – 378 334M Pieters*,5 180 000 – – – – – 180 000 – – 180 000 RAW Schellekens* 713 336 – – – – – 713 336 – – 713 336 S Timuray* 625 002 – – – – – 625 002 – – 625 002
7 293 346 12 359 507 1 298 202 8 447 941 10 624 18 066 908 47 476 528 (3 195 542) 14 866 564 59 147 550
2016Key management personnel (Prescribed officers)V Jarana – 3 587 854 324 646 – 6 180 5 031 480 8 950 160 (839 480) 3 496 805 11 607 485 R Kumalo4 – 557 842 50 491 3 650 000 800 – 4 259 133 – 724 619 4 983 752 V Mathur5,6 – 1 868 011 102 487 1 596 528 – 1 143 844 4 710 870 (1 143 844) – 3 567 026 G Motsa7 – 2 637 928 399 572 – 4 290 – 3 041 790 3 379 800 2 344 565 8 766 155
– 8 651 635 877 196 5 246 528 11 270 6 175 324 20 961 953 1 396 476 6 565 989 28 924 418
Notes: * Fees due to these directors were paid to Vodafone Group Plc, the company by which the director is employed. No other payments were made to third parties
in lieu of directors’ fees. # MS Aziz Joosub contributed an additional R624 000 to retirement funds from his short-term inventives. 1. Includes relocation allowance, assignment allowance, acting allowance, employee gifts and exit benefits. 2. Includes mobile phone benefit and subsistence allowance. 3. STI payable in June 2016, for the year ended 31 March 2016. 4. Resignations: R Kumalo: 31 May 2015; IP Dittrich: 31 July 2015; HMG Dowidar: 30 September 2015. 5. Appointments: T Streichert: 1 August 2015; M Pieters: 1 October 2015; V Mathur: 16 November 2015. 6. Remuneration paid/payable to Vodafone Group Plc. 7. Does not meet the definition of key management personnel from 1 January 2016.
73
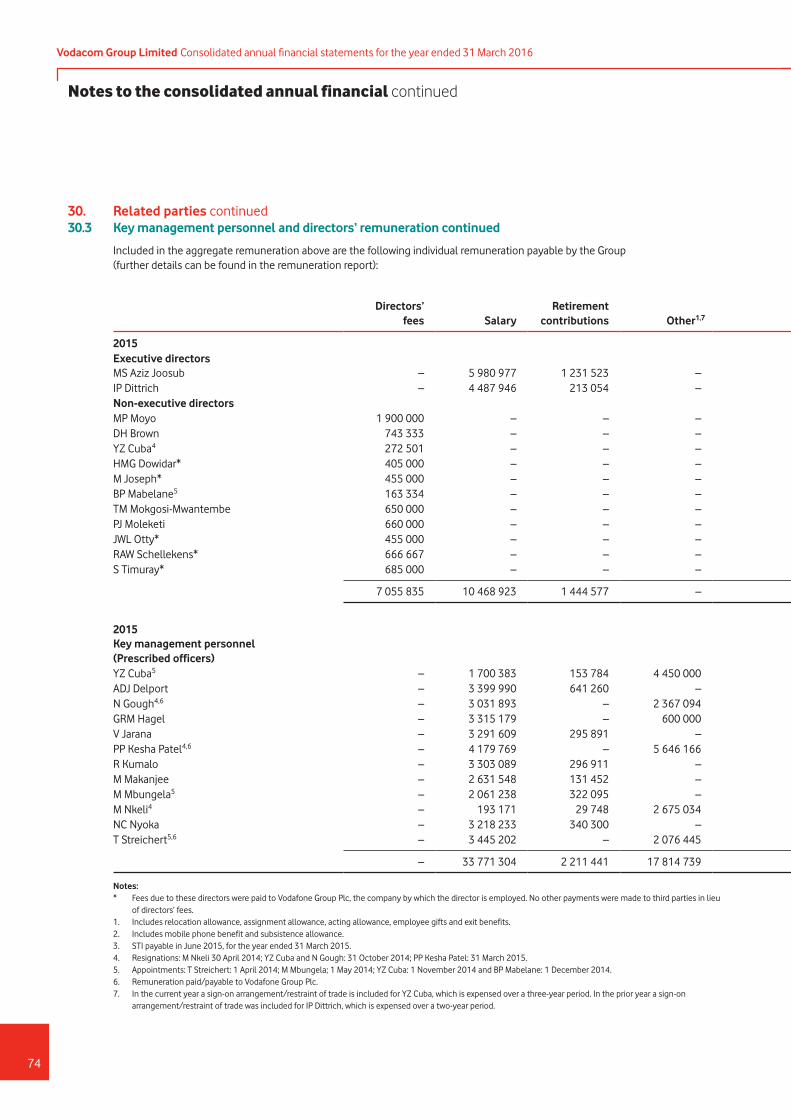
30. Related parties continued30.3 Key management personnel and directors’ remuneration continued
Included in the aggregate remuneration above are the following individual remuneration payable by the Group (further details can be found in the remuneration report):
Directors’ fees Salary
Retirementcontributions Other1,7
Expenseallowances2
Short-term incentives
(‘STI’)3Remuneration
reportExpensedover term7
Actuals vsprovisions
Long-termincentives and other Total
2015Executive directorsMS Aziz Joosub – 5 980 977 1 231 523 – 4 800 3 715 700 10 933 000 – 2 854 300 9 643 301 23 430 601 IP Dittrich – 4 487 946 213 054 – 4 800 1 541 316 6 247 116 104 167 2 733 684 3 720 843 12 805 810 Non-executive directorsMP Moyo 1 900 000 – – – – – 1 900 000 – – – 1 900 000 DH Brown 743 333 – – – – – 743 333 – – – 743 333 YZ Cuba4 272 501 – – – – – 272 501 – – – 272 501 HMG Dowidar* 405 000 – – – – – 405 000 – – – 405 000 M Joseph* 455 000 – – – – – 455 000 – – – 455 000 BP Mabelane5 163 334 – – – – – 163 334 – – – 163 334 TM Mokgosi-Mwantembe 650 000 – – – – – 650 000 – – – 650 000 PJ Moleketi 660 000 – – – – – 660 000 – – – 660 000 JWL Otty* 455 000 – – – – – 455 000 – – – 455 000 RAW Schellekens* 666 667 – – – – – 666 667 – – – 666 667 S Timuray* 685 000 – – – – – 685 000 – – – 685 000
7 055 835 10 468 923 1 444 577 – 9 600 5 257 016 24 235 951 104 167 5 587 984 13 364 144 43 292 246
2015Key management personnel (Prescribed officers)YZ Cuba5 – 1 700 383 153 784 4 450 000 – 688 823 6 992 990 (3 831 944) 701 802 860 531 4 723 379 ADJ Delport – 3 399 990 641 260 – – 1 919 169 5 960 419 – 1 155 831 1 989 670 9 105 920 N Gough4,6 – 3 031 893 – 2 367 094 – 924 502 6 323 489 – 1 079 209 – 7 402 698 GRM Hagel – 3 315 179 – 600 000 – 1 486 670 5 401 849 – (323 342) 1 319 628 6 398 135 V Jarana – 3 291 609 295 891 – 4 800 1 545 812 5 138 112 – 1 191 688 3 006 301 9 336 101 PP Kesha Patel4,6 – 4 179 769 – 5 646 166 – 1 598 516 11 424 451 – 1 285 706 – 12 710 157 R Kumalo – 3 303 089 296 911 – 4 800 655 620 4 260 420 – 2 081 880 2 203 425 8 545 725 M Makanjee – 2 631 548 131 452 – 3 228 1 040 200 3 806 428 – 1 059 800 945 997 5 812 225 M Mbungela5 – 2 061 238 322 095 – 4 400 1 062 490 3 450 223 – 725 010 1 682 058 5 857 291 M Nkeli4 – 193 171 29 748 2 675 034 – – 2 897 953 – – 331 458 3 229 411 NC Nyoka – 3 218 233 340 300 – 4 643 1 685 124 5 248 300 – 1 014 876 1 880 038 8 143 214 T Streichert5,6 – 3 445 202 – 2 076 445 – 1 408 439 6 930 086 – 1 217 724 – 8 147 810
– 33 771 304 2 211 441 17 814 739 21 871 14 015 365 67 834 720 (3 831 944) 11 190 184 14 219 106 89 412 066
Notes: * Fees due to these directors were paid to Vodafone Group Plc, the company by which the director is employed. No other payments were made to third parties in lieu
of directors’ fees. 1. Includes relocation allowance, assignment allowance, acting allowance, employee gifts and exit benefits. 2. Includes mobile phone benefit and subsistence allowance. 3. STI payable in June 2015, for the year ended 31 March 2015. 4. Resignations: M Nkeli 30 April 2014; YZ Cuba and N Gough: 31 October 2014; PP Kesha Patel: 31 March 2015. 5. Appointments: T Streichert: 1 April 2014; M Mbungela; 1 May 2014; YZ Cuba: 1 November 2014 and BP Mabelane: 1 December 2014. 6. Remuneration paid/payable to Vodafone Group Plc. 7. In the current year a sign-on arrangement/restraint of trade is included for YZ Cuba, which is expensed over a three-year period. In the prior year a sign-on
arrangement/restraint of trade was included for IP Dittrich, which is expensed over a two-year period.
Vodacom Group Limited Consolidated annual financial statements for the year ended 31 March 2016
74
Notes to the consolidated annual financial continued
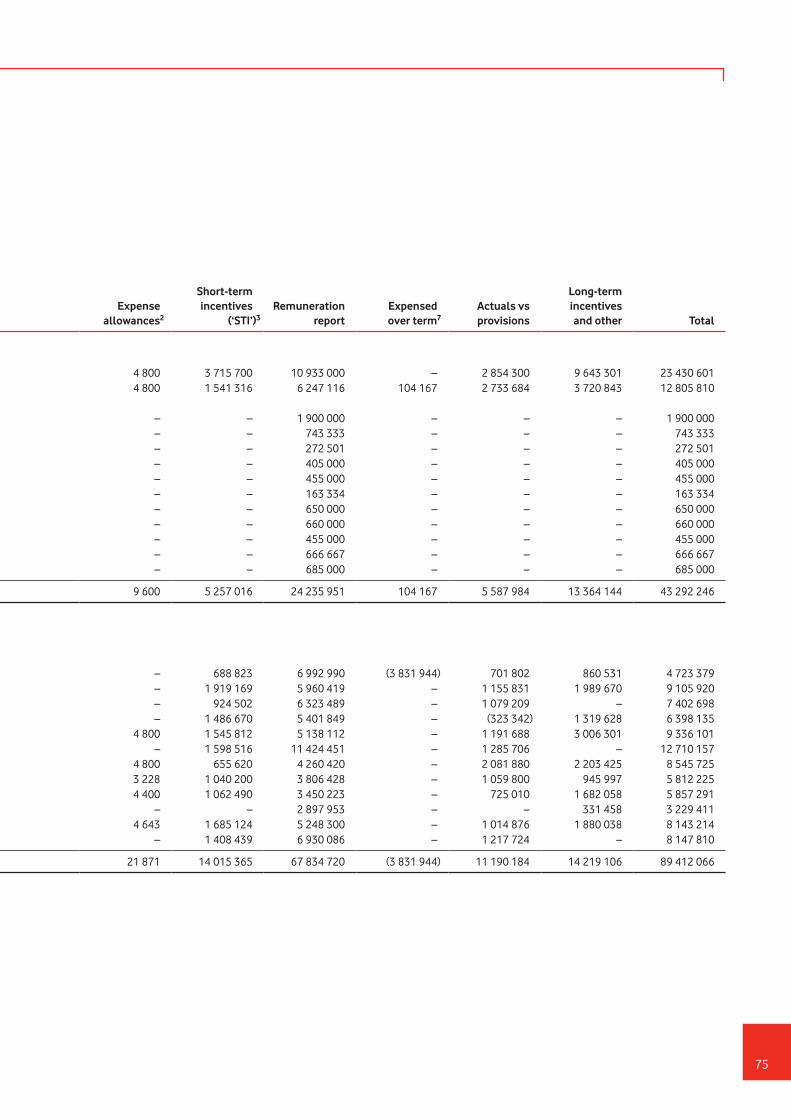
30. Related parties continued30.3 Key management personnel and directors’ remuneration continued
Included in the aggregate remuneration above are the following individual remuneration payable by the Group (further details can be found in the remuneration report):
Directors’ fees Salary
Retirementcontributions Other1,7
Expenseallowances2
Short-term incentives
(‘STI’)3Remuneration
reportExpensedover term7
Actuals vsprovisions
Long-termincentives and other Total
2015Executive directorsMS Aziz Joosub – 5 980 977 1 231 523 – 4 800 3 715 700 10 933 000 – 2 854 300 9 643 301 23 430 601 IP Dittrich – 4 487 946 213 054 – 4 800 1 541 316 6 247 116 104 167 2 733 684 3 720 843 12 805 810 Non-executive directorsMP Moyo 1 900 000 – – – – – 1 900 000 – – – 1 900 000 DH Brown 743 333 – – – – – 743 333 – – – 743 333 YZ Cuba4 272 501 – – – – – 272 501 – – – 272 501 HMG Dowidar* 405 000 – – – – – 405 000 – – – 405 000 M Joseph* 455 000 – – – – – 455 000 – – – 455 000 BP Mabelane5 163 334 – – – – – 163 334 – – – 163 334 TM Mokgosi-Mwantembe 650 000 – – – – – 650 000 – – – 650 000 PJ Moleketi 660 000 – – – – – 660 000 – – – 660 000 JWL Otty* 455 000 – – – – – 455 000 – – – 455 000 RAW Schellekens* 666 667 – – – – – 666 667 – – – 666 667 S Timuray* 685 000 – – – – – 685 000 – – – 685 000
7 055 835 10 468 923 1 444 577 – 9 600 5 257 016 24 235 951 104 167 5 587 984 13 364 144 43 292 246
2015Key management personnel (Prescribed officers)YZ Cuba5 – 1 700 383 153 784 4 450 000 – 688 823 6 992 990 (3 831 944) 701 802 860 531 4 723 379 ADJ Delport – 3 399 990 641 260 – – 1 919 169 5 960 419 – 1 155 831 1 989 670 9 105 920 N Gough4,6 – 3 031 893 – 2 367 094 – 924 502 6 323 489 – 1 079 209 – 7 402 698 GRM Hagel – 3 315 179 – 600 000 – 1 486 670 5 401 849 – (323 342) 1 319 628 6 398 135 V Jarana – 3 291 609 295 891 – 4 800 1 545 812 5 138 112 – 1 191 688 3 006 301 9 336 101 PP Kesha Patel4,6 – 4 179 769 – 5 646 166 – 1 598 516 11 424 451 – 1 285 706 – 12 710 157 R Kumalo – 3 303 089 296 911 – 4 800 655 620 4 260 420 – 2 081 880 2 203 425 8 545 725 M Makanjee – 2 631 548 131 452 – 3 228 1 040 200 3 806 428 – 1 059 800 945 997 5 812 225 M Mbungela5 – 2 061 238 322 095 – 4 400 1 062 490 3 450 223 – 725 010 1 682 058 5 857 291 M Nkeli4 – 193 171 29 748 2 675 034 – – 2 897 953 – – 331 458 3 229 411 NC Nyoka – 3 218 233 340 300 – 4 643 1 685 124 5 248 300 – 1 014 876 1 880 038 8 143 214 T Streichert5,6 – 3 445 202 – 2 076 445 – 1 408 439 6 930 086 – 1 217 724 – 8 147 810
– 33 771 304 2 211 441 17 814 739 21 871 14 015 365 67 834 720 (3 831 944) 11 190 184 14 219 106 89 412 066
Notes: * Fees due to these directors were paid to Vodafone Group Plc, the company by which the director is employed. No other payments were made to third parties in lieu
of directors’ fees. 1. Includes relocation allowance, assignment allowance, acting allowance, employee gifts and exit benefits. 2. Includes mobile phone benefit and subsistence allowance. 3. STI payable in June 2015, for the year ended 31 March 2015. 4. Resignations: M Nkeli 30 April 2014; YZ Cuba and N Gough: 31 October 2014; PP Kesha Patel: 31 March 2015. 5. Appointments: T Streichert: 1 April 2014; M Mbungela; 1 May 2014; YZ Cuba: 1 November 2014 and BP Mabelane: 1 December 2014. 6. Remuneration paid/payable to Vodafone Group Plc. 7. In the current year a sign-on arrangement/restraint of trade is included for YZ Cuba, which is expensed over a three-year period. In the prior year a sign-on
arrangement/restraint of trade was included for IP Dittrich, which is expensed over a two-year period.
75
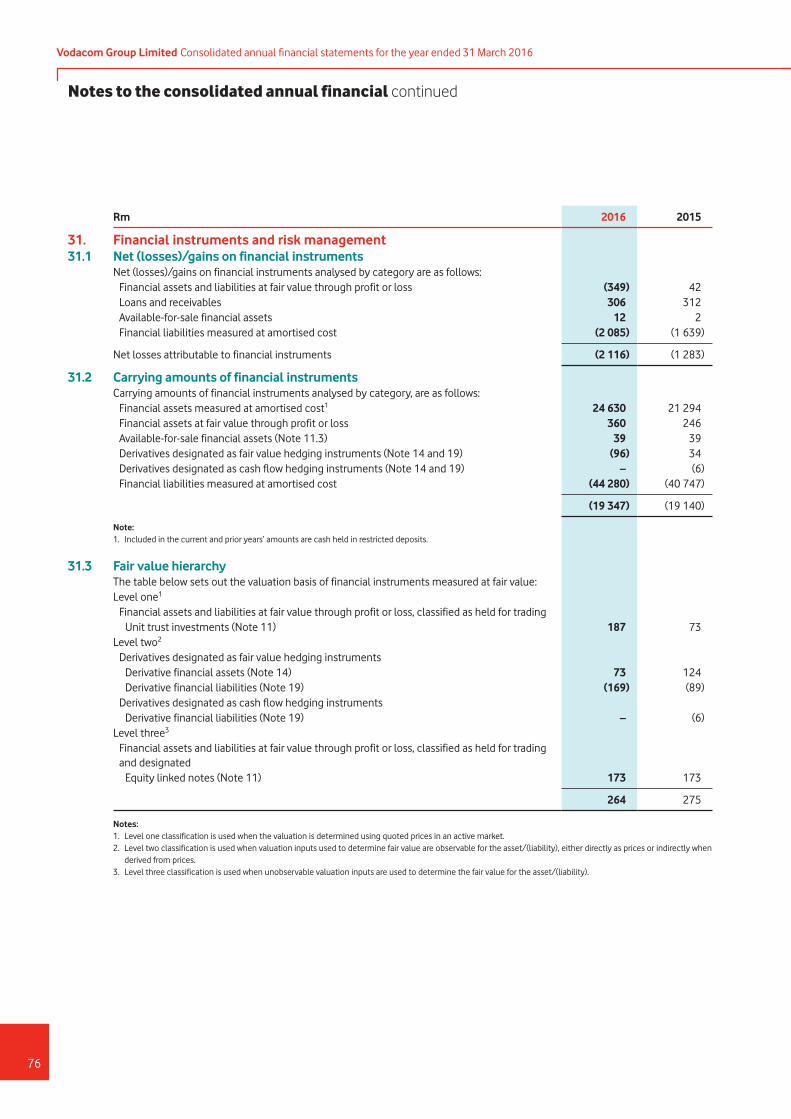
Rm 2016 2015
31. Financial instruments and risk management 31.1 Net (losses)/gains on financial instruments
Net (losses)/gains on financial instruments analysed by category are as follows: Financial assets and liabilities at fair value through profit or loss (349) 42 Loans and receivables 306 312 Available-for-sale financial assets 12 2 Financial liabilities measured at amortised cost (2 085) (1 639)
Net losses attributable to financial instruments (2 116) (1 283)
31.2 Carrying amounts of financial instruments Carrying amounts of financial instruments analysed by category, are as follows: Financial assets measured at amortised cost1 24 630 21 294 Financial assets at fair value through profit or loss 360 246 Available-for-sale financial assets (Note 11.3) 39 39 Derivatives designated as fair value hedging instruments (Note 14 and 19) (96) 34 Derivatives designated as cash flow hedging instruments (Note 14 and 19) – (6) Financial liabilities measured at amortised cost (44 280) (40 747)
(19 347) (19 140)
Note:1. Included in the current and prior years’ amounts are cash held in restricted deposits.
31.3 Fair value hierarchyThe table below sets out the valuation basis of financial instruments measured at fair value:Level one1 Financial assets and liabilities at fair value through profit or loss, classified as held for trading Unit trust investments (Note 11) 187 73 Level two2 Derivatives designated as fair value hedging instruments Derivative financial assets (Note 14) 73 124 Derivative financial liabilities (Note 19) (169) (89) Derivatives designated as cash flow hedging instruments Derivative financial liabilities (Note 19) – (6)Level three3 Financial assets and liabilities at fair value through profit or loss, classified as held for trading
and designated Equity linked notes (Note 11) 173 173
264 275
Notes: 1. Level one classification is used when the valuation is determined using quoted prices in an active market. 2. Level two classification is used when valuation inputs used to determine fair value are observable for the asset/(liability), either directly as prices or indirectly when
derived from prices. 3. Level three classification is used when unobservable valuation inputs are used to determine the fair value for the asset/(liability).
Vodacom Group Limited Consolidated annual financial statements for the year ended 31 March 2016
76
Notes to the consolidated annual financial continued
31. Financial instruments and risk management continued 31.4 Financial risk management The Group’s normal operations, its sources of finance and changing market conditions expose it to various financial risks, which
highlights the importance of financial risk management as an element of control. Principal financial risks faced by the Group are foreign currency, interest rate, equity price, credit, liquidity and insurance risk.
The Group’s treasury function provides a centralised service to the Group for co-ordinating access to domestic and international financial markets and the managing of foreign currency, interest rate and liquidity risk. The aforementioned risks are managed, subject to the limitations of the local markets in which the various Group companies operate and the South African Reserve Bank Regulations. Treasury operations are conducted within a framework of policies and guidelines authorised and reviewed annually by the Board.
The Group uses a number of derivative instruments that are transacted for foreign currency and interest rate risk management purposes only. There has been no significant change during the reporting period, or since the end of the reporting period, to the types of financial risks faced by the Group, the measures used to measure them or the objectives, policies and processes for managing them.
31.4.1 Market risk management The Group’s activities expose it to the risks of fluctuations in foreign currency exchange rates (Note 31.4.1.1), interest rates
(Note 31.4.1.2) and equity prices (Note 31.4.1.3).
Market risk exposures are measured using sensitivity analyses, which show how profit post tax or equity post tax would have been affected by changes in the relevant risk variable that were reasonably possible at the reporting date. Sensitivity analyses are for illustrative purposes only as, in practice, market rates rarely change in isolation. Details of changes in the methods and assumptions used in preparing the sensitivity analyses are disclosed in the respective sensitivity analyses.
77

31. Financial instruments and risk management continued31.4 Financial risk management continued31.4.1 Market risk management continued31.4.1.1 Foreign currency risk management Various monetary items exist in currencies other than the functional currencies of the entities within the Group. The tables below
disclose the net currency exposure (net carrying amount of foreign-denominated monetary assets/(liabilities) expressed in the presentation currency of the Group) per functional currency. The Group is mainly exposed to the euro and United States dollar and to a lesser extent to the Congolese franc, pound sterling, Swiss franc, Australian dollar, Tanzanian shilling, Mozambican metical, Mauritian rupee, Lesotho maloti, Nigerian naira, Zambian kwacha and South African rand which is combined as ‘Other’.
Euro
United Statesdollar Other
2016Functional currency South African rand (22) (316) (3)United States dollar 1 – (5)Tanzanian shilling (25) 112 – Mozambican metical 12 46 (8)Nigerian niara (1) 38 (3)
(35) (120) (19)
2015Functional currency South African rand (144) (1 175) (8)United States dollar (3) – (2)Tanzanian shilling (156) (56) (12)Mozambican metical (43) 59 (35)
(346) (1 172) (57)
The Group’s South African operations manages its exposure to fluctuations in foreign currency exchange rates by entering into foreign exchange forward contracts for foreign-denominated transactions above certain monetary levels. The contracts are entered into for specific transactions and are matched with anticipated future cash flows, in foreign currencies, primarily for the purchase of capital equipment and to a lesser extent operating expenditure. The Group’s policy is generally that entities within the Group borrow funds denominated in their respective functional currencies, however, in those instances where funds are borrowed in foreign-denominated currencies and a forward market exists, exposure to fluctuations in foreign currency exchange rates is managed by entering into foreign exchange forward contracts.
Vodacom Group Limited Consolidated annual financial statements for the year ended 31 March 2016
78
Notes to the consolidated annual financial continued
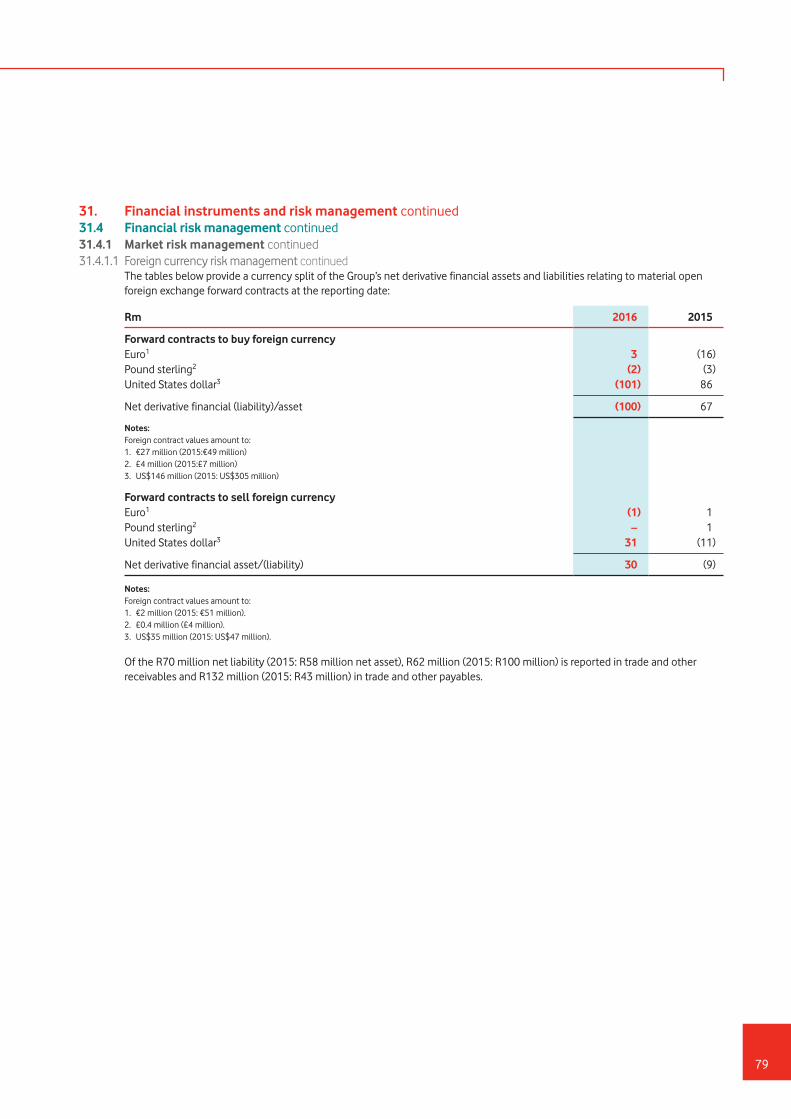
31. Financial instruments and risk management continued31.4 Financial risk management continued31.4.1 Market risk management continued31.4.1.1 Foreign currency risk management continued The tables below provide a currency split of the Group’s net derivative financial assets and liabilities relating to material open
foreign exchange forward contracts at the reporting date:
Rm 2016 2015
Forward contracts to buy foreign currencyEuro1 3 (16)Pound sterling2 (2) (3)United States dollar3 (101) 86
Net derivative financial (liability)/asset (100) 67
Notes:Foreign contract values amount to:1. €27 million (2015:€49 million)2. £4 million (2015:£7 million)3. US$146 million (2015: US$305 million)
Forward contracts to sell foreign currencyEuro1 (1) 1 Pound sterling2 – 1 United States dollar3 31 (11)
Net derivative financial asset/(liability) 30 (9)
Notes: Foreign contract values amount to: 1. €2 million (2015: €51 million). 2. £0.4 million (£4 million). 3. US$35 million (2015: US$47 million).
Of the R70 million net liability (2015: R58 million net asset), R62 million (2015: R100 million) is reported in trade and other receivables and R132 million (2015: R43 million) in trade and other payables.
79

31. Financial instruments and risk management continued31.4 Financial risk management continued31.4.1 Market risk management continued31.4.1.1 Foreign currency risk management continued Foreign currency sensitivity analysis The analysis below, expressed in the Group’s presentation currency, discloses the Group’s sensitivity to the specified percentage
change in the functional currencies against the relevant foreign currencies exposed to. Management’s assessment of a reasonable possible change in prevailing non-African and African foreign currency exchange rates is based on estimated interest rate differentials.
The analysis includes outstanding foreign-denominated monetary items only and adjusts their translations, at the reporting date, to the relevant functional currencies with the specified percentage change.
A positive number indicates an increase and a negative number a decrease in profit post tax, where the functional currencies are expected to strengthen against the relevant foreign currencies. For the same percentage weakening the impact would be equal and opposite.
Euro
United Statesdollar Other
2016Functional currency South African rand (%) 3.1 0.5 2.7 – 27.7United States dollar (%) 2.6 – 0.5 – 26.5Tanzanian shilling (%) 2.5 5.2 0.9 – 12.0Mozambican metical (%) 23.2 26.5 5.8 – 27.1Profit post tax (Rm) (8) (25) 1
2015Functional currency South African rand (%) 12.1 4.1 2.1 – 9.7United States dollar (%) 16.9 – 0.2 – 13.4Tanzanian shilling (%) 17.2 0.2 1.3 – 15.7Mozambican metical (%) 1.3 13.4 2.3 – 13.6Profit post tax (Rm) (8) (61) 2
Closing exchange rates used at the reporting date are as follows:
2016Functional currency South African rand 16.7 21.1 14.7 United States dollar 1.1 1.4 – Tanzanian shilling 2 488.1 3 146.7 2 186.2 Mozambican metical 58.5 74.0 51.4
2015Functional currency South African rand 13.0 18.0 12.1 United States dollar 1.1 1.5 – Tanzanian shilling 1 988.3 2 750.8 1 853.3 Mozambican metical 39.5 54.7 36.8
Vodacom Group Limited Consolidated annual financial statements for the year ended 31 March 2016
80
Notes to the consolidated annual financial continued
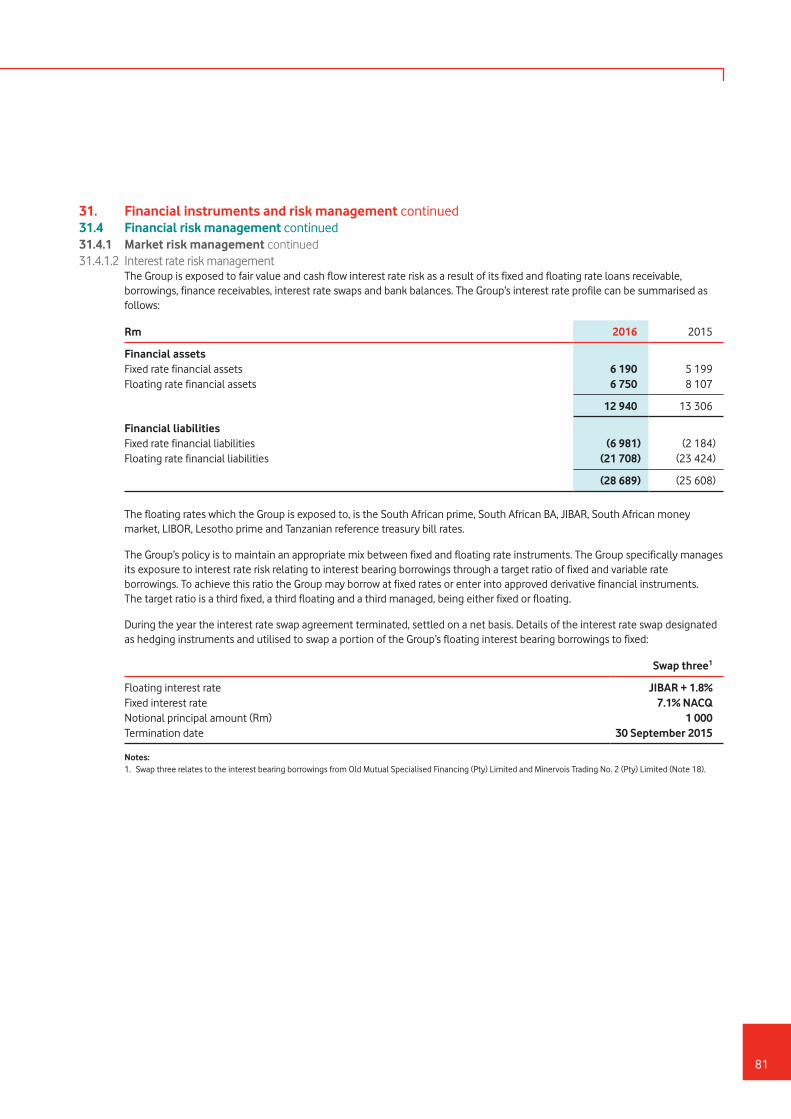
31. Financial instruments and risk management continued31.4 Financial risk management continued31.4.1 Market risk management continued31.4.1.2 Interest rate risk management The Group is exposed to fair value and cash flow interest rate risk as a result of its fixed and floating rate loans receivable,
borrowings, finance receivables, interest rate swaps and bank balances. The Group’s interest rate profile can be summarised as follows:
Rm 2016 2015
Financial assetsFixed rate financial assets 6 190 5 199 Floating rate financial assets 6 750 8 107
12 940 13 306
Financial liabilitiesFixed rate financial liabilities (6 981) (2 184)Floating rate financial liabilities (21 708) (23 424)
(28 689) (25 608)
The floating rates which the Group is exposed to, is the South African prime, South African BA, JIBAR, South African money market, LIBOR, Lesotho prime and Tanzanian reference treasury bill rates.
The Group’s policy is to maintain an appropriate mix between fixed and floating rate instruments. The Group specifically manages its exposure to interest rate risk relating to interest bearing borrowings through a target ratio of fixed and variable rate borrowings. To achieve this ratio the Group may borrow at fixed rates or enter into approved derivative financial instruments. The target ratio is a third fixed, a third floating and a third managed, being either fixed or floating.
During the year the interest rate swap agreement terminated, settled on a net basis. Details of the interest rate swap designated as hedging instruments and utilised to swap a portion of the Group’s floating interest bearing borrowings to fixed:
Swap three1
Floating interest rate JIBAR + 1.8%Fixed interest rate 7.1% NACQNotional principal amount (Rm) 1 000 Termination date 30 September 2015
Notes: 1. Swap three relates to the interest bearing borrowings from Old Mutual Specialised Financing (Pty) Limited and Minervois Trading No. 2 (Pty) Limited (Note 18).
81

31. Financial instruments and risk management continued31.4 Financial risk management continued31.4.1 Market risk management continued31.4.1.2 Interest rate risk management continued Interest rate sensitivity analysis The analysis below, expressed in the Group’s presentation currency, discloses the Group’s sensitivity to the specified basis point
change in the market interest rates exposed to. Management’s assessment of a reasonable possible change in market interest rates are based on economic forecasts as published by Bloomberg.
The analysis includes both derivative and non-derivative instruments at the reporting date and in the case of floating rate instruments, the analysis is prepared assuming the amount outstanding at the reporting date was outstanding for the whole year.
A negative number indicates a decrease in profit post tax if interest rates were higher by the specified basis points. If interest rates were lower by the specified basis points, the impact would be equal and opposite. There would be no material impact on equity.
2016 2015
South African prime, South African BA, JIBAR and South African money market ratesBasis point increase 25 75 Profit post tax (Rm) (26) (83)
A reasonable possible change in the remaining interest rates exposed to, being LIBOR, EURIBOR, Lesotho prime and Tanzanian reference treasury bill rates, would have no material impact on profit post tax.
31.4.1.3 Equity price risk The Group is only exposed to equity price risk to a small extent and therefore a reasonable possible change in equity prices will
not have a material impact on profit post tax.
31.4.2 Credit risk management Loans receivable, investments, trade and other receivables, derivatives, finance lease receivables, cash and cash equivalents, and
financial guarantees granted potentially expose the Group to credit risk.
The carrying amounts of financial assets, which are net of impairment losses, represent the Group’s maximum exposure to credit risk, with the exception of financial guarantees granted where the amount the Group could be required to pay or fund, if called on, represents the Group’s maximum exposure. The Group considers its maximum exposure per geographical class, without taking into account any collateral and financial guarantees, to be as follows:
Rm 2016 2015
South Africa 17 645 16 861 Non-South African 5 005 4 759
22 650 21 620
Vodacom Group Limited Consolidated annual financial statements for the year ended 31 March 2016
82
Notes to the consolidated annual financial continued

31. Financial instruments and risk management continued31.4 Financial risk management continued31.4.2 Credit risk management continued In addition, the Group holds cash in restricted deposits of R2 454 million (2015: R1 943 million) as a result of its M-Pesa activities,
which cash is held in accounts with reputable financial institutions.
The Group’s policy is to deal with creditworthy counterparties only and to obtain sufficient collateral, where appropriate, to mitigate the risk of financial loss from counterparty defaults.
The Group only transacts with counterparties rated the equivalent of investment grade and above. This information is supplied by independent rating agencies or credit bureaus, where available. If not available, other publicly available financial information, the financial standing of counterparties, the Group’s own trading records or the Group’s internal grading system is used for rating the credit quality of counterparties. Contractual arrangements are entered into with network operator customers as determined by regulatory requirements and industry norms. Credit exposure is further controlled by defining credit limits per counterparty which are reviewed and approved by the credit risk department. The Group’s exposure and credit ratings of counterparties are continuously monitored and the aggregate value of transactions concluded is spread amongst approved counterparties. In determining the recoverability of trade receivables, the Group considers changes in credit quality.
The Group’s largest customer represents 21.2% (2015: 16.1%) of the total trade receivable balance. With the exception of the aforementioned, the credit risk for trade, finance and other receivables is generally limited due to the customer base being large and unrelated in conjunction with stringent credit approval processes. Due to this management believes there is no further provision required in excess of the normal provision for doubtful receivables. Credit risk is limited for loans receivable due to collateral held and for cash and cash equivalents as they are placed with high credit quality financial institutions. Credit risk relating to investments and derivatives is minimised by limiting the counterparties to major local and international banks, which are closely monitored, and the Group does not expect to incur any losses as a result of non-performance by these counterparties.
The average legally agreed credit period on trade receivables is between 30 and 60 days, for all reporting periods, for the South African operations and between 30 and 85 days, for all reporting periods, for the non-South African operations.
The Group holds collateral to the value of R3 401 million (2015: R3 438 million) over certain trade and other receivables, which is made up of demand guarantees from financial institutions, exercisable on overdue invoices. Collateral held over loans receivable is disclosed in Note 11.
The table below discloses the credit quality of the trade receivables of the Group’s South African-based operations which are neither past due nor impaired:
% 2016 2015
High1 2.0 0.4 Medium2 2.8 7.8 Low3 95.2 91.8
100.0 100.0
Notes: 1. High: probability of default in payments exists and possible delinquency scenario. 2. Medium: probability of financial difficulties exists resulting in arrears. 3. Low: no default in payment occurred or anticipated.
83
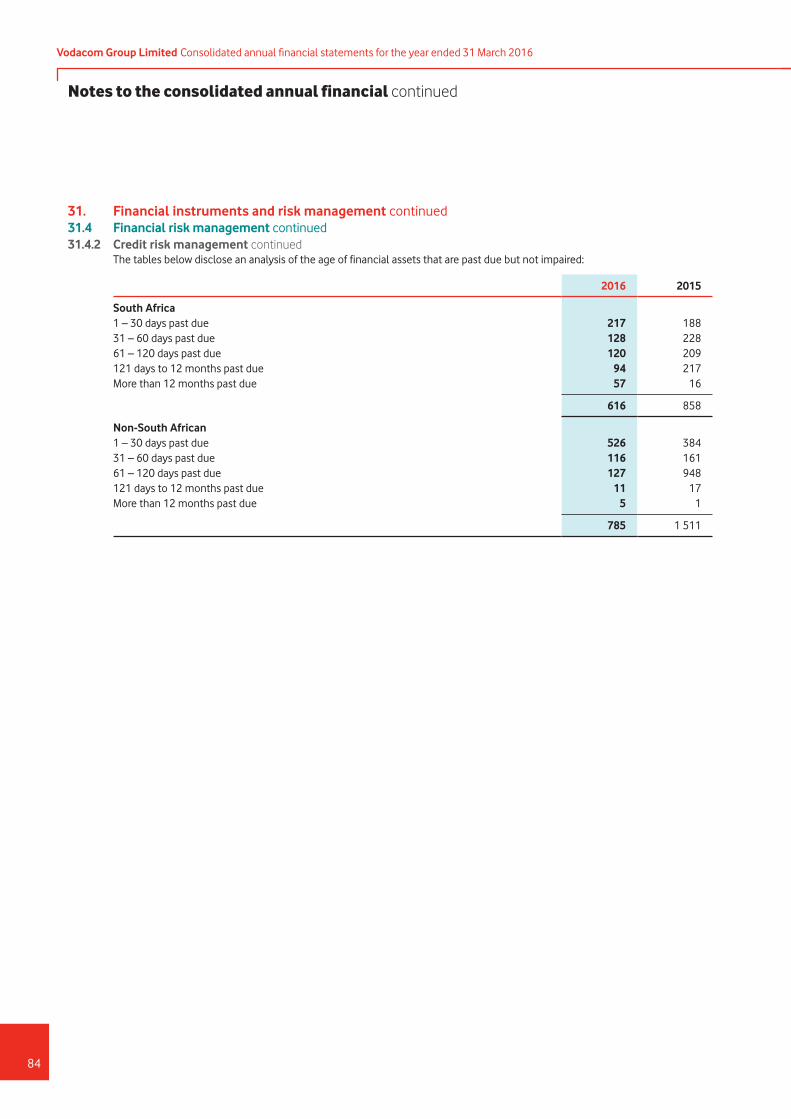
31. Financial instruments and risk management continued31.4 Financial risk management continued31.4.2 Credit risk management continued The tables below disclose an analysis of the age of financial assets that are past due but not impaired:
2016 2015
South Africa1 – 30 days past due 217 188 31 – 60 days past due 128 228 61 – 120 days past due 120 209 121 days to 12 months past due 94 217 More than 12 months past due 57 16
616 858
Non-South African1 – 30 days past due 526 384 31 – 60 days past due 116 161 61 – 120 days past due 127 948 121 days to 12 months past due 11 17 More than 12 months past due 5 1
785 1 511
Vodacom Group Limited Consolidated annual financial statements for the year ended 31 March 2016
84
Notes to the consolidated annual financial continued

31. Financial instruments and risk management continued31.4 Financial risk management continued 31.4.3 Liquidity risk management The tables below disclose the maturity profile of the Group’s non-derivative financial liabilities and those financial assets used for
managing liquidity risk. The amounts disclosed are the future undiscounted contractual cash (outflows)/inflows which therefore differ from both the carrying amount and the fair value. The tables have been drawn up based on the earliest date on which the Group can be required to settle or can require settlement and include both estimated interest and principal cash flows. Estimated interest for floating interest rate financial liabilities is calculated with reference to the applicable zero coupon yield curves, at the reporting date, as published by Bloomberg.
Rm 0 – 1 year 2 years 3 years 4 years 5 years 5+ years Total
2016Financial liabilitiesInterest bearing borrowings (3 006) (5 324) (10 899) (12 667) (1 809) (1 305) (35 010)Non-interest bearing borrowings (436) – – – – – (436)Trade and other payables1 (16 546) (135) – – – – (16 681)Bank overdrafts (183) – – – – – (183)
(20 171) (5 459) (10 899) (12 667) (1 809) (1 305) (52 310)
Financial assetsTrade and other receivables 11 645 – – – – – 11 645 Cash and cash equivalents 7 934 – – – – – 7 934
19 579 – – – – – 19 579
2015Financial liabilitiesInterest bearing borrowings (5 802) (1 624) (4 619) (4 360) (12 384) (2 825) (31 614)Non-interest bearing borrowings (436) – – – – – (436)Trade and other payables1 (14 631) (81) – – – – (14 712)Bank overdrafts (380) – – – – – (380)
(21 249) (1 705) (4 619) (4 360) (12 384) (2 825) (47 142)
Financial assetsTrade and other receivables 9 789 – – – – – 9 789 Cash and cash equivalents 9 250 – – – – – 9 250
19 039 – – – – – 19 039
Note: 1. In addition, the Group holds cash in restricted deposits of R2 454 million (2015: R1 943 million) relating to M-Pesa creditors, for which cash is held in accounts with
reputable financial institutions.
85

31. Financial instruments and risk management continued31.4 Financial risk management continued 31.4.3 Liquidity risk management continued The tables below disclose the maturity profile of the Group’s derivative financial assets and liabilities which include foreign
exchange forward contracts and interest rate swaps. The amounts disclosed are the future undiscounted contractual cash (outflows)/inflows, however, for those derivative financial instruments for which gross settlement has been agreed, the cash outflows are matched in part by cash inflows, which are not reported in the tables below and if reported, the cash flows presented would be substantially lower. In the case of the interest rate swaps, where the amounts payable or receivable are not fixed, the amounts are calculated with reference to the applicable zero coupon yield curves at the reporting date.
Rm 0 – 1 year 2 years 3 years 4 years 5 years 5+ yearsNot
determinable Total
2016Net settled (34) – – – – – – (34)Gross settled Payable (2 065) – – – – – – (2 065)
(2 099) – – – – – – (2 099)
2015Net settled (281) – – – – – – (281)Gross settled Payable (3 289) – – – – – – (3 289)
(3 570) – – – – – – (3 570)
The Group ensures that adequate funds are available to meet its expected and unexpected financial commitments through undrawn borrowing facilities and access to the debt capital market via its recently listed domestic medium-term note programme. At the reporting date the Group had undrawn rand-denominated borrowing facilities of R3 776 million (2015: R3 188 million) and undrawn foreign-denominated borrowing facilities of US$20 million (2015: US$58 million), MZN888 million (2015: MZN375 million), LSL25 million (2015: LSL4 million) and NGN Nil (2015: NGN200 million) available to manage its liquidity. The Group uses bank facilities and the normal operating cycle to manage short-term liquidity. The Group raises funds in bank markets and ensures a reasonable balance is maintained between the period over which assets generate funds and the period over which the respective assets are funded to manage long-term liquidity. Liquidity on long-term borrowings is managed by maintaining a varied maturity profile thereby minimising refinancing risk.
31.4.4 Insurance risk management The Group is exposed to insurance risk as a result of its asset base as well as its customer commitments and value added services
rendered. The Group is adequately covered in terms of its insurance risk profile. The annual financial statements of Vodacom Insurance Company (RF) Limited and Vodacom Life Assurance Company (RF) Limited are available at the registered office of the Group and contain further details of the value-added services and insurance risk.
Vodacom Group Limited Consolidated annual financial statements for the year ended 31 March 2016
86
Notes to the consolidated annual financial continued
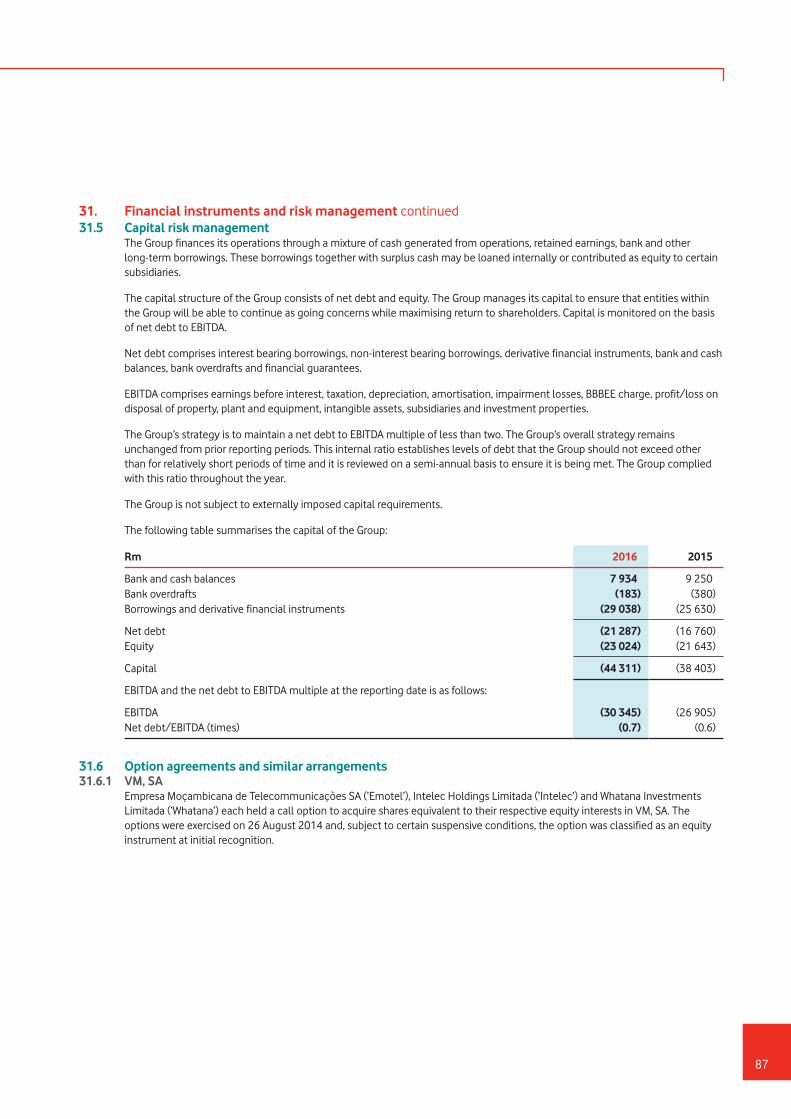
31. Financial instruments and risk management continued31.5 Capital risk management The Group finances its operations through a mixture of cash generated from operations, retained earnings, bank and other
long-term borrowings. These borrowings together with surplus cash may be loaned internally or contributed as equity to certain subsidiaries.
The capital structure of the Group consists of net debt and equity. The Group manages its capital to ensure that entities within the Group will be able to continue as going concerns while maximising return to shareholders. Capital is monitored on the basis of net debt to EBITDA.
Net debt comprises interest bearing borrowings, non-interest bearing borrowings, derivative financial instruments, bank and cash balances, bank overdrafts and financial guarantees.
EBITDA comprises earnings before interest, taxation, depreciation, amortisation, impairment losses, BBBEE charge, profit/loss on disposal of property, plant and equipment, intangible assets, subsidiaries and investment properties.
The Group’s strategy is to maintain a net debt to EBITDA multiple of less than two. The Group’s overall strategy remains unchanged from prior reporting periods. This internal ratio establishes levels of debt that the Group should not exceed other than for relatively short periods of time and it is reviewed on a semi-annual basis to ensure it is being met. The Group complied with this ratio throughout the year.
The Group is not subject to externally imposed capital requirements.
The following table summarises the capital of the Group:
Rm 2016 2015
Bank and cash balances 7 934 9 250 Bank overdrafts (183) (380)Borrowings and derivative financial instruments (29 038) (25 630)
Net debt (21 287) (16 760)Equity (23 024) (21 643)
Capital (44 311) (38 403)
EBITDA and the net debt to EBITDA multiple at the reporting date is as follows:
EBITDA (30 345) (26 905)Net debt/EBITDA (times) (0.7) (0.6)
31.6 Option agreements and similar arrangements31.6.1 VM, SA Empresa Moçambicana de Telecommunicaçòes SA (‘Emotel’), Intelec Holdings Limitada (‘Intelec’) and Whatana Investments
Limitada (‘Whatana’) each held a call option to acquire shares equivalent to their respective equity interests in VM, SA. The options were exercised on 26 August 2014 and, subject to certain suspensive conditions, the option was classified as an equity instrument at initial recognition.
87

To the shareholders of Vodacom Group LimitedThe summarised financial statements of Vodacom Group Limited (the ‘Company’), set out on pages 89 to 96 of the Consolidated Annual Financial Statements, which comprise the summarised statement of financial position of the Company standing alone as at 31 March 2016, and the summarised Company income statement, summarised Company statement of comprehensive income, summarised Company statement of changes in equity and summarised Company statement of cash flows for the year then ended, and related notes, are derived from the audited financial statements of the Company for the year ended 31 March 2016. We expressed an unmodified audit opinion on those financial statements in our report dated 29 May 2016. Our auditor’s report on the audited financial statements contained an ‘Other Matter’ paragraph: ‘Other reports required by the Companies Act’ (refer below).
The summarised financial statements do not contain all the disclosures required by International Financial Reporting Standards and the requirements of the Companies Act of South Africa as applicable to annual financial statements. Reading the summarised financial statements, therefore, is not a substitute for reading the audited financial statements of the Company.
Directors’ responsibility for the summarised financial statementsThe directors are responsible for the preparation these summarised financial statements in accordance with the JSE Limited’s (‘JSE’) requirements for summarised financial statements, set out in the ‘Basis of preparation’ paragraph on page 86 the summarised financial statements, and the requirements of the Companies Act of South Africa as applicable to summarised financial statements, and for such internal control as the directors determine is necessary to enable the preparation of summarised financial statements that are free from material misstatement, whether due to fraud or error.
Auditors’ responsibilityOur responsibility is to express an opinion on the summarised financial statements based on our procedures, which were conducted in accordance with International Standard on Auditing (‘ISA’) 810, Engagements to Report on Summary Financial Statements.
OpinionIn our opinion, the summarised financial statements derived from the audited financial statements of the Company standing alone for the year ended 31 March 2016 are consistent, in all material respects, with those financial statements, in accordance with the JSE’s requirements for summarised financial statements, set out in the ‘Basis of preparation’ paragraph on page 86 of the summarised financial statements, and the requirements of the Companies Act of South Africa as applicable to summarised financial statements.
Other reports required by the Companies ActThe ‘Other reports required by the Companies Act’ paragraph in our audit report dated 3 June 2016 states that as part of our audit of the financial statements for the year ended 31 March 2016, we have read the Directors’ Report and the Certificate by the Company Secretary for the purpose of identifying whether there are material inconsistencies between these reports and the audited financial statements. These reports are the responsibility of the respective preparers. The paragraph also states that, based on reading these reports, we have not identified material inconsistencies between these reports and the audited financial statements. The paragraph furthermore states that we have not audited these reports and accordingly do not express an opinion on these reports. The paragraph does not have an effect on the summarised financial statements or our opinion thereon.
PricewaterhouseCoopers Inc. Director: D.B. von HoesslinRegistered Auditor Pretoria3 June 2016
Vodacom Group Limited Consolidated annual financial statements for the year ended 31 March 2016
88
Independent auditor’s report on the summarised Company financial statementsFor the year ended 31 March
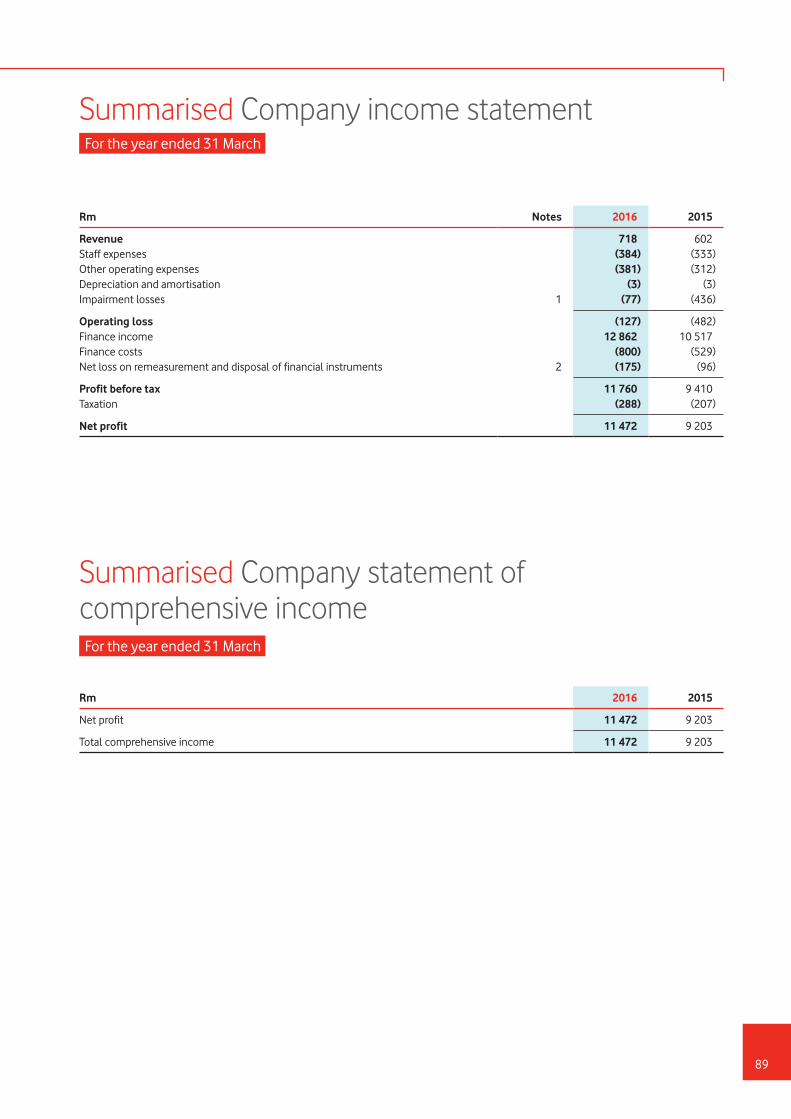
89
Rm Notes 2016 2015
Revenue 718 602 Staff expenses (384) (333)Other operating expenses (381) (312)Depreciation and amortisation (3) (3)Impairment losses 1 (77) (436)
Operating loss (127) (482)Finance income 12 862 10 517 Finance costs (800) (529)Net loss on remeasurement and disposal of financial instruments 2 (175) (96)
Profit before tax 11 760 9 410 Taxation (288) (207)
Net profit 11 472 9 203
Rm 2016 2015
Net profit 11 472 9 203
Total comprehensive income 11 472 9 203
Summarised Company income statement
Summarised Company statement of comprehensive income
For the year ended 31 March
For the year ended 31 March

Vodacom Group Limited Consolidated annual financial statements for the year ended 31 March 2016
90
Rm Notes 2016 2015
AssetsNon-current assets 12 771 12 464
Property, plant and equipment 6 5 Intangible assets 39 5 Investments in subsidiaries 4 10 667 10 173 Financial assets 5 1 745 1 926 Trade and other receivables 6 – 49 Finance lease receivables 314 306
Current assets 6 119 8 163
Trade and other receivables 6 1 368 1 969 Finance lease receivables 16 18 Tax receivable 11 – Cash and cash equivalents 4 724 6 176
Total assets 18 890 20 627
Equity and liabilitiesFully paid share capital 7 * * Treasury shares 7 (735) (683)Retained earnings 12 680 12 990 Other reserves 8 298 310
Total equity 12 243 12 617 Non-current liabilities 5 171 2 962
Borrowings 9 4 576 2 576 Trade and other payables 10 128 117 Provisions 4 5 Deferred tax 463 264
Current liabilities 1 476 5 048
Borrowings 9 66 33 Trade and other payables 10 1 392 4 953 Provisions – 1 Tax payable – 43 Dividends payable 18 18
Total equity and liabilities 18 890 20 627
Notes:* Fully paid share capital of R100.
Summarised Company statement of financial positionFor the year ended 31 March
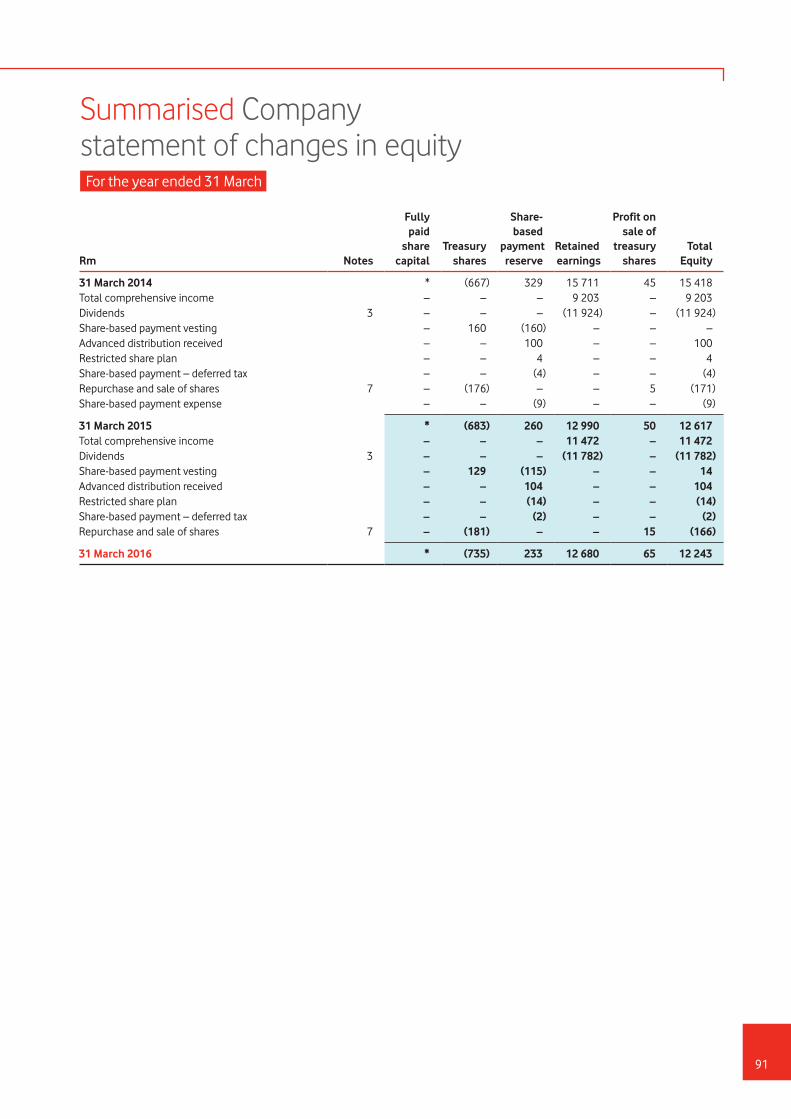
91
Rm Notes
Fully paid
share capital
Treasury shares
Share-based
payment reserve
Retained earnings
Profit on sale of
treasury shares
Total Equity
31 March 2014 * (667) 329 15 711 45 15 418 Total comprehensive income – – – 9 203 – 9 203 Dividends 3 – – – (11 924) – (11 924)Share-based payment vesting – 160 (160) – – – Advanced distribution received – – 100 – – 100 Restricted share plan – – 4 – – 4 Share-based payment – deferred tax – – (4) – – (4)Repurchase and sale of shares 7 – (176) – – 5 (171)Share-based payment expense – – (9) – – (9)
31 March 2015 * (683) 260 12 990 50 12 617 Total comprehensive income – – – 11 472 – 11 472 Dividends 3 – – – (11 782) – (11 782)Share-based payment vesting – 129 (115) – – 14 Advanced distribution received – – 104 – – 104 Restricted share plan – – (14) – – (14)Share-based payment – deferred tax – – (2) – – (2)Repurchase and sale of shares 7 – (181) – – 15 (166)
31 March 2016 * (735) 233 12 680 65 12 243
Summarised Company statement of changes in equityFor the year ended 31 March

Vodacom Group Limited Consolidated annual financial statements for the year ended 31 March 2016
92
Rm 2016 2015
Cash utilised in operations1 (47) (311)Tax paid (151) (63)
Net cash utilised in operating activities (198) (374)
Cash flows from investing activitiesAdditions to property, plant and equipment and intangible assets (26) (6)Proceeds on disposal of property, plant and equipment and intangible assets 11 1 Finance income received 275 94 Dividends received 11 825 9 691 Loans granted and equity investments 1 206 (3 167)
Net cash flows from investing activities 13 291 6 613
Cash flows from financing activitiesBorrowings incurred 2 000 2 576 Finance costs paid (292) (191)Dividends paid – equity shareholders (11 782) (11 923)Repurchase and sale of shares (68) (58)Intercompany money market movement (4 403) 5 785
Net cash flows utilised in financing activities (14 545) (3 811)
Net (decrease)/increase in cash and cash equivalents (1 452) 2 428 Cash and cash equivalents at the beginning of the year 6 176 3 748
Cash and cash equivalents at the end of the year 4 724 6 176
Notes:1. The Group changed the presentation of its statement of cash flows from the direct method to the indirect method in order to align with the Group’s ultimate parent, Vodafone
Group Plc.
Summarised Company statement of cash flowsFor the year ended 31 March
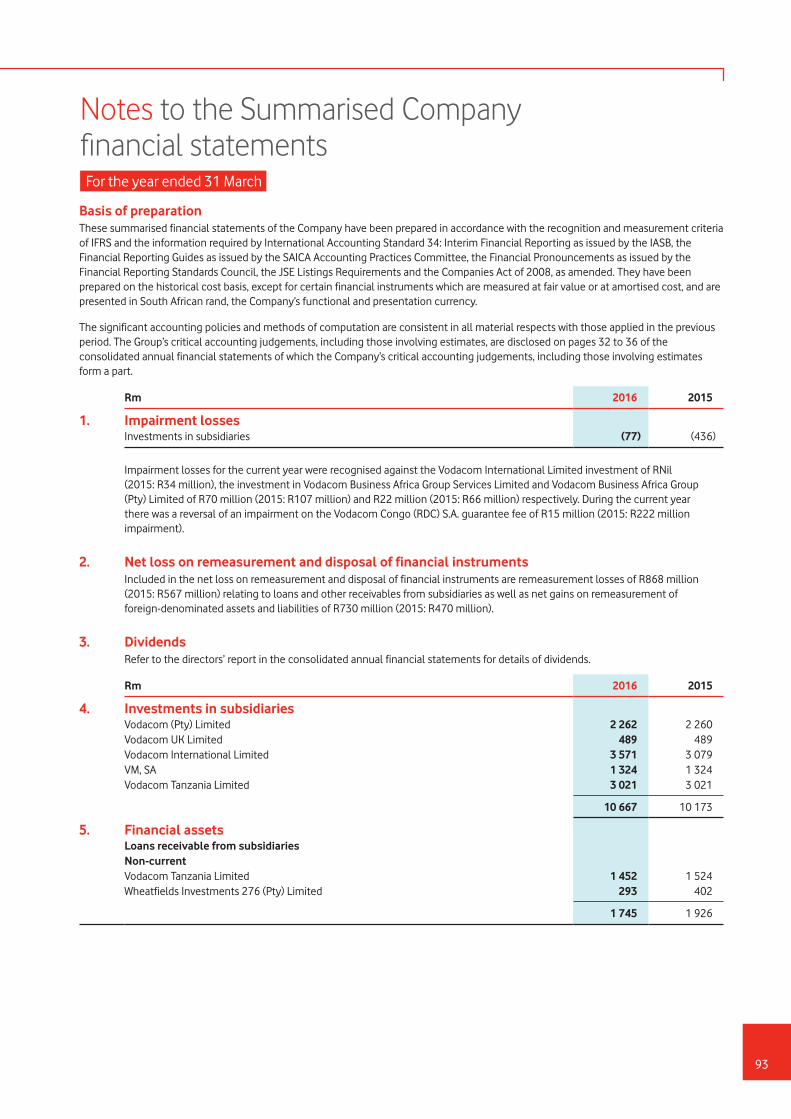
93
Basis of preparationThese summarised financial statements of the Company have been prepared in accordance with the recognition and measurement criteria of IFRS and the information required by International Accounting Standard 34: Interim Financial Reporting as issued by the IASB, the Financial Reporting Guides as issued by the SAICA Accounting Practices Committee, the Financial Pronouncements as issued by the Financial Reporting Standards Council, the JSE Listings Requirements and the Companies Act of 2008, as amended. They have been prepared on the historical cost basis, except for certain financial instruments which are measured at fair value or at amortised cost, and are presented in South African rand, the Company’s functional and presentation currency.
The significant accounting policies and methods of computation are consistent in all material respects with those applied in the previous period. The Group’s critical accounting judgements, including those involving estimates, are disclosed on pages 32 to 36 of the consolidated annual financial statements of which the Company’s critical accounting judgements, including those involving estimates form a part.
Rm 2016 2015
1. Impairment lossesInvestments in subsidiaries (77) (436)
Impairment losses for the current year were recognised against the Vodacom International Limited investment of RNil (2015: R34 million), the investment in Vodacom Business Africa Group Services Limited and Vodacom Business Africa Group (Pty) Limited of R70 million (2015: R107 million) and R22 million (2015: R66 million) respectively. During the current year there was a reversal of an impairment on the Vodacom Congo (RDC) S.A. guarantee fee of R15 million (2015: R222 million impairment).
2. Net loss on remeasurement and disposal of financial instruments Included in the net loss on remeasurement and disposal of financial instruments are remeasurement losses of R868 million
(2015: R567 million) relating to loans and other receivables from subsidiaries as well as net gains on remeasurement of foreign-denominated assets and liabilities of R730 million (2015: R470 million).
3. Dividends Refer to the directors’ report in the consolidated annual financial statements for details of dividends.
Rm 2016 2015
4. Investments in subsidiariesVodacom (Pty) Limited 2 262 2 260 Vodacom UK Limited 489 489 Vodacom International Limited 3 571 3 079 VM, SA 1 324 1 324 Vodacom Tanzania Limited 3 021 3 021
10 667 10 173
5. Financial assets Loans receivable from subsidiariesNon-currentVodacom Tanzania Limited 1 452 1 524 Wheatfields Investments 276 (Pty) Limited 293 402
1 745 1 926
Notes to the Summarised Company financial statementsFor the year ended 31 March
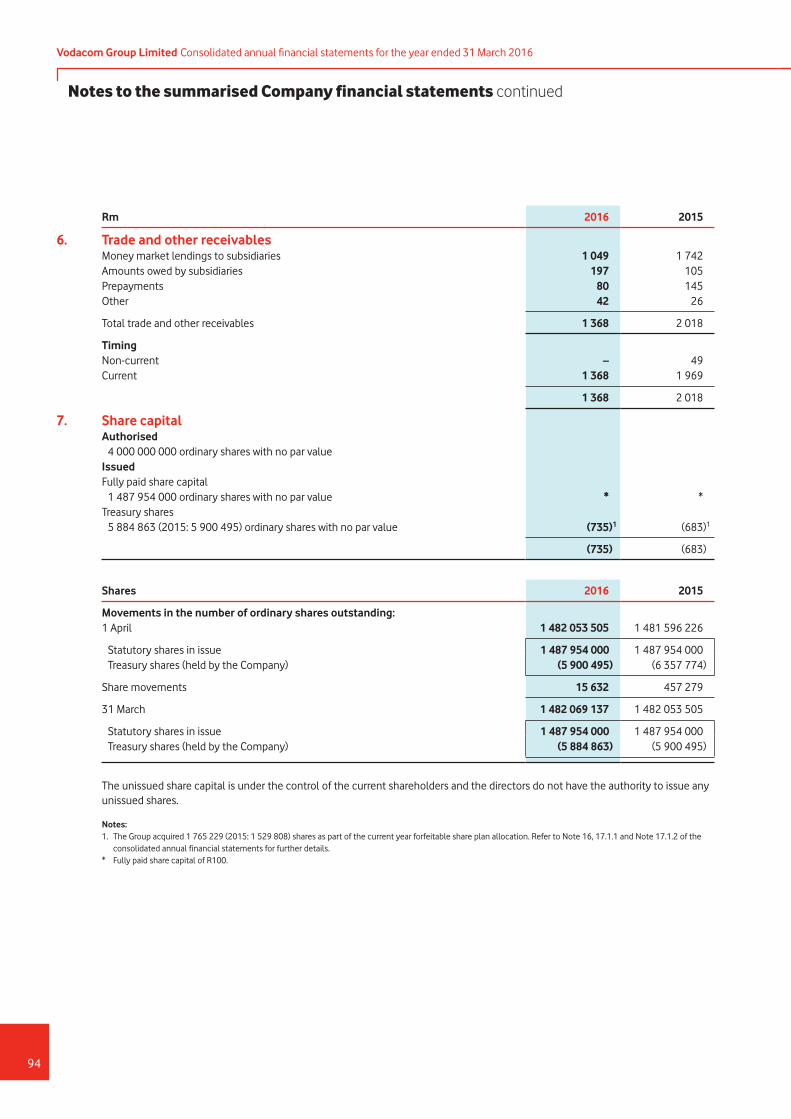
Vodacom Group Limited Consolidated annual financial statements for the year ended 31 March 2016
94
Notes to the summarised Company financial statements continued
Rm 2016 2015
6. Trade and other receivablesMoney market lendings to subsidiaries 1 049 1 742 Amounts owed by subsidiaries 197 105 Prepayments 80 145 Other 42 26
Total trade and other receivables 1 368 2 018
TimingNon-current – 49 Current 1 368 1 969
1 368 2 018
7. Share capitalAuthorised 4 000 000 000 ordinary shares with no par valueIssuedFully paid share capital 1 487 954 000 ordinary shares with no par value * *Treasury shares 5 884 863 (2015: 5 900 495) ordinary shares with no par value (735)1 (683)1
(735) (683)
Shares 2016 2015
Movements in the number of ordinary shares outstanding:1 April 1 482 053 505 1 481 596 226
Statutory shares in issue 1 487 954 000 1 487 954 000 Treasury shares (held by the Company) (5 900 495) (6 357 774)
Share movements 15 632 457 279
31 March 1 482 069 137 1 482 053 505
Statutory shares in issue 1 487 954 000 1 487 954 000 Treasury shares (held by the Company) (5 884 863) (5 900 495)
The unissued share capital is under the control of the current shareholders and the directors do not have the authority to issue any unissued shares.
Notes: 1. The Group acquired 1 765 229 (2015: 1 529 808) shares as part of the current year forfeitable share plan allocation. Refer to Note 16, 17.1.1 and Note 17.1.2 of the
consolidated annual financial statements for further details. * Fully paid share capital of R100.
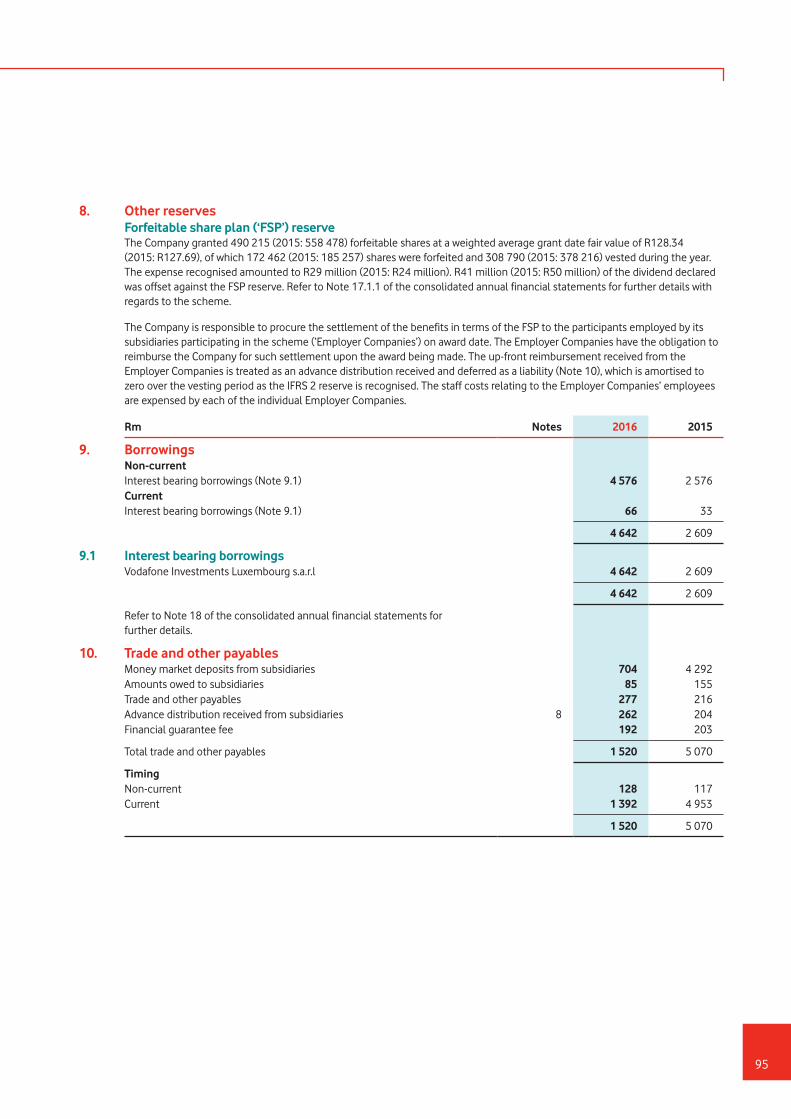
95
8. Other reserves Forfeitable share plan (‘FSP’) reserve The Company granted 490 215 (2015: 558 478) forfeitable shares at a weighted average grant date fair value of R128.34
(2015: R127.69), of which 172 462 (2015: 185 257) shares were forfeited and 308 790 (2015: 378 216) vested during the year. The expense recognised amounted to R29 million (2015: R24 million). R41 million (2015: R50 million) of the dividend declared was offset against the FSP reserve. Refer to Note 17.1.1 of the consolidated annual financial statements for further details with regards to the scheme.
The Company is responsible to procure the settlement of the benefits in terms of the FSP to the participants employed by its subsidiaries participating in the scheme (‘Employer Companies’) on award date. The Employer Companies have the obligation to reimburse the Company for such settlement upon the award being made. The up-front reimbursement received from the Employer Companies is treated as an advance distribution received and deferred as a liability (Note 10), which is amortised to zero over the vesting period as the IFRS 2 reserve is recognised. The staff costs relating to the Employer Companies’ employees are expensed by each of the individual Employer Companies.
Rm Notes 2016 2015
9. BorrowingsNon-currentInterest bearing borrowings (Note 9.1) 4 576 2 576 CurrentInterest bearing borrowings (Note 9.1) 66 33
4 642 2 609
9.1 Interest bearing borrowingsVodafone Investments Luxembourg s.a.r.l 4 642 2 609
4 642 2 609
Refer to Note 18 of the consolidated annual financial statements for further details.
10. Trade and other payablesMoney market deposits from subsidiaries 704 4 292 Amounts owed to subsidiaries 85 155 Trade and other payables 277 216 Advance distribution received from subsidiaries 8 262 204 Financial guarantee fee 192 203
Total trade and other payables 1 520 5 070
TimingNon-current 128 117 Current 1 392 4 953
1 520 5 070
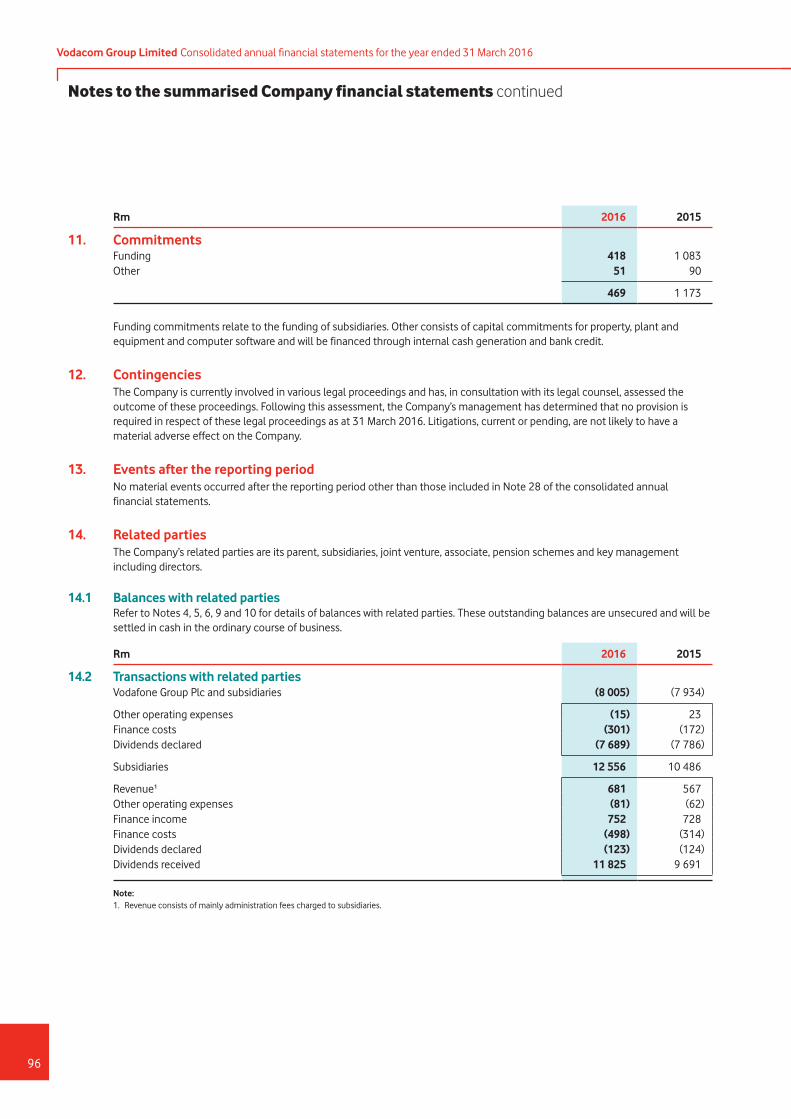
Vodacom Group Limited Consolidated annual financial statements for the year ended 31 March 2016
96
Rm 2016 2015
11. CommitmentsFunding 418 1 083 Other 51 90
469 1 173
Funding commitments relate to the funding of subsidiaries. Other consists of capital commitments for property, plant and equipment and computer software and will be financed through internal cash generation and bank credit.
12. Contingencies The Company is currently involved in various legal proceedings and has, in consultation with its legal counsel, assessed the
outcome of these proceedings. Following this assessment, the Company’s management has determined that no provision is required in respect of these legal proceedings as at 31 March 2016. Litigations, current or pending, are not likely to have a material adverse effect on the Company.
13. Events after the reporting period No material events occurred after the reporting period other than those included in Note 28 of the consolidated annual
financial statements.
14. Related parties The Company’s related parties are its parent, subsidiaries, joint venture, associate, pension schemes and key management
including directors.
14.1 Balances with related parties Refer to Notes 4, 5, 6, 9 and 10 for details of balances with related parties. These outstanding balances are unsecured and will be
settled in cash in the ordinary course of business.
Rm 2016 2015
14.2 Transactions with related partiesVodafone Group Plc and subsidiaries (8 005) (7 934)
Other operating expenses (15) 23 Finance costs (301) (172)Dividends declared (7 689) (7 786)
Subsidiaries 12 556 10 486
Revenue¹ 681 567 Other operating expenses (81) (62)Finance income 752 728 Finance costs (498) (314)Dividends declared (123) (124)Dividends received 11 825 9 691
Note: 1. Revenue consists of mainly administration fees charged to subsidiaries.
Notes to the summarised Company financial statements continued
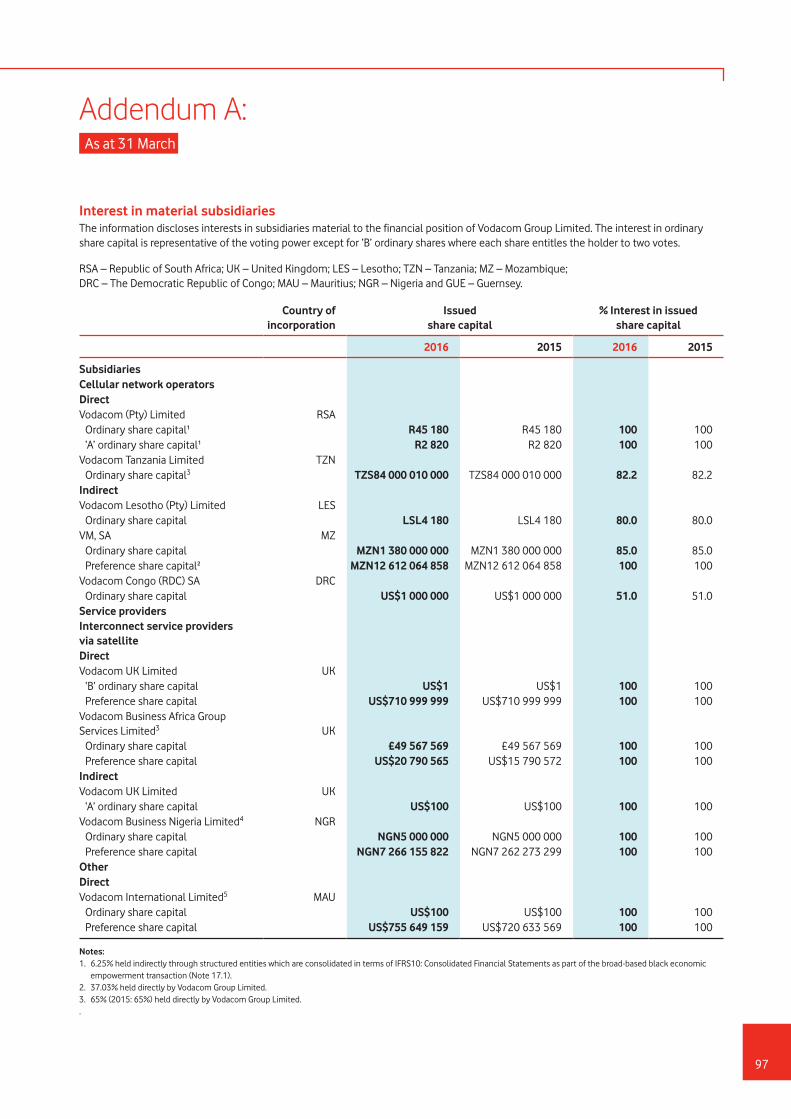
97
Interest in material subsidiariesThe information discloses interests in subsidiaries material to the financial position of Vodacom Group Limited. The interest in ordinary share capital is representative of the voting power except for ‘B’ ordinary shares where each share entitles the holder to two votes.
RSA – Republic of South Africa; UK – United Kingdom; LES – Lesotho; TZN – Tanzania; MZ – Mozambique; DRC – The Democratic Republic of Congo; MAU – Mauritius; NGR – Nigeria and GUE – Guernsey.
Country of incorporation
Issued share capital
% Interest in issued share capital
2016 2015 2016 2015
SubsidiariesCellular network operatorsDirectVodacom (Pty) Limited RSA Ordinary share capital¹ R45 180 R45 180 100 100 ‘A’ ordinary share capital¹ R2 820 R2 820 100 100Vodacom Tanzania Limited TZN Ordinary share capital3 TZS84 000 010 000 TZS84 000 010 000 82.2 82.2IndirectVodacom Lesotho (Pty) Limited LES Ordinary share capital LSL4 180 LSL4 180 80.0 80.0VM, SA MZ Ordinary share capital MZN1 380 000 000 MZN1 380 000 000 85.0 85.0 Preference share capital² MZN12 612 064 858 MZN12 612 064 858 100 100Vodacom Congo (RDC) SA DRC Ordinary share capital US$1 000 000 US$1 000 000 51.0 51.0Service providersInterconnect service providers via satelliteDirectVodacom UK Limited UK ‘B’ ordinary share capital US$1 US$1 100 100 Preference share capital US$710 999 999 US$710 999 999 100 100Vodacom Business Africa Group Services Limited3 UK Ordinary share capital £49 567 569 £49 567 569 100 100 Preference share capital US$20 790 565 US$15 790 572 100 100IndirectVodacom UK Limited UK ‘A’ ordinary share capital US$100 US$100 100 100Vodacom Business Nigeria Limited4 NGR Ordinary share capital NGN5 000 000 NGN5 000 000 100 100 Preference share capital NGN7 266 155 822 NGN7 262 273 299 100 100OtherDirectVodacom International Limited5 MAU Ordinary share capital US$100 US$100 100 100 Preference share capital US$755 649 159 US$720 633 569 100 100
Notes:1. 6.25% held indirectly through structured entities which are consolidated in terms of IFRS10: Consolidated Financial Statements as part of the broad-based black economic
empowerment transaction (Note 17.1).2. 37.03% held directly by Vodacom Group Limited.3. 65% (2015: 65%) held directly by Vodacom Group Limited..
Addendum A:As at 31 March

Vodacom Group Limited Consolidated annual financial statements for the year ended 31 March 2016
98

99

Vodacom Group Limited Consolidated annual financial statements for the year ended 31 March 2016
100


VodacomPower to you
Vodacom G
roup Limited
Consolidated annual financial statements for the year ended 31 M
arch 2016