vodafone qatar q.s.c financial results · q1 fy16 q2 fy16 q3 fy16 q4 fy17 top high medium q1 fy16...
TRANSCRIPT

Vodafone Qatar Q.S.CFinancial Results
Year ended 31 March 2017
18th May 2017
Disclaimer
• The following presentation is made only to, and is directed only at, persons to whom such a
presentation may lawfully be communicated (“relevant persons”). Any person who is not a relevant
person should not act or rely on this presentation or any of its contents.
• This presentation contains forward-looking statements that are subject to risks and uncertainties,
including statements about Vodafone Qatar’s beliefs and expectations.
• These forward-looking statements are based on assumptions that Vodafone Qatar has made in
light of its experience in the industry in which it operates, as well as its perceptions of historical
trends, current conditions, expected future developments and other factors which Vodafone Qatar
believes are appropriate under the circumstances. Prospective investors should understand that
these statements are not guarantees of future performance or results.
• Due to these factors, Vodafone Qatar cautions that prospective investors should not place undue
reliance on any forward-looking statements. Further, any forward-looking statement speaks only as
of the date on which it is made. New risks and uncertainties arise from time-to-time, and it is
impossible to predict these events or how they may affect Vodafone Qatar.
• Vodafone and the Vodafone logo are trademarks of the Vodafone Group.
2 Q4 FY17 Financial Results Presentation

Ian GrayChief Executive Officer
3
Introduction

Q1 FY17 Financial Results Presentation
Recent Performance
• Higher quality services and products
• Brand / Network perception improved
• Segmented offers allows margin management
• Introduction of more Vodafone Global initiatives
Outcome of
Progress
• EBITDA Margin continues improvement
• Cash position improved
• Strengthening of reputation
Longer Term / Outlook
• Regulatory action needed on open fixed access
• International voice revenue likely to decline further
• Data traffic and fixed will require investment
• Company in strong position to deal with challenges
4
The strategy developed last year was followed and it delivered

5
• Financial results exceeding budget, guidance and expectations
• Technical quality now leading in market
• Customer service quality now world class
• Innovative range of products, unmatched by competition
• Customer reaction now consistently positive in most segments
Company ready for next stage of growth
Short term vision clear
But amortization of original licence fee and distributable profits not well understood5 FY17 Financial Results Presentation
From turnaround… To recovery… To growth

6
Superior technical network quality
Network Availability (%)
Actual Target
Voice Drop Call Rate (%)
*Targets set by Vodafone for AMAP region
Actual Target
6 FY17 Financial Results Presentation

Q1 FY16 Q2 FY16 Q3 FY16 Q4 FY17
Top High Medium
Q1 FY16 Q2 FY16 Q3 FY16 Q4 FY17
Consumer SLA Target
World-class Customer Service
Prepaid Service LevelCalls answered within 20 Sec.
Postpaid Service LevelCalls answered within 20 Sec.
7 FY17 Financial Results Presentation

8
Innovative range of products targeting all customer segments
Platinum Gold Silver
8 FY17 Financial Results Presentation
RED
Bill Manager, Global Data,
Network Name,
Easy Donations, VIP Manager,
My Car
+Vodafone Points
180 Directory
Connect
123
Offering customers flexibility to use flex to make calls or
use data
Happy
123
Giving prepaid customers customized offers every day

Enterprise products that are simple and to the point
Business RED
Unlimited: Worry free elements of
Local Min/SMS
Inclusive International -
Roaming minutes & data
that can be used for International
& Roaming
Premiere Non Telecom Benefits:
Valet parking/ Premium concierge
service/ Airport Lounge Access
Business Value
Choice: A choice of plans offering
Bundles of local voice & data
Satisfaction: Our postpaid
bundles come at an array of prices
that will satisfy business needs.
Unique Telecom benefits: Up to
30 international minutes bonus,
upon receiving 1 hours of calls.
None telecom benefits:
Personalised Ring Back tone
suiting business needs.
Financial Summary
R.RamamoorthyChief Financial Officer
10

Financial SummaryFor the twelve months ended 31 March 2017
11
• Lower Customer Base driven by completion of one-time base
clean-up of 100k customers
• Total Revenue decline from lower margin business and MTR
offset with postpaid & fixed growth. Underlying total revenue grew
by 3.3%
• Service Revenue excluding MTR and low margin business grew
by 2.5%
• EBITDA grew by 34% and 7.1pps aided by improved market
pricing, better revenue mix and strong cost control
• Improved Net Profit (Excl Amortization) led by EBITDA flow
through
• Capital Expenditure 22% lower. Fy17 includes QR 47m from a
change in accounting policy for Asset Retirement Obligation
• All financial metrics in line with guidance
QR m 12m to 12m to YoY
(unless otherwise stated) Mar-17 Mar-16 Growth (%)
Mobile Customers (000) 1,501 1,548 (3%)
Total Revenue 2,059 2,119 (2.9%)
Service Revenue 1,941 1,967 (1.3%)
EBITDA 537 401 34%
EBITDA Margin % 26.1% 18.9% 7.1pp
Net Profit Excl Amortization* 134 (62) 316%
Net Loss (269) (466) 42%
Profit (Excl Amortization) per
Share (QR)*0.16 (0.07) n/a
Loss per Share (QR) (0.32) (0.55) 42%
Capital Expenditure 311 396 22%
Free Cash Flow 116 (134) n/a
* Profit (Excl Amortization) = Distributable Profit

Mobile Customers (000’s)
• 3% growth in Customers after completion of one-time customer base clean-up in H1
− Postpaid: 11.9% growth led by mid-range Connect plans
• Underlying YoY growth 3.3% excluding customer base clean up
12
1,283 1,296 1,311 1,214 1,229
161 190 237243 272
1,444
H2 FY15
1,501
H1 FY16
1,486
+3%
H2 FY17H1 FY17
1,457
H2 FY16
1,548
Prepaid
Postpaid
7.7%
4.2%
H2 FY17
1.0%
H1 FY16
0.0%
H1 FY17H2 FY15
7.3%
H2 FY16
2.9%5.2%
3.0%
4.1%
-5.9%
Customer
Growth
Population
Growth
Customer Growth vs. Population Growth
Mobile
CMS33.0% 32.4% 33.2% 32.3% 32.3%
FY17 Financial Results Presentation

706 671 627563
211233
264316
609
287
92727993107969 972970
H1 FY17
0.3%
H2 FY17H2 FY15
1,024
H2 FY16H1 FY16
996
Other
Postpaid
Prepaid
Mobile
ARPU
(QR)
117.6 111 102.9 102.9 103.6
Total
RMS23.2% 21.4% 20.9% 20.0% 20.7%
Total
Revenue1,163 1,066 1,053 1,000 1,059
Service Revenue (QR m)
13
• Service Revenue 0.3% higher aided by postpaid and fixed growth
• ARPU growth driven by postpaid growth
• Prepaid revenue 7.6% lower driven by
− Continued decline in international voice to VOIP and
− Competitive price pressure
• Postpaid grew by 10.1% driven by customer growth
• Total Revenue 5.9% higher impacted by higher postpaid and terminal
(launch of iPhone 7 in Q3) offset by lower prepaid revenue
FY17 Financial Results Presentation
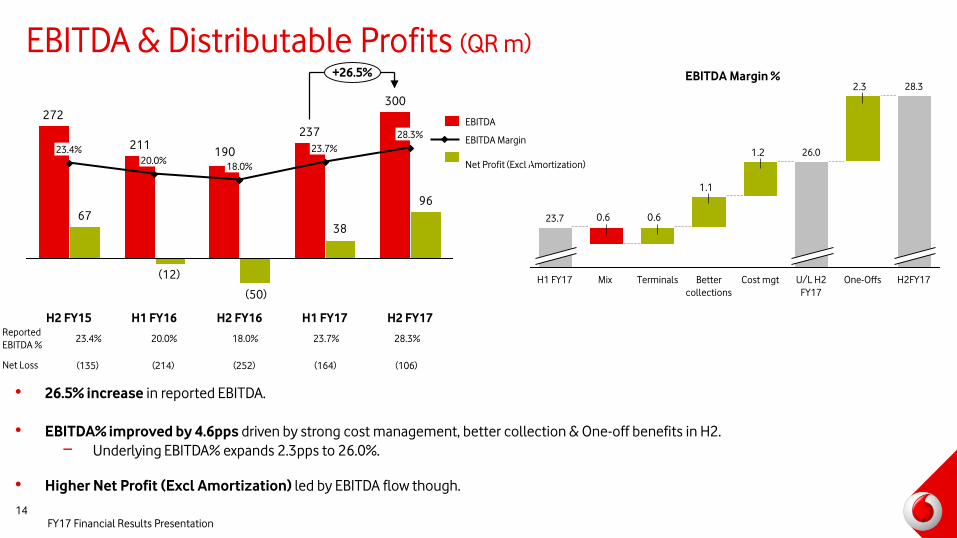
EBITDA & Distributable Profits (QR m)
• 26.5% increase in reported EBITDA.
• EBITDA% improved by 4.6pps driven by strong cost management, better collection & One-off benefits in H2.
− Underlying EBITDA% expands 2.3pps to 26.0%.
• Higher Net Profit (Excl Amortization) led by EBITDA flow though.
14
300
237
190211
272
96
38
(50)
(12)
67
H2 FY15
23.4% 23.7%
H2 FY16
18.0%
H1 FY16
20.0%
+26.5%
H2 FY17
28.3%
H1 FY17
Net Profit (Excl Amortization)
EBITDA Margin
EBITDA
EBITDA Margin % 2.3
1.2
1.1
0.60.6
26.0
U/L H2
FY17
Better
collections
TerminalsMixH1 FY17
23.7
28.3
H2FY17One-OffsCost mgt
Reported
EBITDA %23.4% 20.0% 18.0% 23.7% 28.3%
Net Loss (135) (214) (252) (164) (106)
FY17 Financial Results Presentation

CAPEX and Financing Position (QR m)
H2 increase in Capex investment driven by
− Network LTE upgrade & site roll out
− Increase in Asset Retirement obligation (ARO) provision from a change in accounting estimates
9% decrease in Net Financing due to higher EBITDA flow through
15
17193
244
152
361
47
H1 FY16
23%
-22%
218
H2 FY17
16%
9%
H2 FY16 H1 FY17
14%
H2 FY15
31%
ARO Provision
Intensity (excl ARO)
CAPEX
913
H2 FY15
758
H2 FY16 H1 FY17
777
H2 FY17
-9%
851
892
H1 FY16
Net Financing Position (QR m)
FY17 Financial Results Presentation

Questions
16

Contact Details
17
Visit our website for more information or send an email to [email protected]
www.vodafone.qa/en/investor-relations
Q4 FY17 Financial Results Presentation