voices - smart grid · voices of experience ... department of energy’s office of energy ... that...
TRANSCRIPT
Integrating Intermittent Resources. What Utilities are Learning.
August 2017
VOICES of Experience

VOICES OF EXPERIENCE | INTEGRATING INTERMIT TENT RESOURCES | DOE2
Prepared for the U.S. Department of Energy by National Renewable
Energy Laboratory under contract No. DE-AC36-08G028308, Subtask
OEPG.10294.03.01.02 in conjunction with Arara Blue Energy Group
LLC under contract LAT-5-52236-01, Subtask SG10.6020.
VOICES OF EXPERIENCE | INTEGRATING INTERMIT TENT RESOURCES | DOE 3
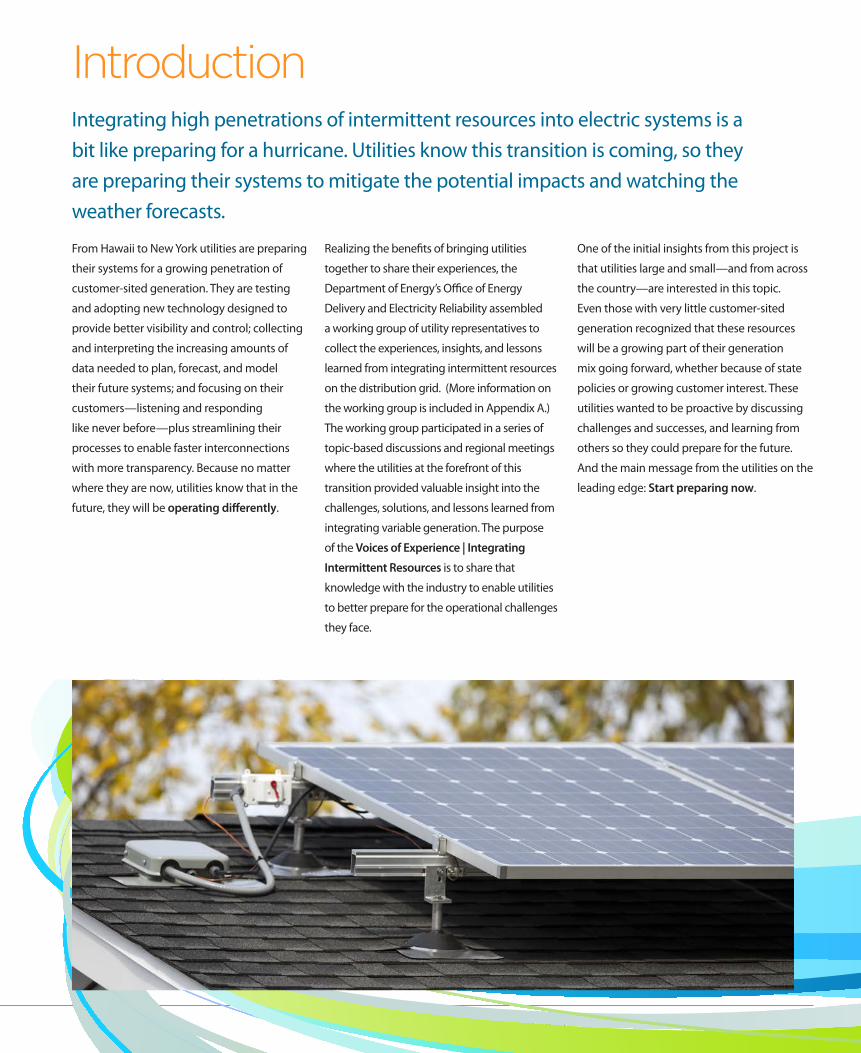
From Hawaii to New York utilities are preparing
their systems for a growing penetration of
customer-sited generation. They are testing
and adopting new technology designed to
provide better visibility and control; collecting
and interpreting the increasing amounts of
data needed to plan, forecast, and model
their future systems; and focusing on their
customers—listening and responding
like never before—plus streamlining their
processes to enable faster interconnections
with more transparency. Because no matter
where they are now, utilities know that in the
future, they will be operating differently.
Realizing the benefits of bringing utilities
together to share their experiences, the
Department of Energy’s Office of Energy
Delivery and Electricity Reliability assembled
a working group of utility representatives to
collect the experiences, insights, and lessons
learned from integrating intermittent resources
on the distribution grid. (More information on
the working group is included in Appendix A.)
The working group participated in a series of
topic-based discussions and regional meetings
where the utilities at the forefront of this
transition provided valuable insight into the
challenges, solutions, and lessons learned from
integrating variable generation. The purpose
of the Voices of Experience | Integrating
Intermittent Resources is to share that
knowledge with the industry to enable utilities
to better prepare for the operational challenges
they face.
One of the initial insights from this project is
that utilities large and small —and from across
the country—are interested in this topic.
Even those with very little customer-sited
generation recognized that these resources
will be a growing part of their generation
mix going forward, whether because of state
policies or growing customer interest. These
utilities wanted to be proactive by discussing
challenges and successes, and learning from
others so they could prepare for the future.
And the main message from the utilities on the
leading edge: Start preparing now.
IntroductionIntegrating high penetrations of intermittent resources into electric systems is a bit like preparing for a hurricane. Utilities know this transition is coming, so they are preparing their systems to mitigate the potential impacts and watching the weather forecasts.
VOICES OF EXPERIENCE | INTEGRATING INTERMIT TENT RESOURCES | DOE4
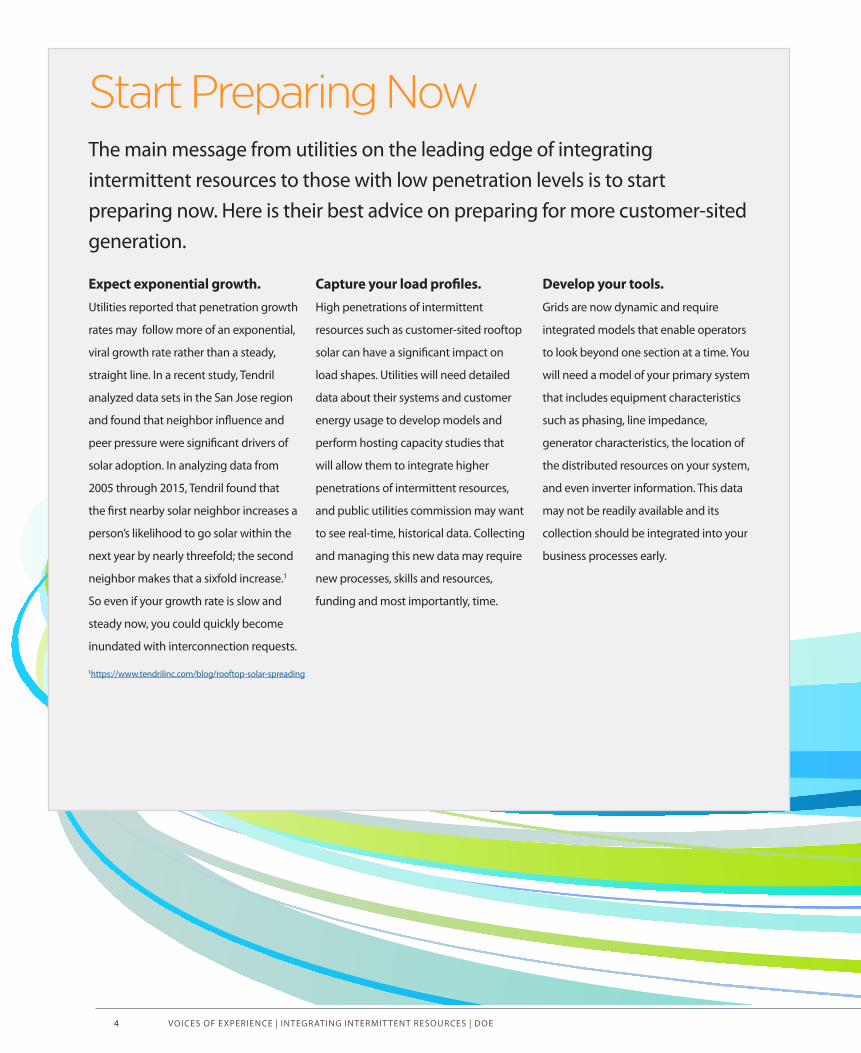
Start Preparing Now The main message from utilities on the leading edge of integrating intermittent resources to those with low penetration levels is to start preparing now. Here is their best advice on preparing for more customer-sited generation.
Expect exponential growth. Utilities reported that penetration growth
rates may follow more of an exponential,
viral growth rate rather than a steady,
straight line. In a recent study, Tendril
analyzed data sets in the San Jose region
and found that neighbor influence and
peer pressure were significant drivers of
solar adoption. In analyzing data from
2005 through 2015, Tendril found that
the first nearby solar neighbor increases a
person’s likelihood to go solar within the
next year by nearly threefold; the second
neighbor makes that a sixfold increase.1
So even if your growth rate is slow and
steady now, you could quickly become
inundated with interconnection requests.
Capture your load profiles. High penetrations of intermittent
resources such as customer-sited rooftop
solar can have a significant impact on
load shapes. Utilities will need detailed
data about their systems and customer
energy usage to develop models and
perform hosting capacity studies that
will allow them to integrate higher
penetrations of intermittent resources,
and public utilities commission may want
to see real-time, historical data. Collecting
and managing this new data may require
new processes, skills and resources,
funding and most importantly, time.
Develop your tools. Grids are now dynamic and require
integrated models that enable operators
to look beyond one section at a time. You
will need a model of your primary system
that includes equipment characteristics
such as phasing, line impedance,
generator characteristics, the location of
the distributed resources on your system,
and even inverter information. This data
may not be readily available and its
collection should be integrated into your
business processes early.
1https://www.tendrilinc.com/blog/rooftop-solar-spreading
VOICES OF EXPERIENCE | INTEGRATING INTERMIT TENT RESOURCES | DOE 5
About this Guide The information in this guide came directly from the people in the industry who are working the challenges—the ones who are interconnecting the new resources, testing emerging technology, and analyzing the data while continuing to keep their grids operating safely and reliably.
This guide started with a kickoff meeting at San Diego Gas & Electric
(SDG&E), followed by a series of conference calls about specific aspects
of integrating intermittent resources, interviews with individuals at
utilities, and a number of onsite meetings at utilities such as Pepco,
Vermont Electric Power Company (VELCO), and Salt River Project (SRP).
(More information about the working group is provided in Appendix A.)
While the effort started with 14 individuals at a handful of utilities in
states on the leading edge of this topic, the working group —those
that participated in the discussions—grew to more than 90 people
representing more than 30 utilities and organizations. Wherever
possible, this guide preserves the voices of the participants that came
through the many peer-to-peer discussions. However, the themes and
common ideas that emerged have been summarized and edited into
a single insight or experience without attribution to any one person or
organization.
Utilities that have been interconnecting intermittent resources have
learned lessons and gained insights along the way—sometimes
the hard way—that can be applied to other utilities who may be
experiencing similar challenges or are interested in preparing for
operating in the future with much higher penetration of intermittent
resources. The goal of this guide is to provide information that might
not be accessible elsewhere—the kind you might get from talking to a
colleague at a neighboring utility. A few things to note:
• All utilities are different and have unique systems and
requirements. This document is not a road map that must be
followed. It is a compilation of advice and insights that other
utilities have learned through their own experience integrating
intermittent resources.
• Much of the advice and insights (What Utilities are Learning) are
not attributed to a single source because they are summaries
from group discussions. Examples (What Utilities are Doing) from
specific utilities are included with permission from the source of the
information.
• Along the way, the working group identified a number of resources
that might be helpful, including a number of documents produced
by the Electric Power Research Institute (EPRI) and the national
labs. The lists provided are not intended to be comprehensive, but
rather offer additional information that might be useful.
And finally, this guide is not a how-to manual or technical report that
must be read from cover to cover. It is simply meant to share what
utilities are learning about the challenges of integrating intermittent
resources and what they are doing to meet those challenges.
Contents At a Glance Key Insights and Takeaways 6
Operating Differently 8
Streamlining Interconnections 11
Planning and Forecasting 23
Understanding Hosting Capacity 30
Testing Advanced Inverters 39
Engaging the Customers 46
VOICES OF EXPERIENCE | INTEGRATING INTERMIT TENT RESOURCES | DOE6
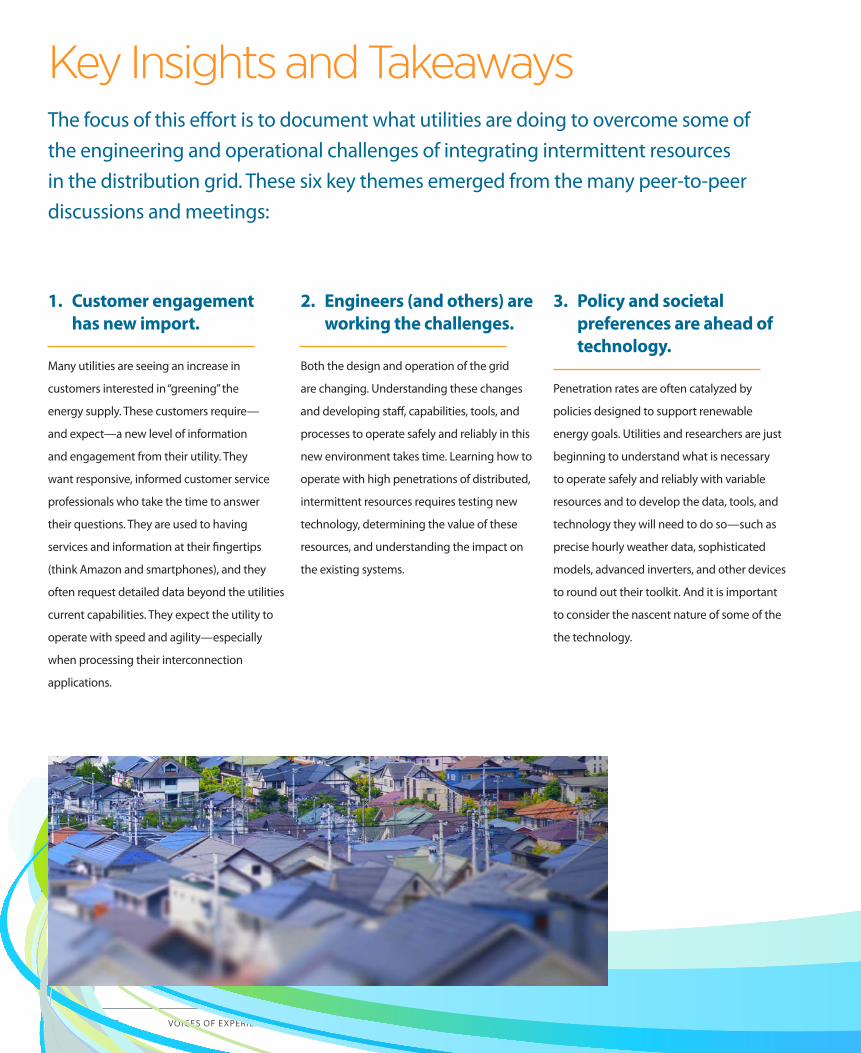
Key Insights and Takeaways The focus of this effort is to document what utilities are doing to overcome some of the engineering and operational challenges of integrating intermittent resources in the distribution grid. These six key themes emerged from the many peer-to-peer discussions and meetings:
1. Customer engagement has new import.
Many utilities are seeing an increase in
customers interested in “greening” the
energy supply. These customers require—
and expect—a new level of information
and engagement from their utility. They
want responsive, informed customer service
professionals who take the time to answer
their questions. They are used to having
services and information at their fingertips
(think Amazon and smartphones), and they
often request detailed data beyond the utilities
current capabilities. They expect the utility to
operate with speed and agility—especially
when processing their interconnection
applications.
2. Engineers (and others) are working the challenges.
Both the design and operation of the grid
are changing. Understanding these changes
and developing staff, capabilities, tools, and
processes to operate safely and reliably in this
new environment takes time. Learning how to
operate with high penetrations of distributed,
intermittent resources requires testing new
technology, determining the value of these
resources, and understanding the impact on
the existing systems.
3. Policy and societal preferences are ahead of technology.
Penetration rates are often catalyzed by
policies designed to support renewable
energy goals. Utilities and researchers are just
beginning to understand what is necessary
to operate safely and reliably with variable
resources and to develop the data, tools, and
technology they will need to do so—such as
precise hourly weather data, sophisticated
models, advanced inverters, and other devices
to round out their toolkit. And it is important
to consider the nascent nature of some of the
the technology.

VOICES OF EXPERIENCE | INTEGRATING INTERMIT TENT RESOURCES | DOE 7
4. Visibility, predictability, and control are key.
When penetrations of customer-owned
systems are low, the fact that utilities do not
have visibility of the customer’s system is less
of an issue. But as penetrations grow, the
ability to see, control, and predict the output
from distributed resources, and the aggregate
behavior at the distribution circuit level
becomes increasingly important. Computer
models of a system will tell operators what
they should see, but without monitoring,
utilities will not be able to see the actual
impacts on system performance. Advanced
automation and supporting systems enable
operators to ensure safety and reliability while
facilitating increased integration of distributed
energy resources.
5. Each situation is unique.
All distribution systems were “custom
built” over time in response to changing
populations and demand, giving each system
unique characteristics that determine the
utility’s approach to connecting intermittent
resources. Different regulatory environments
and populations may also require different
approaches to integrating customer-owned
systems, and there are costs, legacy systems,
and infrastructure to consider as well. There
is no single solution or formula for utilities to
follow; each utility must determine their own
best approach.
6. Collaboration is essential.
Adding customer-sited resources to a utility’s
generation mix adds new complexity—
both internally and externally. Planning
for the future requires a holistic view: one
where the utility must not only understand
its own resources and plans, but also,
those of its customers, regulators, and the
developers in its service territory. While it
can be challenging, collaboration and open,
ongoing communications will help everyone
understand the constraints and requirements
for safely connecting these new resources to
the grid.
Note: Even though the peer-to-peer discussions often included the implications of policy and economics, this guide does not
attempt to explore the cause and effect between policy and related technological challenges.

VOICES OF EXPERIENCE | INTEGRATING INTERMIT TENT RESOURCES | DOE8
Operating DifferentlyIntermittent resources are turning grid operations upside down. Instead of seeing voltage decrease along the length of the circuit, engineers see a rise in voltage where intermittent resources are connected. Instead of thinking about load curtailment on peak days, engineers and operators are now thinking about capacity curtailment from high solar output during times of low load. Not only do utilities need to think differently, they need to operate differently.
What are utility operators’ concerns?
· Effective grounding during high-side faults
· Reverse power flow and its impact on the substation or transmission system
· Reduced spinning reserve, which can cause frequency issues
· Need for situational awareness
· Changes to load and generation balancing
· Impact to distribution automation schemes and line regulation regarding thermal equipment rating
· Phase balance
· Distribution management system (DMS) information requirement for PV and storage systems to determine contingency or automated switching schemes
Location, Size, and Ownership
Whether the intermittent resource is utility-owned and sited or customer-owned matters to utility operators because the size and location of the
system can affect grid operations.
• Customer-owned resources can limit the utility’s options for
reconfiguring the grid to deal with system disturbances or
reliability issues. Reconfigurations can be difficult with high levels
of intermittent resources, especially in densely
populated areas.
• Utility-owned systems can be sited and sized to meet operational
needs. For example, oversizing the photovoltaic (PV) system or
changing the power factor (to provide VAR support) can help to
accommodate dips in output more easily.
• Adding small-scale intermittent generation in densely populated
urban areas where there is more load can be easier than adding
it in rural areas where there could be equipment constraints or it
could create excess generation.
• In rural areas, there is typically lower load but more land for
customers to oversize their systems, making these lines more apt to
experience disruptions and require upgrades.
VOICES OF EXPERIENCE | INTEGRATING INTERMIT TENT RESOURCES | DOE 9
Visibility and Control
Operators need to know what resources are connected to their systems and where those resources are located to operate the grid effectively.
Utilities and vendors are working on solutions that will give utilities more visibility and allow for better control.
• Utilities need feeder visibility. Utilities need to see the voltages to
understand the impact of intermittent resources on the system.
System models will tell utilities what they should see, but it isn’t
necessarily what they will see.
• Having solar data from customer-owned generation are important
for understanding the actual production from PV systems. This
information can help with planning and when restoring the system
after a disturbance.
• To restore power after a disruption, utilities will have to
accommodate load that was previously being supplied by
customer-owned systems (which trip offline during an outage)
until those systems can come back online.
• Utilities need secure, low-cost, robust communication and control
for operating the grid with intermittent resources.
• Utilities with advanced distribution management systems (ADMS)
or utilities that have mapped intermittent resources into their
system are better prepared to understand the impact of the
resources on system performance data. However, they may not
have the control they need to mitigate the issues.
Operation, Maintenance, and System Upgrades
Operating and maintenance costs may be affected by the addition of customer-sited resources, and system upgrades are often needed even when
non-wire solutions are employed.
• Traditional load-shed schedules may need to change when new
customer resources are added to a system, and determining the
exact load shed amount for under-frequency events becomes more
difficult. Protection schemes may also need to change with higher
penetrations of PV and can become complex.
• Standards, including protection standards, need to be updated
faster to reflect current conditions.
• The variability from PV systems may cause greater wear on
transformers’ load-tap changers and load regulators, creating
shorter maintenance and replacement cycles. This will have an
impact on the utility’s operating and maintenance costs (potentially
increasing them).
• Voltage regulator controllers and load-tap changer controllers are
typically unidirectional. With intermittent resources, these devices
will need bidirectional capability and protection upgrades.
• Upgrading protection relaying or reclosers could cause
coordination issues.
• Low-voltage primary systems such as 4 kilovolts (kV), which were
often installed when demands were lower, have less capacity for
hosting intermittent resources. For utilities anticipating higher
penetrations of PV on their system in the future, it might be worth
phasing out these systems and going to higher voltage options.
• Oversizing system components (such as conductor size) can enable
higher penetrations of intermittent resources in the future, but
must be weighed against cost and other factors.
• Non-wire solutions* are an option in some circumstances, but they
do not fix aging infrastructure issues.
*Non-wire solutions are system investments and operating practices that can defer or replace the need for specific infrastructure investments (e.g.,replacing wires, poles, and other electrical equipment or building new substations).
VOICES OF EXPERIENCE | INTEGRATING INTERMIT TENT RESOURCES | DOE10
Generation MixThe characteristics of the resources—e.g., fuel source, size, capacity, ramp rate, cost, contract type—in a utility’s generation mix determine how the
grid is operated and the solutions a utility will be able to employ to address intermittency.
• Current grid designs require some amount of spinning reserve or other forms of inertia to firm grid operations and limit reliability issues.
Without sufficient inertia, the system will recover from frequency events more slowly than previously experienced, which could cause the
system to collapse. With large amounts of intermittent resources (as a percentage of overall generation), a grid-level disturbance could cause
a cascading event as the intermittent resources begin to trip off line if there is no
traditional generation to back it up.
• The flexibility of the utility’s other generation sources can affect the utility’s ability to
manage intermittency. A utility with more rigid or “inflexible” base-load generation
(such as contracts for minimum generation, or resources with slow ramp rates) can
make it difficult for the utility to respond to changes in the intermittent resource. And
depending on a utility’s generation mix, high penetrations of PV may require additional
quick-start units.
• Because energy efficiency measures change feeder characteristics and the impact of
variable resources are highly dependent on the characteristics of the feeder, new efficiency
measures might cause issues on a feeder where previously there was none.
What factors determine the impact of intermittent resources?
· Location on the circuit—near substation versus end of circuit
· Circuit rating—4 kV versus 12 kV
· Urban versus rural circuit
· Circuit minimum loading
· High versus low circuit X/R ratio (reactance to resistance ratio) at location
· Aggregate distributed generation capacity
· Voltage regulation equipment
Advice on modeling your system
· Start building your distribution system model now, including equipment characteristics. You will need a model of the primary system to test out your theories.
· Build the gathering of data and mapping of resources on the system into your business processes early.
· Grids are now dynamic and require integrated models that enable operators to look beyond just one section at a time.
· Equipment models are important, but difficult to develop because the data needed such as phasing, line impedance, generator characteristics, and even inverter information are not readily available.
· Mapping the location of all distributed energy resources (DERs) on you system is imperative. Without this information, it is difficult to analyze what is happening on the system and fully understand the impact of new resources.
Additional ResourcesImpact of Low Rotational Inertia on Power System Stability and Operation
A white paper that investigates the impact of low rotational inertia on power system stability and operation, contributes
new analysis insights and offers mitigation options for low inertia impacts.
California ISO: Frequency Response Phase 2
An issue paper that describes market design limitations identified with the independent systems operator’s (ISO’s) ability to (1) position its fleet
to provide sufficient primary frequency response that maintains grid reliability during the largest contingency events and (2) incentivize and
compensate resources for frequency response capability and provision.
VOICES OF EXPERIENCE | INTEGRATING INTERMIT TENT RESOURCES | DOE 11
Streamlining InterconnectionsMore than just a technical screening, the interconnection process is also a unique opportunity for utilities to build relationships with their solar customers and the installers working in their service territories.
The interconnection process is seemingly
straightforward: the customer or installer
provides the technical specifications about
the planned system and the utility evaluates
the impacts to the grid and then either
approves the application or communicates any
necessary upgrades. However, it isn’t always
simple. Obtaining the necessary information
and keeping all parties up to date on the
application status can be challenging—
especially for utilities with large numbers
of applications or a sudden increase in
interconnection requests.
The “time to connect”—the total time from
when a customer submits a request to
interconnect to a utility’s distribution grid
to when it is operational—is an important
interconnection metric. But there are many
variables in this process that are beyond the
utility’s control. Deadlines (or timelines) for
interconnection approval vary by state and are
often determined by local utility commissions
or boards. In addition, interconnected systems
will likely have to adhere to local codes,
pull permits, and pass inspections from
Authorities Having Jurisdiction (AHJs) such as a
municipality or even homeowner associations.
Having a transparent process that customers
and installers can easily follow is very
important to overall customer satisfaction.
When the number of applications is small,
utilities have been successful at managing the
process manually through email and phone
calls between the customer and a dedicated
customer service representative. However,
utilities with high application volumes for
customer-owned rooftop PV systems are
finding that tools such as web portals are
necessary for managing the interconnection
process and keeping customers (and the
project installer or developer) informed. The
functionality of these web portals ranges
from simply providing an online method for
the customer to provide data or submit an
electronic copy of their application to fully
integrated online tools that help utilities track
the application status and manage internal
workflows. A web portal can also help utilities
process a larger volume of applications
without needing a corresponding increase in
customer service staff by automating some
of the approvals and helping reduce human
errors in the process.
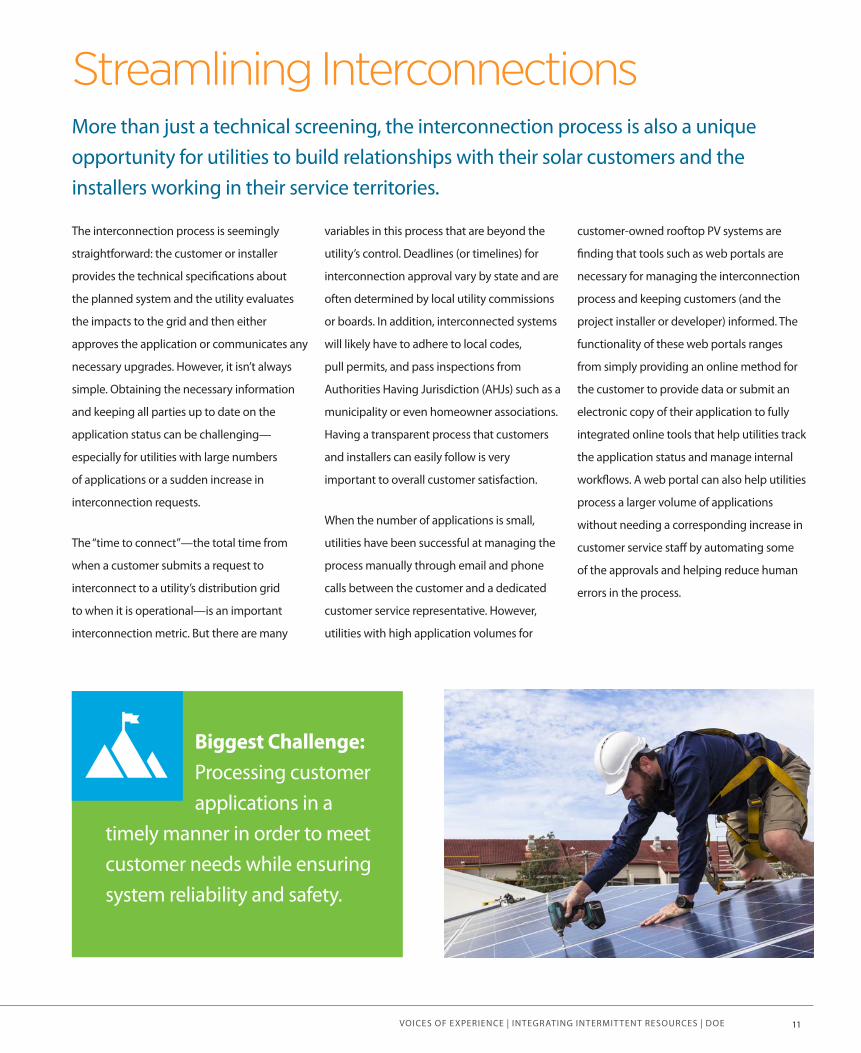
Biggest Challenge: Processing customer applications in a
timely manner in order to meet customer needs while ensuring system reliability and safety.
VOICES OF EXPERIENCE | INTEGRATING INTERMIT TENT RESOURCES | DOE12
Communicating the need for system upgrades
Often the process for communicating application approvals to customers is mandated by the state’s public utilities commission
(PUC) and it varies by state. Some utilities never deny a request to interconnect, but will approve them with conditions. For example,
the approval may include a description of a required system upgrade that the customer must pay for or instructions for “right sizing”
the system. Communicating to a customer that their interconnection will require a system upgrade that will be an additional cost
can be challenging. Below are three of the ways utilities are handling this somewhat sensitive situation.
1. Working with developers.
Communicating with developers
if upgrades are required in a given
area allows the developer to cluster
the applications and spread the
upgrade costs among multiple
customers.
2. Upfront in the application.
One option is to include this
information in the interconnection
study results with the technical
requirements and cost estimates.
Another option is a notice in the
interconnection application stating
that customers with systems that
cause high voltage or overloads to
the transformer will be responsible
for the cost of the required system
upgrades.
3. In a letter to the customer.
This allows utilities to explain, in
as simple terms as possible, what
the constraint on the system is and
the upgrade that is needed. When
the expense and requirements
are clear, the customer can decide
to upgrade or not. This may
incentivize a customer to downsize
their system somewhat so it can be
connected without upgrades.
VOICES OF EXPERIENCE | INTEGRATING INTERMIT TENT RESOURCES | DOE 13
What utilities are learning
Transparency is key. Keep customers and contractors informed throughout the application process with letters or emails that tell them when
key milestones have been met, such as approval to install, meter exchange, and authorization to operate.
Two levels of review may not be enough. Utilities with two review levels (simple and full impact) found that with increasing penetrations
they need to add another supplemental review to address small issues that are not big enough to require a full review.
An online system can save money. Customer interest in self-generation might start slow, but it is likely to grow—often exponentially—even
in states with low electricity rates. Once applications become significant, a manual process will require additional resources and could
create backlogs or delays. Although the upfront costs for developing an automated application process can be significant, it will save money
down the road.
It’s not too soon to start. The decision to move to an online or automated interconnection process is usually driven by the growth in
interconnection requests. When you see policies that are driving growth of customer-owned generation in your service territory, it is time to start
developing an automated online process because it will likely take a year to get a system operational.
It’s best to have your data in a single system. Many states require extensive reporting, and manually accessing data from several systems
can be challenging and time consuming. Once your online system is operational, you will need time to enter all the applications that were approved
manually prior to the new system so that the data in your GIS are accurate. Depending on how many applications were approved, this could be a
time-consuming task.
Think of your application system as a planning tool. Think through business processes upfront and how they will be handled, including
noncompliant customers who have installed a system but don’t have an approved interconnection application.
Make the installers allies. Work with contractors in your area to help them understand the interconnection application process and system
constraints. Some utilities are able to get information from contractors about customers who have withdrawn or decided not to move forward with
an application, which helps decrease the number of expired applications in the system.
Collaborate with AHJs. Utilities can have a number of authorities having jurisdiction (AHJs) inspecting customer systems with differing levels
of expertise and timeframes, affecting the time to connect. Work collaboratively with AHJs to help them understand the process, technology, and
system requirements. Some utilities have found that an online application process helps streamline approvals from AHJs by allowing them to
approve and demonstrate approvals online.
.

VOICES OF EXPERIENCE | INTEGRATING INTERMIT TENT RESOURCES | DOE14
Insights and advice for developing an online application process
Consider a custom tool. Utilities with high application
volumes for rooftop solar systems are choosing custom portals
even if they originally implemented an off-the-shelf solution.
Custom solutions are usually needed to create an application
processing system that integrates with other utility systems
like GIS or CIS and has the capability to manage workflow and
generate status reports, customer letters, and other automated
features.
Know how it works. Make sure you understand the
functionality of your software and how much manual intervention
will be required. Do not assume that your process will be
automated just because it’s online. Some systems may require
manual processing on the back end.
Reduce errors with menus. Application errors and
incomplete applications can cause delays and increase processing
costs for utilities. Online systems that are designed with pull-down
menus and other predefined fields help reduce these issues.
Some utility portals won’t allow the application to be submitted
without all fields complete and necessary diagrams or paperwork
uploaded.
Try before you buy. Look at all systems that are available to
determine which ones will best meet your needs, and then try
them out before making a final decision. Most vendors can set up
a demonstration site for you.
Engage users and contractors in the design process. Consider at least one focus group with customers during
development. Better yet, perform one focus group midway
through tool development and another one prior to going live to
gather feedback.
Ensure your system can route applications efficiently. Your automated system should be designed to flag installations
that will raise issues and let the others pass through the approval
process quickly, especially as volume levels rise.
Include a payment system. If there are fees involved with
your application process, consider including fee payment in your
system. Speedpay® is one service that utilities have used that can
provide online invoicing and receive electronic payment. This will
help reduce manpower and application processing time because
you won’t have to match checks with submitted applications.
Accommodate revisions and updates. Make sure your
automated system can accommodate application revisions made
by the contractor. For example, if the customer decides to change
the system size from what was approved—which happens quite
often—make sure the online system will allow the contractor
to easily revise the application instead of having to start over. In
addition, tariffs and timeline requirements can change, so your
system needs to be able to easily adapt to these.
Track approval times accurately. One utility is making sure
to include functionality that will allow it to put the time to approve
on hold when the project is put on hold. This makes it possible to
accurately track the approval timeline.
Include time to develop automated messages. Considering and writing the automated messages that your
customers will receive from the online portal takes time. Make
sure you budget the time and cost of developing these important
messages.
Don’t forget about community solar. Consider
incorporating future community solar projects (with multiple
system users) into the initial portal design. This will help with
regulatory reporting.
Develop an outreach plan. You will need to let your
customers, installers, and developers know your online tool is
available and encourage them to use it. Your communication plan
should drive traffic to the tool, provide information on how to
use it, and highlight the benefits to the users of submitting their
applications online.

VOICES OF EXPERIENCE | INTEGRATING INTERMIT TENT RESOURCES | DOE 15
10 things to consider for your online portal
1. Allow for decimal points in the system sizing field.
2. Include the capability to upload documents, diagrams, and photos.
3. Include online payment and signature options.
4. Integrate with other systems such as GIS and CIS.
5. Incorporate pull-down menus to reduce input errors.
6. Include a community solar project option.
7. Ensure the system is able to flag installations that might cause issues.
8. Allow for application modifications to address changing requirements.
9. Give customers the ability to click on a location map to get feeder information.
10. Allow contractors to designate access to multiple users and see aggregated reports for all pending applications.
Top 5 benefits of online systems
These are some of the benefits mentioned in the working group discussions:
· Improves the quality, speed, and effectiveness of the application process
· Decreases the number of errors and incomplete applications
· Provides immediate application status updates
· Streamlines the workflow processes and internal communications
· Reduces costs associated with labor hours, miles driven, and postage.
VOICES OF EXPERIENCE | INTEGRATING INTERMIT TENT RESOURCES | DOE16
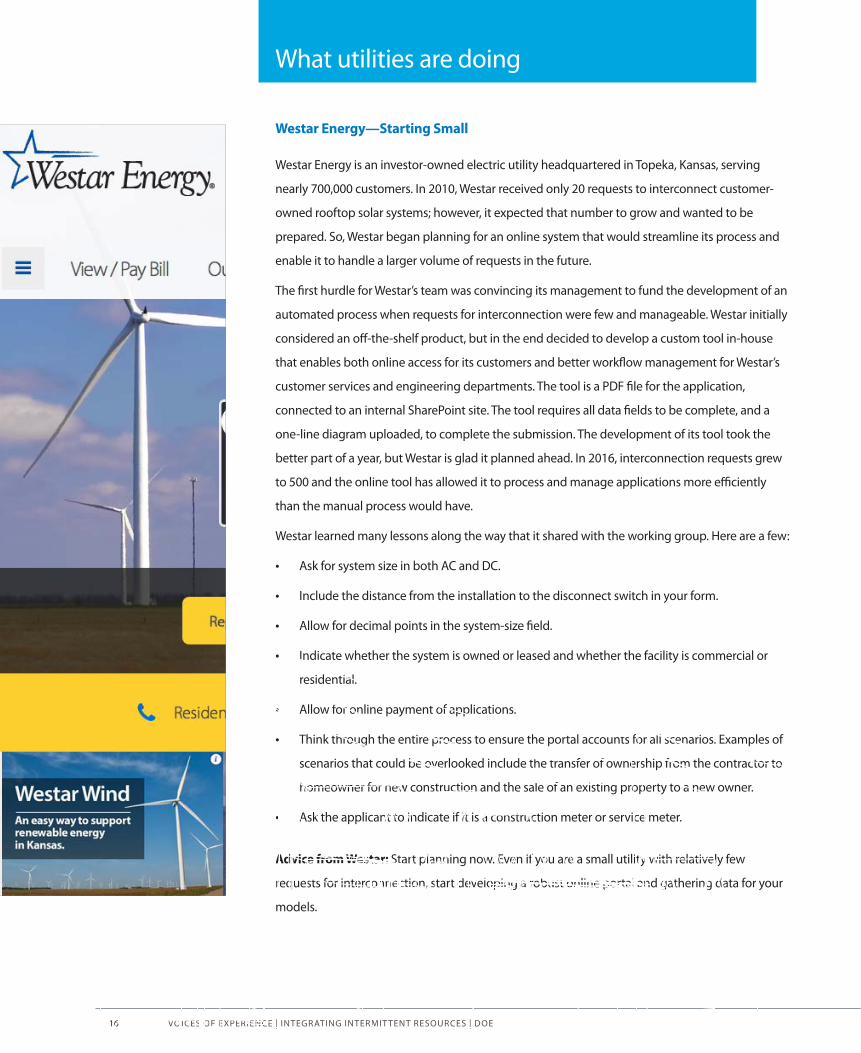
Westar Energy—Starting Small
Westar Energy is an investor-owned electric utility headquartered in Topeka, Kansas, serving
nearly 700,000 customers. In 2010, Westar received only 20 requests to interconnect customer-
owned rooftop solar systems; however, it expected that number to grow and wanted to be
prepared. So, Westar began planning for an online system that would streamline its process and
enable it to handle a larger volume of requests in the future.
The first hurdle for Westar’s team was convincing its management to fund the development of an
automated process when requests for interconnection were few and manageable. Westar initially
considered an off-the-shelf product, but in the end decided to develop a custom tool in-house
that enables both online access for its customers and better workflow management for Westar’s
customer services and engineering departments. The tool is a PDF file for the application,
connected to an internal SharePoint site. The tool requires all data fields to be complete, and a
one-line diagram uploaded, to complete the submission. The development of its tool took the
better part of a year, but Westar is glad it planned ahead. In 2016, interconnection requests grew
to 500 and the online tool has allowed it to process and manage applications more efficiently
than the manual process would have.
Westar learned many lessons along the way that it shared with the working group. Here are a few:
• Ask for system size in both AC and DC.
• Include the distance from the installation to the disconnect switch in your form.
• Allow for decimal points in the system-size field.
• Indicate whether the system is owned or leased and whether the facility is commercial or
residential.
• Allow for online payment of applications.
• Think through the entire process to ensure the portal accounts for all scenarios. Examples of
scenarios that could be overlooked include the transfer of ownership from the contractor to
homeowner for new construction and the sale of an existing property to a new owner.
• Ask the applicant to indicate if it is a construction meter or service meter.
Advice from Westar: Start planning now. Even if you are a small utility with relatively few
requests for interconnection, start developing a robust online portal and gathering data for your
models.
What utilities are doing
VOICES OF EXPERIENCE | INTEGRATING INTERMIT TENT RESOURCES | DOE 17
Pepco—Integrating Work Management
With roughly 2,000 requests for interconnection per month, Pepco launched its online
application portal in March, 2016. The planning for the portal started back in 2012 when Pepco
noticed not only a sharp increase in the volume of calls coming into their customer service
center, but also, that its customer service representatives were spending more time helping
customers understand the interconnection application process and tracking down missing
information. That’s when Pepco decided to develop an online portal to allow its customers to
input their application information and help Pepco manage the workflow, data tracking, and
regulatory reporting.
Pepco started the portal development by simplifying its interconnection application process
into two steps and reorganizing its staff around the two steps. One team is focused on helping
the customer and contractor from the time the application is received through approval to
install; the other team works with the customer from the time the system is built through the
authorization to operate.
Here are the basic components of each step:
Step 1: Application for permission to build
1. Customers enter the application information, sign, and submit the application. If a
contractor completes the application information, it must first be signed by the customer
before submitting. Pepco doesn’t see the application in their system until the customer
signs it.
2. After the application is submitted and reviewed for completeness, an automatic email is
triggered and sent to the customer and/or contractor acknowledging receipt. Engineering
is also notified that there is an application to review.
3. Three separate engineering groups are tasked with reviewing the application to evaluate
different aspects of the system and to verify that the solar installation will have no adverse
impacts on the grid. Pepco has now implemented a fast-tracking application process
through which modeling tools now allow for one centralized engineering group to review
all applications, thus expediting the approval process.
4. Once the engineering review is complete and signed off, an email is sent to the account
coordinators to say the application has finished engineering review and explaining
what needs to be done for approval (e.g., if a transformer upgrade is required) or if the
application is approved. Over 95% of the applications are approved as submitted.
5. An email is sent to the customer and/or contractor saying they have approval to install
the system and instructing them to submit the required documentation for approval to
operate their system.
VOICES OF EXPERIENCE | INTEGRATING INTERMIT TENT RESOURCES | DOE18
Step 2: From permission to build to permission to operate
1. Once the system is built, the customer or contractor submits the required documentation for part two of the application
process.
2. Pepco completes a task that automatically sends notifications to the meter department to exchange the meter and the
billing department to start the coding process to code the customers as NEM (Net Energy Metering). If an account is not
coded as NEM and Pepco sees reverse rotation on the meters, the system generates an alert of meter tampering.
3. Once the meter is exchanged, there is another system that is tied into the work management system that notifies
the customer or contractor that the exchange has been completed. This authorizes the account manager to send the
customer notification that they have permission to operate, and an email is automatically sent to the customer thanking
them for choosing to go solar and informing them that they can operate their system.
The portal has provided numerous customer benefits and fostered better internal communications between Pepco’s
engineering, billing, and metering departments. Pepco’s next step is developing an automated approval process that will run
applications through the power flow analysis to ensure that no applications are approved that could result in negative system
impacts for other customers.
Benefits of Pepco’s online application portal
• Improves the quality, speed, and effectiveness of the NEM application process
• Intuitive and interactive application process guides customers step-by-step
• Many pull-down lists and field validations for easy input
• Provides data validation, reducing application errors and missing information
• Allows customers to monitor their application’s status in near real-time through a personalized dashboard
• New online contractor account includes the ability to designate access to multiple users
• Accessible from any internet connection, including tablets in the field
• Quickly moves the application to the next step in the process
• Ability to see aggregated reports for all pending applications submitted online by contractor
• Online signature feature eliminates the need for physical signatures
• Upload attachments online—no need to email or mail supporting documents
• Saves paper and postage from printing and mailing hardcopy applications
• Provides immediate updates on missing or inaccurate information

VOICES OF EXPERIENCE | INTEGRATING INTERMIT TENT RESOURCES | DOE 19
Southern California Edison—Achieving Faster Approvals
Southern California Edison (SCE) receives around 4,000 –5,000 applications per month and has
experienced this volume of requests for interconnection for several years. In 2014, SCE realized
it would not be possible to sustain that volume with the manual processes that it was using. It
was commonly taking 50 or more days to get an application approved, which was not meeting
customers’—or the company’s—expectations. Today, SCE’s automated, online process enables
54% of its applications to be processed and approved to operate in one day.
Developing SCE’s automated process started by creating a cross-functional team from multiple
departments such as metering, engineering, and interconnection to determine where
processes could be streamlined. Using knowledge gained from past applications, SCE created
nine “screens” to determine when a project needed further engineering study. The screens
included things like the number of other solar customers on that transformer, if it is an atypical
interconnection, and if the system connects to the line tie or the breaker. If an application
fails one of the screens, then it is sent to engineering. The screens have significantly reduced
approval times for the majority of projects that don’t need further engineering review.
The company’s goal was to create a one-touch-point system where the application comes
in, one person gets it, one person analyzes and processes it, and all the documentation (i.e.,
metering, contracts, engineering, etc.) is done through the tool without requiring additional
emails or external processes. Although SCE purchased an off-the-shelf software package, it
took about a year to go from conception to an operational tool. The implementation included
hosting focus groups prior to going live and promoting the tool through workshops and other
communications.
Looking to the future, SCE is developing a more robust tool that can be extended to every
project (the current tool processes only NEM applications). The new tool will be a stronger,
higher functioning platform that integrates the interconnection process with planning,
operations, and even contracts and regulatory requirements. Development of that tool is in
the initial planning stages and will take several years to complete.
VOICES OF EXPERIENCE | INTEGRATING INTERMIT TENT RESOURCES | DOE20
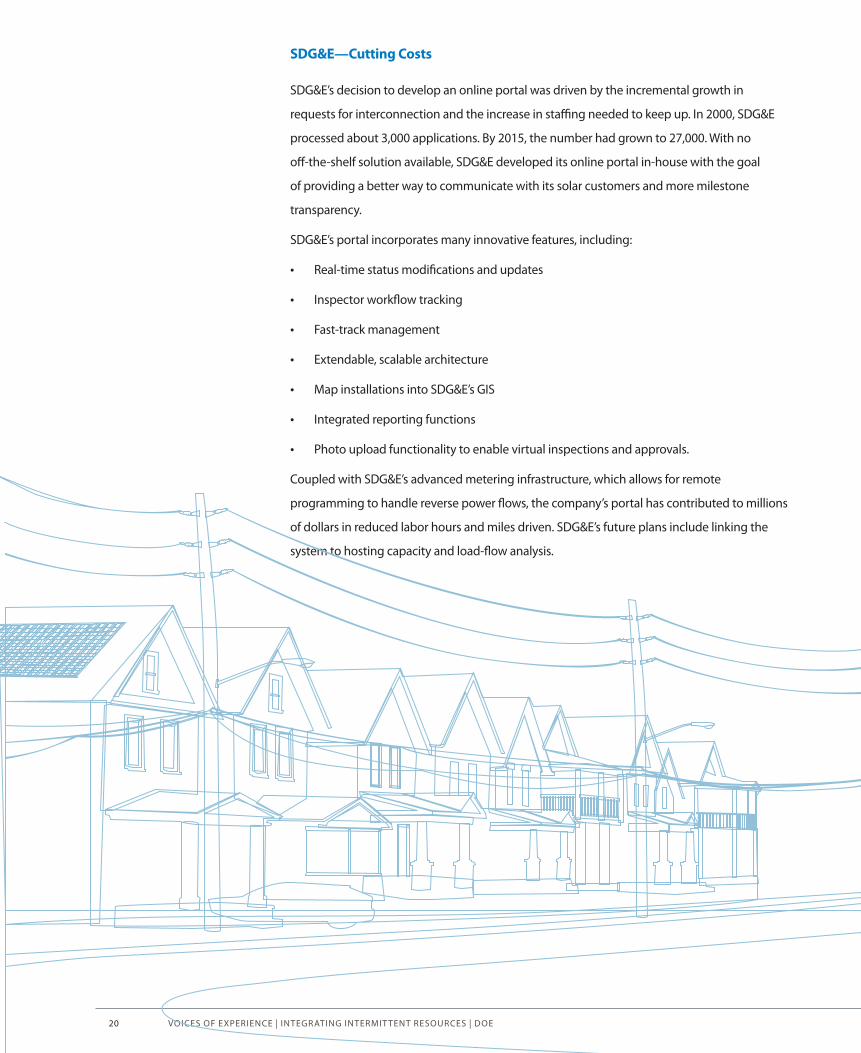
SDG&E—Cutting Costs
SDG&E’s decision to develop an online portal was driven by the incremental growth in
requests for interconnection and the increase in staffing needed to keep up. In 2000, SDG&E
processed about 3,000 applications. By 2015, the number had grown to 27,000. With no
off-the-shelf solution available, SDG&E developed its online portal in-house with the goal
of providing a better way to communicate with its solar customers and more milestone
transparency.
SDG&E’s portal incorporates many innovative features, including:
• Real-time status modifications and updates
• Inspector workflow tracking
• Fast-track management
• Extendable, scalable architecture
• Map installations into SDG&E’s GIS
• Integrated reporting functions
• Photo upload functionality to enable virtual inspections and approvals.
Coupled with SDG&E’s advanced metering infrastructure, which allows for remote
programming to handle reverse power flows, the company’s portal has contributed to millions
of dollars in reduced labor hours and miles driven. SDG&E’s future plans include linking the
system to hosting capacity and load-flow analysis.

VOICES OF EXPERIENCE | INTEGRATING INTERMIT TENT RESOURCES | DOE 21
Massachusetts Utilities—Standardizing the Interconnection Process
The Massachusetts Department of Public Utilities (DPU) has established a Technical
Standards Review Group (TSRG) to tackle technical issues related to connecting
intermittent resources. The group is composed of seven members—one member from
each of the state’s four utilities, and three non-utility members. Someone from the DPU
is a permanent member of the group. Besides tackling technical concerns, the TSRG
developed the Common Technical Standards Manual, which highlights the commonalities
and differences among the public utilities’ interconnection processes. The TSRG bylaws,
which specify that another member cannot criticize or require changes to another utility’s
processes, have fostered collaboration within the group. The TSRG has helped to increase
transparency, improve communication, and provide utilities and developers with a better
understanding of each other’s concerns and requirements.
Topics of discussion have included:
• Distribution feeder hosting capacity
• Substation transformer back-feed
• IEEE 1547
• Supplemental review for voltage-and power-quality safety and reliability
• Review of two NREL reports: Inverter Ground Fault Overvoltage Testing and Inverter
Load Witness Test Protocols
• Penetration screening of the supplemental review
• Network interconnections on both the primary and secondary.
VOICES OF EXPERIENCE | INTEGRATING INTERMIT TENT RESOURCES | DOE22
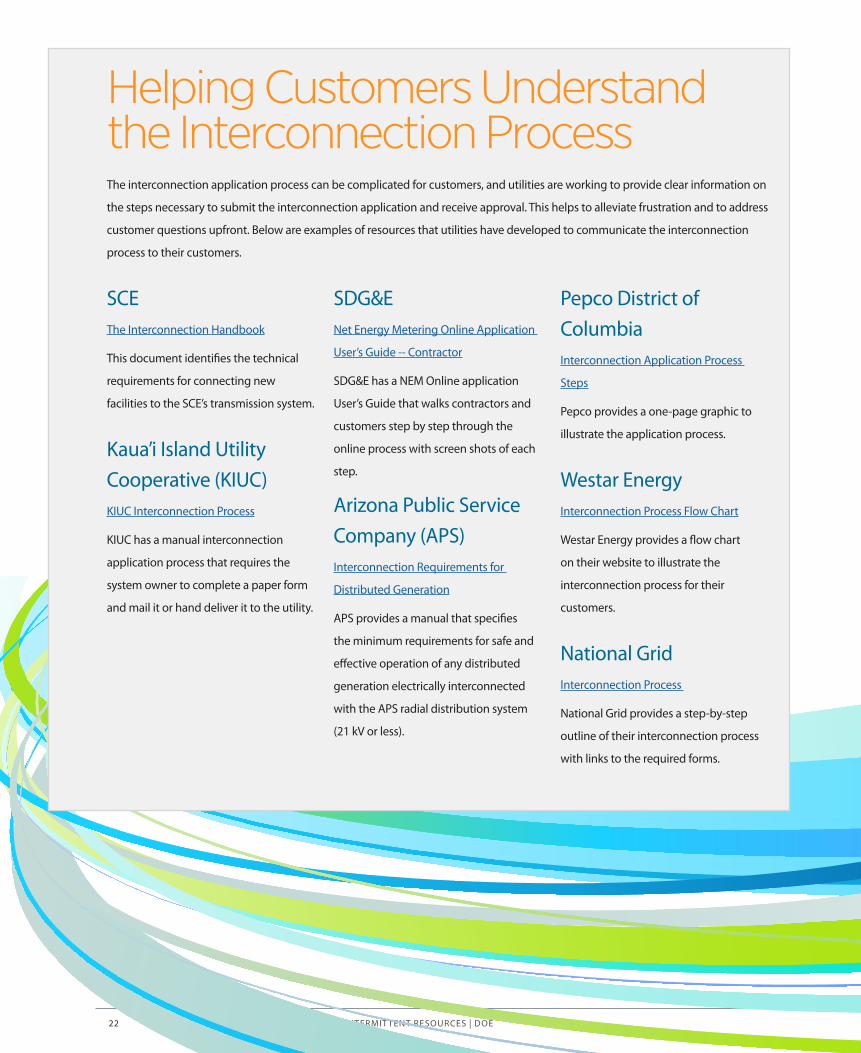
Helping Customers Understand the Interconnection ProcessThe interconnection application process can be complicated for customers, and utilities are working to provide clear information on
the steps necessary to submit the interconnection application and receive approval. This helps to alleviate frustration and to address
customer questions upfront. Below are examples of resources that utilities have developed to communicate the interconnection
process to their customers.
SCEThe Interconnection Handbook
This document identifies the technical
requirements for connecting new
facilities to the SCE’s transmission system.
Kaua’i Island Utility Cooperative (KIUC)KIUC Interconnection Process
KIUC has a manual interconnection
application process that requires the
system owner to complete a paper form
and mail it or hand deliver it to the utility.
SDG&ENet Energy Metering Online Application
User’s Guide -- Contractor
SDG&E has a NEM Online application
User’s Guide that walks contractors and
customers step by step through the
online process with screen shots of each
step.
Arizona Public Service Company (APS)Interconnection Requirements for
Distributed Generation
APS provides a manual that specifies
the minimum requirements for safe and
effective operation of any distributed
generation electrically interconnected
with the APS radial distribution system
(21 kV or less).
Pepco District of ColumbiaInterconnection Application Process
Steps
Pepco provides a one-page graphic to
illustrate the application process.
Westar EnergyInterconnection Process Flow Chart
Westar Energy provides a flow chart
on their website to illustrate the
interconnection process for their
customers.
National Grid Interconnection Process
National Grid provides a step-by-step
outline of their interconnection process
with links to the required forms.
VOICES OF EXPERIENCE | INTEGRATING INTERMIT TENT RESOURCES | DOE 23
What utilities are doingHere are some examples of how utilities are engaging their customers and stakeholders and helping them to make informed decisions.
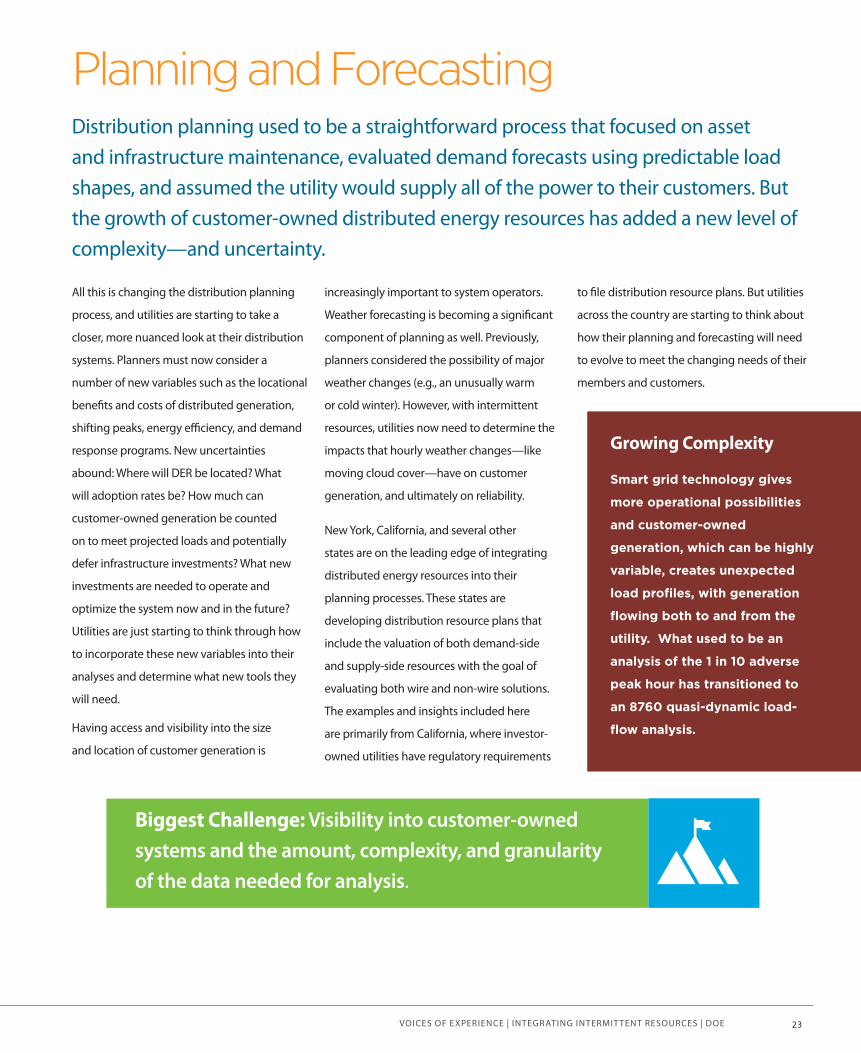
Planning and ForecastingDistribution planning used to be a straightforward process that focused on asset and infrastructure maintenance, evaluated demand forecasts using predictable load shapes, and assumed the utility would supply all of the power to their customers. But the growth of customer-owned distributed energy resources has added a new level of complexity—and uncertainty.
All this is changing the distribution planning
process, and utilities are starting to take a
closer, more nuanced look at their distribution
systems. Planners must now consider a
number of new variables such as the locational
benefits and costs of distributed generation,
shifting peaks, energy efficiency, and demand
response programs. New uncertainties
abound: Where will DER be located? What
will adoption rates be? How much can
customer-owned generation be counted
on to meet projected loads and potentially
defer infrastructure investments? What new
investments are needed to operate and
optimize the system now and in the future?
Utilities are just starting to think through how
to incorporate these new variables into their
analyses and determine what new tools they
will need.
Having access and visibility into the size
and location of customer generation is
increasingly important to system operators.
Weather forecasting is becoming a significant
component of planning as well. Previously,
planners considered the possibility of major
weather changes (e.g., an unusually warm
or cold winter). However, with intermittent
resources, utilities now need to determine the
impacts that hourly weather changes—like
moving cloud cover—have on customer
generation, and ultimately on reliability.
New York, California, and several other
states are on the leading edge of integrating
distributed energy resources into their
planning processes. These states are
developing distribution resource plans that
include the valuation of both demand-side
and supply-side resources with the goal of
evaluating both wire and non-wire solutions.
The examples and insights included here
are primarily from California, where investor-
owned utilities have regulatory requirements
to file distribution resource plans. But utilities
across the country are starting to think about
how their planning and forecasting will need
to evolve to meet the changing needs of their
members and customers.
Biggest Challenge: Visibility into customer-owned systems and the amount, complexity, and granularity of the data needed for analysis.
Growing Complexity
Smart grid technology gives
more operational possibilities
and customer-owned
generation, which can be highly
variable, creates unexpected
load profiles, with generation
flowing both to and from the
utility. What used to be an
analysis of the 1 in 10 adverse
peak hour has transitioned to
an 8760 quasi-dynamic load-
flow analysis.
VOICES OF EXPERIENCE | INTEGRATING INTERMIT TENT RESOURCES | DOE24
What utilities are learning
• Distribution resource planning can be helpful to utilities in states that have robust clean-energy goals. It can provide an open, transparent
process that produces data that regulators and stakeholders can use to meet grid modernization and clean-energy goals.
• One of the benefits of DER planning is increased stakeholder involvement. The plan can help the community, customers, and developers
understand how the system works, as well as help utilities understand the projects that developers may be planning.
• Consider a cross-functional team for distribution resource planning that includes not only distribution planning staff, but also, staff
from resource planning, customer solutions, and emerging grid technology. A cross-functional approach can facilitate coordination and
communication across groups within an organization, and it can help the utility take a more holistic view of the process.
• Getting accurate data is one of the major challenges with distribution planning, including filling in the data gaps, scrubbing the data, and
performing analyses.
• It will be helpful for planners just starting the process to look at hourly forecasts rather than only peak times. Depending on the level of detail,
planners may also need: phasing data, which can be important with two-way flow; solar resource data (such as tilt, azimuth, and shading
issues); smart inverter characteristics; and weather and geospatial data.
• Net load profiles will not provide the visibility into what is really happening on a system at specific times of the day. Utilities just beginning
to evaluate the impacts of DER should consider using advanced metering infrastructure (AMI) data for load forecasting. AMI data will provide
granular geospatial circuit load profiles, which are more informative than extrapolating load profiles from circuit net load.
• In some jurisdictions, customers are not required to inform the utility if they remove their PV installation or if it’s destroyed during a storm or
other event. This can affect planning because utilities will assume the resource is still on their system.
• With growing levels of generation that depends on weather and other environmental conditions, utilities are investigating ways to incorporate
weather forecasting into their analysis of projected load, even anticipating weather-based voltage regulation schemes in the future.
• Utilities generally manage customers as a statistical group (customer profile) in models. The characteristics of that statistical group are
changing, and utilities are trying to figure out how to include this in the planning models.

VOICES OF EXPERIENCE | INTEGRATING INTERMIT TENT RESOURCES | DOE 25
California Distribution Resource Plans
While many states have regulatory proceedings in response to increasing penetrations of DERs,
California has been out in front, especially in requiring its utilities to develop distributed resource
plans (DRPs). In 2013, California passed Assembly Bill 327, which required utilities to file DRP
proposals by July 1, 2015. The California Public Utilities Commission (CPUC) then instituted Public
Utilities Code Section 769 that provided guidance for the structure of the DRPs, including that
they will “identify optimal locations for the deployment of distributed resources.” The code defines
“distributed energy resources” as “distributed renewable generation resources, energy efficiency,
energy storage, electric vehicles, and demand response technologies.” Each proposal is required
to do the following:
• Evaluate locational benefits and costs of distributed resources located on the distribution
system. The evaluation must be based on reductions or increases in local generation capacity
needs, avoided or increased investments in distribution infrastructure, safety benefits,
reliability benefits, and any other savings that the distributed resources provide to the
electric grid or customers.
• Propose or identify standard tariffs, contracts, or other mechanisms for the deployment of
cost-effective distributed resources that satisfy distribution planning objectives.
• Propose cost-effective methods of effectively coordinating existing commission-approved
programs, incentives, and tariffs to maximize the locational benefits and minimize the
incremental costs of distributed resources.
• Identify any additional utility spending necessary to integrate cost-effective distributed
resources into distribution planning, consistent with the goal of yielding net benefits to
customers.
• Identify barriers to the deployment of distributed resources, including, but not limited to,
safety standards related to technology or operation of the distribution circuit in a manner
that ensures reliable service.
The DRPs filed by California’s investor-owned utilities provide more insight into how each utility is
approaching planning and forecasting:
• Liberty Utilities
• PacifiCorp
• Bear Valley Electric Service
• SDG&E
• SCE
• PG&E
What utilities are doingWhat utilities are doing
VOICES OF EXPERIENCE | INTEGRATING INTERMIT TENT RESOURCES | DOE26
PG&E’s Experience Implementing the California DRP Ruling
Although PG&E had included distributed resources in its planning process previously, the
CPUC ruling required it to view distributed resources in a more detailed and dynamic way.
PG&E is creating a more formal and transparent distribution planning process to ensure that
innovative solutions are considered and broader stakeholder perspectives are reflected. Here
are some of the insights PG&E shared about its planning process with the working group:
• Develop specific locational data and forecasts. This includes geospatial characteristics,
energy efficiency, PV, storage, and weather forecasts for specific locations on your system.
These data can be used to create more realistic solar output shapes in order to better
understand the specific impact these distributed resources have on load profile, capacity
and load forecasts, and system reliability.
VOICES OF EXPERIENCE | INTEGRATING INTERMIT TENT RESOURCES | DOE 27
• Look at hourly forecasts. Utilities need the ability—through tools and data—to better
understand which resources are actually reducing system peak. One suggestion to better
understand non-coincident peak forecasts is to look at hourly forecasts rather than just peak
times. Doing this has been helpful in understanding the real impact that PV might have on
the load forecast.
• Develop hourly load profiles. PG&E performed an hourly data analysis (in a DRP pilot) to
better understand the full load profile and identify the hours of the day or months of the
year where there might be an issue such as voltage violations or a thermal overload on a
substation or a voltage regulator somewhere in their system. PG&E is working towards full
utilization of hourly data analysis in both load forecasting and circuit modeling to evaluate
both wire and non-wire solutions for its system.
• Coordinate the Integrated Resource Plan and DRP processes. PG&E created the
Grid Integration and Innovation Team with people from several departments, including
distribution planning, resource planning, customer solutions, microgrid solutions, and
storage. This allows for a more holistic, integrated view of DER planning.
Insights from an Independent System Operator—ISO New England
· The six New England states are incentivizing renewables in a variety of ways, and the ISO is adjusting its short- and long-term load forecasts to account for these activities and changing resource mix.
· The ISO created the Distributed Generation Forecast Working Group as a regional forum for stakeholders to provide input into long-term forecasts of the effects of solar PV.
· ISO New England plans its system ten years into the future. Solar PV is growing rapidly, and the ISO is developing the tools it needs to predict solar PV’s rate of growth and the effect it will have on an hourly basis on the region’s loads.
· Solar PV is reducing demand on the grid during the day and is increasing the ramp of demand during the evening hours. The timing of peak energy usage is evolving, with solar reducing peak energy demand in the summer, but not in the winter.
VOICES OF EXPERIENCE | INTEGRATING INTERMIT TENT RESOURCES | DOE28
Forecasting Data and ToolsOne of the challenges of adding customer-owned generation is determining what level of generation the utility can “count on.” If a
utility includes these resources in its forecast, but the resources are not actually available when needed, this can have an impact on
resource adequacy requirements. Utilities with high penetrations of intermittent resources are learning how to use increasingly granular
data—from meters, inverters, and weather forecasts—to better predict how these resources will impact load shapes. Following are a
few examples from the utilities that participated in the working group.
Using hourly analysis to better understand load profiles.
PG&E has pilot projects underway that take a deep dive into
the hourly analysis to better understand the full load profile.
This helps to determine at what hours of the day there might
be an issue (e.g., voltage violation, thermal overload). Looking
at the hourly data, planners can determine if the issue occurs
periodically or if it occurs throughout the year, and they can then
evaluate different solutions. For example, if the issue only occurs
for two hours for a couple days in a couple of months, maybe it
can be tackled with a non-wire alternative.
In addition, PG&E is building into its tools the ability to more
dynamically and accurately understand which resources are
reducing system peak. One of the key areas has been to get more
detailed information on their non-coincident peak forecast by
looking at hourly forecasts rather than only peak times. The hourly
analysis has helped PG&E better understand the real impacts of
PV on their forecasts.
Developing new tools.
Recognizing the growing impact of more frequent, more severe
weather events—and of the exponential growth in distributed,
weather-dependent renewable generation—on day-to-day, core
operations, VELCO looked for analytical tools to substantially
improve weather forecasting and link these weather predictions
to renewable generation forecasts to better ensure grid reliability.
Not finding a tool that met its needs, VELCO spearheaded a
collaborative effort with in-state and regional partners and IBM to
develop the Vermont Weather Analytics Center (VWAC). The VWAC
provided grid operator and planners the visibility they need into
the installed capacity and location of utility- and commercial-
scale, as well as behind-the-meter, renewable generation. VWAC
also provides hyper-accurate forecasts of wind, solar, and demand.
It allows Vermont utilities to determine grid capacity for additional
solar from the transmission system down to the substation level,
and demand analysis to the substation level.
Recognizing that other utilities could benefit from these
breakthrough grid management tools, VELCO subsequently
partnered with IBM and Boston Consulting Group to launch an
energy software company call Utopus Insights. The data analytics
platform the company offers allows utilities to better forecast the
output of renewable energy resources and predict the impact
on the utilities’ load shapes. The tool that utilizes “hyper-local”
weather forecasting system coupled with leading-edge analytics
to provide best-in-world wind and solar energy forecasts is
called “Hypercast.”
VOICES OF EXPERIENCE | INTEGRATING INTERMIT TENT RESOURCES | DOE 29
Using weather data.
SDG&E has a dedicated meteorology department and has built
one of the largest utility weather networks in the United States.
The network was initially built to assist with fire risk and has 170
weather stations that measure 51 vertical levels up to 6,000 feet.
Sixty-three weather stations were retrofitted with pyranometers
to measure incoming solar radiation and predict solar generation.
Working with the University of California, San Diego, SDG&E’s
service territory has been divided into 14 climate zones and a solar
potential index was developed for each. Each day, the meteorology
department develops 48-hour forecasts that can feed into the DMS
to support short-term power flow models and daily operations.
Using these weather data, SDG&E is investigating the possibility
of developing weather-based voltage regulation schemes.
Currently, SDG&E has about 110,000 rooftop installations—about
670 megawatts of rooftop solar—whose output could change
depending on the weather forecast. The idea is that SDG&E would
schedule various modes—clear day, cloudy day, and intermittent
day—using smart inverters to operate the system. For example, on a
clear, sunny day, SDG&E might decide to turn off specific capacitors
altogether and set the power factor for the units at a particular value
based on predicted weather and associated output.
PG&E also has a meteorology department that is currently
performing a deep dive into weather data from a variety of sources
to understand some of the impacts on load profiles. They have
developed solar shapes that look at the different intermittencies and
climate zones and created expected shapes based on these data
rather than just considering a normal sunny-day profile. PG&E wants
to understand from the general planning perspective, based on
climate zones, where the solar generation shape might be reduced
because of the specific conditions in that area.
PG&E has been using LoadSEER, a tool built by Integral Analytics,
which includes some of the weather components taken from
weather station and geospatial data. The meteorology department
has been using the analytics they’ve built around irradiance
and cloud cover, using satellite imagery data, and doing some
verification with NREL’s PVWatts® calculator, to determine if the
tools that are available are consistent with the data.
Using inverter data to develop forecasts.
Access to customer generation information is important—
and challenging—as utilities perform their planning studies.
One challenge is determining exactly how much customers’
systems generate and therefore decrease load. Although the
interconnection application specifies the system size, specifics
about the area where it was installed (e.g., is it near trees that shade
it during peak times) can alter output.
To accurately account for the impact of distributed PV in planning,
Pepco uses a system to “backcast” how much generation occurred
on its system in the past using a historical irradiance service
from Clean Power Research that is based on previous weather
conditions (i.e., cloud cover, sun irradiance). The report of backcast
levels provides planners with a good picture of generation, net
load, and peak load for a feeder at peak conditions, and for the
installed solar, the ratio of installed capacity to output at the peak
hour for the feeder. Forecasting these levels is essential to planning
distribution circuits correctly.
Pepco is also working with SolarRetina—a company that crowd
sources actual PV data from customer-owned rooftop solar
systems—to compare its backcast values to real customer inverter
data. SolarRetina creates time-series data for user-specified
PV systems that utilities can download for their planning and
forecasting studies. Using SolarRetina’s data from inverters,
Pepco compares those to the backcast values to look at last year’s
numbers and compare them to the potential for the current year
or next year. The actual data can also shed light on year-to-year
differences in solar output. Pepco found that the irradiance model,
used for backcasting on an annual average, produced a slightly
higher output level than the actual systems were generating.
Additional Resources
DeMartini, Paul, “More Than Smart: A Framework to Make this
Distribution Grid More Open, Efficient and Resilient.” Greentech
Leadership Group
California Energy Commission – Distributed Generation
Integration Cost Study
VOICES OF EXPERIENCE | INTEGRATING INTERMIT TENT RESOURCES | DOE30
What utilities are doingHere are some examples of how utilities are engaging their customers and stakeholders and helping them to make informed decisions.
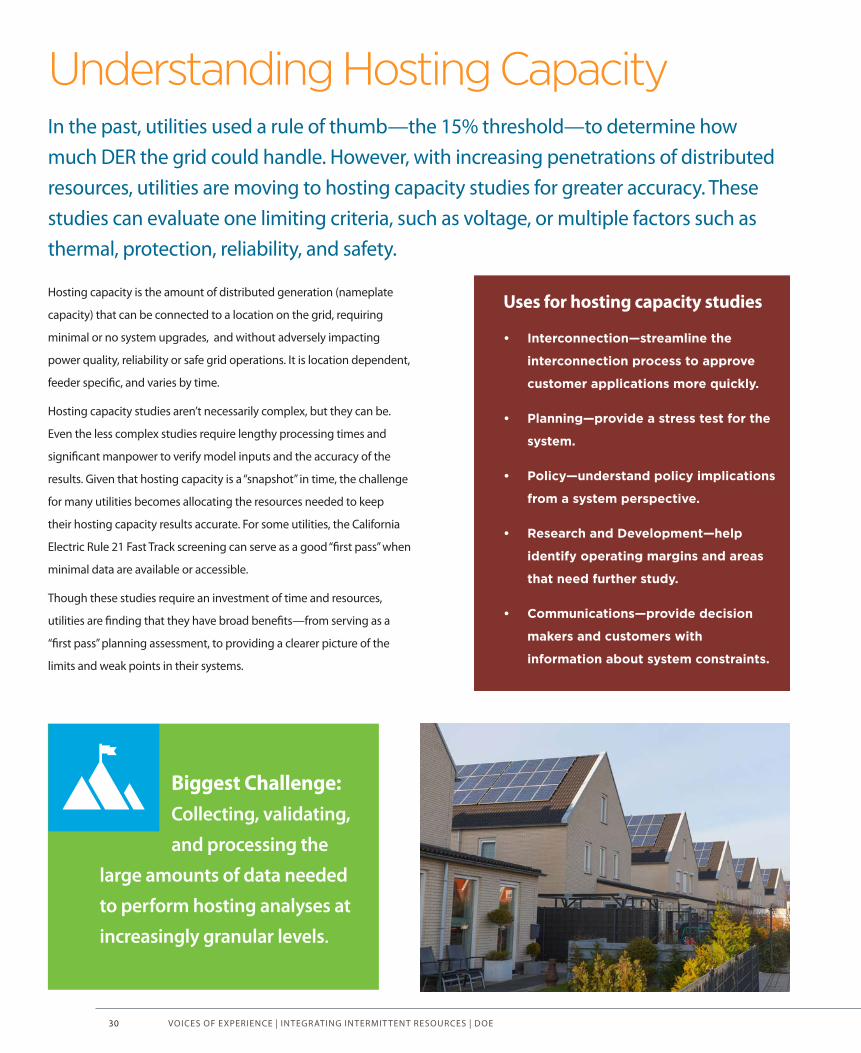
Understanding Hosting CapacityIn the past, utilities used a rule of thumb—the 15% threshold—to determine how much DER the grid could handle. However, with increasing penetrations of distributed resources, utilities are moving to hosting capacity studies for greater accuracy. These studies can evaluate one limiting criteria, such as voltage, or multiple factors such as thermal, protection, reliability, and safety.
Hosting capacity is the amount of distributed generation (nameplate
capacity) that can be connected to a location on the grid, requiring
minimal or no system upgrades, and without adversely impacting
power quality, reliability or safe grid operations. It is location dependent,
feeder specific, and varies by time.
Hosting capacity studies aren’t necessarily complex, but they can be.
Even the less complex studies require lengthy processing times and
significant manpower to verify model inputs and the accuracy of the
results. Given that hosting capacity is a “snapshot” in time, the challenge
for many utilities becomes allocating the resources needed to keep
their hosting capacity results accurate. For some utilities, the California
Electric Rule 21 Fast Track screening can serve as a good “first pass” when
minimal data are available or accessible.
Though these studies require an investment of time and resources,
utilities are finding that they have broad benefits—from serving as a
“first pass” planning assessment, to providing a clearer picture of the
limits and weak points in their systems.
Uses for hosting capacity studies
• Interconnection—streamline the
interconnection process to approve
customer applications more quickly.
• Planning—provide a stress test for the
system.
• Policy—understand policy implications
from a system perspective.
• Research and Development—help
identify operating margins and areas
that need further study.
• Communications—provide decision
makers and customers with
information about system constraints.
Biggest Challenge: Collecting, validating,
and processing the
large amounts of data needed
to perform hosting analyses at
increasingly granular levels.
VOICES OF EXPERIENCE | INTEGRATING INTERMIT TENT RESOURCES | DOE 31
What utilities are learning
• Hosting capacity information allows utilities to be proactive rather than reactive to growing demands for grid interconnections.
• When utilities have short feeders and high capacity, performing a hosting capacity analysis is less important.
• It can take years to develop a robust database that can be used to calculate hosting capacity. Start collecting and validating this information
now.
• Ensuring the accuracy of the data is a necessary, albeit time-consuming, aspect of performing hosting-capacity studies.
• There is no one method for determining hosting capacity. It can vary depending on the amount of data and the desired application of the
results.
• Even when using the same method, each utility will need to decide on the study criteria and the limits to use based on factors such as system
design practices, protection schemes, and relay schemes. The categories, however, will likely be the same and include thermal overloads,
voltage flicker, steady-state voltage, protection, and operational flexibility.
• For utilities with low penetrations, conducting a hosting capacity study for minimum load conditions should be sufficient and can be
performed with monitoring that most utilities already have in place.
• The most critical part is to have the existing model, the impedance model of the feeder, and the connectivity of devices. This is probably the
most challenging step for small utilities.
• If you don’t already have detailed data for your feeders, start by installing monitoring equipment. The data gathered will help identify
infrastructure weak points and allow you to stay ahead of demand for new distributed generation.
• For utilities without extensive monitoring or advanced metering infrastructure (AMI) in place, a good hosting capacity approximation can be
obtained using SCADA and conductor data. Supervising control and data acquisition (SCADA) can be used in conjunction with circuit power-
flow models to understand loading throughout the circuit.
• Many solar developers operate nationally and are used to receiving certain information from utilities in the areas with higher penetrations of
distributed resources. They will expect the same level of information as they enter new markets.
• Help commissions, boards, and developers understand what data are available and keep them apprised of the constraints and limitations
identified in the distribution models. If you don’t yet have the data for a more detailed analysis, work to obtain the data and keep the models
updated with where you are in the process.
What is considered high penetration?
Any level of distributed generation (DG) that does not change the voltage or the current (typically less than 10%) would be considered low penetration. Generally, anything above 10% is considered high penetration. More than 10% DG on a circuit can significantly alter voltage and current. So a model is important so as to understand the impact of those resources on the circuit. Lower penetrations can typically be accommodated without significant circuit upgrades.
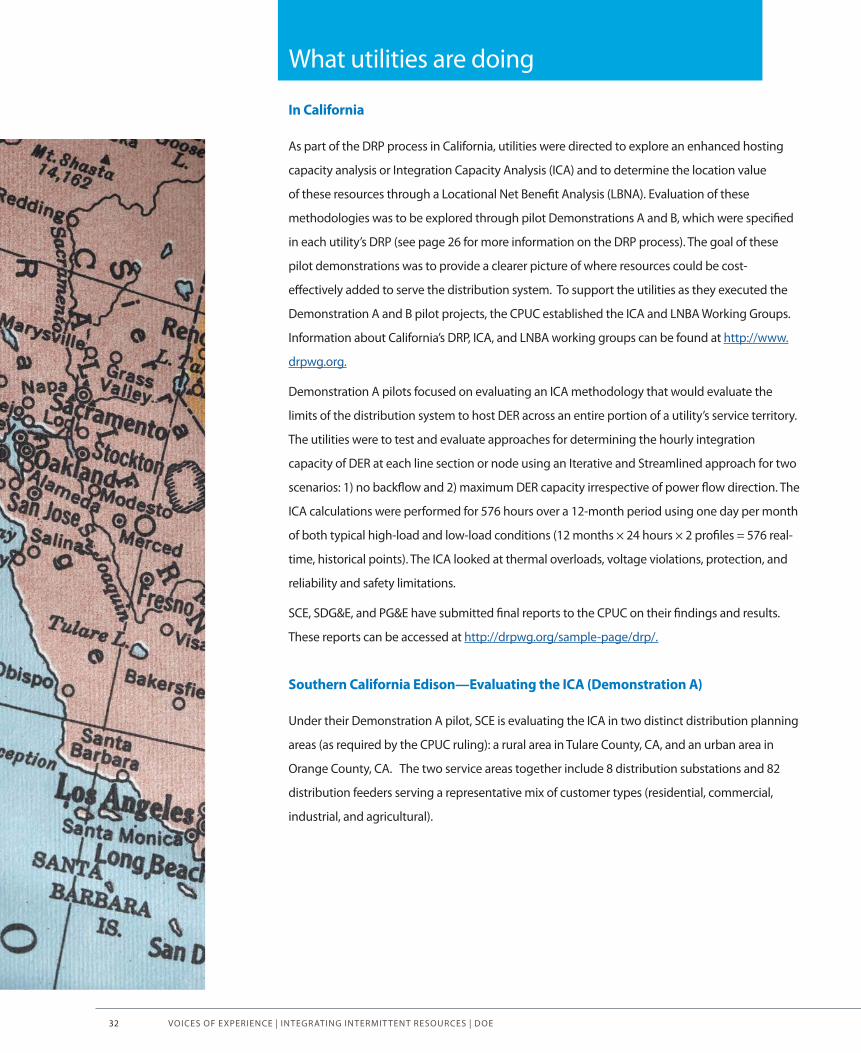
VOICES OF EXPERIENCE | INTEGRATING INTERMIT TENT RESOURCES | DOE32
In California
As part of the DRP process in California, utilities were directed to explore an enhanced hosting
capacity analysis or Integration Capacity Analysis (ICA) and to determine the location value
of these resources through a Locational Net Benefit Analysis (LBNA). Evaluation of these
methodologies was to be explored through pilot Demonstrations A and B, which were specified
in each utility’s DRP (see page 26 for more information on the DRP process). The goal of these
pilot demonstrations was to provide a clearer picture of where resources could be cost-
effectively added to serve the distribution system. To support the utilities as they executed the
Demonstration A and B pilot projects, the CPUC established the ICA and LNBA Working Groups.
Information about California’s DRP, ICA, and LNBA working groups can be found at http://www.
drpwg.org.
Demonstration A pilots focused on evaluating an ICA methodology that would evaluate the
limits of the distribution system to host DER across an entire portion of a utility’s service territory.
The utilities were to test and evaluate approaches for determining the hourly integration
capacity of DER at each line section or node using an Iterative and Streamlined approach for two
scenarios: 1) no backflow and 2) maximum DER capacity irrespective of power flow direction. The
ICA calculations were performed for 576 hours over a 12-month period using one day per month
of both typical high-load and low-load conditions (12 months × 24 hours × 2 profiles = 576 real-
time, historical points). The ICA looked at thermal overloads, voltage violations, protection, and
reliability and safety limitations.
SCE, SDG&E, and PG&E have submitted final reports to the CPUC on their findings and results.
These reports can be accessed at http://drpwg.org/sample-page/drp/.
Southern California Edison—Evaluating the ICA (Demonstration A)
Under their Demonstration A pilot, SCE is evaluating the ICA in two distinct distribution planning
areas (as required by the CPUC ruling): a rural area in Tulare County, CA, and an urban area in
Orange County, CA. The two service areas together include 8 distribution substations and 82
distribution feeders serving a representative mix of customer types (residential, commercial,
industrial, and agricultural).
What utilities are doingWhat utilities are doing

VOICES OF EXPERIENCE | INTEGRATING INTERMIT TENT RESOURCES | DOE 33
The Streamlined Method calculates one power-flow simulation for each hour in the analysis,
whereas the Iterative Method performs multiple power-flow simulations with varying
levels of DER connected to each node. The Iterative Method is similar to what SCE uses in its
interconnection process. SCE determined that the Streamlined Method could produce results
more quickly, but the Iterative Method generated more accurate results. The accuracy of the
Streamlined Method depended on the complexity of the distribution system and it was found
that it could yield sub-optimal results.
The model incorporates all existing generation (PV, combined heat and power [CHP], or any
type of generation). The result of the analysis is an hourly profile hosting capacity curve for
ten different DER types and specific profiles that show how much DER can be integrated on
every line section at every hour throughout the year. The curve can be modified based on
the technology type to be interconnected and will provide the hosting capacity for each
node. SCE is also looking into smart inverter capabilities and how they can apply that to the
hosting capacity analysis. The intent is to test the capability of SCE’s tools and system maps
to eventually perform the ICA on all circuits. SCE sees that the most immediate use of the ICA
values is to help speed up the interconnection process in addition to helping with planning
and forecasting.
In light of the ICA analysis results from the Demonstration A pilot, SCE has proposed the
implementation of a Blended ICA method across it’s territory. The Blended Method would
use the Iterative Method on the typical 24-hour, light-load day while utilizing the Streamlined
Method for the full 576 hours.
One challenge is how much information can be provided in the online map because SCE has
about 2.7 million nodes. SCE is trying to determine what information can be provided and how
it can be displayed or shared. SCE is looking at updating the hosting capacity map monthly
because updates require that the entire analysis for all the feeders be rerun to include updated
information on circuit changes.
Pacific Gas & Electric—Getting the Right Data for ICA
Getting the right data fed into the models—and making sure they were scrubbed and had
the appropriate detail to complete the ICA—proved to be challenging for PG&E. Additional
challenges were also associated with understanding the picture presented by the data and
filling in the gaps where it was lacking. Simply obtaining the information on the devices—such
as capacitor settings, regulator settings, and phasing data—can be difficult, not to mention
ensuring that the settings are properly modeled in the database. However, without these data,
developing accurate distribution power flow-models is nearly impossible.
Heat Maps
Heat maps allow
developers to easily see
which areas of a circuit
have high penetrations of
DER. However, developers
are often driven more by
market demand rather
than the information
on the maps. So, even
when provided this
information, developers
may not want to change
plans, preferring to pay
for the necessary system
upgrades over relocating
the project.

VOICES OF EXPERIENCE | INTEGRATING INTERMIT TENT RESOURCES | DOE34
One particular challenge was getting the phasing information correct. PG&E found instances
where clusters of solar units on a single phase with a regulator seeing reverse flow would
exacerbate voltage deviations even though the other phases were fine. PG&E is looking into
automatic phase detection to obtain the necessary (i.e., accurate) phasing information.
Generation data are also an area where PG&E is developing a better understanding including
how much generation data are needed for an accurate ICA. With solar units, they are
investigating whether it is necessary to know tilt, azimuth, facing direction, as well as the
type and model of the installation. PG&E is trying to determine what details are needed with
regard to smart inverters and their settings, and how to properly account for that information,
especially in their distributed energy resource management system (DERMS), where the
information is needed to properly account for the resource.
PG&E’s ICA filed with the CPUC can be found here.
Across the Nation
National Grid—Saving Time and Money
National Grid is performing a hosting capacity study and creating a circuit map that will indicate
levels of circuit hosting capacity for each feeder. The goal is to provide the information that
customers and developers need prior to submitting an interconnection application. National
Grid defines hosting capacity as the amount of distributed generation that can connect to a
distribution circuit without any (not even minor) upgrades. National Grid sees several benefits
for publishing the information; however, the primary benefit will be to reduce pre-application
information requests by giving developers and customers basic feeder information, such as
voltage, load levels, and the hosting capacity for each feeder. Currently, responding to pre-
application requests, which are free in Massachusetts, requires significant staffing and can be
costly.
National Grid has committed to the Massachusetts Department of Public Utilities that they
will have hosting capacity for 50% of their distribution feeders by the end of 2017 and all
distribution circuits by the end of 2018, with plans to update the analysis two times per year.
National Grid is using GridLAB-D for the network model and EPRI’s DRIVE (Distributed Resource
Integration and Value Estimation) tool for the hosting capacity analysis. One of the challenging
first steps to performing the study is to ensure data model accuracy. National Grid worked
for the past two years to ensure that the data in their model were accurate and current, the
correct inputs had been used, and the outputs generated make sense. The DRIVE tool has 12
criteria that can be used to calculate hosting capacity, and the inputs depend on specific feeder
characteristics and utility design parameters. Although National Grid uses CYME as the planning
tool to model its circuits for load-flow analysis and planning, GridLAB-D allows them to model
each individual feeder with more detail on component performance.
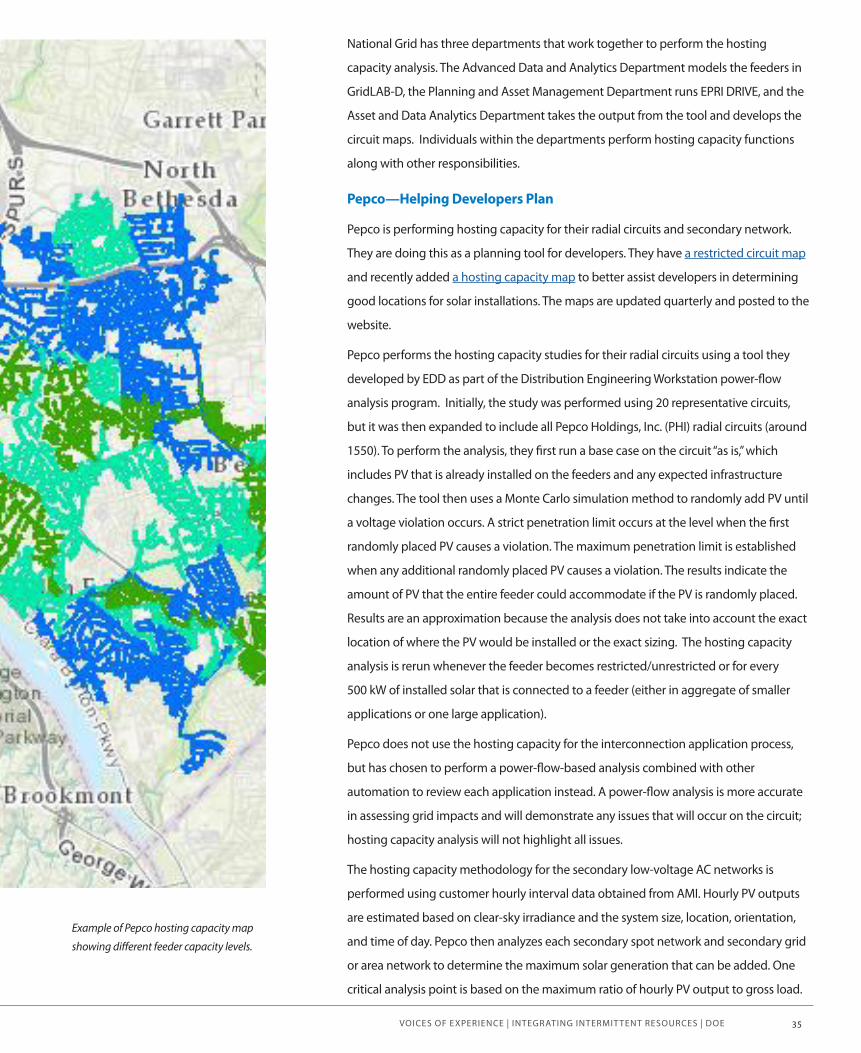
VOICES OF EXPERIENCE | INTEGRATING INTERMIT TENT RESOURCES | DOE 35
National Grid has three departments that work together to perform the hosting
capacity analysis. The Advanced Data and Analytics Department models the feeders in
GridLAB-D, the Planning and Asset Management Department runs EPRI DRIVE, and the
Asset and Data Analytics Department takes the output from the tool and develops the
circuit maps. Individuals within the departments perform hosting capacity functions
along with other responsibilities.
Pepco—Helping Developers Plan
Pepco is performing hosting capacity for their radial circuits and secondary network.
They are doing this as a planning tool for developers. They have a restricted circuit map
and recently added a hosting capacity map to better assist developers in determining
good locations for solar installations. The maps are updated quarterly and posted to the
website.
Pepco performs the hosting capacity studies for their radial circuits using a tool they
developed by EDD as part of the Distribution Engineering Workstation power-flow
analysis program. Initially, the study was performed using 20 representative circuits,
but it was then expanded to include all Pepco Holdings, Inc. (PHI) radial circuits (around
1550). To perform the analysis, they first run a base case on the circuit “as is,” which
includes PV that is already installed on the feeders and any expected infrastructure
changes. The tool then uses a Monte Carlo simulation method to randomly add PV until
a voltage violation occurs. A strict penetration limit occurs at the level when the first
randomly placed PV causes a violation. The maximum penetration limit is established
when any additional randomly placed PV causes a violation. The results indicate the
amount of PV that the entire feeder could accommodate if the PV is randomly placed.
Results are an approximation because the analysis does not take into account the exact
location of where the PV would be installed or the exact sizing. The hosting capacity
analysis is rerun whenever the feeder becomes restricted/unrestricted or for every
500 kW of installed solar that is connected to a feeder (either in aggregate of smaller
applications or one large application).
Pepco does not use the hosting capacity for the interconnection application process,
but has chosen to perform a power-flow-based analysis combined with other
automation to review each application instead. A power-flow analysis is more accurate
in assessing grid impacts and will demonstrate any issues that will occur on the circuit;
hosting capacity analysis will not highlight all issues.
The hosting capacity methodology for the secondary low-voltage AC networks is
performed using customer hourly interval data obtained from AMI. Hourly PV outputs
are estimated based on clear-sky irradiance and the system size, location, orientation,
and time of day. Pepco then analyzes each secondary spot network and secondary grid
or area network to determine the maximum solar generation that can be added. One
critical analysis point is based on the maximum ratio of hourly PV output to gross load.
Example of Pepco hosting capacity map
showing different feeder capacity levels.
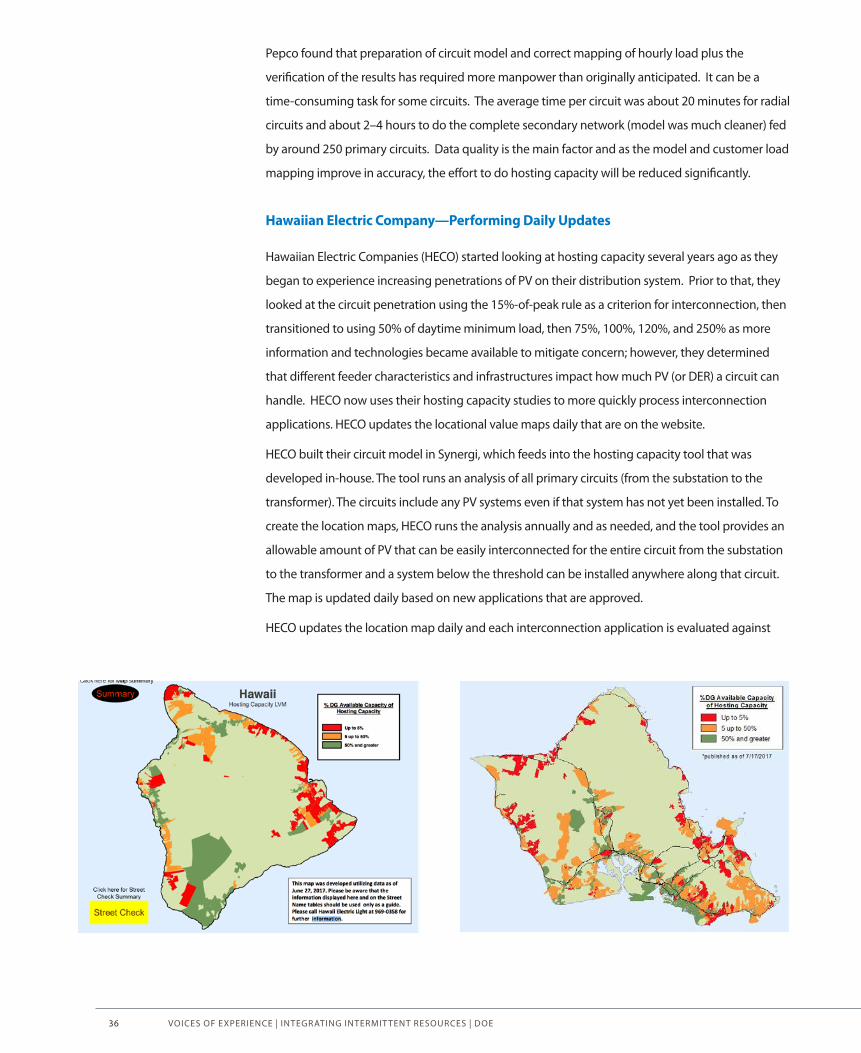
VOICES OF EXPERIENCE | INTEGRATING INTERMIT TENT RESOURCES | DOE36
Pepco found that preparation of circuit model and correct mapping of hourly load plus the
verification of the results has required more manpower than originally anticipated. It can be a
time-consuming task for some circuits. The average time per circuit was about 20 minutes for radial
circuits and about 2–4 hours to do the complete secondary network (model was much cleaner) fed
by around 250 primary circuits. Data quality is the main factor and as the model and customer load
mapping improve in accuracy, the effort to do hosting capacity will be reduced significantly.
Hawaiian Electric Company—Performing Daily Updates
Hawaiian Electric Companies (HECO) started looking at hosting capacity several years ago as they
began to experience increasing penetrations of PV on their distribution system. Prior to that, they
looked at the circuit penetration using the 15%-of-peak rule as a criterion for interconnection, then
transitioned to using 50% of daytime minimum load, then 75%, 100%, 120%, and 250% as more
information and technologies became available to mitigate concern; however, they determined
that different feeder characteristics and infrastructures impact how much PV (or DER) a circuit can
handle. HECO now uses their hosting capacity studies to more quickly process interconnection
applications. HECO updates the locational value maps daily that are on the website.
HECO built their circuit model in Synergi, which feeds into the hosting capacity tool that was
developed in-house. The tool runs an analysis of all primary circuits (from the substation to the
transformer). The circuits include any PV systems even if that system has not yet been installed. To
create the location maps, HECO runs the analysis annually and as needed, and the tool provides an
allowable amount of PV that can be easily interconnected for the entire circuit from the substation
to the transformer and a system below the threshold can be installed anywhere along that circuit.
The map is updated daily based on new applications that are approved.
HECO updates the location map daily and each interconnection application is evaluated against

VOICES OF EXPERIENCE | INTEGRATING INTERMIT TENT RESOURCES | DOE 37
the capacity threshold for that circuit. If the installation size is greater than the hosting capacity
limit, the interconnection application goes for supplemental review to look at the application
location and how that would specifically impact the circuit.
In addition to the hosting capacity analysis for the circuit on the primary side, for each application
HECO reviews for other possible conditions—including using a voltage rise/drop calculator,
which is a spreadsheet model, to evaluate the impact on voltage on the secondary side (from the
transformer to the customer). This analysis is necessary because the secondary side can experience
voltage violations due to the PV installations and a lack of diversity factor on the transformer
because most PV customers tend to generate maximum output at the same time—typically
midday rather than at various times throughout the day. (Diversity factor is a ratio of the maximum
output of all of the systems at any given time to the sum of the non-coincident maximum out of
each individual system.)
Salt River Project—Using EPRI Drive
Salt River Project (SRP) has performed hosting capacity studies on all of its1,400 feeders. SRP serves
about 1,000,000 customers with an average solar penetration of 2% although some feeders have
much higher penetrations. Feeders are typically between 2–5 miles long and are looped.
SRP models their distribution system using Synergi. The EPRI MAI (Model A Interface) tool is used
to extract and manipulate the Synergi model data to create files that can be used by the EPRI
DRIVE tool, which provides the actual hosting capacity results. The conversion by MAI is the most
time-consuming part of the hosting capacity analysis. Evaluation of 1,400 feeders can take up to 40
hours; therefore, SRP evaluated smaller planning areas with about 100 feeders each and stores the
files for future use by DRIVE. This method proved to be more manageable and efficient.
During the initial studies, SRP evaluated its distribution feeders in a normal configuration. However,
other configurations will be evaluated as needed for specific studies such as new large solar
interconnections and extreme weather days. The newest version of EPRI DRIVE will include existing
PV installations on the feeder in the evaluation, so SRP will update its Synergi model to include
existing solar and redo the analysis using this new capability on future studies.
VOICES OF EXPERIENCE | INTEGRATING INTERMIT TENT RESOURCES | DOE38
Additional ResourcesEPRI’s DRIVE: Although utilities use a variety of methods to calculate hosting capacity, one tool
that many are using is EPRI DRIVE. (Utilities in New York agreed to use DRIVE, which will then
feed into each utility’s planning tools.) DRIVE uses a non-iterative method to calculate the
amount of DER that can be accommodated in a specified area to identify issues and to assess
mitigation solutions. EPRI is currently developing additional tool capabilities and has created
interfaces to a number of utility planning tools. (See Appendix B for more information on
DRIVE.)
More resources cited by the working group include:
• Sandia National Laboratories Report, Alternatives to 15% Rule
• EPRI Report: Distribution Feeder Hosting Capacity: What Matters When Planning for DER?
• EPRI information on Distributed PV Monitoring and Feeder Analysis
Selecting the method for calculating hosting capacity
Which method to use to determine hosting capacity depends primarily on the amount of data and the desired application of the results. Consider what the analysis will be used for to determine the granularity that is needed. Using representative circuits will work for R&D and policy; interconnection and planning require a higher level of detail.

VOICES OF EXPERIENCE | INTEGRATING INTERMIT TENT RESOURCES | DOE 39
Testing Advanced Inverters Advanced (or smart) inverters are a technology that may help utilities better integrate customer-owned distributed generation. Because the advanced functionality is relatively new, utilities are using field tests and demonstration projects to better understand how the inverters can be used to support their operational objectives. Traditionally, utilities have used line regulators and capacitors to keep
voltage within certain limits. Advanced inverters are another tool utilities
can use to support voltage and power quality, and mitigate system issues
created by increasing penetrations of renewable resources.
Utilities with high penetrations of customer-site generation are
investigating how to effectively (and securely) communicate with and
control smart inverters; how these devices might be used to mitigate
fluctuations in voltage, current, and frequency; and how they can best
operate on their own and in conjunction with other devices and control
methods employed by the utilities.
While this initiative did not include a comprehensive look at the many
advanced inverter pilot projects taking place across the nation, the
examples provided by the working group participants illustrate some of
the different system designs and functionalities being studied, as well as
a variety of study methodologies and approaches. Information and data
gleaned from the advanced inverter pilot projects will help the industry
better understand the capabilities, benefits, and limitations of these
promising tools. However, it is necessary to read the studies carefully. The
details are important and can impact results.
.
Biggest Challenge: Robust communications capabilities
and standard protocols to optimize advanced inverter
functionalities.
Lessons from pilot projects and inverter testing
· Programming is different for different inverter manufacturers. Some differences include:
• + or - can mean either leading or lagging depending on the manufacturer.
• For 0.9 power factor (PF), some manufacturers use .9 and some use 9000.
· An inverter PF setting doesn’t necessarily go through 0 when a utility needs to shift from producing to absorbing VARs.
· Some inverters are easier to program than others and allow more clearance for linemen to work. When evaluating inverters, look at what it will take to program the inverter.
· Be aware that the technology is still maturing.
· Protocol is a big issue. Many manufacturers use their own proprietary version of Modbus.
· Underwriters Laboratories (UL) certification process for advanced inverters is challenging.
· Robust inverter standards are needed for advanced inverter technology.*
· More collaboration is needed between the vendors and the utilities to work through the technical challenges.
· Firmware updates can be challenging.
· Utilities need to determine what is necessary versus what is optimal.
*Note: IEEE 1547 will address some of these issues, but more standards are needed.
VOICES OF EXPERIENCE | INTEGRATING INTERMIT TENT RESOURCES | DOE40
What utilities are learning
• Advanced inverter functionality behaves differently depending on feeder characteristics.
• More robust communications systems are needed for the monitoring and control of real-time operations of customer generation.
• Communicating with inverters on the system, such as sending new settings, is not a trivial issue. Most inverter manufacturers use
proprietary software and protocols and have their own approach to programming.
• Modbus is not a secure protocol and has significant limitations. A new protocol may be needed. Utilities are working to develop approaches
to keep their networks secure when communicating with devices using Modbus.
• Testing can provide greater understanding of how the inverters really work and what it will take to program them—which can be different
for different manufacturers. It can even uncover limitations that manufacturers weren’t previously aware of.
• Some inverters may not retain remote setting changes. One utility found that when the sun sets, the inverter would turn itself off and reset
to the default settings. Another found that once the programmed period expired, the inverter reset to default settings rather than adjusting
to the new set point.
• Some inverters will only provide reactive capacity when the sun is shining. This could be a significant issue from a voltage violation
perspective. For example, if the inverter is maintaining voltage but the set point resets at sunset, unexpected voltage deviation could occur.
• Make sure you define what “real time” means to avoid latency issues. What real time means to utility operators is not necessarily what
real time means to network providers. For one utility, real time was 100 milliseconds, but the inverter manufacturer interpreted real
time as 1–2 seconds.
• Some utilities are deciding to bring the communications work they had previously outsourced to contractors in house so they can have
more reliable monitoring.
• Advanced inverters are capable of collecting readings for Watts, VARs and current. However, a reading from an inverter is not as
accurate as a reading from a meter, and can be off by 1%–3%. The question is whether the inverter reading accuracy is within
acceptable limits for operations.
• When thinking about advanced inverters, don’t lose sight of the bigger picture. Although addressing issues on the distribution system
might be the most immediate need—and installing a limited number of advanced inverters might mitigate these issues—transmission
impacts should also be considered. With higher penetrations of distributed generation, it may be necessary to have advanced inverters on
all installations to avoid negative impacts on transmission.
• Cost trade-offs of inverter solutions versus traditional electromechanical solutions might be different on a new circuit designed with high
penetrations of PV in mind, compared to a legacy circuit designed without that criterion.
• The technology (i.e., inverters, communication paths, controllers) is not mature and is still under development, and firmware
updates can be a big problem. Many firmware updates must be done in the field and cannot be remotely updated. This can be time
consuming and costly.
VOICES OF EXPERIENCE | INTEGRATING INTERMIT TENT RESOURCES | DOE 41
There are many
variables that affect the
results of pilot studies,
including the type of
inverters used, what
is being measured,
and the characteristics
of the system. When
reading reports about
other demonstration
projects, remember
that the devil is in the
details.
SRP—Retrofitting Existing Customers’ Inverters
Salt River Project, an Arizona utility, is seeing its grid transition from one with centralized
generation to one with increasing amounts of generation owned and located in its customers’
backyards. To accommodate this change, SRP launched an inverter pilot study to explore system
design changes, and inverter settings, communications, and control requirements that will allow
it to continue providing quality service while minimizing costs for all customers.
The pilot study included installing a test bed designed to resemble a residential system. The test
bed proved useful in informing the selection of inverters for the project, determining project
objectives, and identifying potential issues before involving the customers.
Using insights from the test bed, SRP is evaluating these three scenarios:
1. Set and Forget: Provide given set points for 400 customers’ inverters.
2. Limited Communication: Send seasonal changes to settings for 250 advanced inverters.
3. Full Communication and Control: Perform real-time communications and control using a
mini advanced distribution management system (ADMS) to control 120 advanced inverters
on a single circuit.
The third scenario is being tested on a circuit that is connected to a substation with a large
commercial PV system. With the scaled-down approach for this scenario, SRP hopes to gain a
better understanding of how to optimize voltage profile and power quality using advanced
inverters in coordination with the mini-ADMS, prior to rolling out a full-scale ADMS.
The SRP project is unique in that it focuses on retrofitting existing solar customers’ inverters in a
community that already has a high penetration of rooftop solar systems. It is also the first study
of its kind to evaluate advanced inverters from the customer’s side of the meter. The pilot study
results thus far provide a number of valuable insights:
• Educate customers upfront about the study, including FAQs on retrofitting and firmware
updates. SRP posted information on its website and held focus groups prior to the study. It
found that many solar customers were interested in participating because they wanted to
help SRP learn how to connect and manage more solar on its grid.
• If the solar company handling the retrofit is different from the original installer, it could void
the solar system warranty. Developing good relationships with local installers and engaging
them in the project helped mitigate warranty issues.
• SRP installed a dedicated generation meter at each customer site so that customers can view
on their portal the amount of energy their system produced the day before, and SRP can
know exactly what is happening with the PV system.
The pilot study involves 20 different departments, making internal coordination important.
What utilities are doing
VOICES OF EXPERIENCE | INTEGRATING INTERMIT TENT RESOURCES | DOE42
Get involved with
standards. Standards
are being developed
and updated to include
advanced inverter
functionality. This
work is important
and the utility
perspective needs to
be represented in that
discussion.
Duke Energy—Identifying Latency Issues
The overwhelming majority of solar installations connecting to Duke Energy’s grid are distribution-
scale (between 1 and 5 MW). These distribution sites are primarily third-party owned and operated.
Duke began constructing a 80-MWdc (about 60-MWac) transmission-connected system in 2015
that came online by early summer 2016.
Duke’s primary objective at this site was to implement dynamic voltage response to transients at
the point of interconnection, with the goal of responding to transients within 100 milliseconds (6
cycles). After completing construction however, Duke Energy found there were roundtrip latencies
in the communications network around 1–2 seconds. This baffled its engineers because they were
using a fiber network where communications happened in microseconds.
After reaching out to the inverter manufacturer, Duke Energy discovered that when a set point
is received at the inverter, it takes the inverter 200–250 milliseconds to implement the set point.
This unexpectedly long latency proved a significant obstacle, and the difference in perceptions
of real-time between the utility and the manufacturer made achieving the project goal infeasible.
It should be noted that due to the pace and advancement of inverter technologies, the
manufacturer(s) could have addressed latencies in newer firmware/models.
The lesson learned is that even in an ideal network with absolutely no latency, there would still
be inverter latency. Although Duke Energy’s project was transmission-scale, a similar issue would
occur at the distribution level if a utility were trying to do a communications-based voltage
response with some algorithm or power-plant controller.
Arizona Public Service—Investigating Advanced Inverters,
IVVC, and Energy Storage
Under the Solar Partner Program (SPP), Arizona Public Service is conducting a large, two-phase
study to determine whether advanced technology can be used to help manage voltage rise on
feeders caused by high penetration of rooftop solar. Three technologies are being investigated:
advanced inverters, integrated Volt/VAR control (IVVC), and battery storage. Goals of the SPP study
include an evaluation of: 1) advanced inverters and their ability to reliably perform grid services,
2) IVVC and its ability to flatten and lower voltage to compensate for PV-caused voltage rise, and
3) batteries and their ability to do these same functions. The first phase of this study—the testing
and evaluating of advanced inverters on high-PV penetration feeders—was completed in 2016 in
partnership with the Electric Power Research Institute (EPRI). The second phase, which involves
the IVVC and battery investigation, is expected to be completed in 2017.
In the first phase, APS implemented direct, real-time control of advanced inverters using UL1741-
SA advanced-inverter functions to provide voltage- and power-quality support, including
adjustable power-factor control. APS elected to implement a Siemens-provided SICAM controller
to realize central control from its distribution operations center. This allowed communications to be
handled over both public cellular (via VPN) and private AMI networks to manage cybersecurity risk.
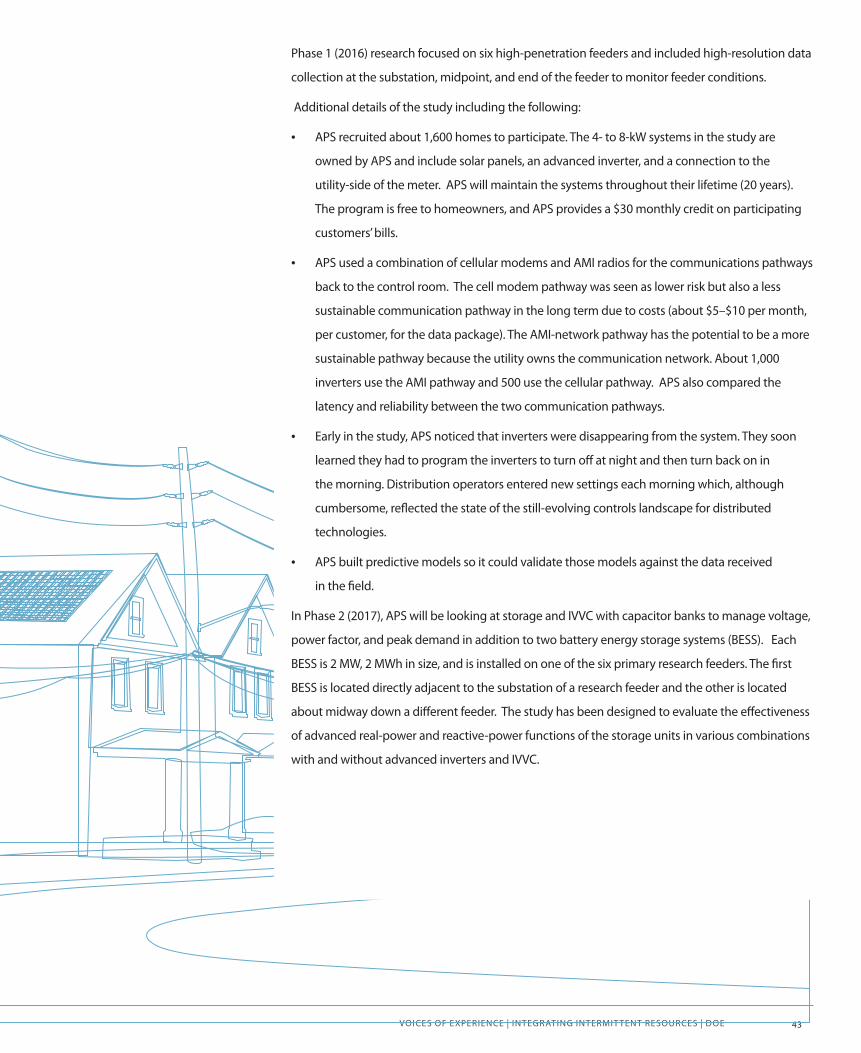
VOICES OF EXPERIENCE | INTEGRATING INTERMIT TENT RESOURCES | DOE 43
Phase 1 (2016) research focused on six high-penetration feeders and included high-resolution data
collection at the substation, midpoint, and end of the feeder to monitor feeder conditions.
Additional details of the study including the following:
• APS recruited about 1,600 homes to participate. The 4- to 8-kW systems in the study are
owned by APS and include solar panels, an advanced inverter, and a connection to the
utility-side of the meter. APS will maintain the systems throughout their lifetime (20 years).
The program is free to homeowners, and APS provides a $30 monthly credit on participating
customers’ bills.
• APS used a combination of cellular modems and AMI radios for the communications pathways
back to the control room. The cell modem pathway was seen as lower risk but also a less
sustainable communication pathway in the long term due to costs (about $5–$10 per month,
per customer, for the data package). The AMI-network pathway has the potential to be a more
sustainable pathway because the utility owns the communication network. About 1,000
inverters use the AMI pathway and 500 use the cellular pathway. APS also compared the
latency and reliability between the two communication pathways.
• Early in the study, APS noticed that inverters were disappearing from the system. They soon
learned they had to program the inverters to turn off at night and then turn back on in
the morning. Distribution operators entered new settings each morning which, although
cumbersome, reflected the state of the still-evolving controls landscape for distributed
technologies.
• APS built predictive models so it could validate those models against the data received
in the field.
In Phase 2 (2017), APS will be looking at storage and IVVC with capacitor banks to manage voltage,
power factor, and peak demand in addition to two battery energy storage systems (BESS). Each
BESS is 2 MW, 2 MWh in size, and is installed on one of the six primary research feeders. The first
BESS is located directly adjacent to the substation of a research feeder and the other is located
about midway down a different feeder. The study has been designed to evaluate the effectiveness
of advanced real-power and reactive-power functions of the storage units in various combinations
with and without advanced inverters and IVVC.

VOICES OF EXPERIENCE | INTEGRATING INTERMIT TENT RESOURCES | DOE44
SDG&E—Investigating Aggregator Control and Inverter Capabilities
When monitoring a large PV system in 2011, SDG&E found that there was significant variability
on the line causing primary distribution voltage deviations well outside ANSI range A. Given
California’s clean-energy goals—and anticipated penetration levels—and what they were seeing
with voltage deviations, SDG&E realized there could be significant operational issues in the future
as penetrations increased. Wanting to be proactive, SDG&E worked with the CPUC to establish
the Rule 21 Smart Inverter Working Group (SIWG). (Note: Beginning on September 8, 2017, in
California, all inverters will be required to have the seven Rule 21 Phase 1 functions that were
recommended by the SIWG and adopted by the commission. Work in the pilot was based on
discussions from the working group.)
SDG&E, in a pilot project with SolarCity, set out to test smart inverter functionality and explore
the ability of these inverters to help manage the voltage profile on circuit. The objective of the
pilot was to evaluate inverter capabilities for controlling voltage and to demonstrate the ability
to communicate with the aggregator. SDG&E selected a new community in a highly urbanized,
residential area with relatively short feeders (4 miles) and peak loads of around 6–7 MW. The area
chosen had 1 MW of installed PV with standard inverters, and 465 kW of PV were installed with
advanced inverter functionality for the study. Additionally, the inverters were rightsized so that at
power factor limit the inverters were able to provide 100% rated power output.
SDG&E looked at two approaches for using smart inverters to provide reactive-power support:
fixed power factor and dynamic Volt/VAR control using three curves (a progression from a
deadband to no deadband). SDG&E sent out the set points on a schedule to the aggregator, who
would then send these signals to the inverters. The communications protocol from SDG&E to the
aggregator was IEEE 2030.5 (i.e., ZigBee 2.0), the protocol the California inverter owned utilities
settled on. As part of IEEE 2030.5, a naming convention was developed so it would be possible to
communicate down to a single transformer with a logical node approach. This was done so there
would be an addressable structure for SDG&E to request the performance if dispatching from a
DERMS product.
SDG&E demonstrated that it is possible to send an aggregator a schedule with the appropriate
identifiers specifying what was needed at a specific location on the circuit, and the aggregator
could implement that scheme. SDG&E also found that the dynamic Volt/VAR modes do a much
better job of controlling the secondary voltage than when operating at a fixed power factor for an
extended period. They did not find, however, that there was any impact to the primary—which is
where utilities currently regulate voltage.
VOICES OF EXPERIENCE | INTEGRATING INTERMIT TENT RESOURCES | DOE 45
Potential risks with aggregator control of inverters
· Each aggregator could be a point of failure.
· Aggregators could be interested in also aggregating thermostats and other devices, which would introduce another point of failure.
· Aggregators may not have the resources or practices in place to address cybersecurity issues required by the utility.
Insights that SDG&E shared with the working group include:
• On a circuit that has a mix of traditional and advanced inverters, there won’t be as much of a
benefit from advanced inverters unless the penetration levels are high and the benefits will
be different than if all PV systems on the circuit have advanced inverters. For SDG&E’s study,
although the circuit had both standard and advanced inverters, only the advanced inverters
were monitored. The project evaluated the capabilities of the advanced inverters to modify the
voltage ranges.
• SDG&E had observability of the primary distribution system via SCADA at the distribution
substation breaker, at the midpoint switches, and along the line. Looking these data, they
didn’t see any impact to the primary distribution voltage, but results showed that the smart
inverter could help modify the secondary distribution voltage.
• SDG&E anticipates that in the future there will be weather-based voltage regulation schemes.
They are looking at possibly scheduling various kinds of weather modes such as clear day,
cloudy day, and intermittent day.
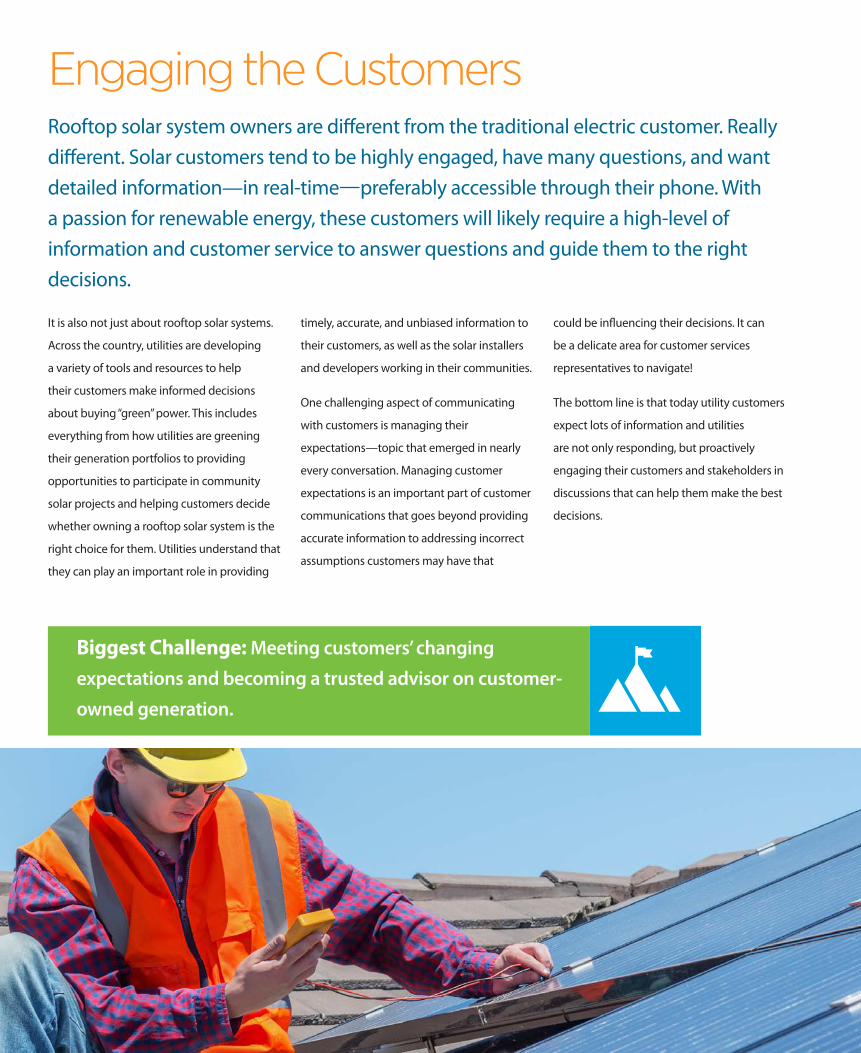
VOICES OF EXPERIENCE | INTEGRATING INTERMIT TENT RESOURCES | DOE46
Engaging the Customers Rooftop solar system owners are different from the traditional electric customer. Really different. Solar customers tend to be highly engaged, have many questions, and want detailed information —in real-time—preferably accessible through their phone. With a passion for renewable energy, these customers will likely require a high-level of information and customer service to answer questions and guide them to the right decisions.
It is also not just about rooftop solar systems.
Across the country, utilities are developing
a variety of tools and resources to help
their customers make informed decisions
about buying “green” power. This includes
everything from how utilities are greening
their generation portfolios to providing
opportunities to participate in community
solar projects and helping customers decide
whether owning a rooftop solar system is the
right choice for them. Utilities understand that
they can play an important role in providing
timely, accurate, and unbiased information to
their customers, as well as the solar installers
and developers working in their communities.
One challenging aspect of communicating
with customers is managing their
expectations—topic that emerged in nearly
every conversation. Managing customer
expectations is an important part of customer
communications that goes beyond providing
accurate information to addressing incorrect
assumptions customers may have that
could be influencing their decisions. It can
be a delicate area for customer services
representatives to navigate!
The bottom line is that today utility customers
expect lots of information and utilities
are not only responding, but proactively
engaging their customers and stakeholders in
discussions that can help them make the best
decisions.
Biggest Challenge: Meeting customers’ changing
expectations and becoming a trusted advisor on customer-
owned generation.

VOICES OF EXPERIENCE | INTEGRATING INTERMIT TENT RESOURCES | DOE 47
What utilities are learning
• Customer education is important. Even knowledgeable customers may not fully understand or may have misinformation about the
interconnection process and system limitations. Part of the education process will be about managing customer expectations. It is
important to help customers understand how much their system will actually generate (and that it could differ depending on the time of
day or year) and what this could mean for their bill. Adding a note to their interconnection application approval documentation can be a
good way of communicating this.
• You will need more than a website. Having information available on a website is expected, but regular webinars and workshops
with customers and installers are also an effective way to educate your stakeholder community and can make the interconnection
process simpler for contractors and customers. Getting in front of customers and contractors will help build relationships and improve
understanding. You may also need to invest in marketing programs to direct customers to your website, webinars, and seminars.
• Solar customers have a need for LOTS of information that is easy to access. Remember this when designing tools for them. (Consider
providing an app for your solar customers.) Customers who have paid to install a PV system want it to begin producing energy as soon
as it is installed; however, there are typically additional steps before the system can be “turned on,” such as the county inspection, meter
exchange, and contractor documentation. Make sure timeframes for each step of the process are clearly communicated to customers.
• Knowledgeable, competent customer service representatives are imperative. Some solar customers are very energy literate. They
want (and need!) information on technical concepts such as the net metering tariff, grid constraints, how their PV system will perform,
and other complex technical concepts (such as transformer overload). Customer service reps should be prepared to provide simple, clear
explanations to the questions that customers are sure to ask.
• Be aware of the incentives and policies driving customer choices. Customer service representatives must understand and explain the
importance of right-sizing rooftop solar systems, and know that often the system size a customer is requesting is being driven by state
policy incentives. When customers oversize their systems, it can create operational issues for the utility—something customers don’t
usually understand.
• Take the time to answer all their questions. Whether it is a single point of contact or a specialized team of customer service
representatives, utilities must be able to respond to solar customers with accurate and timely information. This includes taking the time
needed to help customers understand how their PV systems will perform, what type of utility bill they will get (some customer do not
understand they will still get a monthly bill), and what is required for installation.
• Solar installers tend to be the primary source of information for rooftop solar customers. Hence, your communications strategy
should include programs and materials that target the installers—they can be your biggest advocates—as well balance out some of the
misinformation that consumers may be receiving.
• Help customers understand their new bill. Customers don’t always realize that their bill might be different from their neighbors
because they don’t necessarily use energy like their neighbor. If their neighbor installed solar and has a low energy bill, they will
want the same. They don’t always recognize that the neighbor might have a lower bill because they are out of the house all day, have
fewer household members, or have a roof that faces in a better position to match energy demand. It is important to help customers
understand how much their own system will actually generate (and that it could differ depending on the time of day or year) and what
this could mean for their bill.

VOICES OF EXPERIENCE | INTEGRATING INTERMIT TENT RESOURCES | DOE48
There are many examples of utilities whose websites explain how solar works and what is
required to interconnect to the distribution grid. There are tools to help customers calculate their
energy needs, size their systems, and find solar contractors. There is information on pricing plans
and understanding their bills, understanding financing options, and maintaining and monitoring
a rooftop system. Here are some examples of how utilities are engaging their customers and
stakeholders and helping them to make informed decisions.
Providing easy-to-understand information upfront: How-to, right-sizing, and
pricing
If customers have better information early on, they can make better choices. Providing reliable
guidance from the get-go reduces customer frustration, manages expectations, and produces
better outcomes for everyone.
• Georgia Power has a simple tool on its website to help customers assess their home’s
potential for solar power generation.
• SCE’s Guide to Going Solar webpage provides information about installing rooftop solar, with
easy steps for customers to follow.
• SRP’s website has a one-stop landing page that includes residential and commercial solar
information, price plans, a demand calculator, and rebates for solar water heating.
• PG&E has an online tool where customers can calculate their potential solar savings.
• Pepco is using the online solar calculator WattPlan to help customers understand their
properties’ solar potential; right-size their system; provide information on rates, costs, and
installation; and answer FAQs. More than 5,000 people have used Pepco’s calculator since it
went live.
• HECO provides locational value maps to show customers and solar contractors the
distributed generation levels on their circuits. The information on the maps is updated daily.
• Providing clear answers to frequently asked questions is always a good idea. The more
location-specific, the better. Pepco’s FAQ webpage for its Washington D.C. customers is one
example.
What utilities are doing
VOICES OF EXPERIENCE | INTEGRATING INTERMIT TENT RESOURCES | DOE 49
Communicating beyond the website: Seminars, webinars, videos, and more
There’s no question that a website can be one of the most powerful tools to engage
customers. But with the complexity around solar, a good website alone is typically not
enough. Develop a variety of tools and ways to reach out for the best results.
• In Massachusetts, three utilities have rotating monthly meetings for their customers
as well as developers and installers where they talk about various topics. Each utility
takes a turn hosting and the location is moved around. Around 700 invitations are
sent for each meeting. The utility uses these events to communicate and provide
the rationale for things like technical changes, updates on program limits, and new
interconnection requirements. Technical staff members typically attend and answer
customer questions directly.
• Pepco uses common issues and questions that it sees in its call center to guide
topics for monthly webinars for customers, developers, and installers. Topics covered
include net metering, the interconnection application and review process, and online
application training. Contractors can also request a face-to-face meeting with Pepco
personnel for a hands-on review of the interconnection application process.
• APS, SDG&E, HECO, and Kauai Electric Coop have developed flyers and brochures to
help customers right-size their systems, understand points of confusion, and maximize
their savings.
• SCE and HECO created videos about going solar that go over how to get a PV system
approved, installed, and connected.
• SCE developed a video and HECO created a guide to help customers understand net
energy metering.
Customer service done right: Solar customer call centers and specialists
No matter how many creative ways you give solar information to your customers,
sometimes there is no substitute for talking to a real person one-on-one.
• PG&E established a dedicated call center for solar customers. The utility found that
with the growth of solar in its service territory, it really needed to have specialized
customer service representatives who were knowledgeable about the interconnection
process and could answer all solar-related questions. PG&E noted that this dedicated
call center approach has led to a much better customer experience.
VOICES OF EXPERIENCE | INTEGRATING INTERMIT TENT RESOURCES | DOE50
• With low but increasing penetrations, Pepco established a dedicated call center staffed with
about 20 representatives just for customers with questions around PV installations. This is
the same team that also processes the interconnection applications. This approach proved
effective; however, if PV installations continue at the current rate—one in four of their
customers is expected to have PV in the next two years—Pepco will reevaluate how best to
direct these calls (dedicated call center versus main call center).
• Westar Energy has a dedicated representative for its solar customers. This allows Westar to
offer personalized service from the initial inquiry through interconnection.
• Georgia Power also has a dedicated renewable energy group to answer customers’ more
detailed questions. This group is trained to help customers evaluate various Georgia Power
solar program options and potential energy and bill savings with a solar installation.
Educating customers about curtailment
In 2015, Kauai Island Utility Cooperative (KIUC) had over 30 MW of utility-scale solar and
16 MW of customer-sited solar PV with a significant percentage of members continuing
to install oversized systems. With a daytime peak load between 50–60 MW and wanting
to continue to allow all members interested in installing solar to be able to do so, KIUC
implemented a curtailment meter requirement program on systems that were consider
oversized. The curtailment program requires all oversized systems to have a second AMI
smart meter (KIUC provides the meter and the customer pays for the installation) with
remote connect and disconnect capability on the customer’s house to give KIUC the ability
to disconnect the oversized system from exporting power to KIUC’s grid. KIUC sends a signal
to this meter and shuts it off when curtailment is required, then turns it back on when the
curtailment period ends. The customer gets power from KIUC during the time the system
is curtailed. If customers would like to continue to generate their own power during the
curtailment event, they must separate the oversized portion of the system so that only it is
subject to curtailment.
KIUC implemented an aggressive customer engagement campaign to educate consumers
about the program and the importance of right-sizing their solar installation. KIUC wanted
to be clear that it was not trying to discourage solar and that the curtailment program
would not prevent anyone from installing an oversized system. It simply requires that a
meter be installed on the oversized system so that KIUC can temporarily disconnect it
from the grid when solar output exceeds demand. KIUC has created several brochures and
posters as part of the education campaign. (See Appendix C for examples from KIUC.)

VOICES OF EXPERIENCE | INTEGRATING INTERMIT TENT RESOURCES | DOE 51
Ahmad Ababneh Pacific Gas and Electric Company
Amrita Acharya-Menon Pepco Holdings
Greg Adams Salt River Project
Gred Anderson Otter Tail Corporation
Marc Asano Hawaiian Electric Company
Manual Avendano Commonwealth Edison Company
Shay Bahramirad Commonwealth Edison Company
Ed Batalla Florida Power & Light Company
Michael Beaulieu Vermont Electric Cooperative
Thomas Bialek San Diego Gas & Electric
David Bonenberger PPL Corporation
Rita Breen Georgia Power
Dennis Brown Pepco Holdings
Dustin Brown CoServ Electric
Cyrl Brunner Stowe Electric Department
Ellen Burt Stowe Electric Department
Anthony Cadorin City of Mesa
Josh Castonguay Green Mountain Power
Jim Cater American Public Power Association
Andrea Cohen Vermont Electric Cooperative
Karen Collins Salt River Project
Molly Connors, ISO New England
Steven Cook Rochester Public Utilities
David A. Crabtree Tampa Electric
John J Cruz Jr. Guam Power Authority
Joel Danforth Platte River Power Authority
Kent Davenport Delta-Montrose Electric Association
Robert Dostis Green Mountain Power
Erik Ellis Arizona Public Service Company
William R. Ellis Pepco Holdings
Babak Enayati National Grid
Frank Ettori VELCO
Ken Fong Hawaiian Electric Company
Don Ford Westar Energy
Deena Frankel VELCO
James Gibbons Burlington Electric Department
Fred Gomos Commonwealth Edison Company
Stewart Grantham
North Carolina Electric Membership Corporation
Adrienne Grier Commonwealth Edison Company
Christine HalquistVermont Electric Cooperative
Robby Hamlin CoServ Electric
Robert Harris National Rural Electric Cooperative Association
Daniel Haughton Arizona Public Service Company
Bobby Hawthorne Southern Company
Appendix ADOE Integrating Intermittent Resources Working Group Participants
This list includes all parties who registered for a working group conference call, attended a regional meeting (or sent staff to one of the meetings), or participated in an interview with the leadership team. The leadership team would like to thank everyone who supported this initiative, especially those who shared their experience with the readers of this guide.

VOICES OF EXPERIENCE | INTEGRATING INTERMIT TENT RESOURCES | DOE52
Edward Hedges Kansas City Power & Light Company
Michael Henderson ISO New England
Foster Hildreth Orcas Power and Light
Anthony Hong Hawaiian Electric Company
Larry Hopkins Piedmont Electric Membership Corporation
James Hurtt Florida Power & Light Company
Tim Jarrell Cobb EMC
Ferhaan Jawed Pacific Gas and Electric Company
Kerrick Johnson VELCO
Ken Kagy Cedar Falls Utilities
Vanessa Kisicki Salt River Project
Kandice Kubojiri Hawaiian Electric Company
Robert Kondziolka Salt River Project
Robin Lanier Georgia Power
Casey Lamont Burlington Electric Department
Benjamin Lee Southern California Edison
Karen Lefkowitz Pepco Holdings
Matthew Liethen Commonwealth Edison Company
Joel Linton Florida Power & Light Company
Shana Louiselle VELCO
Lisa Magnuson Pacific Gas and Electric Company
Alan Matthews Seattle City Light
Jeff McKeever Otter Tail Corporation
William Mintz Southern Company
Alan Mosher American Public Power Association
Catherine O’Brien Salt River Project
Esa Paaso Commonwealth Edison Company
Lena Perkins City of Palo Alto
Dean Phillips FirstEnergy Corporation
Steven Pigford Southern Company
Leslie Ponders Duke Energy
David Quier PPL Corporation
Cory Ramsel Florida Power & Light Company
Tammie Rhea Westar Energy
Jonathon Rhyne Duke Energy
Patty Richards Washington Electric Cooperative
Kristin Riggins Kansas City Power & Light Company
Carol Robertson Village of Hyde Park Electric Department
Brad Rockwell Kauai Island Utility Cooperative
Marc Romito Arizona Public Service Company
Chris Root VELCO
John Roukema Silicon Valley Power
Benjamin Rushwald Seattle City Light
Tom Russell Pacific Gas and Electric Company
Roger Salas Southern California Edison
Scott Scharli Salt River Project
Joe Schatz Southern Company
David Schoeberg Pacific Gas and Electric Company
Jeffrey Schoenecker Dakota Electric Association
Rick Schroeder
North Carolina Electric Membership Corporation
Mark Sciarrotta VELCO

VOICES OF EXPERIENCE | INTEGRATING INTERMIT TENT RESOURCES | DOE 53
Uzma Siddiqi Seattle City Light
Grant Smedley Salt River Project
David Smith Florida Power & Light Company
Darren Springer Burlington Electric Department
Steve Steffel Pepco Holdings
Robert S. Stewart Pepco Holdings
Chase Sun Southern California Edison
Erik Takayesu Southern California Edison
Jim Taylor Tucson Electric Power
Jacob Tetlow Arizona Public Service Company
Steve Thompson Southern Company
Scott Tjaden Pepco Holdings
Louis Vitola Delaware Municipal Electric Corporation
Joe Walligorski FirstEnergy Corporation
Jim West Snohomish County PUD
Eric Wong City of Palo Alto
Michael Yamane Kauai Island Utility Cooperative
U.S. Department of Energy Team
Tanya Burns Arara Blue Energy Group LLC
Sonja Berdahl National Renewable Energy Laboratory
Eric Lightner U.S. Department of Energy
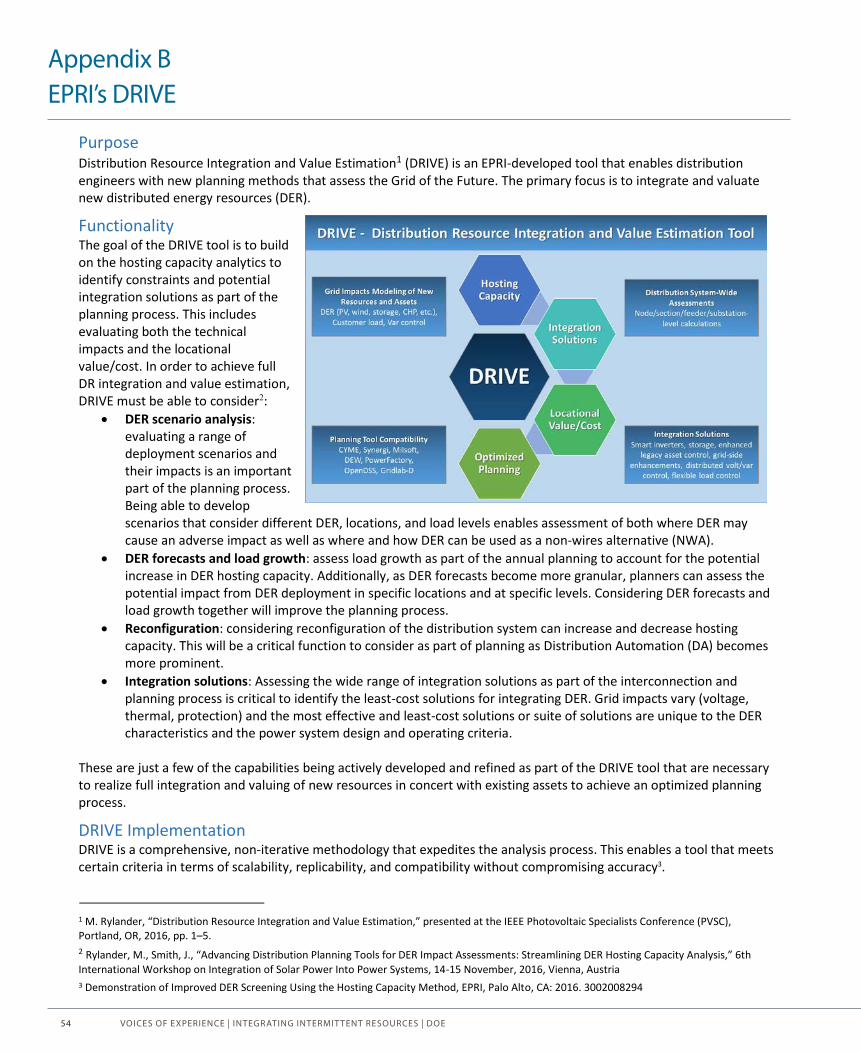
VOICES OF EXPERIENCE | INTEGRATING INTERMIT TENT RESOURCES | DOE54
Appendix BEPRI’s DRIVE
Distribution Resource Integration and Value Estimation (DRIVE) Purpose Distribution Resource Integration and Value Estimation1 (DRIVE) is an EPRI-developed tool that enables distribution engineers with new planning methods that assess the Grid of the Future. The primary focus is to integrate and valuate new distributed energy resources (DER).
Functionality The goal of the DRIVE tool is to build on the hosting capacity analytics to identify constraints and potential integration solutions as part of the planning process. This includes evaluating both the technical impacts and the locational value/cost. In order to achieve full DR integration and value estimation, DRIVE must be able to consider2:
DER scenario analysis: evaluating a range of deployment scenarios and their impacts is an important part of the planning process. Being able to develop scenarios that consider different DER, locations, and load levels enables assessment of both where DER may cause an adverse impact as well as where and how DER can be used as a non-wires alternative (NWA).
DER forecasts and load growth: assess load growth as part of the annual planning to account for the potential increase in DER hosting capacity. Additionally, as DER forecasts become more granular, planners can assess the potential impact from DER deployment in specific locations and at specific levels. Considering DER forecasts and load growth together will improve the planning process.
Reconfiguration: considering reconfiguration of the distribution system can increase and decrease hosting capacity. This will be a critical function to consider as part of planning as Distribution Automation (DA) becomes more prominent.
Integration solutions: Assessing the wide range of integration solutions as part of the interconnection and planning process is critical to identify the least-cost solutions for integrating DER. Grid impacts vary (voltage, thermal, protection) and the most effective and least-cost solutions or suite of solutions are unique to the DER characteristics and the power system design and operating criteria.
These are just a few of the capabilities being actively developed and refined as part of the DRIVE tool that are necessary to realize full integration and valuing of new resources in concert with existing assets to achieve an optimized planning process.
DRIVE Implementation DRIVE is a comprehensive, non-iterative methodology that expedites the analysis process. This enables a tool that meets certain criteria in terms of scalability, replicability, and compatibility without compromising accuracy3.
1 M. Rylander, “Distribution Resource Integration and Value Estimation,” presented at the IEEE Photovoltaic Specialists Conference (PVSC), Portland, OR, 2016, pp. 1–5. 2 Rylander, M., Smith, J., “Advancing Distribution Planning Tools for DER Impact Assessments: Streamlining DER Hosting Capacity Analysis,” 6th International Workshop on Integration of Solar Power Into Power Systems, 14-15 November, 2016, Vienna, Austria 3 Demonstration of Improved DER Screening Using the Hosting Capacity Method, EPRI, Palo Alto, CA: 2016. 3002008294
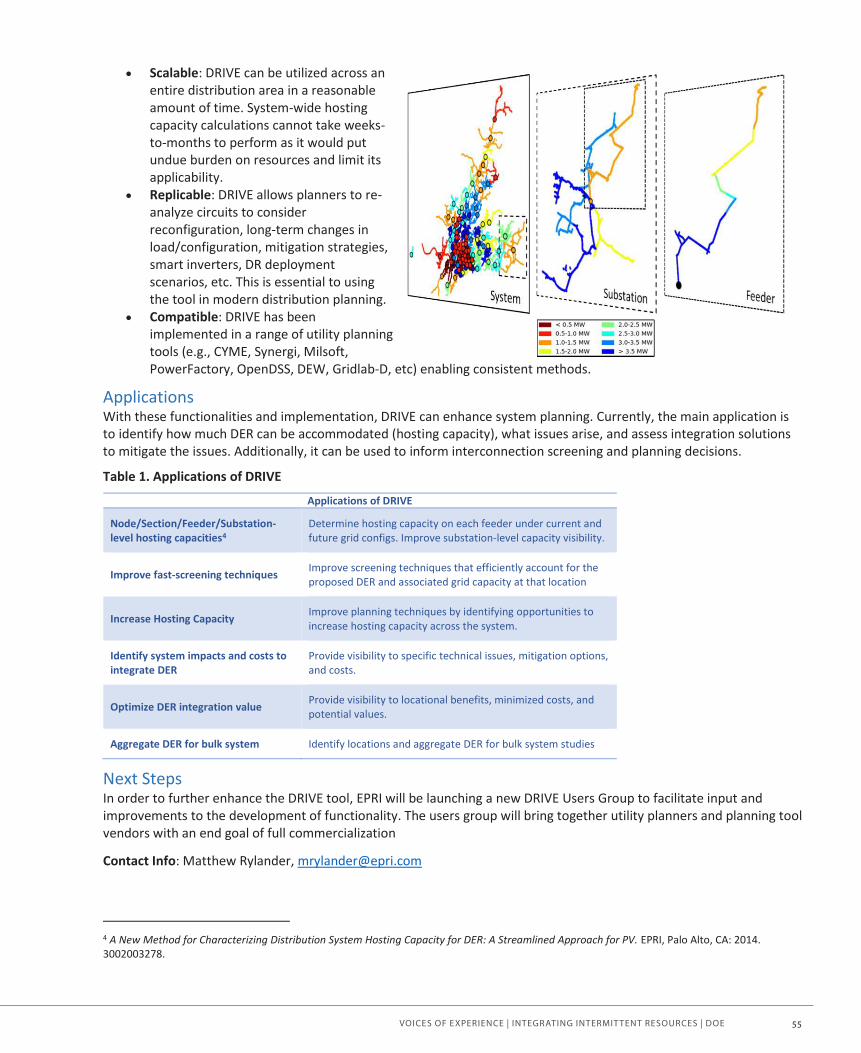
VOICES OF EXPERIENCE | INTEGRATING INTERMIT TENT RESOURCES | DOE 55
Scalable: DRIVE can be utilized across an entire distribution area in a reasonable amount of time. System-wide hosting capacity calculations cannot take weeks-to-months to perform as it would put undue burden on resources and limit its applicability.
Replicable: DRIVE allows planners to re-analyze circuits to consider reconfiguration, long-term changes in load/configuration, mitigation strategies, smart inverters, DR deployment scenarios, etc. This is essential to using the tool in modern distribution planning.
Compatible: DRIVE has been implemented in a range of utility planning tools (e.g., CYME, Synergi, Milsoft, PowerFactory, OpenDSS, DEW, Gridlab-D, etc) enabling consistent methods.
Applications With these functionalities and implementation, DRIVE can enhance system planning. Currently, the main application is to identify how much DER can be accommodated (hosting capacity), what issues arise, and assess integration solutions to mitigate the issues. Additionally, it can be used to inform interconnection screening and planning decisions.
Table 1. Applications of DRIVE Applications of DRIVE
Node/Section/Feeder/Substation-level hosting capacities4
Determine hosting capacity on each feeder under current and future grid configs. Improve substation-level capacity visibility.
Improve fast-screening techniques Improve screening techniques that efficiently account for the proposed DER and associated grid capacity at that location
Increase Hosting Capacity Improve planning techniques by identifying opportunities to increase hosting capacity across the system.
Identify system impacts and costs to integrate DER
Provide visibility to specific technical issues, mitigation options, and costs.
Optimize DER integration value Provide visibility to locational benefits, minimized costs, and potential values.
Aggregate DER for bulk system Identify locations and aggregate DER for bulk system studies
Next Steps In order to further enhance the DRIVE tool, EPRI will be launching a new DRIVE Users Group to facilitate input and improvements to the development of functionality. The users group will bring together utility planners and planning tool vendors with an end goal of full commercialization
Contact Info: Matthew Rylander, [email protected]
4 A New Method for Characterizing Distribution System Hosting Capacity for DER: A Streamlined Approach for PV. EPRI, Palo Alto, CA: 2014. 3002003278.
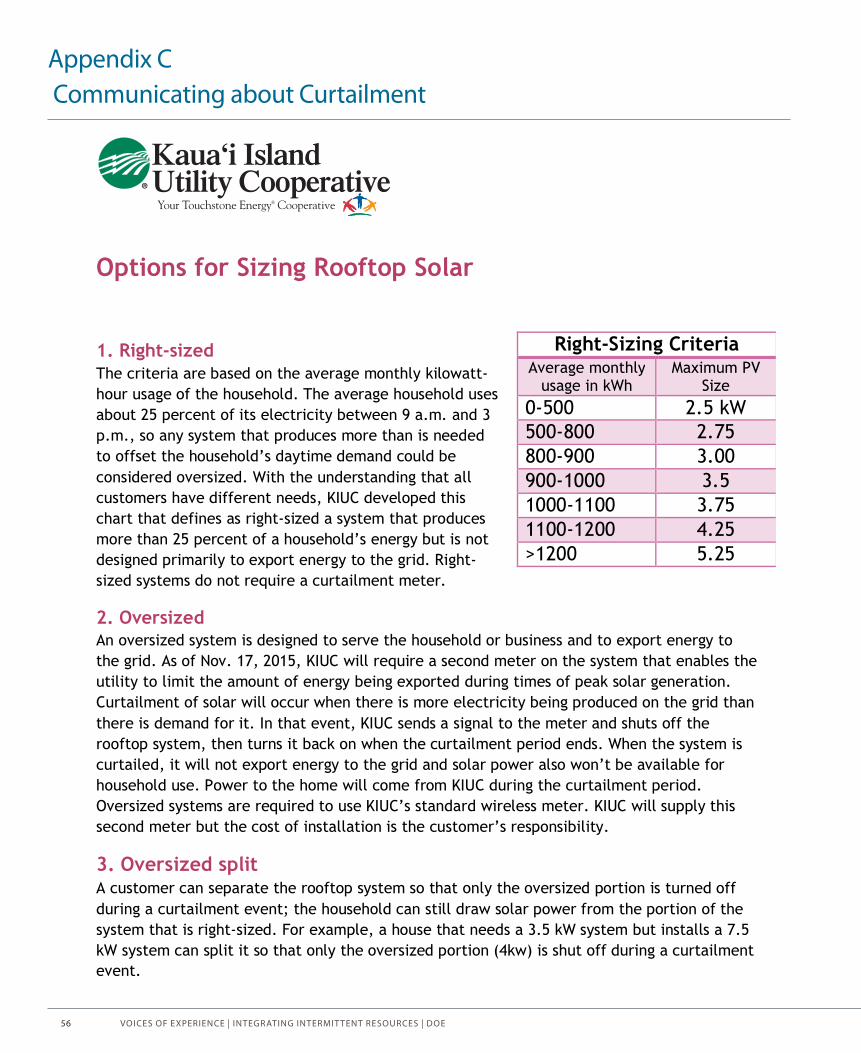
VOICES OF EXPERIENCE | INTEGRATING INTERMIT TENT RESOURCES | DOE56
Appendix C Communicating about Curtailment
VOICES OF EXPERIENCE | INTEGRATING INTERMIT TENT RESOURCES | DOE57

VOICES OF EXPERIENCE | INTEGRATING INTERMIT TENT RESOURCES | DOE 58

VOICES OF EXPERIENCE | INTEGRATING INTERMIT TENT RESOURCES | DOE59
You’re smart with your money. You wouldn’t buy a $60,000 SUV if all you needed to get around was a $20,000 compact, right?
The same should go for rooftop solar systems.
That’s why we recommend getting a system that’s right-sized for your household, not oversized.
For the average household, KIUC recommends a 10-panel system producing 2.5 kilowatts to offset your daytime electric use. You should first consider a solar water heater, which is a lot less expensive to install and can reduce your electric bill by 30 percent or more - and KIUC offers a $1,000 rebate.
If you have questions about how much electricity you’re using, or want advice on right-sizing a rooftop solar system, call us at 246.4300.

VOICES OF EXPERIENCE | INTEGRATING INTERMIT TENT RESOURCES | DOE 60
WHAT THE SOLAR GUYS
MAY NOT TELL YOUNot everyone needs a $25,000 solar photovoltaic system.
Installing a solar water heater is the cheapest, easiest way for
most Kaua‘i households to save at least 40 percent on their
electric bill.
Water heaters use more electricity than any other appliance.
Using the sun to heat water can save you around $80 to $100
a month, maybe more, depending on the size of your family.
Right now, KIUC is offering a $1,000 rebate toward the
purchase and installation of a solar water heater. With the
rebate and state and federal tax credits, your final cost could
be less than $2,000.
So do the math yourself and see how much money you can save
just by using a solar water heater.

VOICES OF EXPERIENCE | INTEGRATING INTERMIT TENT RESOURCES | DOE61
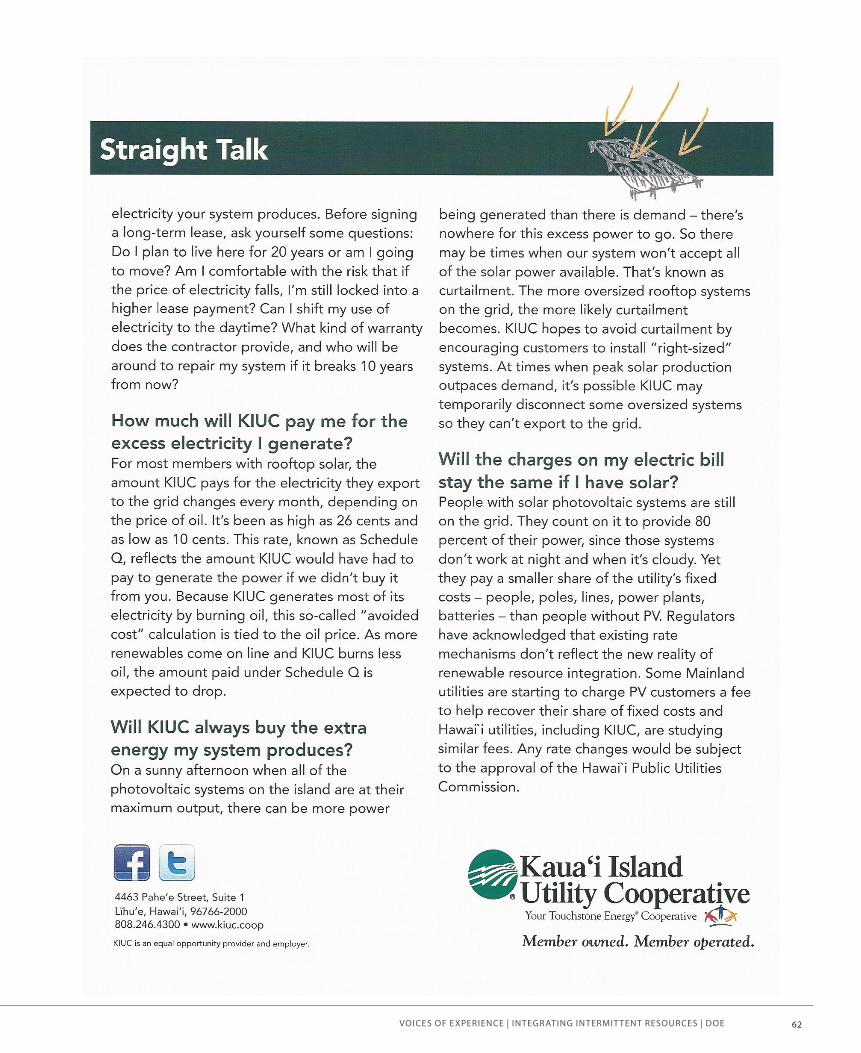
VOICES OF EXPERIENCE | INTEGRATING INTERMIT TENT RESOURCES | DOE 62