vol 437 27 october 2005 articles - columbia.edu · more than a thousand genes for rare, highly...
TRANSCRIPT
© 2005 Nature Publishing Group
A haplotype map of the human genomeThe International HapMap Consortium*
Inherited genetic variation has a critical but as yet largely uncharacterized role in human disease. Here we report apublic database of common variation in the human genome: more than one million single nucleotide polymorphisms(SNPs) for which accurate and complete genotypes have been obtained in 269 DNA samples from four populations,including ten 500-kilobase regions in which essentially all information about common DNA variation has been extracted.These data document the generality of recombination hotspots, a block-like structure of linkage disequilibrium and lowhaplotype diversity, leading to substantial correlations of SNPs with many of their neighbours. We show how theHapMap resource can guide the design and analysis of genetic association studies, shed light on structural variation andrecombination, and identify loci that may have been subject to natural selection during human evolution.
Despite the ever-accelerating pace of biomedical research, the rootcauses of common human diseases remain largely unknown, pre-ventative measures are generally inadequate, and available treatmentsare seldom curative. Family history is one of the strongest risk factorsfor nearly all diseases—including cardiovascular disease, cancer,diabetes, autoimmunity, psychiatric illnesses and many others—providing the tantalizing but elusive clue that inherited geneticvariation has an important role in the pathogenesis of disease.Identifying the causal genes and variants would represent an impor-tant step in the path towards improved prevention, diagnosis andtreatment of disease.
More than a thousand genes for rare, highly heritable ‘mendelian’disorders have been identified, in which variation in a single gene isboth necessary and sufficient to cause disease. Common disorders, incontrast, have proven much more challenging to study, as theyare thought to be due to the combined effect of many differentsusceptibility DNA variants interacting with environmental factors.
Studies of common diseases have fallen into two broad categories:family-based linkage studies across the entire genome, and popu-lation-based association studies of individual candidate genes.Although there have been notable successes, progress has been slowdue to the inherent limitations of the methods; linkage analysis haslow power except when a single locus explains a substantial fractionof disease, and association studies of one or a few candidate genesexamine only a small fraction of the ‘universe’ of sequence variationin each patient.
A comprehensive search for genetic influences on disease wouldinvolve examining all genetic differences in a large number of affectedindividuals and controls. It may eventually become possible toaccomplish this by complete genome resequencing. In the meantime,it is increasingly practical to systematically test common geneticvariants for their role in disease; such variants explain much of thegenetic diversity in our species, a consequence of the historicallysmall size and shared ancestry of the human population.
Recent experience bears out the hypothesis that common variantshave an important role in disease, with a partial list of validatedexamples including HLA (autoimmunity and infection)1, APOE4(Alzheimer’s disease, lipids)2, Factor VLeiden (deep vein thrombosis)3,PPARG (encoding PPARg; type 2 diabetes)4,5, KCNJ11 (type 2
diabetes)6, PTPN22 (rheumatoid arthritis and type 1 diabetes)7,8,insulin (type 1 diabetes)9, CTLA4 (autoimmune thyroid disease, type1 diabetes)10, NOD2 (inflammatory bowel disease)11,12, complementfactor H (age-related macular degeneration)13–15 and RET (Hirsch-sprung disease)16,17, among many others.
Systematic studies of common genetic variants are facilitated bythe fact that individuals who carry a particular SNP allele at one siteoften predictably carry specific alleles at other nearby variant sites.This correlation is known as linkage disequilibrium (LD); a particu-lar combination of alleles along a chromosome is termed a haplotype.
LD exists because of the shared ancestry of contemporary chromo-somes. When a new causal variant arises through mutation—whethera single nucleotide change, insertion/deletion, or structural altera-tion—it is initially tethered to a unique chromosome on which itoccurred, marked by a distinct combination of genetic variants.Recombination and mutation subsequently act to erode this associ-ation, but do so slowly (each occurring at an average rate of about1028 per base pair (bp) per generation) as compared to the numberof generations (typically 104 to 105) since the mutational event.
The correlations between causal mutations and the haplotypes onwhich they arose have long served as a tool for human geneticresearch: first finding association to a haplotype, and then sub-sequently identifying the causal mutation(s) that it carries. This waspioneered in studies of the HLA region, extended to identify causalgenes for mendelian diseases (for example, cystic fibrosis18 anddiastrophic dysplasia19), and most recently for complex disorderssuch as age-related macular degeneration13–15.
Early information documented the existence of LD in the humangenome20,21; however, these studies were limited (for technicalreasons) to a small number of regions with incomplete data, andgeneral patterns were challenging to discern. With the sequencing ofthe human genome and development of high-throughput genomicmethods, it became clear that the human genome generallydisplays more LD22 than under simple population genetic models23,and that LD is more varied across regions, and more segmentallystructured24–30, than had previously been supposed. These obser-vations indicated that LD-based methods would generally havegreat value (because nearby SNPs were typically correlated withmany of their neighbours), and also that LD relationships would
ARTICLES
*Lists of participants and affiliations appear at the end of the paper.
Vol 437|27 October 2005|doi:10.1038/nature04226
1299
© 2005 Nature Publishing Group
need to be empirically determined across the genome by studyingpolymorphisms at high density in population samples.
The International HapMap Project was launched in October 2002to create a public, genome-wide database of common humansequence variation, providing information needed as a guide togenetic studies of clinical phenotypes31. The project had becomepractical by the confluence of the following: (1) the availability ofthe human genome sequence; (2) databases of common SNPs(subsequently enriched by this project) from which genotypingassays could be designed; (3) insights into human LD; (4) develop-ment of inexpensive, accurate technologies for high-throughput SNPgenotyping; (5) web-based tools for storing and sharing data; and(6) frameworks to address associated ethical and cultural issues32.The project follows the data release principles of an internationalcommunity resource project (http://www.wellcome.ac.uk/doc_WTD003208.html), sharing information rapidly and withoutrestriction on its use.
The HapMap data were generated with the primary aim of guidingthe design and analysis of medical genetic studies. In addition, theadvent of genome-wide variation resources such as the HapMapopens a new era in population genetics, offering an unprecedentedopportunity to investigate the evolutionary forces that have shapedvariation in natural populations.
The Phase I HapMap
Phase I of the HapMap Project set as a goal genotyping at least onecommon SNP every 5 kilobases (kb) across the genome in each of 269DNA samples. For the sake of practicality, and motivated by the allelefrequency distribution of variants in the human genome, a minorallele frequency (MAF) of 0.05 or greater was targeted for study. (Forsimplicity, in this paper we will use the term ‘common’ to mean aSNP with MAF $ 0.05.) The project has a Phase II, which isattempting genotyping of an additional 4.6 million SNPs in each ofthe HapMap samples.
To compare the genome-wide resource to a more completedatabase of common variation—one in which all common SNPsand many rarer ones have been discovered and tested—a representa-tive collection of ten regions, each 500 kb in length, was selected fromthe ENCODE (Encyclopedia of DNA Elements) Project33. Each500-kb region was sequenced in 48 individuals, and all SNPs inthese regions (discovered or in dbSNP) were genotyped in thecomplete set of 269 DNA samples.
The specific samples examined are: (1) 90 individuals (30 parent–offspring trios) from the Yoruba in Ibadan, Nigeria (abbreviationYRI); (2) 90 individuals (30 trios) in Utah, USA, from the Centred’Etude du Polymorphisme Humain collection (abbreviation CEU);(3) 45 Han Chinese in Beijing, China (abbreviation CHB); (4) 44Japanese in Tokyo, Japan (abbreviation JPT).
Because none of the samples was collected to be representative of alarger population such as ‘Yoruba’, ‘Northern and Western European’,‘Han Chinese’, or ‘Japanese’ (let alone of all populations from ‘Africa’,‘Europe’, or ‘Asia’), we recommend using a specific local identifier
(for example, ‘Yoruba in Ibadan, Nigeria’) to describe the samplesinitially. Because the CHB and JPT allele frequencies are generallyvery similar, some analyses below combine these data sets. Whendoing so, we refer to three ‘analysis panels’ (YRI, CEU, CHBþJPT) toavoid confusing this analytical approach with the concept of a‘population’.
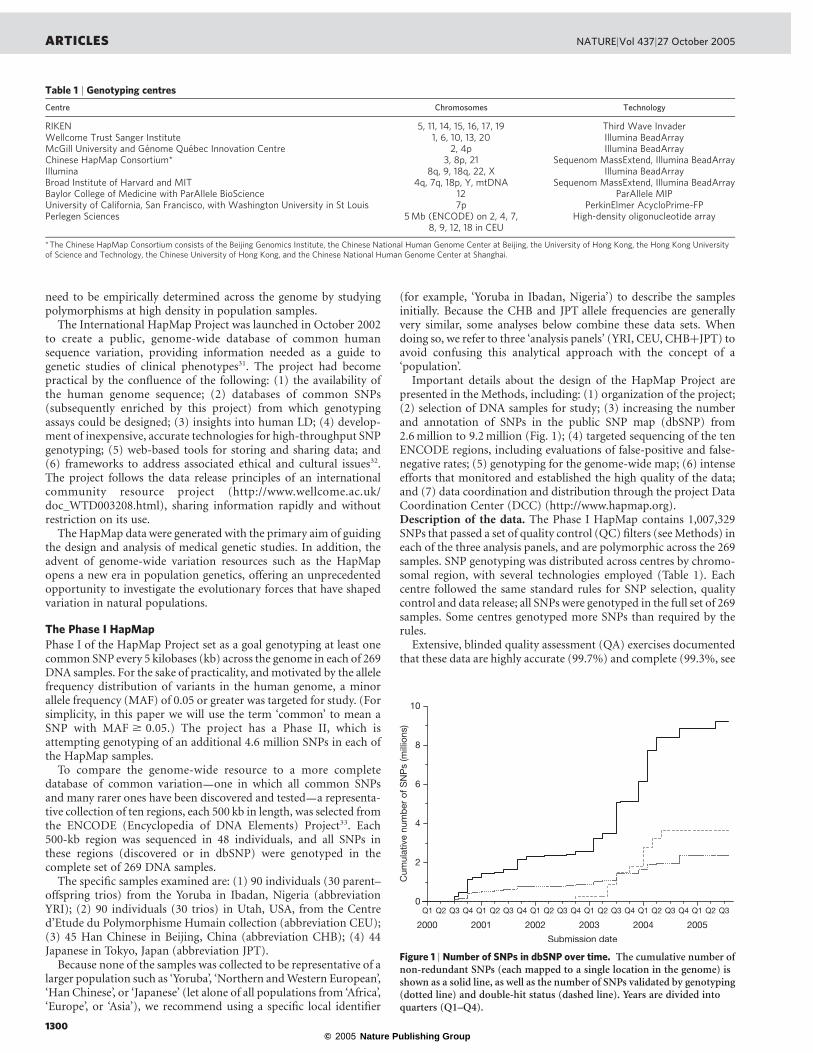
Important details about the design of the HapMap Project arepresented in the Methods, including: (1) organization of the project;(2) selection of DNA samples for study; (3) increasing the numberand annotation of SNPs in the public SNP map (dbSNP) from2.6 million to 9.2 million (Fig. 1); (4) targeted sequencing of the tenENCODE regions, including evaluations of false-positive and false-negative rates; (5) genotyping for the genome-wide map; (6) intenseefforts that monitored and established the high quality of the data;and (7) data coordination and distribution through the project DataCoordination Center (DCC) (http://www.hapmap.org).Description of the data. The Phase I HapMap contains 1,007,329SNPs that passed a set of quality control (QC) filters (see Methods) ineach of the three analysis panels, and are polymorphic across the 269samples. SNP genotyping was distributed across centres by chromo-somal region, with several technologies employed (Table 1). Eachcentre followed the same standard rules for SNP selection, qualitycontrol and data release; all SNPs were genotyped in the full set of 269samples. Some centres genotyped more SNPs than required by therules.
Extensive, blinded quality assessment (QA) exercises documentedthat these data are highly accurate (99.7%) and complete (99.3%, see
Table 1 | Genotyping centres
Centre Chromosomes Technology
RIKEN 5, 11, 14, 15, 16, 17, 19 Third Wave InvaderWellcome Trust Sanger Institute 1, 6, 10, 13, 20 Illumina BeadArrayMcGill University and Genome Quebec Innovation Centre 2, 4p Illumina BeadArrayChinese HapMap Consortium* 3, 8p, 21 Sequenom MassExtend, Illumina BeadArrayIllumina 8q, 9, 18q, 22, X Illumina BeadArrayBroad Institute of Harvard and MIT 4q, 7q, 18p, Y, mtDNA Sequenom MassExtend, Illumina BeadArrayBaylor College of Medicine with ParAllele BioScience 12 ParAllele MIPUniversity of California, San Francisco, with Washington University in St Louis 7p PerkinElmer AcycloPrime-FPPerlegen Sciences 5Mb (ENCODE) on 2, 4, 7,
8, 9, 12, 18 in CEUHigh-density oligonucleotide array
*The Chinese HapMap Consortium consists of the Beijing Genomics Institute, the Chinese National Human Genome Center at Beijing, the University of Hong Kong, the Hong Kong Universityof Science and Technology, the Chinese University of Hong Kong, and the Chinese National Human Genome Center at Shanghai.
Figure 1 | Number of SNPs in dbSNP over time. The cumulative number ofnon-redundant SNPs (each mapped to a single location in the genome) isshown as a solid line, as well as the number of SNPs validated by genotyping(dotted line) and double-hit status (dashed line). Years are divided intoquarters (Q1–Q4).
ARTICLES NATURE|Vol 437|27 October 2005
1300
© 2005 Nature Publishing Group
also Supplementary Table 1). All genotyping centres produced high-quality data (accuracy more than 99% in the blind QA exercises,Supplementary Tables 2 and 3), and missing data were not biasedagainst heterozygotes. The Supplementary Information contains thefull details of these efforts.
Although SNP selection was generally agnostic to functionalannotation, 11,500 non-synonymous cSNPs (SNPs in coding regionsof genes where the different SNP alleles code for different amino acidsin the protein) were successfully typed in Phase I. (An effort wasmade to prioritize cSNPs in Phase I in choosing SNPs for each 5-kbregion; all known non-synonymous cSNPs were attempted as part ofPhase II.)
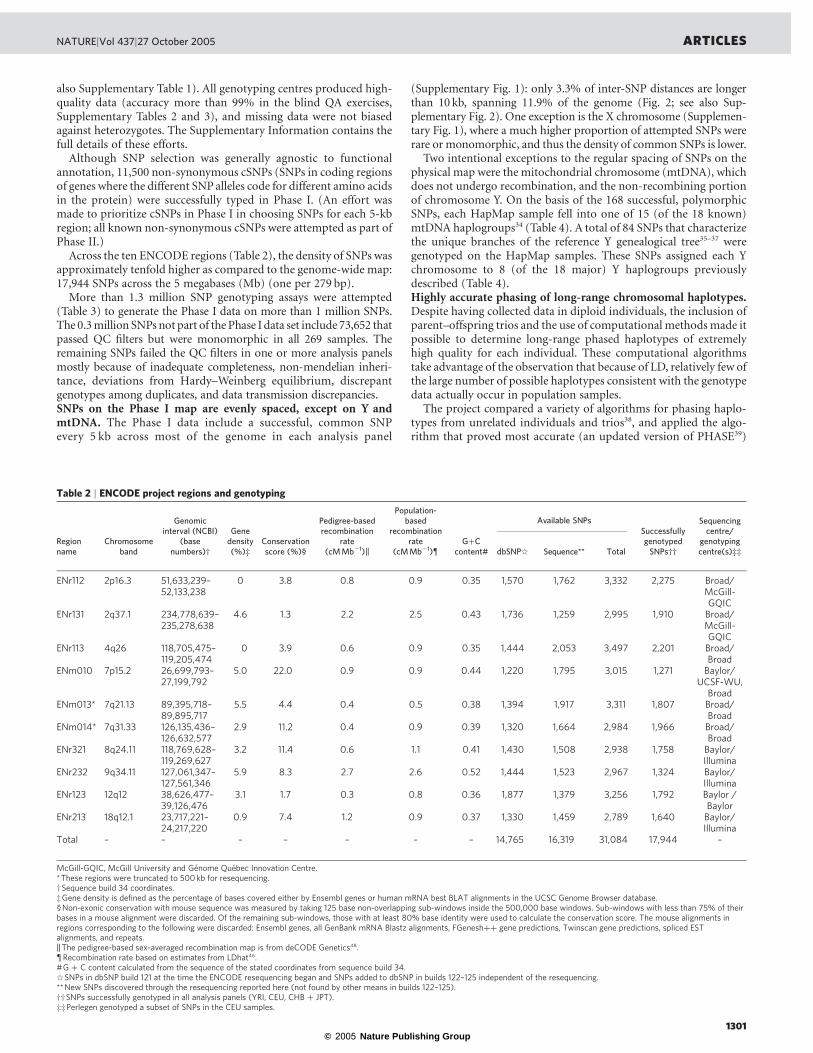
Across the ten ENCODE regions (Table 2), the density of SNPs wasapproximately tenfold higher as compared to the genome-wide map:17,944 SNPs across the 5 megabases (Mb) (one per 279 bp).
More than 1.3 million SNP genotyping assays were attempted(Table 3) to generate the Phase I data on more than 1 million SNPs.The 0.3 million SNPs not part of the Phase I data set include 73,652 thatpassed QC filters but were monomorphic in all 269 samples. Theremaining SNPs failed the QC filters in one or more analysis panelsmostly because of inadequate completeness, non-mendelian inheri-tance, deviations from Hardy–Weinberg equilibrium, discrepantgenotypes among duplicates, and data transmission discrepancies.SNPs on the Phase I map are evenly spaced, except on Y andmtDNA. The Phase I data include a successful, common SNPevery 5 kb across most of the genome in each analysis panel
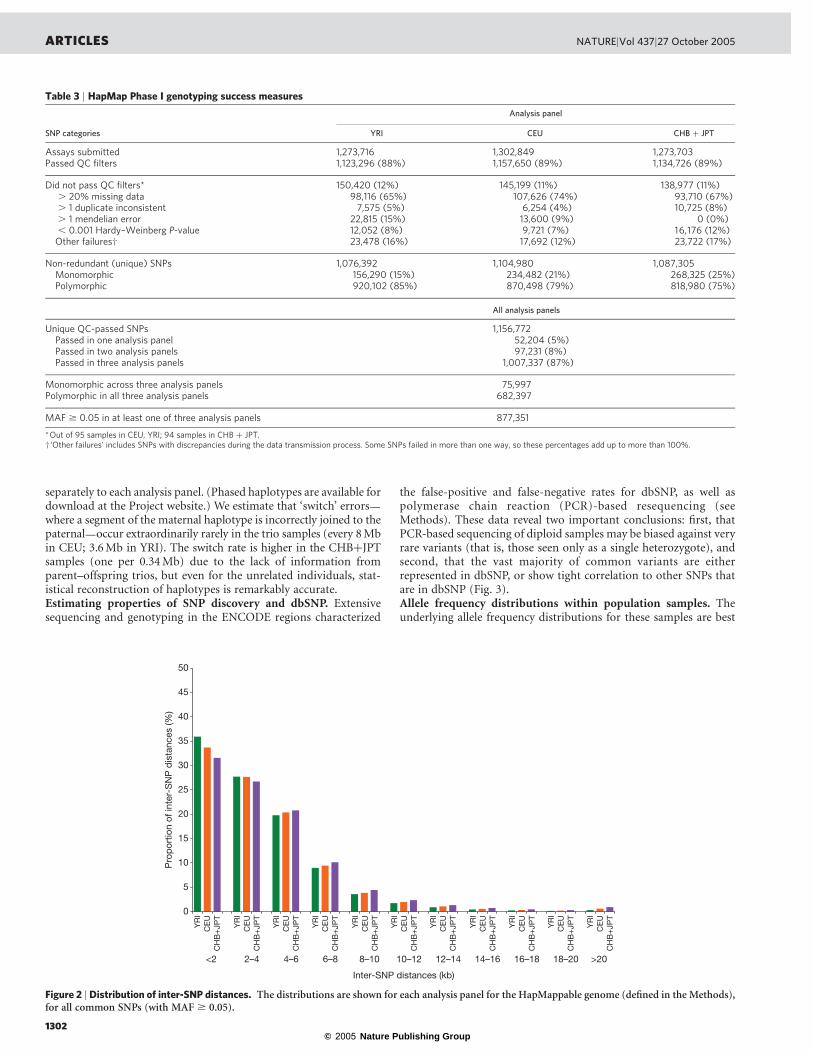
(Supplementary Fig. 1): only 3.3% of inter-SNP distances are longerthan 10 kb, spanning 11.9% of the genome (Fig. 2; see also Sup-plementary Fig. 2). One exception is the X chromosome (Supplemen-tary Fig. 1), where a much higher proportion of attempted SNPs wererare or monomorphic, and thus the density of common SNPs is lower.
Two intentional exceptions to the regular spacing of SNPs on thephysical map were the mitochondrial chromosome (mtDNA), whichdoes not undergo recombination, and the non-recombining portionof chromosome Y. On the basis of the 168 successful, polymorphicSNPs, each HapMap sample fell into one of 15 (of the 18 known)mtDNA haplogroups34 (Table 4). A total of 84 SNPs that characterizethe unique branches of the reference Y genealogical tree35–37 weregenotyped on the HapMap samples. These SNPs assigned each Ychromosome to 8 (of the 18 major) Y haplogroups previouslydescribed (Table 4).Highly accurate phasing of long-range chromosomal haplotypes.Despite having collected data in diploid individuals, the inclusion ofparent–offspring trios and the use of computational methods made itpossible to determine long-range phased haplotypes of extremelyhigh quality for each individual. These computational algorithmstake advantage of the observation that because of LD, relatively few ofthe large number of possible haplotypes consistent with the genotypedata actually occur in population samples.
The project compared a variety of algorithms for phasing haplo-types from unrelated individuals and trios38, and applied the algo-rithm that proved most accurate (an updated version of PHASE39)
Table 2 | ENCODE project regions and genotyping
Regionname
Chromosomeband
Genomicinterval (NCBI)
(basenumbers)†
Genedensity(%)‡
Conservationscore (%)§
Pedigree-basedrecombination
rate(cMMb21)k
Population-based
recombinationrate
(cMMb21){GþC
content# dbSNPq
Available SNPs
Sequence** Total
SuccessfullygenotypedSNPs††
Sequencingcentre/
genotypingcentre(s)‡‡
ENr112 2p16.3 51,633,239–52,133,238
0 3.8 0.8 0.9 0.35 1,570 1,762 3,332 2,275 Broad/McGill-GQIC
ENr131 2q37.1 234,778,639–235,278,638
4.6 1.3 2.2 2.5 0.43 1,736 1,259 2,995 1,910 Broad/McGill-GQIC
ENr113 4q26 118,705,475–119,205,474
0 3.9 0.6 0.9 0.35 1,444 2,053 3,497 2,201 Broad/Broad
ENm010 7p15.2 26,699,793–27,199,792
5.0 22.0 0.9 0.9 0.44 1,220 1,795 3,015 1,271 Baylor/UCSF-WU,
BroadENm013* 7q21.13 89,395,718–
89,895,7175.5 4.4 0.4 0.5 0.38 1,394 1,917 3,311 1,807 Broad/
BroadENm014* 7q31.33 126,135,436–
126,632,5772.9 11.2 0.4 0.9 0.39 1,320 1,664 2,984 1,966 Broad/
BroadENr321 8q24.11 118,769,628–
119,269,6273.2 11.4 0.6 1.1 0.41 1,430 1,508 2,938 1,758 Baylor/
IlluminaENr232 9q34.11 127,061,347–
127,561,3465.9 8.3 2.7 2.6 0.52 1,444 1,523 2,967 1,324 Baylor/
IlluminaENr123 12q12 38,626,477–
39,126,4763.1 1.7 0.3 0.8 0.36 1,877 1,379 3,256 1,792 Baylor /
BaylorENr213 18q12.1 23,717,221–
24,217,2200.9 7.4 1.2 0.9 0.37 1,330 1,459 2,789 1,640 Baylor/
IlluminaTotal – – – – – – – 14,765 16,319 31,084 17,944 –
McGill-GQIC, McGill University and Genome Quebec Innovation Centre.*These regions were truncated to 500 kb for resequencing.†Sequence build 34 coordinates.‡Gene density is defined as the percentage of bases covered either by Ensembl genes or human mRNA best BLAT alignments in the UCSC Genome Browser database.§Non-exonic conservation with mouse sequence was measured by taking 125 base non-overlapping sub-windows inside the 500,000 base windows. Sub-windows with less than 75% of theirbases in a mouse alignment were discarded. Of the remaining sub-windows, those with at least 80% base identity were used to calculate the conservation score. The mouse alignments inregions corresponding to the following were discarded: Ensembl genes, all GenBank mRNA Blastz alignments, FGeneshþþ gene predictions, Twinscan gene predictions, spliced ESTalignments, and repeats.kThe pedigree-based sex-averaged recombination map is from deCODE Genetics48.{Recombination rate based on estimates from LDhat46.#G þ C content calculated from the sequence of the stated coordinates from sequence build 34.qSNPs in dbSNP build 121 at the time the ENCODE resequencing began and SNPs added to dbSNP in builds 122–125 independent of the resequencing.**New SNPs discovered through the resequencing reported here (not found by other means in builds 122–125).††SNPs successfully genotyped in all analysis panels (YRI, CEU, CHB þ JPT).‡‡Perlegen genotyped a subset of SNPs in the CEU samples.
NATURE|Vol 437|27 October 2005 ARTICLES
1301
© 2005 Nature Publishing Group
separately to each analysis panel. (Phased haplotypes are available fordownload at the Project website.) We estimate that ‘switch’ errors—where a segment of the maternal haplotype is incorrectly joined to thepaternal—occur extraordinarily rarely in the trio samples (every 8 Mbin CEU; 3.6 Mb in YRI). The switch rate is higher in the CHBþJPTsamples (one per 0.34 Mb) due to the lack of information fromparent–offspring trios, but even for the unrelated individuals, stat-istical reconstruction of haplotypes is remarkably accurate.Estimating properties of SNP discovery and dbSNP. Extensivesequencing and genotyping in the ENCODE regions characterized
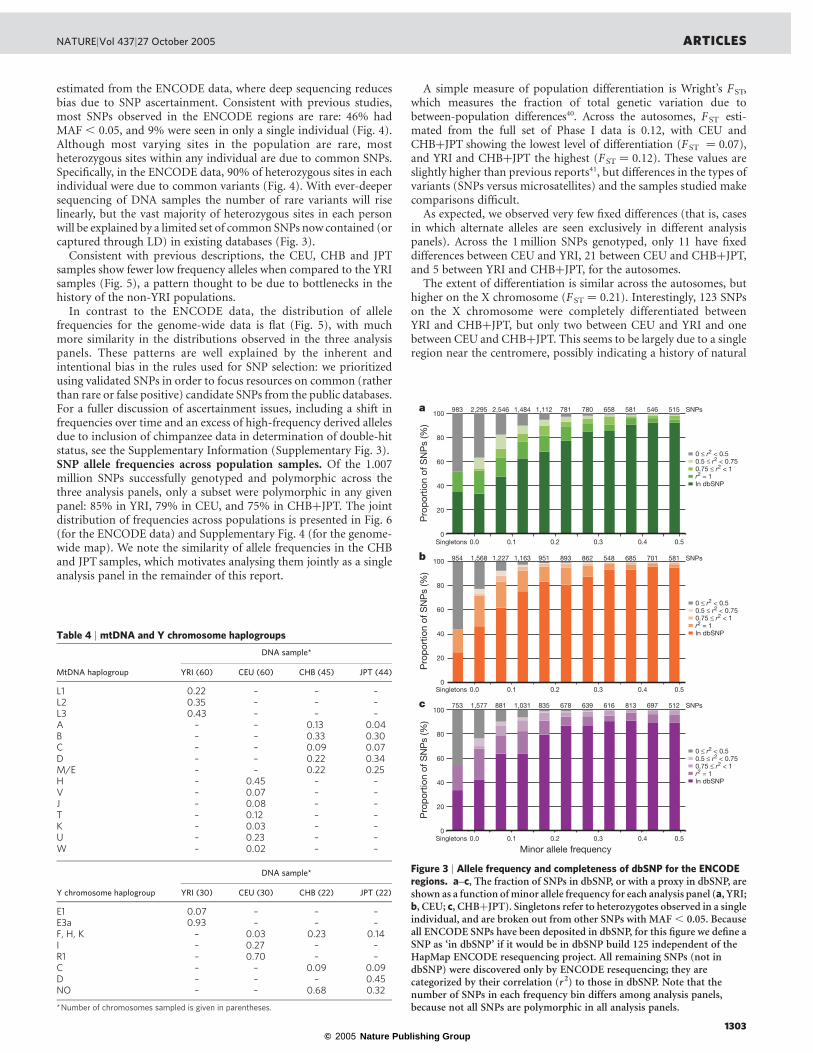
the false-positive and false-negative rates for dbSNP, as well aspolymerase chain reaction (PCR)-based resequencing (seeMethods). These data reveal two important conclusions: first, thatPCR-based sequencing of diploid samples may be biased against veryrare variants (that is, those seen only as a single heterozygote), andsecond, that the vast majority of common variants are eitherrepresented in dbSNP, or show tight correlation to other SNPs thatare in dbSNP (Fig. 3).Allele frequency distributions within population samples. Theunderlying allele frequency distributions for these samples are best
Figure 2 | Distribution of inter-SNP distances. The distributions are shown for each analysis panel for the HapMappable genome (defined in the Methods),for all common SNPs (with MAF $ 0.05).
Table 3 | HapMap Phase I genotyping success measures
Analysis panel
SNP categories YRI CEU CHB þ JPT
Assays submitted 1,273,716 1,302,849 1,273,703Passed QC filters 1,123,296 (88%) 1,157,650 (89%) 1,134,726 (89%)
Did not pass QC filters* 150,420 (12%) 145,199 (11%) 138,977 (11%). 20% missing data 98,116 (65%) 107,626 (74%) 93,710 (67%). 1 duplicate inconsistent 7,575 (5%) 6,254 (4%) 10,725 (8%). 1 mendelian error 22,815 (15%) 13,600 (9%) 0 (0%), 0.001 Hardy–Weinberg P-value 12,052 (8%) 9,721 (7%) 16,176 (12%)Other failures† 23,478 (16%) 17,692 (12%) 23,722 (17%)
Non-redundant (unique) SNPs 1,076,392 1,104,980 1,087,305Monomorphic 156,290 (15%) 234,482 (21%) 268,325 (25%)Polymorphic 920,102 (85%) 870,498 (79%) 818,980 (75%)
All analysis panels
Unique QC-passed SNPs 1,156,772Passed in one analysis panel 52,204 (5%)Passed in two analysis panels 97,231 (8%)Passed in three analysis panels 1,007,337 (87%)
Monomorphic across three analysis panels 75,997Polymorphic in all three analysis panels 682,397
MAF $ 0.05 in at least one of three analysis panels 877,351
*Out of 95 samples in CEU, YRI; 94 samples in CHB þ JPT.†‘Other failures’ includes SNPs with discrepancies during the data transmission process. Some SNPs failed in more than one way, so these percentages add up to more than 100%.
ARTICLES NATURE|Vol 437|27 October 2005
1302
© 2005 Nature Publishing Group
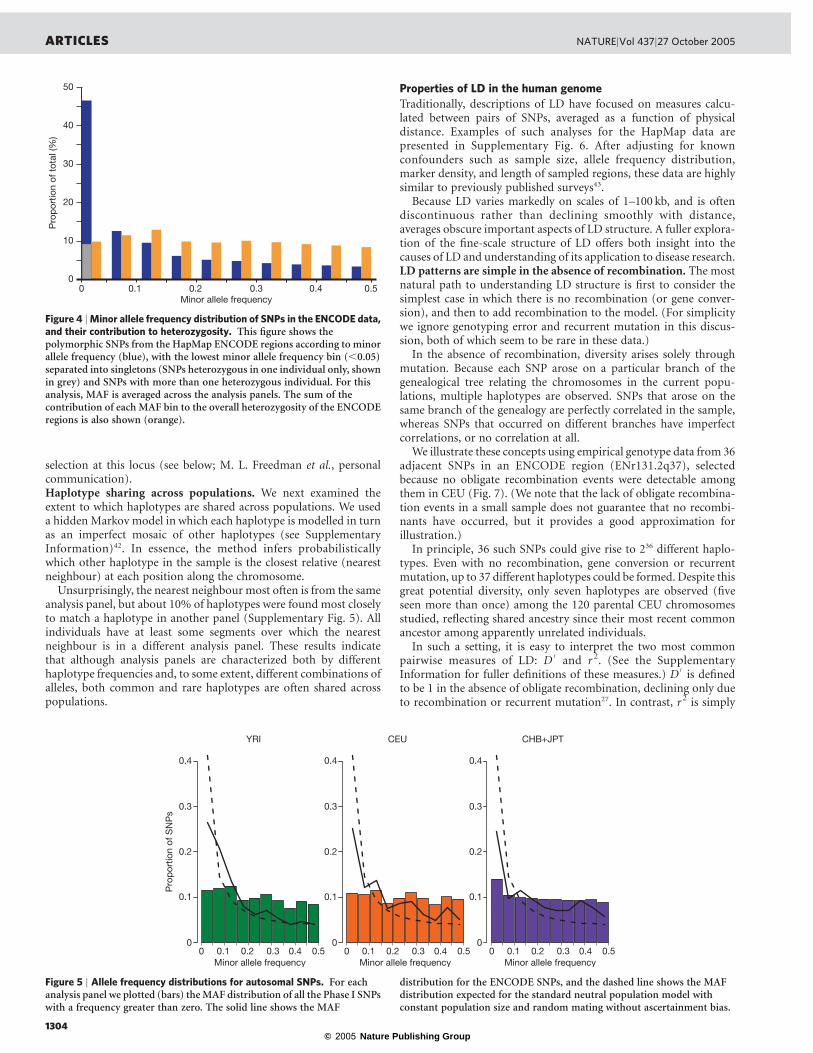
estimated from the ENCODE data, where deep sequencing reducesbias due to SNP ascertainment. Consistent with previous studies,most SNPs observed in the ENCODE regions are rare: 46% hadMAF , 0.05, and 9% were seen in only a single individual (Fig. 4).Although most varying sites in the population are rare, mostheterozygous sites within any individual are due to common SNPs.Specifically, in the ENCODE data, 90% of heterozygous sites in eachindividual were due to common variants (Fig. 4). With ever-deepersequencing of DNA samples the number of rare variants will riselinearly, but the vast majority of heterozygous sites in each personwill be explained by a limited set of common SNPs now contained (orcaptured through LD) in existing databases (Fig. 3).
Consistent with previous descriptions, the CEU, CHB and JPTsamples show fewer low frequency alleles when compared to the YRIsamples (Fig. 5), a pattern thought to be due to bottlenecks in thehistory of the non-YRI populations.
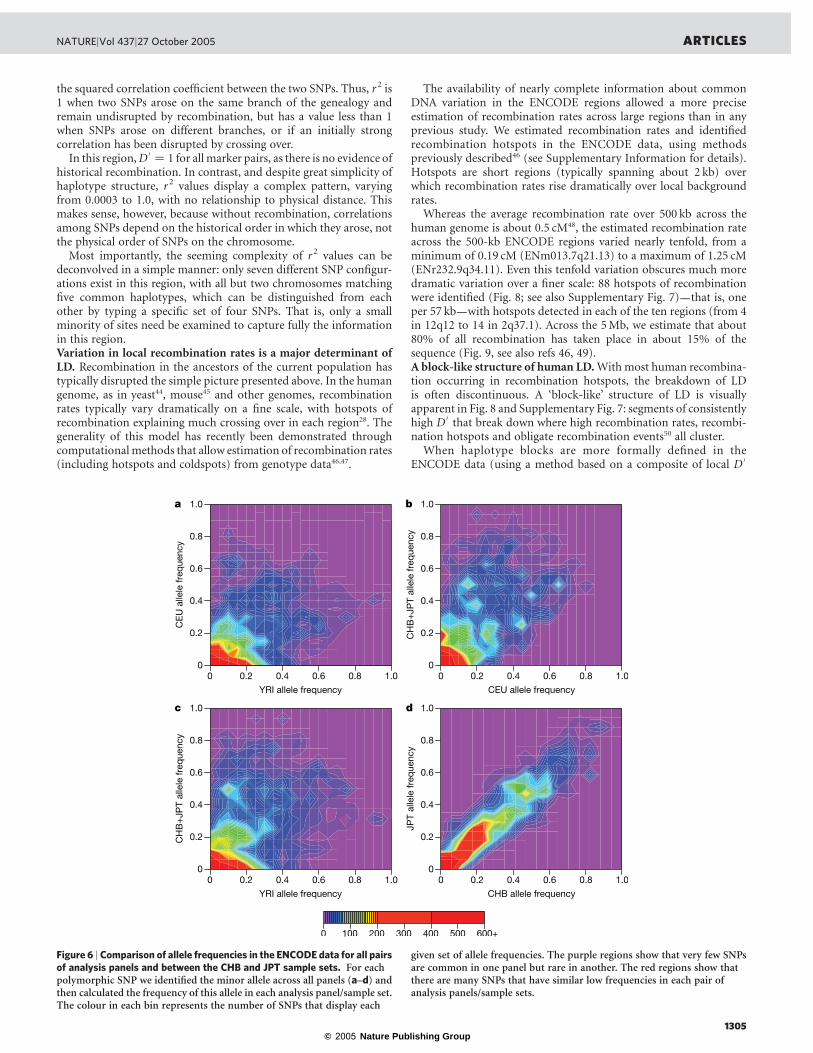
In contrast to the ENCODE data, the distribution of allelefrequencies for the genome-wide data is flat (Fig. 5), with muchmore similarity in the distributions observed in the three analysispanels. These patterns are well explained by the inherent andintentional bias in the rules used for SNP selection: we prioritizedusing validated SNPs in order to focus resources on common (ratherthan rare or false positive) candidate SNPs from the public databases.For a fuller discussion of ascertainment issues, including a shift infrequencies over time and an excess of high-frequency derived allelesdue to inclusion of chimpanzee data in determination of double-hitstatus, see the Supplementary Information (Supplementary Fig. 3).SNP allele frequencies across population samples. Of the 1.007million SNPs successfully genotyped and polymorphic across thethree analysis panels, only a subset were polymorphic in any givenpanel: 85% in YRI, 79% in CEU, and 75% in CHBþJPT. The jointdistribution of frequencies across populations is presented in Fig. 6(for the ENCODE data) and Supplementary Fig. 4 (for the genome-wide map). We note the similarity of allele frequencies in the CHBand JPT samples, which motivates analysing them jointly as a singleanalysis panel in the remainder of this report.
A simple measure of population differentiation is Wright’s FST,which measures the fraction of total genetic variation due tobetween-population differences40. Across the autosomes, FST esti-mated from the full set of Phase I data is 0.12, with CEU andCHBþJPT showing the lowest level of differentiation (FST ¼ 0.07),and YRI and CHBþJPT the highest (FST ¼ 0.12). These values areslightly higher than previous reports41, but differences in the types ofvariants (SNPs versus microsatellites) and the samples studied makecomparisons difficult.
As expected, we observed very few fixed differences (that is, casesin which alternate alleles are seen exclusively in different analysispanels). Across the 1 million SNPs genotyped, only 11 have fixeddifferences between CEU and YRI, 21 between CEU and CHBþJPT,and 5 between YRI and CHBþJPT, for the autosomes.
The extent of differentiation is similar across the autosomes, buthigher on the X chromosome (FST ¼ 0.21). Interestingly, 123 SNPson the X chromosome were completely differentiated betweenYRI and CHBþJPT, but only two between CEU and YRI and onebetween CEU and CHBþJPT. This seems to be largely due to a singleregion near the centromere, possibly indicating a history of natural
Table 4 | mtDNA and Y chromosome haplogroups
DNA sample*
MtDNA haplogroup YRI (60) CEU (60) CHB (45) JPT (44)
L1 0.22 – – –L2 0.35 – – –L3 0.43 – – –A – – 0.13 0.04B – – 0.33 0.30C – – 0.09 0.07D – – 0.22 0.34M/E – – 0.22 0.25H – 0.45 – –V – 0.07 – –J – 0.08 – –T – 0.12 – –K – 0.03 – –U – 0.23 – –W – 0.02 – –
DNA sample*
Y chromosome haplogroup YRI (30) CEU (30) CHB (22) JPT (22)
E1 0.07 – – –E3a 0.93 – – –F, H, K – 0.03 0.23 0.14I – 0.27 – –R1 – 0.70 – –C – – 0.09 0.09D – – – 0.45NO – – 0.68 0.32
*Number of chromosomes sampled is given in parentheses.
Figure 3 | Allele frequency and completeness of dbSNP for the ENCODEregions. a–c, The fraction of SNPs in dbSNP, or with a proxy in dbSNP, areshown as a function of minor allele frequency for each analysis panel (a, YRI;b, CEU; c, CHBþJPT). Singletons refer to heterozygotes observed in a singleindividual, and are broken out from other SNPs with MAF , 0.05. Becauseall ENCODE SNPs have been deposited in dbSNP, for this figure we define aSNP as ‘in dbSNP’ if it would be in dbSNP build 125 independent of theHapMap ENCODE resequencing project. All remaining SNPs (not indbSNP) were discovered only by ENCODE resequencing; they arecategorized by their correlation (r2) to those in dbSNP. Note that thenumber of SNPs in each frequency bin differs among analysis panels,because not all SNPs are polymorphic in all analysis panels.
NATURE|Vol 437|27 October 2005 ARTICLES
1303
© 2005 Nature Publishing Group
selection at this locus (see below; M. L. Freedman et al., personalcommunication).Haplotype sharing across populations. We next examined theextent to which haplotypes are shared across populations. We useda hidden Markov model in which each haplotype is modelled in turnas an imperfect mosaic of other haplotypes (see SupplementaryInformation)42. In essence, the method infers probabilisticallywhich other haplotype in the sample is the closest relative (nearestneighbour) at each position along the chromosome.
Unsurprisingly, the nearest neighbour most often is from the sameanalysis panel, but about 10% of haplotypes were found most closelyto match a haplotype in another panel (Supplementary Fig. 5). Allindividuals have at least some segments over which the nearestneighbour is in a different analysis panel. These results indicatethat although analysis panels are characterized both by differenthaplotype frequencies and, to some extent, different combinations ofalleles, both common and rare haplotypes are often shared acrosspopulations.
Properties of LD in the human genome
Traditionally, descriptions of LD have focused on measures calcu-lated between pairs of SNPs, averaged as a function of physicaldistance. Examples of such analyses for the HapMap data arepresented in Supplementary Fig. 6. After adjusting for knownconfounders such as sample size, allele frequency distribution,marker density, and length of sampled regions, these data are highlysimilar to previously published surveys43.
Because LD varies markedly on scales of 1–100 kb, and is oftendiscontinuous rather than declining smoothly with distance,averages obscure important aspects of LD structure. A fuller explora-tion of the fine-scale structure of LD offers both insight into thecauses of LD and understanding of its application to disease research.LD patterns are simple in the absence of recombination. The mostnatural path to understanding LD structure is first to consider thesimplest case in which there is no recombination (or gene conver-sion), and then to add recombination to the model. (For simplicitywe ignore genotyping error and recurrent mutation in this discus-sion, both of which seem to be rare in these data.)
In the absence of recombination, diversity arises solely throughmutation. Because each SNP arose on a particular branch of thegenealogical tree relating the chromosomes in the current popu-lations, multiple haplotypes are observed. SNPs that arose on thesame branch of the genealogy are perfectly correlated in the sample,whereas SNPs that occurred on different branches have imperfectcorrelations, or no correlation at all.
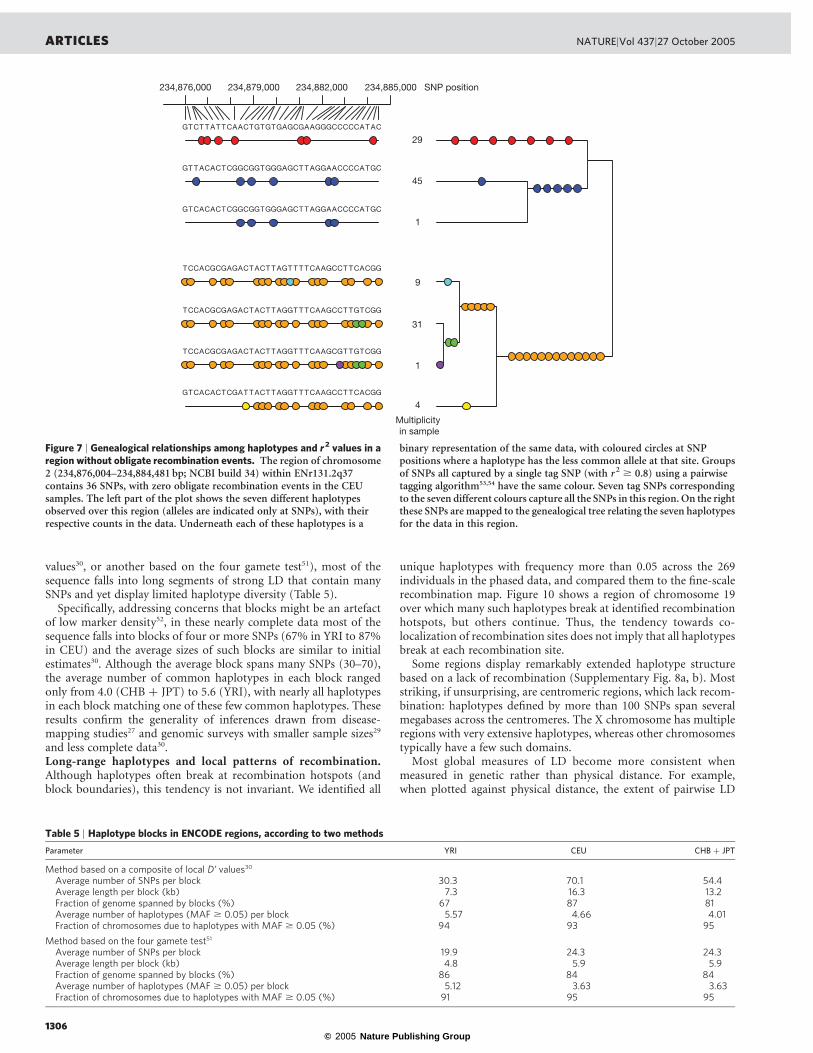
We illustrate these concepts using empirical genotype data from 36adjacent SNPs in an ENCODE region (ENr131.2q37), selectedbecause no obligate recombination events were detectable amongthem in CEU (Fig. 7). (We note that the lack of obligate recombina-tion events in a small sample does not guarantee that no recombi-nants have occurred, but it provides a good approximation forillustration.)
In principle, 36 such SNPs could give rise to 236 different haplo-types. Even with no recombination, gene conversion or recurrentmutation, up to 37 different haplotypes could be formed. Despite thisgreat potential diversity, only seven haplotypes are observed (fiveseen more than once) among the 120 parental CEU chromosomesstudied, reflecting shared ancestry since their most recent commonancestor among apparently unrelated individuals.
In such a setting, it is easy to interpret the two most commonpairwise measures of LD: D 0 and r 2. (See the SupplementaryInformation for fuller definitions of these measures.) D
0is defined
to be 1 in the absence of obligate recombination, declining only dueto recombination or recurrent mutation27. In contrast, r2 is simply
Figure 4 |Minor allele frequency distribution of SNPs in the ENCODE data,and their contribution to heterozygosity. This figure shows thepolymorphic SNPs from the HapMap ENCODE regions according to minorallele frequency (blue), with the lowest minor allele frequency bin (,0.05)separated into singletons (SNPs heterozygous in one individual only, shownin grey) and SNPs with more than one heterozygous individual. For thisanalysis, MAF is averaged across the analysis panels. The sum of thecontribution of each MAF bin to the overall heterozygosity of the ENCODEregions is also shown (orange).
Figure 5 | Allele frequency distributions for autosomal SNPs. For eachanalysis panel we plotted (bars) the MAF distribution of all the Phase I SNPswith a frequency greater than zero. The solid line shows the MAF
distribution for the ENCODE SNPs, and the dashed line shows the MAFdistribution expected for the standard neutral population model withconstant population size and random mating without ascertainment bias.
ARTICLES NATURE|Vol 437|27 October 2005
1304
© 2005 Nature Publishing Group
the squared correlation coefficient between the two SNPs. Thus, r2 is1 when two SNPs arose on the same branch of the genealogy andremain undisrupted by recombination, but has a value less than 1when SNPs arose on different branches, or if an initially strongcorrelation has been disrupted by crossing over.
In this region,D 0¼ 1 for all marker pairs, as there is no evidence of
historical recombination. In contrast, and despite great simplicity ofhaplotype structure, r2 values display a complex pattern, varyingfrom 0.0003 to 1.0, with no relationship to physical distance. Thismakes sense, however, because without recombination, correlationsamong SNPs depend on the historical order in which they arose, notthe physical order of SNPs on the chromosome.
Most importantly, the seeming complexity of r2 values can bedeconvolved in a simple manner: only seven different SNP configur-ations exist in this region, with all but two chromosomes matchingfive common haplotypes, which can be distinguished from eachother by typing a specific set of four SNPs. That is, only a smallminority of sites need be examined to capture fully the informationin this region.Variation in local recombination rates is a major determinant ofLD. Recombination in the ancestors of the current population hastypically disrupted the simple picture presented above. In the humangenome, as in yeast44, mouse45 and other genomes, recombinationrates typically vary dramatically on a fine scale, with hotspots ofrecombination explaining much crossing over in each region28. Thegenerality of this model has recently been demonstrated throughcomputational methods that allow estimation of recombination rates(including hotspots and coldspots) from genotype data46,47.
The availability of nearly complete information about commonDNA variation in the ENCODE regions allowed a more preciseestimation of recombination rates across large regions than in anyprevious study. We estimated recombination rates and identifiedrecombination hotspots in the ENCODE data, using methodspreviously described46 (see Supplementary Information for details).Hotspots are short regions (typically spanning about 2 kb) overwhich recombination rates rise dramatically over local backgroundrates.
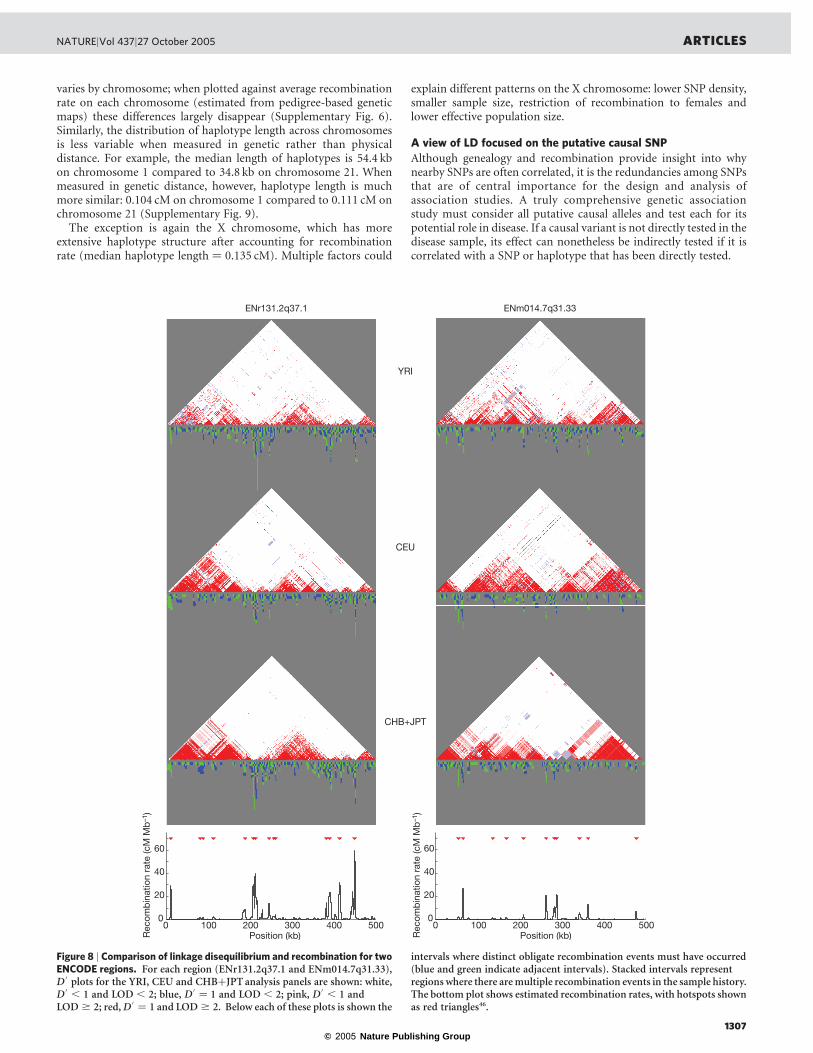
Whereas the average recombination rate over 500 kb across thehuman genome is about 0.5 cM48, the estimated recombination rateacross the 500-kb ENCODE regions varied nearly tenfold, from aminimum of 0.19 cM (ENm013.7q21.13) to a maximum of 1.25 cM(ENr232.9q34.11). Even this tenfold variation obscures much moredramatic variation over a finer scale: 88 hotspots of recombinationwere identified (Fig. 8; see also Supplementary Fig. 7)—that is, oneper 57 kb—with hotspots detected in each of the ten regions (from 4in 12q12 to 14 in 2q37.1). Across the 5 Mb, we estimate that about80% of all recombination has taken place in about 15% of thesequence (Fig. 9, see also refs 46, 49).Ablock-like structure of human LD. With most human recombina-tion occurring in recombination hotspots, the breakdown of LDis often discontinuous. A ‘block-like’ structure of LD is visuallyapparent in Fig. 8 and Supplementary Fig. 7: segments of consistentlyhigh D
0that break down where high recombination rates, recombi-
nation hotspots and obligate recombination events50 all cluster.When haplotype blocks are more formally defined in the
ENCODE data (using a method based on a composite of local D 0
Figure 6 | Comparison of allele frequencies in the ENCODE data for all pairsof analysis panels and between the CHB and JPT sample sets. For eachpolymorphic SNP we identified the minor allele across all panels (a–d) andthen calculated the frequency of this allele in each analysis panel/sample set.The colour in each bin represents the number of SNPs that display each
given set of allele frequencies. The purple regions show that very few SNPsare common in one panel but rare in another. The red regions show thatthere are many SNPs that have similar low frequencies in each pair ofanalysis panels/sample sets.
NATURE|Vol 437|27 October 2005 ARTICLES
1305
© 2005 Nature Publishing Group
values30, or another based on the four gamete test51), most of thesequence falls into long segments of strong LD that contain manySNPs and yet display limited haplotype diversity (Table 5).
Specifically, addressing concerns that blocks might be an artefactof low marker density52, in these nearly complete data most of thesequence falls into blocks of four or more SNPs (67% in YRI to 87%in CEU) and the average sizes of such blocks are similar to initialestimates30. Although the average block spans many SNPs (30–70),the average number of common haplotypes in each block rangedonly from 4.0 (CHB þ JPT) to 5.6 (YRI), with nearly all haplotypesin each block matching one of these few common haplotypes. Theseresults confirm the generality of inferences drawn from disease-mapping studies27 and genomic surveys with smaller sample sizes29
and less complete data30.Long-range haplotypes and local patterns of recombination.Although haplotypes often break at recombination hotspots (andblock boundaries), this tendency is not invariant. We identified all
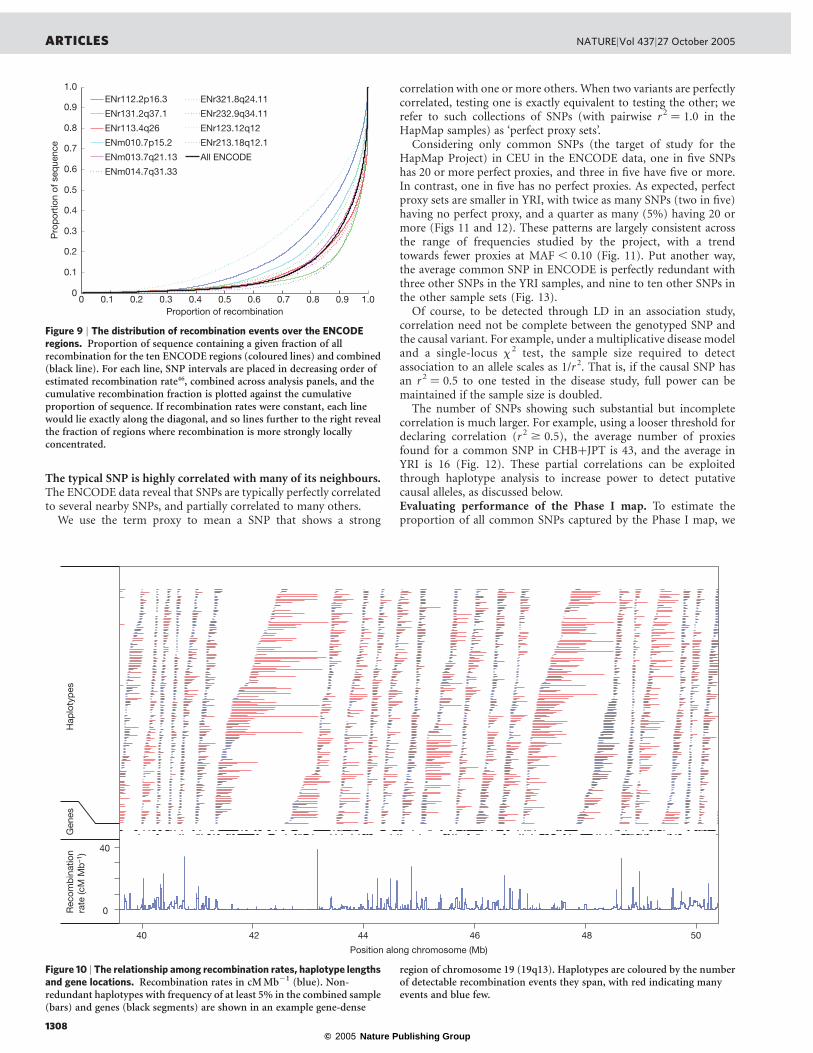
unique haplotypes with frequency more than 0.05 across the 269individuals in the phased data, and compared them to the fine-scalerecombination map. Figure 10 shows a region of chromosome 19over which many such haplotypes break at identified recombinationhotspots, but others continue. Thus, the tendency towards co-localization of recombination sites does not imply that all haplotypesbreak at each recombination site.
Some regions display remarkably extended haplotype structurebased on a lack of recombination (Supplementary Fig. 8a, b). Moststriking, if unsurprising, are centromeric regions, which lack recom-bination: haplotypes defined by more than 100 SNPs span severalmegabases across the centromeres. The X chromosome has multipleregions with very extensive haplotypes, whereas other chromosomestypically have a few such domains.
Most global measures of LD become more consistent whenmeasured in genetic rather than physical distance. For example,when plotted against physical distance, the extent of pairwise LD
Table 5 | Haplotype blocks in ENCODE regions, according to two methods
Parameter YRI CEU CHB þ JPT
Method based on a composite of local D’ values30
Average number of SNPs per block 30.3 70.1 54.4Average length per block (kb) 7.3 16.3 13.2Fraction of genome spanned by blocks (%) 67 87 81Average number of haplotypes (MAF $ 0.05) per block 5.57 4.66 4.01Fraction of chromosomes due to haplotypes with MAF $ 0.05 (%) 94 93 95
Method based on the four gamete test51
Average number of SNPs per block 19.9 24.3 24.3Average length per block (kb) 4.8 5.9 5.9Fraction of genome spanned by blocks (%) 86 84 84Average number of haplotypes (MAF $ 0.05) per block 5.12 3.63 3.63Fraction of chromosomes due to haplotypes with MAF $ 0.05 (%) 91 95 95
Figure 7 | Genealogical relationships among haplotypes and r2 values in aregion without obligate recombination events. The region of chromosome2 (234,876,004–234,884,481 bp; NCBI build 34) within ENr131.2q37contains 36 SNPs, with zero obligate recombination events in the CEUsamples. The left part of the plot shows the seven different haplotypesobserved over this region (alleles are indicated only at SNPs), with theirrespective counts in the data. Underneath each of these haplotypes is a
binary representation of the same data, with coloured circles at SNPpositions where a haplotype has the less common allele at that site. Groupsof SNPs all captured by a single tag SNP (with r2 $ 0.8) using a pairwisetagging algorithm53,54 have the same colour. Seven tag SNPs correspondingto the seven different colours capture all the SNPs in this region. On the rightthese SNPs are mapped to the genealogical tree relating the seven haplotypesfor the data in this region.
ARTICLES NATURE|Vol 437|27 October 2005
1306
© 2005 Nature Publishing Group
varies by chromosome; when plotted against average recombinationrate on each chromosome (estimated from pedigree-based geneticmaps) these differences largely disappear (Supplementary Fig. 6).Similarly, the distribution of haplotype length across chromosomesis less variable when measured in genetic rather than physicaldistance. For example, the median length of haplotypes is 54.4 kbon chromosome 1 compared to 34.8 kb on chromosome 21. Whenmeasured in genetic distance, however, haplotype length is muchmore similar: 0.104 cM on chromosome 1 compared to 0.111 cM onchromosome 21 (Supplementary Fig. 9).
The exception is again the X chromosome, which has moreextensive haplotype structure after accounting for recombinationrate (median haplotype length ¼ 0.135 cM). Multiple factors could
explain different patterns on the X chromosome: lower SNP density,smaller sample size, restriction of recombination to females andlower effective population size.
A view of LD focused on the putative causal SNP
Although genealogy and recombination provide insight into whynearby SNPs are often correlated, it is the redundancies among SNPsthat are of central importance for the design and analysis ofassociation studies. A truly comprehensive genetic associationstudy must consider all putative causal alleles and test each for itspotential role in disease. If a causal variant is not directly tested in thedisease sample, its effect can nonetheless be indirectly tested if it iscorrelated with a SNP or haplotype that has been directly tested.
Figure 8 | Comparison of linkage disequilibrium and recombination for twoENCODE regions. For each region (ENr131.2q37.1 and ENm014.7q31.33),D 0 plots for the YRI, CEU and CHBþJPT analysis panels are shown: white,D 0
, 1 and LOD , 2; blue, D 0¼ 1 and LOD , 2; pink, D 0
, 1 andLOD $ 2; red, D 0
¼ 1 and LOD $ 2. Below each of these plots is shown the
intervals where distinct obligate recombination events must have occurred(blue and green indicate adjacent intervals). Stacked intervals representregions where there are multiple recombination events in the sample history.The bottom plot shows estimated recombination rates, with hotspots shownas red triangles46.
NATURE|Vol 437|27 October 2005 ARTICLES
1307
© 2005 Nature Publishing Group
The typical SNP is highly correlated with many of its neighbours.The ENCODE data reveal that SNPs are typically perfectly correlatedto several nearby SNPs, and partially correlated to many others.
We use the term proxy to mean a SNP that shows a strong
correlation with one or more others. When two variants are perfectlycorrelated, testing one is exactly equivalent to testing the other; werefer to such collections of SNPs (with pairwise r2 ¼ 1.0 in theHapMap samples) as ‘perfect proxy sets’.
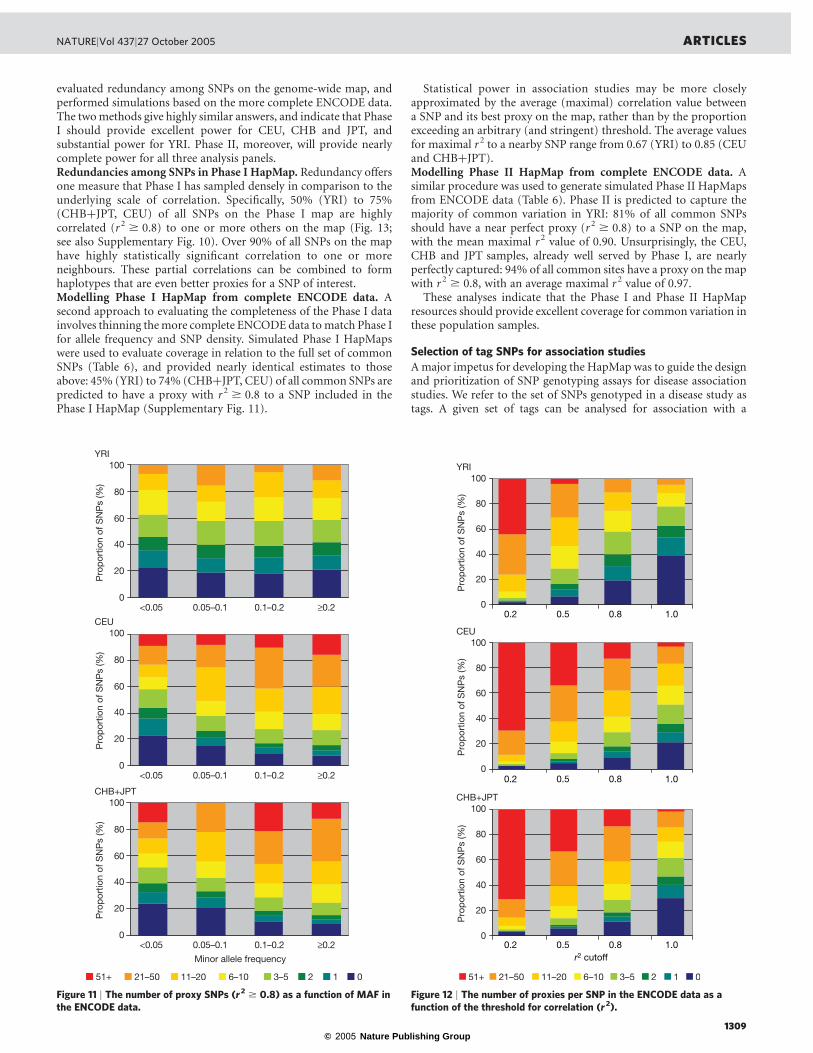
Considering only common SNPs (the target of study for theHapMap Project) in CEU in the ENCODE data, one in five SNPshas 20 or more perfect proxies, and three in five have five or more.In contrast, one in five has no perfect proxies. As expected, perfectproxy sets are smaller in YRI, with twice as many SNPs (two in five)having no perfect proxy, and a quarter as many (5%) having 20 ormore (Figs 11 and 12). These patterns are largely consistent acrossthe range of frequencies studied by the project, with a trendtowards fewer proxies at MAF , 0.10 (Fig. 11). Put another way,the average common SNP in ENCODE is perfectly redundant withthree other SNPs in the YRI samples, and nine to ten other SNPs inthe other sample sets (Fig. 13).
Of course, to be detected through LD in an association study,correlation need not be complete between the genotyped SNP andthe causal variant. For example, under a multiplicative disease modeland a single-locus x 2 test, the sample size required to detectassociation to an allele scales as 1/r2. That is, if the causal SNP hasan r2 ¼ 0.5 to one tested in the disease study, full power can bemaintained if the sample size is doubled.
The number of SNPs showing such substantial but incompletecorrelation is much larger. For example, using a looser threshold fordeclaring correlation (r2 $ 0.5), the average number of proxiesfound for a common SNP in CHBþJPT is 43, and the average inYRI is 16 (Fig. 12). These partial correlations can be exploitedthrough haplotype analysis to increase power to detect putativecausal alleles, as discussed below.Evaluating performance of the Phase I map. To estimate theproportion of all common SNPs captured by the Phase I map, we
Figure 10 | The relationship among recombination rates, haplotype lengthsand gene locations. Recombination rates in cM Mb21 (blue). Non-redundant haplotypes with frequency of at least 5% in the combined sample(bars) and genes (black segments) are shown in an example gene-dense
region of chromosome 19 (19q13). Haplotypes are coloured by the numberof detectable recombination events they span, with red indicating manyevents and blue few.
Figure 9 | The distribution of recombination events over the ENCODEregions. Proportion of sequence containing a given fraction of allrecombination for the ten ENCODE regions (coloured lines) and combined(black line). For each line, SNP intervals are placed in decreasing order ofestimated recombination rate46, combined across analysis panels, and thecumulative recombination fraction is plotted against the cumulativeproportion of sequence. If recombination rates were constant, each linewould lie exactly along the diagonal, and so lines further to the right revealthe fraction of regions where recombination is more strongly locallyconcentrated.
ARTICLES NATURE|Vol 437|27 October 2005
1308
© 2005 Nature Publishing Group
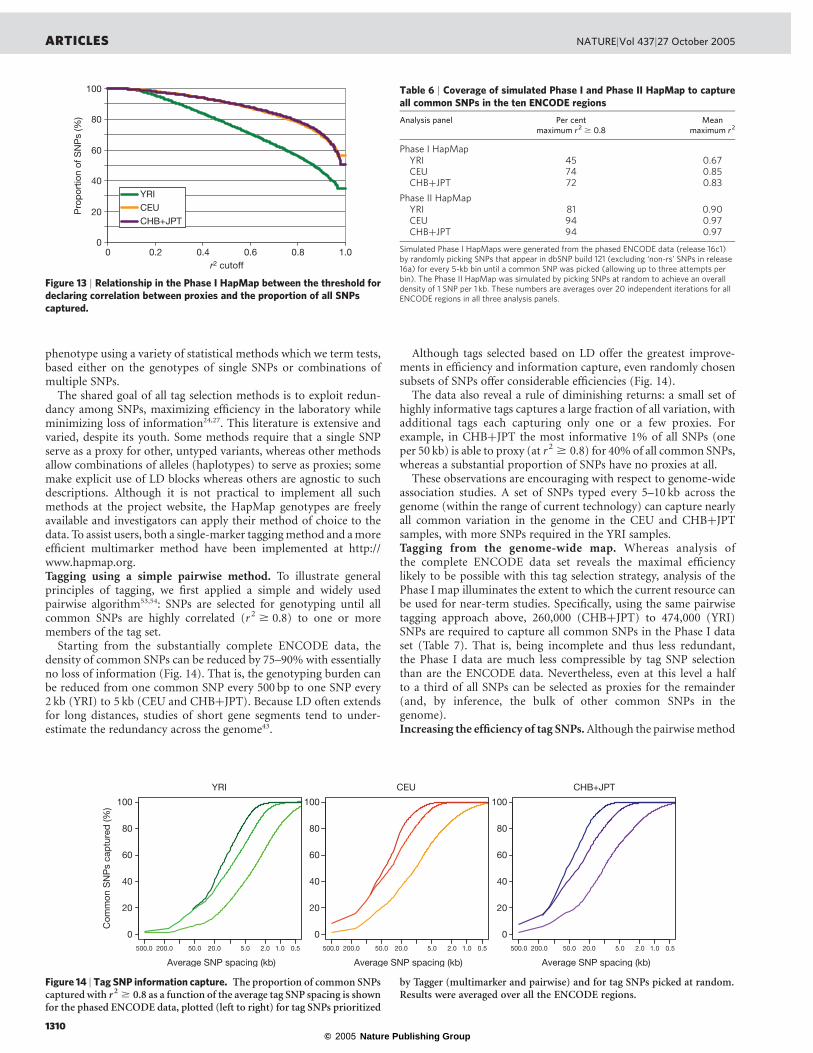
evaluated redundancy among SNPs on the genome-wide map, andperformed simulations based on the more complete ENCODE data.The two methods give highly similar answers, and indicate that PhaseI should provide excellent power for CEU, CHB and JPT, andsubstantial power for YRI. Phase II, moreover, will provide nearlycomplete power for all three analysis panels.Redundancies among SNPs in Phase I HapMap. Redundancy offersone measure that Phase I has sampled densely in comparison to theunderlying scale of correlation. Specifically, 50% (YRI) to 75%(CHBþJPT, CEU) of all SNPs on the Phase I map are highlycorrelated (r2 $ 0.8) to one or more others on the map (Fig. 13;see also Supplementary Fig. 10). Over 90% of all SNPs on the maphave highly statistically significant correlation to one or moreneighbours. These partial correlations can be combined to formhaplotypes that are even better proxies for a SNP of interest.Modelling Phase I HapMap from complete ENCODE data. Asecond approach to evaluating the completeness of the Phase I datainvolves thinning the more complete ENCODE data to match Phase Ifor allele frequency and SNP density. Simulated Phase I HapMapswere used to evaluate coverage in relation to the full set of commonSNPs (Table 6), and provided nearly identical estimates to thoseabove: 45% (YRI) to 74% (CHBþJPT, CEU) of all common SNPs arepredicted to have a proxy with r2 $ 0.8 to a SNP included in thePhase I HapMap (Supplementary Fig. 11).
Statistical power in association studies may be more closelyapproximated by the average (maximal) correlation value betweena SNP and its best proxy on the map, rather than by the proportionexceeding an arbitrary (and stringent) threshold. The average valuesfor maximal r2 to a nearby SNP range from 0.67 (YRI) to 0.85 (CEUand CHBþJPT).Modelling Phase II HapMap from complete ENCODE data. Asimilar procedure was used to generate simulated Phase II HapMapsfrom ENCODE data (Table 6). Phase II is predicted to capture themajority of common variation in YRI: 81% of all common SNPsshould have a near perfect proxy (r2 $ 0.8) to a SNP on the map,with the mean maximal r2 value of 0.90. Unsurprisingly, the CEU,CHB and JPT samples, already well served by Phase I, are nearlyperfectly captured: 94% of all common sites have a proxy on the mapwith r2 $ 0.8, with an average maximal r2 value of 0.97.
These analyses indicate that the Phase I and Phase II HapMapresources should provide excellent coverage for common variation inthese population samples.
Selection of tag SNPs for association studies
A major impetus for developing the HapMap was to guide the designand prioritization of SNP genotyping assays for disease associationstudies. We refer to the set of SNPs genotyped in a disease study astags. A given set of tags can be analysed for association with a
Figure 11 | The number of proxy SNPs (r2 $ 0.8) as a function of MAF inthe ENCODE data.
Figure 12 | The number of proxies per SNP in the ENCODE data as afunction of the threshold for correlation (r2).
NATURE|Vol 437|27 October 2005 ARTICLES
1309
© 2005 Nature Publishing Group
phenotype using a variety of statistical methods which we term tests,based either on the genotypes of single SNPs or combinations ofmultiple SNPs.
The shared goal of all tag selection methods is to exploit redun-dancy among SNPs, maximizing efficiency in the laboratory whileminimizing loss of information24,27. This literature is extensive andvaried, despite its youth. Some methods require that a single SNPserve as a proxy for other, untyped variants, whereas other methodsallow combinations of alleles (haplotypes) to serve as proxies; somemake explicit use of LD blocks whereas others are agnostic to suchdescriptions. Although it is not practical to implement all suchmethods at the project website, the HapMap genotypes are freelyavailable and investigators can apply their method of choice to thedata. To assist users, both a single-marker tagging method and a moreefficient multimarker method have been implemented at http://www.hapmap.org.Tagging using a simple pairwise method. To illustrate generalprinciples of tagging, we first applied a simple and widely usedpairwise algorithm53,54: SNPs are selected for genotyping until allcommon SNPs are highly correlated (r2 $ 0.8) to one or moremembers of the tag set.
Starting from the substantially complete ENCODE data, thedensity of common SNPs can be reduced by 75–90% with essentiallyno loss of information (Fig. 14). That is, the genotyping burden canbe reduced from one common SNP every 500 bp to one SNP every2 kb (YRI) to 5 kb (CEU and CHBþJPT). Because LD often extendsfor long distances, studies of short gene segments tend to under-estimate the redundancy across the genome43.
Although tags selected based on LD offer the greatest improve-ments in efficiency and information capture, even randomly chosensubsets of SNPs offer considerable efficiencies (Fig. 14).
The data also reveal a rule of diminishing returns: a small set ofhighly informative tags captures a large fraction of all variation, withadditional tags each capturing only one or a few proxies. Forexample, in CHBþJPT the most informative 1% of all SNPs (oneper 50 kb) is able to proxy (at r2 $ 0.8) for 40% of all common SNPs,whereas a substantial proportion of SNPs have no proxies at all.
These observations are encouraging with respect to genome-wideassociation studies. A set of SNPs typed every 5–10 kb across thegenome (within the range of current technology) can capture nearlyall common variation in the genome in the CEU and CHBþJPTsamples, with more SNPs required in the YRI samples.Tagging from the genome-wide map. Whereas analysis ofthe complete ENCODE data set reveals the maximal efficiencylikely to be possible with this tag selection strategy, analysis of thePhase I map illuminates the extent to which the current resource canbe used for near-term studies. Specifically, using the same pairwisetagging approach above, 260,000 (CHBþJPT) to 474,000 (YRI)SNPs are required to capture all common SNPs in the Phase I dataset (Table 7). That is, being incomplete and thus less redundant,the Phase I data are much less compressible by tag SNP selectionthan are the ENCODE data. Nevertheless, even at this level a halfto a third of all SNPs can be selected as proxies for the remainder(and, by inference, the bulk of other common SNPs in thegenome).Increasing the efficiency of tag SNPs.Although the pairwise method
Figure 13 | Relationship in the Phase I HapMap between the threshold fordeclaring correlation between proxies and the proportion of all SNPscaptured.
Table 6 | Coverage of simulated Phase I and Phase II HapMap to captureall common SNPs in the ten ENCODE regions
Analysis panel Per centmaximum r2 $ 0.8
Meanmaximum r2
Phase I HapMapYRI 45 0.67CEU 74 0.85CHBþJPT 72 0.83
Phase II HapMapYRI 81 0.90CEU 94 0.97CHBþJPT 94 0.97
Simulated Phase I HapMaps were generated from the phased ENCODE data (release 16c1)by randomly picking SNPs that appear in dbSNP build 121 (excluding ‘non-rs’ SNPs in release16a) for every 5-kb bin until a common SNP was picked (allowing up to three attempts perbin). The Phase II HapMap was simulated by picking SNPs at random to achieve an overalldensity of 1 SNP per 1 kb. These numbers are averages over 20 independent iterations for allENCODE regions in all three analysis panels.
Figure 14 | Tag SNP information capture. The proportion of common SNPscaptured with r2 $ 0.8 as a function of the average tag SNP spacing is shownfor the phased ENCODE data, plotted (left to right) for tag SNPs prioritized
by Tagger (multimarker and pairwise) and for tag SNPs picked at random.Results were averaged over all the ENCODE regions.
ARTICLES NATURE|Vol 437|27 October 2005
1310
© 2005 Nature Publishing Group
is simple, complete and straightforward, efficiency can be improvedwith a number of simple changes. First, relaxing the threshold on r2
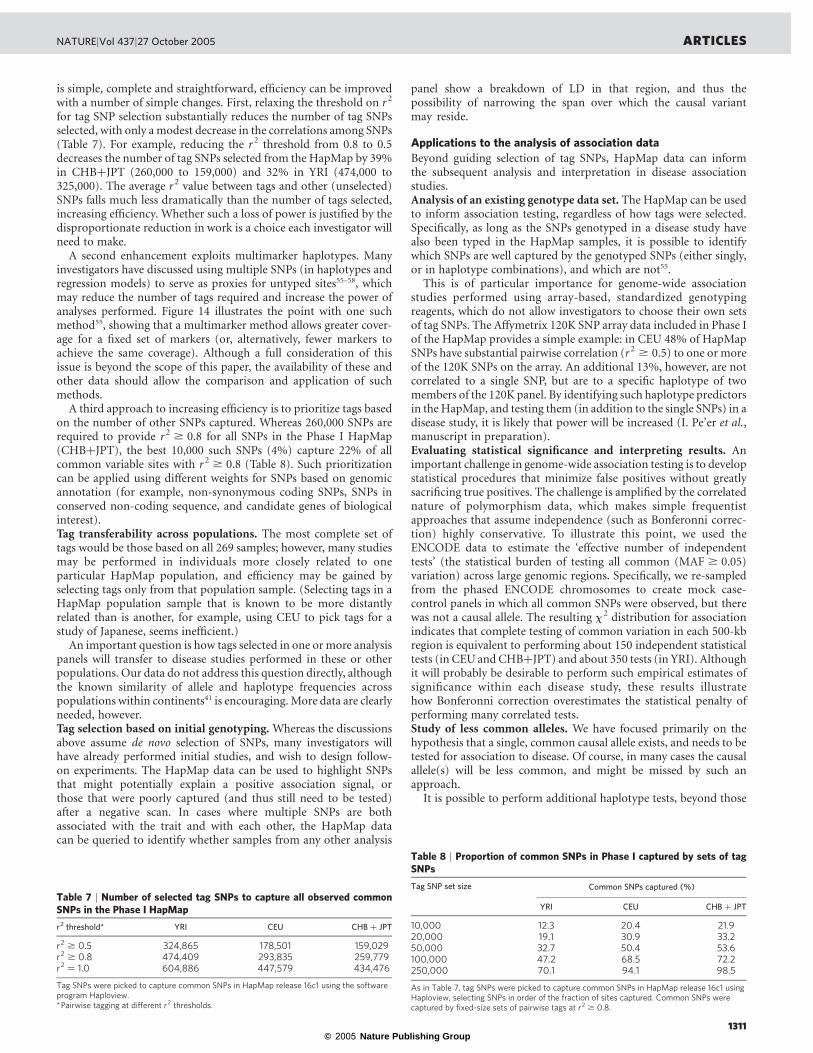
for tag SNP selection substantially reduces the number of tag SNPsselected, with only a modest decrease in the correlations among SNPs(Table 7). For example, reducing the r2 threshold from 0.8 to 0.5decreases the number of tag SNPs selected from the HapMap by 39%in CHBþJPT (260,000 to 159,000) and 32% in YRI (474,000 to325,000). The average r2 value between tags and other (unselected)SNPs falls much less dramatically than the number of tags selected,increasing efficiency. Whether such a loss of power is justified by thedisproportionate reduction in work is a choice each investigator willneed to make.
A second enhancement exploits multimarker haplotypes. Manyinvestigators have discussed using multiple SNPs (in haplotypes andregression models) to serve as proxies for untyped sites55–58, whichmay reduce the number of tags required and increase the power ofanalyses performed. Figure 14 illustrates the point with one suchmethod55, showing that a multimarker method allows greater cover-age for a fixed set of markers (or, alternatively, fewer markers toachieve the same coverage). Although a full consideration of thisissue is beyond the scope of this paper, the availability of these andother data should allow the comparison and application of suchmethods.
A third approach to increasing efficiency is to prioritize tags basedon the number of other SNPs captured. Whereas 260,000 SNPs arerequired to provide r2 $ 0.8 for all SNPs in the Phase I HapMap(CHBþJPT), the best 10,000 such SNPs (4%) capture 22% of allcommon variable sites with r2 $ 0.8 (Table 8). Such prioritizationcan be applied using different weights for SNPs based on genomicannotation (for example, non-synonymous coding SNPs, SNPs inconserved non-coding sequence, and candidate genes of biologicalinterest).Tag transferability across populations. The most complete set oftags would be those based on all 269 samples; however, many studiesmay be performed in individuals more closely related to oneparticular HapMap population, and efficiency may be gained byselecting tags only from that population sample. (Selecting tags in aHapMap population sample that is known to be more distantlyrelated than is another, for example, using CEU to pick tags for astudy of Japanese, seems inefficient.)
An important question is how tags selected in one or more analysispanels will transfer to disease studies performed in these or otherpopulations. Our data do not address this question directly, althoughthe known similarity of allele and haplotype frequencies acrosspopulations within continents41 is encouraging. More data are clearlyneeded, however.Tag selection based on initial genotyping. Whereas the discussionsabove assume de novo selection of SNPs, many investigators willhave already performed initial studies, and wish to design follow-on experiments. The HapMap data can be used to highlight SNPsthat might potentially explain a positive association signal, orthose that were poorly captured (and thus still need to be tested)after a negative scan. In cases where multiple SNPs are bothassociated with the trait and with each other, the HapMap datacan be queried to identify whether samples from any other analysis
panel show a breakdown of LD in that region, and thus thepossibility of narrowing the span over which the causal variantmay reside.
Applications to the analysis of association data
Beyond guiding selection of tag SNPs, HapMap data can informthe subsequent analysis and interpretation in disease associationstudies.Analysis of an existing genotype data set. The HapMap can be usedto inform association testing, regardless of how tags were selected.Specifically, as long as the SNPs genotyped in a disease study havealso been typed in the HapMap samples, it is possible to identifywhich SNPs are well captured by the genotyped SNPs (either singly,or in haplotype combinations), and which are not55.
This is of particular importance for genome-wide associationstudies performed using array-based, standardized genotypingreagents, which do not allow investigators to choose their own setsof tag SNPs. The Affymetrix 120K SNP array data included in Phase Iof the HapMap provides a simple example: in CEU 48% of HapMapSNPs have substantial pairwise correlation (r2 $ 0.5) to one or moreof the 120K SNPs on the array. An additional 13%, however, are notcorrelated to a single SNP, but are to a specific haplotype of twomembers of the 120K panel. By identifying such haplotype predictorsin the HapMap, and testing them (in addition to the single SNPs) in adisease study, it is likely that power will be increased (I. Pe’er et al.,manuscript in preparation).Evaluating statistical significance and interpreting results. Animportant challenge in genome-wide association testing is to developstatistical procedures that minimize false positives without greatlysacrificing true positives. The challenge is amplified by the correlatednature of polymorphism data, which makes simple frequentistapproaches that assume independence (such as Bonferonni correc-tion) highly conservative. To illustrate this point, we used theENCODE data to estimate the ‘effective number of independenttests’ (the statistical burden of testing all common (MAF $ 0.05)variation) across large genomic regions. Specifically, we re-sampledfrom the phased ENCODE chromosomes to create mock case-control panels in which all common SNPs were observed, but therewas not a causal allele. The resulting x2 distribution for associationindicates that complete testing of common variation in each 500-kbregion is equivalent to performing about 150 independent statisticaltests (in CEU and CHBþJPT) and about 350 tests (in YRI). Althoughit will probably be desirable to perform such empirical estimates ofsignificance within each disease study, these results illustratehow Bonferonni correction overestimates the statistical penalty ofperforming many correlated tests.Study of less common alleles. We have focused primarily on thehypothesis that a single, common causal allele exists, and needs to betested for association to disease. Of course, in many cases the causalallele(s) will be less common, and might be missed by such anapproach.
It is possible to perform additional haplotype tests, beyond those
Table 7 | Number of selected tag SNPs to capture all observed commonSNPs in the Phase I HapMap
r2 threshold* YRI CEU CHB þ JPT
r2 $ 0.5 324,865 178,501 159,029r2 $ 0.8 474,409 293,835 259,779r2 ¼ 1.0 604,886 447,579 434,476
Tag SNPs were picked to capture common SNPs in HapMap release 16c1 using the softwareprogram Haploview.*Pairwise tagging at different r2 thresholds.
Table 8 | Proportion of common SNPs in Phase I captured by sets of tagSNPs
Tag SNP set size Common SNPs captured (%)
YRI CEU CHB þ JPT
10,000 12.3 20.4 21.920,000 19.1 30.9 33.250,000 32.7 50.4 53.6100,000 47.2 68.5 72.2250,000 70.1 94.1 98.5
As in Table 7, tag SNPs were picked to capture common SNPs in HapMap release 16c1 usingHaploview, selecting SNPs in order of the fraction of sites captured. Common SNPs werecaptured by fixed-size sets of pairwise tags at r2 $ 0.8.
NATURE|Vol 437|27 October 2005 ARTICLES
1311
© 2005 Nature Publishing Group
that capture known polymorphisms, in the hope of capturing lesscommon or unrepresented alleles56. Such haplotype analysis has along history and proven value in mendelian genetics; the causalmutation is generally rare and unexamined during initial geno-typing, but is frequently recognized by its presence on a long, uniquehaplotype of common alleles18,19,59–62.Admixture mapping. Although not designed specifically to enableadmixture mapping63, the HapMap has helped lay the groundworkfor this approach. Admixture mapping requires a map of SNPs thatare highly differentiated in frequency across population groups. Bytyping many SNPs in samples from multiple geographical regions,the data have helped to identify such SNPs for the design of genome-wide admixture mapping panels64,65 and can be further used toidentify candidate SNPs with large allele frequency differences forfollow-up of positive admixture scan results66.Loss of heterozygosity in tumours. Loss of heterozygosity (LOH) intumour tissue can be a powerful indicator of the location of tumoursuppressor genes, and genome-wide, fine-scale LOH analysis hasbeen empowered by genome-wide SNP arrays67. Germline DNA isnot always available from the same subjects, however, and even ifavailable, typing of germline DNA doubles project costs. In lowerdensity scans for LOH (with markers far apart relative to the scale ofLD), long runs of homozygosity in tumours are nearly alwaysindicative of LOH. However, at higher densities runs of homo-zygosity can be due to haplotype homozygosity in the inheritedgermline DNA, rather than LOH.
The HapMap data can help minimize this difficulty; previousprobabilities for homozygosity based on known frequencies ofhaplotypes in the HapMap data can be used to distinguish homo-zygosity due to haplotype sharing rather than LOH68.
Identifying structural variants in HapMap data
Structural variations—segments where DNA is deleted, duplicated,or rearranged—are common69,70 and have an important role indiseases71–73. The HapMap can provide some insight into structuralvariation because, in many cases, structural variants revealthemselves through signatures in SNP genotype data. In particular,polymorphic deletions are important to discover, because loss ofgenetic material is of obvious functional relevance, and resultsin aberrant patterns of SNP genotypes. These include apparentnon-mendelian inheritance of SNP alleles, null genotypes anddeviations from Hardy–Weinberg equilibrium. However, suchSNPs are routinely discarded as technical failures of genotyping.
Thus, we scanned the unfiltered Phase I HapMap data using anapproach developed and validated to identify polymorphic del-etions from clusters of SNPs with aberrant genotype patterns(calibrated across the multiple centres and genotyping plat-forms74). In total, 541 candidate deletion polymorphisms wereidentified, of which 150 were common enough to be observed ashomozygotes.
The properties of these candidate deletions, including experimen-tal validation of 90 candidates, are described in ref. 74. Validated
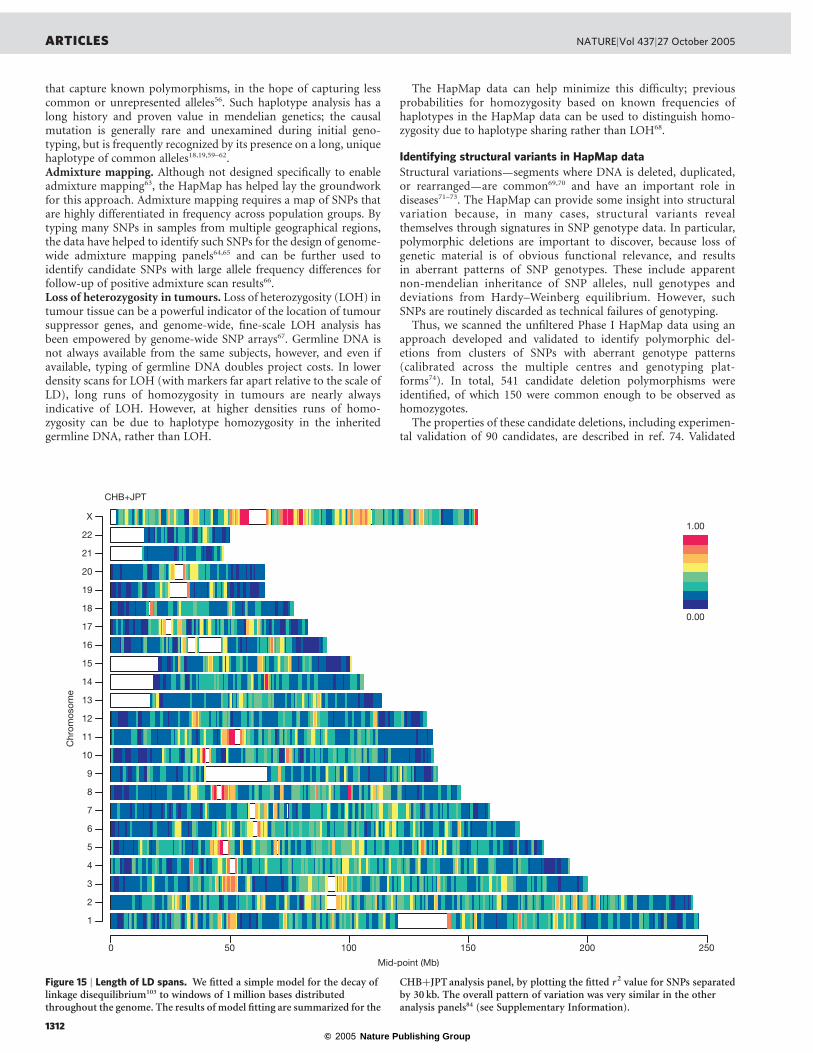
Figure 15 | Length of LD spans. We fitted a simple model for the decay oflinkage disequilibrium103 to windows of 1 million bases distributedthroughout the genome. The results of model fitting are summarized for the
CHBþJPT analysis panel, by plotting the fitted r2 value for SNPs separatedby 30 kb. The overall pattern of variation was very similar in the otheranalysis panels84 (see Supplementary Information).
ARTICLES NATURE|Vol 437|27 October 2005
1312
© 2005 Nature Publishing Group
polymorphisms include 10 that remove coding exons of genes, suchthat in many cases individuals are homozygous null for the encodedtranscript. Analysis of confirmed deletions often shows strong LDwith nearby SNPs, indicating that LD-based approaches can be usefulfor detecting disease associations due to structural (as well as SNP)variants.
Polymorphic inversions may also be reflected in the HapMapdata as long regions where multiple SNPs are perfectly correlated:because recombination between an inverted and non-inverted copyis lethal, the inverted and non-inverted copies of the region evolveindependently. A striking example corresponds to the known inver-sion polymorphism on chromosome 17, present in 20% of the CEUchromosomes, that has been associated with fertility and totalrecombination rate in females among Icelanders75. Long LD mayalso arise, however, due to a low recombination rate or certain formsof natural selection, as discussed below.
Insights into recombination and natural selection
In addition to its intended function as a resource for disease studies,the HapMap data provide clues about the biology of recombinationand history of natural selection.A genome-wide map of recombination rates at a fine scale. On thebasis of the HapMap data, we created a fine-scale genetic mapspanning the human genome (Supplementary Fig. 12), including21,617 identified recombination hotspots (one per 122 kb).
Both the number and intensity of hotspots contribute to overallvariation in recombination rate. For example, we selected 25 regionsof 5 Mb as having the highest (.2.75 cM Mb21) and lowest(,0.5 cM Mb21) rates of recombination in the deCODE (pedigree-based) genetic map48. We detected recombination hotspots in allregions, even the lowest. But in the high cM Mb21 regions hotspotsare more closely spaced (one per 84 kb) and have a higher average
intensity (0.124 cM) as compared to the low cM Mb21 regions (oneevery 208 kb, and 0.051 cM, respectively).
Estimates of recombination rates and identified hotspots arerobust to the specific markers and samples studied. Specifically, wecompared these results to a similar analysis76 of the data of ref. 77(with about 1.6 million SNPs genotyped in 71 individuals). We findnearly complete correlation in rate estimates at a coarse scale (5 Mb)between these two surveys (r2 ¼ 0.99) and to the pedigree map(r2 ¼ 0.95). Very substantial correlation is found at finer scales:r2 ¼ 0.8 at 50 kb and r2 ¼ 0.59 at 5 kb. Moreover, of the 21,617hotspots identified using the HapMap data, 78% (16,923) were alsoidentified using the data of ref. 77.
The ability to detect events depends on marker density, with thelarger number of SNPs studied by ref. 77 increasing power to detecthotspots, and presumably precision of rate estimates. There are,however, substantial genomic regions where the HapMap data have ahigher SNP density. For example, more hotspots are detected onchromosomes 9 and 19 from the HapMap data. We expect that PhaseII of HapMap will provide a genome-wide recombination map ofsubstantially greater precision than either ref. 77, or Phase I, at finescales.
Little is yet known about the molecular determinants of recombi-nation hotspots. In an analysis of the data of ref. 77, another study(ref. 76) found significant evidence for an excess of the THE1A/Bretrotransposon-like elements within recombination hotspots, andmore strikingly for a sixfold increase of a particular motif(CCTCCCT) within copies of the element in hotspots, comparedto copies of the element outside hotspots. In analysing the HapMapdata, we confirmed these findings (Supplementary Fig. 13). Further-more, THE1B elements with the motif are particularly enrichedwithin 1.5 kb of the centre of the hotspots compared to flankingsequence (P , 10216).Correlations of LD with genomic features. Variation in recombina-tion rate is important, in large part, because of its impact on LD. Wethus examined genome-wide LD for correlation to recombinationrates, sequence composition and gene features.
We confirmed previous observations that LD is generally low neartelomeres, elevated near centromeres, and correlated with chromo-some length (Fig. 15; see also Supplementary Figs 8b and 14)48,78–80.These patterns are due to recombination rate variation as discussedabove. We also confirmed previously described relationships betweenLD and GþC content78,81,82, sequence polymorphism83 and repeatcomposition78,82.
We observe, for the first time, that LD tracks with both the densityand functional classification of genes. We examined quartiles of thegenome based on extent of LD, and looked for correlations to genedensity. Surprisingly, we find that both the top and bottom quartilesof the genome have greater gene density as compared to the middlequartiles (6.7 as compared to 6.1 genes per Mb), as well as percentageof bases in codons (1.24% as compared to 1.08%). We have noexplanation for this observation.
Although the majority of gene classes are equally divided betweenthese two extreme quartiles of the genome, some classes of genesshow a marked skew in their distribution64,84,85. Genes involved inimmune responses and neurophysiological processes are more oftenlocated in regions of low LD, whereas genes involved in DNA andRNA metabolism, response to DNA damage and the cell cycle arepreferentially located in regions of strong linkage disequilibrium. It isintriguing to speculate that the extent of LD (and sequence diversity)might track with gene function due to natural selection, withincreased diversity being favoured in genes involved in interfacewith the environment such as the immune response86, and disad-vantageous for core cell biological processes such as DNA repair andpackaging87,88.Natural selection. The preceding observation highlights the hypoth-esis that signatures of natural selection are present in the HapMapdata. The availability of genome-wide variation data makes it
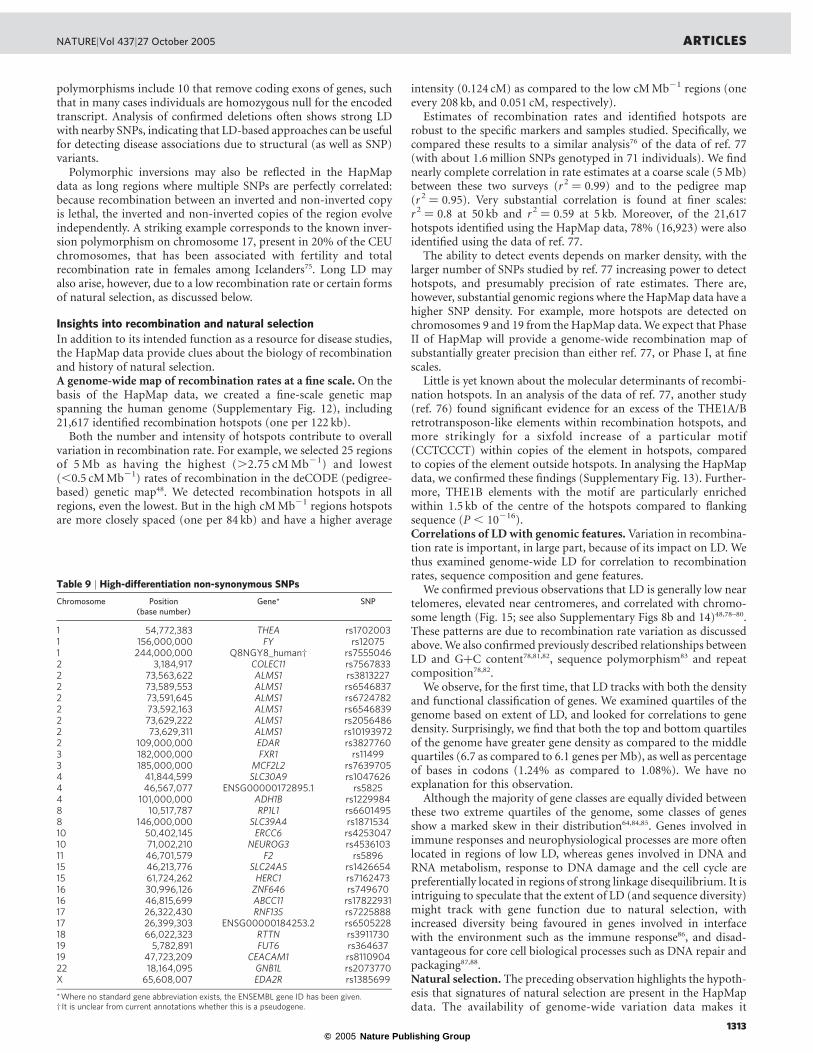
Table 9 | High-differentiation non-synonymous SNPs
Chromosome Position(base number)
Gene* SNP
1 54,772,383 THEA rs17020031 156,000,000 FY rs120751 244,000,000 Q8NGY8_human† rs75550462 3,184,917 COLEC11 rs75678332 73,563,622 ALMS1 rs38132272 73,589,553 ALMS1 rs65468372 73,591,645 ALMS1 rs67247822 73,592,163 ALMS1 rs65468392 73,629,222 ALMS1 rs20564862 73,629,311 ALMS1 rs101939722 109,000,000 EDAR rs38277603 182,000,000 FXR1 rs114993 185,000,000 MCF2L2 rs76397054 41,844,599 SLC30A9 rs10476264 46,567,077 ENSG00000172895.1 rs58254 101,000,000 ADH1B rs12299848 10,517,787 RP1L1 rs66014958 146,000,000 SLC39A4 rs187153410 50,402,145 ERCC6 rs425304710 71,002,210 NEUROG3 rs453610311 46,701,579 F2 rs589615 46,213,776 SLC24A5 rs142665415 61,724,262 HERC1 rs716247316 30,996,126 ZNF646 rs74967016 46,815,699 ABCC11 rs1782293117 26,322,430 RNF135 rs722588817 26,399,303 ENSG00000184253.2 rs650522818 66,022,323 RTTN rs391173019 5,782,891 FUT6 rs36463719 47,723,209 CEACAM1 rs811090422 18,164,095 GNB1L rs2073770X 65,608,007 EDA2R rs1385699
*Where no standard gene abbreviation exists, the ENSEMBL gene ID has been given.†It is unclear from current annotations whether this is a pseudogene.
NATURE|Vol 437|27 October 2005 ARTICLES
1313
© 2005 Nature Publishing Group
possible to scan the genome for such signatures to discover genes thatwere subject to selection during human evolution89; the HapMapdata also provide a genome-wide empirical distribution againstwhich previous claims of selection can be evaluated (rather thanrelying solely on theoretical computer simulations).
Natural selection influences patterns of genetic variation in var-ious ways, such as through the removal of deleterious mutations, thefixation of advantageous variants, and the maintenance of multiplealleles through balancing selection. Each form of selection may haveoccurred uniformly across the world (and thus be represented in allhuman populations) or have been geographically localized (and thusdiffer among populations).
Nearly all methods for recognizing natural selection rely on thecollection of complete sequence data. The HapMap Project’s focus oncommon variation—and the process of SNP selection that achieved apreponderance of high-frequency alleles (Fig. 5)—thus prevents theirstraightforward application. Adjusting for the effect of SNP choice is
complex, moreover, because SNP choice varied over time as dbSNPevolved, and was implemented locally at each centre.
For these reasons, we focus here on two types of analysis. First, weexamined the distributions of signatures of selection across thegenome. Although the absolute value of these measures is difficultto interpret (owing to SNP ascertainment), the most extreme cases ina genome-wide distribution are important candidates to evaluate forselection. Second, we compared across functional categories, becauseSNP choice was largely agnostic to such features, and thus systematicdifferences may be a sign of selection.
The outcomes of these analyses confirm a number of previoushypotheses about selection and identify new loci as candidates forselection.Evidence for selective sweeps in particular genomic regions. Firstwe consider population differentiation, generally accepted as a clueto past selection in one of the populations. The HapMap data reveal926 SNPs with allele frequencies that differ across the analysis panels
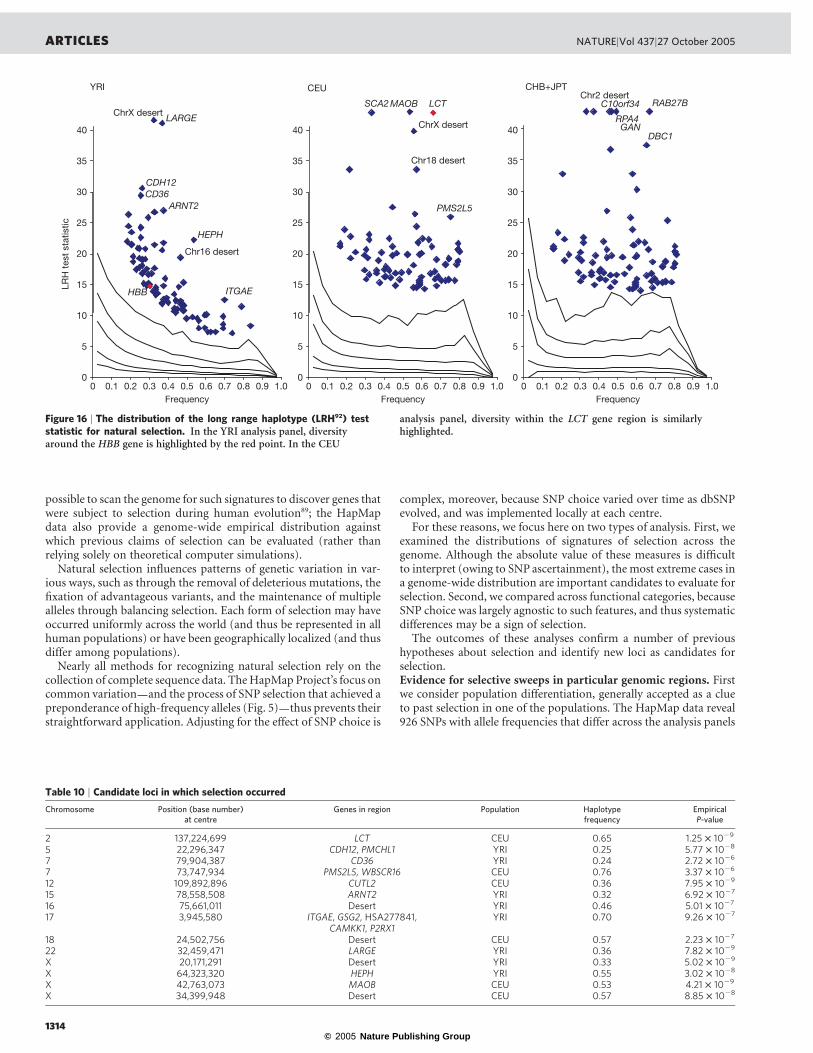
Figure 16 | The distribution of the long range haplotype (LRH92) teststatistic for natural selection. In the YRI analysis panel, diversityaround the HBB gene is highlighted by the red point. In the CEU
analysis panel, diversity within the LCT gene region is similarlyhighlighted.
Table 10 | Candidate loci in which selection occurred
Chromosome Position (base number)at centre
Genes in region Population Haplotypefrequency
EmpiricalP-value
2 137,224,699 LCT CEU 0.65 1.25 £ 1029
5 22,296,347 CDH12, PMCHL1 YRI 0.25 5.77 £ 1028
7 79,904,387 CD36 YRI 0.24 2.72 £ 1026
7 73,747,934 PMS2L5, WBSCR16 CEU 0.76 3.37 £ 1026
12 109,892,896 CUTL2 CEU 0.36 7.95 £ 1029
15 78,558,508 ARNT2 YRI 0.32 6.92 £ 1027
16 75,661,011 Desert YRI 0.46 5.01 £ 1027
17 3,945,580 ITGAE, GSG2, HSA277841,CAMKK1, P2RX1
YRI 0.70 9.26 £ 1027
18 24,502,756 Desert CEU 0.57 2.23 £ 1027
22 32,459,471 LARGE YRI 0.36 7.82 £ 1029
X 20,171,291 Desert YRI 0.33 5.02 £ 1029
X 64,323,320 HEPH YRI 0.55 3.02 £ 1028
X 42,763,073 MAOB CEU 0.53 4.21 £ 1029
X 34,399,948 Desert CEU 0.57 8.85 £ 1028
ARTICLES NATURE|Vol 437|27 October 2005
1314
© 2005 Nature Publishing Group
in a manner as extreme as the well-accepted example of selection atthe Duffy (FY) locus (Supplementary Fig. 8c). Of these 926 SNPs, 32are non-synonymous coding SNPs and many others occur in tran-scribed regions, making them strong candidates for functionalpolymorphisms that have experienced geographically restrictedselection pressures (see Table 9 and Supplementary Informationfor details). In particular, the ALMS1 gene on chromosome 2 hassix amino acid polymorphisms that show very strong populationdifferentiation.
Another signature of an allele having risen to fixation throughselection is that all other diversity in the region is eliminated (knownas a selective sweep). We identified extreme outliers in the jointdistribution of heterozygosity (as assessed from shotgun sequencingSNP discovery projects) and either population differentiation orskewing of allele frequency towards rare alleles in each analysispanel (Supplementary Fig. 15). We identified 19 such genomicregions (13 on autosomes, 6 on the X chromosome) as candidatesfor future study (Supplementary Table 4); these include candidatesfor population-specific sweeps and sweeps in the ancestralpopulation. Encouragingly, this analysis includes among its top-scoring results the LCT gene, which influences the ability to digestdairy products90 and has been shown to be subject to past naturalselection91.Long haplotypes as candidates for natural selection. Selectivesweeps that fail to fix in the population, as well as balancing selection,lead to haplotypes that are relatively high in frequency and long induration. In the HLA region (which is widely believed to have beeninfluenced by balancing selection) multiple haplotypes of 500 SNPsthat extend more than 1 cM in length are observed with a frequencyin the HapMap samples of more than 1%. We identified other suchoccurrences of long haplotypes across the genome (SupplementaryFig. 8 and Supplementary Tables 5 and 6).
An approach to long haplotypes designed specifically to identifyregions having undergone partial selective sweeps is the long rangehaplotype (LRH) test91,92, which compares the length of each haplo-type to that of others at the locus, matched across the genome basedon frequency. Previously identified outliers to the genome-widedistribution for the LRH test (Fig. 16) that have been identified ascandidates for selection include the LCT gene in the CEU sample(empirical P-value ¼ 1.3 £ 1029), which was an outlier for theheterozygosity/allele frequency test above, and the HBB gene(empirical P-value ¼ 1.39 £ 1025) in the YRI sample. However,most of the strongest signals in the LRH test (Table 10) were notpreviously hypothesized as undergoing selection.
These four tests overlap only partially in the hypotheses theyaddress—heterozygosity, for example, is sensitive to older sweeps,whereas the haplotype tests are most powerful for partial sweeps—but encouragingly some candidate regions are found by more thanone test. In particular, six regions are identified both by longhaplotypes and by low heterozygosity, and three regions (LCT onchromosome 2, and two regions on the X chromosome at 20 and65 Mb) are identified by three different tests.Confirming purifying selection at conserved non-codingelements. Finally, we used the HapMap data to test an importanthypothesis from comparative genomics. Genomic sequencing hasshown that about 5% of the human sequence is highly conservedacross species, yet less than half of this sequence spans knownfunctional elements such as exons45. It is widely assumed thatconserved non-genic sequences lack diversity because of selectiveconstraint (that is, purifying selection), but such regions may simplybe coldspots for mutation, and thus be of little value as candidates forfunctional study.
Analysis of allele frequencies helps to resolve this uncertainty.Functional constraint, but not a low mutation rate, results in adownward skew in allele frequencies for conserved sequences ascompared to neutral sequences93,94. We find that conserved non-genic sequences display a greater skew towards rare alleles than do
intergenic regions, as predicted under purifying selection. This skewis less extreme than that observed for exons (Supplementary Fig. 16),reflecting either stronger purifying selection or the prioritization ofcoding SNPs for genotyping by the HapMap centres regardless ofvalidation status. This novel evidence for ongoing constraint showsthat conserved non-genic sequences are not mutational coldspots,and thus remain of high interest for functional study.
ConclusionsThe International HapMap Project set out to create a resource thatwould accelerate the identification of genetic factors that influencemedical traits. Analyses reported here confirm the generalityof hotspots of recombination, long segments of strong LD,and limited haplotype diversity. Most important is the extensiveredundancy among nearby SNPs, providing (1) the potential toextract extensive information about genomic variation withoutcomplete resequencing, and (2) efficiencies through selection oftag SNPs and optimized association analyses. Beyond the bio-medical context, these data have made it possible to identify deletionvariants in the genome, explore the nature of fine-scale recombina-tion and identify regions that may have been subject to naturalselection.
The HapMap Project (along with a previous genome-wide assess-ment of LD77) is a natural extension of the Human Genome Project.Where the reference sequence constructed by the Human GenomeProject is informative about the vast majority of bases that areinvariant across individuals, the HapMap focuses on DNA sequencedifferences among individuals. Our understanding of SNP variationand LD around common variants in the sampled populations isreasonably complete; the current picture is unlikely to change withadditional data. In other aspects—such as the fine details of localcorrelation among SNPs, rarer alleles, structural variants, and inter-population differences—these resources are only a first step on thepath towards a complete characterization of genetic variation of thehuman population. Planned extensions of the Phase I map includePhase II of HapMap, with genotyping of another 4.6 million SNPsattempted in the HapMap samples, and detailed genotyping of theHapMap ENCODE regions in additional members of each HapMappopulation sampled, as well as in samples from additional popu-lations. These results should guide understanding of the robustnessand transferability of LD inferences and tag SNPs selected from thecurrent set of HapMap samples.
An important application of the HapMap data is to help makepossible comprehensive, genome-wide association studies. There arenow laboratory tools that make it practical to undertake such studies,and initial results are encouraging13. Given the low prior probabilityof causality for each SNP in the genome, however, rigorous standardsof statistical significance will be needed to avoid a flood offalse-positive results. Multiple replications in large samples providethe most straightforward path to identifying robust and broadlyrelevant associations. Given the potential for confusion if associ-ations of uncertain validity are widely reported (and a persistenttendency towards genetic determinism in public discourse), we urgeconservatism and restraint in the public dissemination and interpret-ation of such studies, especially if non-medical phenotypes areexplored. It is time to create mechanisms by which all results ofassociation studies, positive and negative, are reported and discussedwithout bias.
The success of the HapMap will be measured in terms of thegenetic discoveries enabled, and improved knowledge of diseaseaetiology. Specifically, identifying which genes and pathways arecausal in humans has the potential to provide a new and solidfoundation for biomedical research. This is equally true whether thevariants that lead to the discovery of those genes are themselves rareor common, or of large or small effect. The impact on diagnostics andtargeted prevention, however, will depend on how predictive eachgiven allele may be. Where genetic mechanisms underlie treatment
NATURE|Vol 437|27 October 2005 ARTICLES
1315

© 2005 Nature Publishing Group
responses, both more efficient trials and individualized preventiveand treatment strategies may become practical95.
Success identifying alleles conferring susceptibility or resistance tocommon diseases will also provide a deeper understanding of thearchitecture of disease: how many genes are involved in each case,whether and how alleles interact with one another96 and withenvironmental exposures to shape clinical phenotypes. In this regard,it will be important to invest heavily in the discovery and character-ization of relevant lifestyle factors, environmental exposures, detailedcharacterization of clinical phenotypes, and the ability to obtain suchinformation in longitudinal studies of adequate size. Where environ-mental and behavioural factors vary across studies, replication will behard to come by (as will clinical utility) unless we can learn to capturethese variables with the same precision and completeness as geno-typic variation. Technological innovation and international collab-oration in these realms will probably be required (as they have beenin the Human Genome Project and the HapMap) to advance theshared goal of understanding, and ultimately preventing, commonhuman diseases.
METHODSThe project was undertaken by investigators from Japan, the United Kingdom,Canada, China, Nigeria and the United States, and from multiple disciplines:sample collection, sequencing and genotyping, bioinformatics, populationgenetics, statistics, and the ethical, legal, and social implications of geneticresearch. The Supplementary Information contains information about projectparticipants and organization.Choice of DNA samples. Any choice of DNA samples represents a compromise:a single population offers simplicity, but cannot be representative, whereas grid-sampling is representative of the current worldwide population, but is neitherpractical nor captures historical genetic diversity. The project chose to includeDNA samples based on well-known patterns of allele frequencies acrosspopulations41, reflecting historical genetic diversity31,32.
For practical reasons, the project focused on SNPs present at a minor allelefrequency (MAF) $ 0.05 in each analysis panel, and thus studied a sufficientnumber of individuals to provide good power for this frequency range31.Cell lines and DNA are available at the Coriell Institute for Medical Research(http://locus.umdnj.edu/nigms/products/hapmap.html).
Community engagement was employed to explain the project, and to learn howthe project was viewed, in the communities where samples were collected31,32.Papers describing the community engagement processes are being prepared.
One JPT sample was replaced for technical reasons, but not in time forinclusion in this report. We surveyed cryptic relatedness among the studyparticipants, and identified a small number of pairs with unexpectedly high allelesharing (Supplementary Information). As the total level of sharing is not great, andas a subset of analyses performed without these individuals were unchanged, weinclude these individuals in the data and analyses presented here.Genome-wide SNP discovery.The project required a dense map of SNPs, ideallycontaining information about validation and frequency of each candidate SNP.When the project started, the public SNP database (dbSNP) contained2.6 million candidate SNPs, few of which were annotated with the requiredinformation.
To generate more SNPs and obtain validation information, shotgun sequen-cing of DNA from whole-genome libraries and flow-sorted chromosomes wasperformed31, augmented by analysis of sequence traces produced by AppliedBiosystems97,98, and information on 1.6 million SNPs genotyped by PerlegenSciences77, including 425,000 not in dbSNP when released (SupplementaryTable 7). The HapMap Project contributed about 6 million new SNPs to dbSNP.
At the time of writing (October 2005) dbSNP (http://www.ncbi.nlm.nih.gov/projects/SNP/) contains 9.2 million candidate human SNPs, of which 3.6 millionhave been validated by both alleles having been seen two or more times duringdiscovery (‘double-hit’ SNPs), and 2.4 million have genotype data (Fig. 1).Comprehensive study of common variation across 5Mb of DNA. To studypatterns of genetic variation as comprehensively as possible, we selected ten 500-kb regions from the ENCODE Project33. These ten regions were chosen inaggregate to approximate the genome-wide average for GþC content, recombi-nation rate, percentage of sequence conserved relative to mouse sequence, andgene density (Table 2).
In each such region additional sequencing and genotyping were performed toobtain a much more complete inventory of common variation. Specifically,bidirectional PCR-based sequencing was performed across each 500-kb region in
48 individuals (16 YRI, 16 CEU, 8 CHB, 8 JPT). Although the intent was for thesesame DNA samples to be included in Phase I, eight Yoruba and one Han Chinesesample used in sequencing were not among the 269 samples genotyped. (Thenine samples are available from Coriell.)
All variants found by sequencing, and any others in dbSNP (build 121) notfound by sequencing, were genotyped in all 269 HapMap samples. If the firstattempt at genotyping was unsuccessful, a second platform was tried for each SNP.False-positive and false-negative rates in PCR-based SNP discovery. Thefalse-positive rate of SNP discovery by PCR-based resequencing was estimatedat 7–11% (for the two sequencing centres), based on genotyping of eachcandidate SNP in the same samples used for discovery.
The false-negative rate of SNP discovery by PCR resequencing was estimatedat 6%, using as the denominator a set of SNPs previously in dbSNP andconfirmed by genotyping in the specific individuals sequenced. The false-negative rate was considerably higher, however, for singletons (SNPs seen onlyas a single heterozygote): 15% of singletons covered by high-quality sequencedata were not detected by the trace analysis, and another 25% were missed due toa failure to obtain a high-quality sequence over the relevant base in the oneheterozygous individual (D. J. Richter et al., personal communication).False-positive and false-negative rates in dbSNP. The false positive rate(candidate SNPs that cannot be confirmed as variable sites) estimated fordbSNP was 17%. This represents an upper bound, because dbSNP entries thatare monomorphic in the 269 HapMap samples could be rare variants, orpolymorphic in other samples. We note that as the catalogue of dbSNP getsdeeper, the rate at which candidate SNPs are monomorphic in any given sampleis observed to rise (Supplementary Table 8). This is expected because the numberof rare SNPs and false positives scales with depth of sequencing, whereas thenumber of true common variants will plateau.SNP genotyping for the genome-wide map. Genotyping assays were designedfrom dbSNP, with priority given to SNPs validated by previous genotyping dataor both alleles having been seen more than once in discovery. Data from theChimpanzee Genome Sequencing Project99 were used in SNP validation if theyconfirmed the ancestral status of a human allele seen only once in discovery(Supplementary Information). Non-synonymous coding SNPs were also prior-itized for genotyping. Two whole-genome, array-based genotyping reagents wereused efficiently to increase SNP density: 40,000 SNPs from Illumina, and 120,000SNPs from Affymetrix100.
To monitor progress, the genome was partitioned into 5-kb bins, withgenotyping continuing through iterative rounds until a set of predetermined‘stopping rules’ was satisfied in each analysis panel. (1) Minor allele frequency: ineach analysis panel a common SNP (MAF $ 0.05) was obtained in each 5-kbbin. (2) Spacing: the distance between adjacent SNPs was 2–8 kb, with at least9 SNPs across 50 kb. (3) ‘HapMappable’ genome: with available technologies it ischallenging to study centromeres, telomeres, gaps in genome sequence, andsegmental duplications. The project identified such regions101 (SupplementaryTable 9), spanning 4.4% of the finished human genome sequence, in which only asingle attempt to develop a genotyping assay was required. (4) Three strikes,you’re out: if the above rules were not satisfied after three attempts to develop anassay in a given 5-kb region, or if all available SNPs in dbSNP had been tried,genotyping was considered complete for Phase I. Two attempts were consideredsufficient if one attempt was of a SNP previously shown to have MAF $ 0.05 inthe appropriate population sample in a previous genome-wide survey77. (5)Quality control: ongoing and standardized quality control (QC) filters and threerounds of quality assessment (QA) were used to ensure and document the highquality of the genotype data.
QC filters were systematically performed, with each SNP tested for complete-ness (.80%), consistency across five duplicate genotypes (#1 discrepancy),mendelian inheritance in 60 trios (#1 discrepancy in each of YRI and CEU), andHardy–Weinberg equilibrium (P . 0.001102). SNPs in the Phase I data set passedall the QC filters in all the analysis panels and were polymorphic in the HapMapsamples. Failing SNPs were released (with a special flag), as they can help toidentify polymorphisms under primers, insertions/deletions, paralogous lociand natural selection.
Three QA exercises were carried out. First, a calibration exercise to ‘bench-mark’ each platform and laboratory protocol. Second, a mid-project evaluationof each genotyping centre. Third, a blind analysis of a random sample of thecomplete Phase I data set. A number of SNPs were genotyped more than onceduring the project, or by other investigators, providing additional informationabout data quality. See the Supplementary Information for full informationabout the QA exercises.
An exhaustive approach was taken to mtDNA. Alignment of more than 1,000publicly available mtDNA sequences of African (n ¼ 87), European (n ¼ 928)and Asian (n ¼ 238) geographical origin34 was used to identify 210 common
ARTICLES NATURE|Vol 437|27 October 2005
1316
© 2005 Nature Publishing Group
variants (MAF $ 0.05 in at least one continental region) that were attempted inthe samples.Data release. Data deposited at the Data Coordination Center and released athttp://www.hapmap.org, a Japanese mirror site http://hapmap.jst.go.jp/ anddbSNP include ascertainment status of each SNP at the time of selection,primer sequences, protocols for genotyping, genotypes for each sample, allelefrequencies, and, for SNPs that failed QC filters, a code indicating the mode(s) offailure.
Initially, because of concern that third parties might seek patents on HapMapdata, users were required to agree to a web-based ‘click-wrap license’, assentingthat they would not prevent others from using the data (http://www.hapma-p.org/cgi-perl/registration). In December 2004 this license was dropped, and alldata were released without restriction into the public domain.
Received 11 August; accepted 12 September 2005.
1. Lechler, R. & Warrens, A. HLA in Health and Disease 2nd edn (Academic Press,San Diego, California, 2005).
2. Strittmatter, W. J. & Roses, A. D. Apolipoprotein E and Alzheimer’s disease.Annu. Rev. Neurosci. 19, 53–-77 (1996).
3. Dahlback, B. Resistance to activated protein C caused by the factor V R506Qmutation is a common risk factor for venous thrombosis. Thromb. Haemost. 78,483–-488 (1997).
4. Altshuler, D. et al. The common PPARg Pro12Ala polymorphism is associatedwith decreased risk of type 2 diabetes. Nature Genet. 26, 76–-80 (2000).
5. Deeb, S. S. et al. A Pro12Ala substitution in PPARg2 associated with decreasedreceptor activity, lower body mass index and improved insulin sensitivity.Nature Genet. 20, 284–-287 (1998).
6. Florez, J. C., Hirschhorn, J. & Altshuler, D. The inherited basis of diabetesmellitus: implications for the genetic analysis of complex traits. Annu. Rev.Genomics Hum. Genet. 4, 257–-291 (2003).
7. Begovich, A. B. et al. A missense single-nucleotide polymorphism in a geneencoding a protein tyrosine phosphatase (PTPN22) is associated withrheumatoid arthritis. Am. J. Hum. Genet. 75, 330–-337 (2004).
8. Bottini, N. et al. A functional variant of lymphoid tyrosine phosphatase isassociated with type I diabetes. Nature Genet. 36, 337–-338 (2004).
9. Bell, G. I., Horita, S. & Karam, J. H. A polymorphic locus near the human insulingene is associated with insulin-dependent diabetes mellitus. Diabetes 33,176–-183 (1984).
10. Ueda, H. et al. Assocation of the T-cell regulatory gene CTLA4 withsusceptibility to autoimmune disease. Nature 423, 506–-511 (2003).
11. Ogura, Y. et al. A frameshift mutation in NOD2 associated with susceptibility toCrohn’s disease. Nature 411, 603–-606 (2001).
12. Hugot, J. P. et al. Association of NOD2 leucine-rich repeat variants withsusceptibility to Crohn’s disease. Nature 411, 599–-603 (2001).
13. Klein, R. J. et al. Complement factor H polymorphism in age-related maculardegeneration. Science 308, 385–-389 (2005).
14. Haines, J. L. et al. Complement factor H variant increases the risk of age-related macular degeneration. Science 308, 419–-421 (2005).
15. Edwards, A. O. et al. Complement factor H polymorphism and age-relatedmacular degeneration. Science 308, 421–-424 (2005).
16. Puffenberger, E. G. et al. A missense mutation of the endothelin-B receptorgene in multigenic Hirschsprung’s disease. Cell 79, 1257–-1266 (1994).
17. Emison, E. S. et al. A common sex-dependent mutation in a RET enhancerunderlies Hirschsprung disease risk. Nature 434, 857–-863 (2005).
18. Kerem, B. et al. Identification of the cystic fibrosis gene: genetic analysis.Science 245, 1073–-1080 (1989).
19. Hastbacka, J. et al. Linkage disequilibrium mapping in isolated founderpopulations: diastrophic dysplasia in Finland. Nature Genet. 2, 204–-211 (1992).
20. Pritchard, J. K. & Przeworski, M. Linkage disequilibrium in humans: models anddata. Am. J. Hum. Genet. 69, 1–-14 (2001).
21. Jorde, L. B. Linkage disequilibrium and the search for complex disease genes.Genome Res. 10, 1435–-1444 (2000).
22. Reich, D. E. et al. Linkage disequilibrium in the human genome. Nature 411,199–-204 (2001).
23. Kruglyak, L. Prospects for whole-genome linkage disequilibrium mapping ofcommon disease genes. Nature Genet. 22, 139–-144 (1999).
24. Johnson, G. C. et al. Haplotype tagging for the identification of commondisease genes. Nature Genet. 29, 233–-237 (2001).
25. Nickerson, D. A. et al. DNA sequence diversity in a 9.7-kb region of the humanlipoprotein lipase gene. Nature Genet. 19, 233–-240 (1998).
26. Zhu, X. et al. Localization of a small genomic region associated with elevatedACE. Am. J. Hum. Genet. 67, 1144–-1153 (2000).
27. Daly, M. J., Rioux, J. D., Schaffner, S. F., Hudson, T. J. & Lander, E. S. High-resolution haplotype structure in the human genome. Nature Genet. 29,229–-232 (2001).
28. Jeffreys, A. J., Kauppi, L. & Neumann, R. Intensely punctate meioticrecombination in the class II region of the major histocompatibility complex.Nature Genet. 29, 217–-222 (2001).
29. Patil, N. et al. Blocks of limited haplotype diversity revealed by high-resolutionscanning of human chromosome 21. Science 294, 1719–-1723 (2001).
30. Gabriel, S. B. et al. The structure of haplotype blocks in the human genome.Science 296, 2225–-2229 (2002).
31. The International HapMap Consortium. The International HapMap Project.Nature 426, 789–-796 (2003).
32. The International HapMap Consortium. Integrating ethics and science in theInternational HapMap Project. Nature Rev. Genet. 5, 467–-475 (2004).
33. The ENCODE Project Consortium. The ENCODE (ENCyclopedia Of DNAElements) Project. Science 306, 636–-640 (2004).
34. Herrnstadt, C. et al. Reduced-median-network analysis of completemitochondrial DNA coding-region sequences for the major African, Asian, andEuropean haplogroups. Am. J. Hum. Genet. 70, 1152–-1171 (2002).
35. Jobling, M. A. & Tyler-Smith, C. The human Y chromosome: an evolutionarymarker comes of age. Nature Rev. Genet. 4, 598–-612 (2003).
36. The Y Chromosome Consortium. A nomenclature system for the tree ofhuman Y-chromosomal binary haplogroups. Genome Res. 12, 339–-348(2002).
37. Underhill, P. A. et al. The phylogeography of Y chromosome binary haplotypesand the origins of modern human populations. Ann. Hum. Genet. 65, 43–-62(2001).
38. Marchini, J. et al. A comparison of phasing algorithms for trios and unrelatedindividuals. Am. J. Hum. Genet. (in the press).
39. Stephens, M. & Donnelly, P. A comparison of Bayesian methods for haplotypereconstruction from population genotype data. Am. J. Hum. Genet. 73,1162–-1169 (2003).
40. Wright, S. Evolution and the Genetics of Populations Volume 2: the Theory of GeneFrequencies 294–-295 (Univ. of Chicago Press, Chicago, 1969).
41. Rosenberg, N. A. et al. Genetic structure of human populations. Science 298,2381–-2385 (2002).
42. Li, N. & Stephens, M. Modeling linkage disequilibrium and identifyingrecombination hotspots using single-nucleotide polymorphism data. Genetics165, 2213–-2233 (2003).
43. Pe’er, I. et al. Reconciling estimates of linkage disequilibrium in the humangenome. Genome Res. (submitted).
44. Lichten, M. & Goldman, A. S. Meiotic recombination hotspots. Annu. Rev.Genet. 29, 423–-444 (1995).
45. Mouse Genome Sequencing Consortium. Initial sequencing and comparativeanalysis of the mouse genome. Nature 420, 520–-562 (2002).
46. McVean, G. A. et al. The fine-scale structure of recombination rate variation inthe human genome. Science 304, 581–-584 (2004).
47. Crawford, D. C. et al. Evidence for substantial fine-scale variation inrecombination rates across the human genome. Nature Genet. 36, 700–-706(2004).
48. Kong, A. et al. A high-resolution recombination map of the human genome.Nature Genet. 31, 241–-247 (2002).
49. Winckler, W. et al. Comparison of fine-scale recombination rates in humansand chimpanzees. Science 308, 107–-111 (2005).
50. Myers, S. R. & Griffiths, R. C. Bounds on the minimum number ofrecombination events in a sample history. Genetics 163, 375–-394 (2003).
51. Hudson, R. R. & Kaplan, N. L. Statistical properties of the number ofrecombination events in the history of a sample of DNA sequences. Genetics111, 147–-164 (1985).
52. Phillips, M. S. et al. Chromosome-wide distribution of haplotype blocks and therole of recombination hot spots. Nature Genet. 33, 382–-387 (2003).
53. Chapman, J. M., Cooper, J. D., Todd, J. A. & Clayton, D. G. Detecting diseaseassociations due to linkage disequilibrium using haplotype tags: a class oftests and the determinants of statistical power. Hum. Hered. 56, 18–-31(2003).
54. Carlson, C. S. et al. Selecting a maximally informative set of single-nucleotidepolymorphisms for association analyses using linkage disequilibrium. Am.J. Hum. Genet. 74, 106–-120 (2004).
55. de Bakker, P. I. W. et al. Efficiency and power in genetic association studies.Nature Genet. Advance online publication, 23 October 2005 (doi:10.1038/ng1669).
56. Lin, S., Chakravarti, A. & Cutler, D. J. Exhaustive allelic transmissiondisequilibrium tests as a new approach to genome-wide association studies.Nature Genet. 36, 1181–-1188 (2004).
57. Weale, M. E. et al. Selection and evaluation of tagging SNPs in the neuronal-sodium-channel gene SCN1A: implications for linkage-disequilibrium genemapping. Am. J. Hum. Genet. 73, 551–-565 (2003).
58. Stram, D. O. et al. Choosing haplotype-tagging SNPs based on unphasedgenotype data using a preliminary sample of unrelated subjects with anexample from the Multiethnic Cohort Study. Hum. Hered. 55, 27–-36 (2003).
59. de la Chapelle, A. & Wright, F. A. Linkage disequilibrium mapping in isolatedpopulations: the example of Finland revisited. Proc. Natl Acad. Sci. USA 95,12416–-12423 (1998).
60. Mootha, V. K. et al. Identification of a gene causing human cytochrome coxidase deficiency by integrative genomics. Proc. Natl Acad. Sci. USA 100,605–-610 (2003).
61. Engert, J. C. et al. ARSACS, a spastic ataxia common in northeastern Quebec,is caused by mutations in a new gene encoding an 11.5-kb ORF. Nature Genet.24, 120–-125 (2000).
62. Richter, A. et al. Location score and haplotype analyses of the locus for
NATURE|Vol 437|27 October 2005 ARTICLES
1317
© 2005 Nature Publishing Group
autosomal recessive spastic ataxia of Charlevoix-Saguenay, in chromosomeregion 13q11. Am. J. Hum. Genet. 64, 768–-775 (1999).
63. Chakraborty, R. & Weiss, K. M. Admixture as a tool for finding linked genesand detecting that difference from allelic association between loci. Proc. NatlAcad. Sci. USA 85, 9119–-9123 (1988).
64. Smith, M. W. & O’Brien, S. J. Mapping by admixture linkage disequilibrium:advances, limitations and guidelines. Nature Rev. Genet. 6, 623–-632 (2005).
65. Smith, M. W. et al. A high-density admixture map for disease gene discovery inAfrican Americans. Am. J. Hum. Genet. 74, 1001–-1013 (2004).
66. Zhu, X. et al. Admixture mapping for hypertension loci with genome-scanmarkers. Nature Genet. 37, 177–-181 (2005).
67. Zhao, X. et al. An integrated view of copy number and allelic alterations in thecancer genome using single nucleotide polymorphism arrays. Cancer Res. 64,3060–-3071 (2004).
68. Huang, J. et al. Whole genome DNA copy number changes identified by highdensity oligonucleotide arrays. Hum. Genomics 1, 287–-299 (2004).
69. Iafrate, A. J. et al. Detection of large-scale variation in the human genome.Nature Genet. 36, 949–-951 (2004).
70. Sebat, J. et al. Large-scale copy number polymorphism in the human genome.Science 305, 525–-528 (2004).
71. Stankiewicz, P. & Lupski, J. R. Genome architecture, rearrangements andgenomic disorders. Trends Genet. 18, 74–-82 (2002).
72. Gonzalez, E. et al. The influence of CCL3L1 gene-containing segmentalduplications on HIV-1/AIDS susceptibility. Science 307, 1434–-1440 (2005).
73. Singleton, A. B. et al. a-Synuclein locus triplication causes Parkinson’s disease.Science 302, 841 (2003).
74. McCarroll, S. et al. Common deletion variants in the human genome. NatureGenet. (in the press).
75. Stefansson, H. et al. A common inversion under selection in Europeans. NatureGenet. 37, 129–-137 (2005).
76. Myers, S., Bottolo, L., Freeman, C., McVean, G. & Donnelly, P. A fine-scale mapof recombination rates and recombination hotspots in the human genome.Science 310, 321–-324 (2005).
77. Hinds, D. A. et al. Whole-genome patterns of common DNA variation in threehuman populations. Science 307, 1072–-1079 (2005).
78. Yu, A. et al. Comparison of human genetic and sequence-based physical maps.Nature 409, 951–-953 (2001).
79. Broman, K. W., Murray, J. C., Sheffield, V. C., White, R. L. & Weber, J. L.Comprehensive human genetic maps: individual and sex-specific variation inrecombination. Am. J. Hum. Genet. 63, 861–-869 (1998).
80. Weissenbach, J. et al. A second-generation linkage map of the human genome.Nature 359, 794–-801 (1992).
81. Fullerton, S. M., Bernardo Carvalho, A. & Clark, A. G. Local rates ofrecombination are positively correlated with GC content in the human genome.Mol. Biol. Evol. 18, 1139–-1142 (2001).
82. Dawson, E. et al. A first-generation linkage disequilibrium map of humanchromosome 22. Nature 418, 544–-548 (2002).
83. Begun, D. J. & Aquadro, C. F. Levels of naturally occurring DNA polymorphismcorrelate with recombination rates in D. melanogaster. Nature 356, 519–-520(1992).
84. Smith, A. V., Thomas, D. J., Munro, H. M. & Abecasis, G. R. Sequence featuresin regions of weak and strong linkage disequilibrium. Genome Res. 15,1519–-1534 (2005).
85. The Gene Ontology Consortium. Gene ontology: tool for the unification ofbiology. Nature Genet. 25, 25–-29 (2000).
86. Trachtenberg, E. et al. Advantage of rare HLA supertype in HIV diseaseprogression. Nature Med. 9, 928–-935 (2003).
87. Pehrson, J. R. & Fuji, R. N. Evolutionary conservation of histone macroH2Asubtypes and domains. Nucleic Acids Res. 26, 2837–-2842 (1998).
88. Modrich, P. & Lahue, R. Mismatch repair in replication fidelity, geneticrecombination, and cancer biology. Annu. Rev. Biochem. 65, 101–-133 (1996).
89. Nielsen, R. Human genomics: disclosure of variation. Nature 434, 288–-289(2005).
90. Enattah, N. S. et al. Identification of a variant associated with adult-typehypolactasia. Nature Genet. 30, 233–-237 (2002).
91. Bersaglieri, T. et al. Genetic signatures of strong recent positive selection at thelactase gene. Am. J. Hum. Genet. 74, 1111–-1120 (2004).
92. Sabeti, P. C. et al. Detecting recent positive selection in the human genomefrom haplotype structure. Nature 419, 832–-837 (2002).
93. Dermitzakis, E. T. et al. Numerous potentially functional but non-genicconserved sequences on human chromosome 21. Nature 420, 578–-582(2002).
94. Margulies, E. H., Blanchette, M., Haussler, D. & Green, E. D. Identification andcharacterization of multi-species conserved sequences. Genome Res. 13,2507–-2518 (2003).
95. Need, A. C., Motulsky, A. G. & Goldstein, D. B. Priorities and standards inpharmacogenetic research. Nature Genet. 37, 671–-681 (2005).
96. Brem, R. B., Storey, J. D., Whittle, J. & Kruglyak, L. Genetic interactionsbetween polymorphisms that affect gene expression in yeast. Nature 436,701–-703 (2005).
97. Istrail, S. et al. Whole-genome shotgun assembly and comparison of humangenome assemblies. Proc. Natl Acad. Sci. USA 101, 1916–-1921 (2004).
98. Venter, J. C. et al. The sequence of the human genome. Science 291, 1304–-1351(2001).
99. The Chimpanzee Sequencing and Analysis Consortium. Initial sequence of thechimpanzee genome and comparison with the human genome. Nature 437,69–-87 (2005).
100.Matsuzaki, H. et al. Genotyping over 100,000 SNPs on a pair of oligonucleotidearrays. Nature Methods 1, 109–-111 (2004).
101. Bailey, J. A. et al. Recent segmental duplications in the human genome. Science297, 1003–-1007 (2002).
102. Wigginton, J. E., Cutler, D. J. & Abecasis, G. R. A note on exact tests of Hardy–-Weinberg equilibrium. Am. J. Hum. Genet. 76, 887–-893 (2005).
103. Hill, W. G. & Weir, B. S. Maximum-likelihood estimation of gene location bylinkage disequilibrium. Am. J. Hum. Genet. 54, 705–-714 (1994).
Supplementary Information is linked to the online version of the paper atwww.nature.com/nature.
Acknowledgements We thank many people who contributed to this project:J. Beck, C. Beiswanger, D. Coppock, A. Leach, J. Mintzer and L. Toji (CoriellInstitute for Medical Research) for transforming the Yoruba, Japanese and HanChinese samples, distributing the DNA and cell lines, storing the samples foruse in future research, and producing the community newsletters and reports;J. Greenberg and R. Anderson (NIH National Institute of General MedicalSciences) for providing funding and support for cell line transformation andstorage in the NIGMS Human Genetic Cell Repository at the Coriell Institute;T. Dibling, T. Ishikura, S. Kanazawa, S. Mizusawa and S. Saito (SNP ResearchCenter, RIKEN) for help with genotyping; C. Hind and A. Moghadam fortechnical support in genotyping and all members of the subcloning andsequencing teams at the Wellcome Trust Sanger Institute; X. Ke (WellcomeTrust Centre for Human Genetics at the University of Oxford) for help with dataanalysis; Oxford E-Science Centre for provision of high-performance computingresources; H. Chen, W. Chen, L. Deng, Y. Dong, C. Fu, L. Gao, H. Geng, J. Geng,M. He, H. Li, H. Li, S. Li, X. Li, B. Liu, Z. Liu, F. Lu, F. Lu, G. Lu, C. Luo, X. Wang,Z. Wang, C. Ye and X. Yu (Beijing Genomics Institute) for help with genotypingand sample collection; X. Feng, Y. Li, J. Ren and X. Zhou (Beijing NormalUniversity) for help with sample collection; J. Fan, W. Gu, W. Guan, S. Hu,H. Jiang, R. Lei, Y. Lin, Z. Niu, B. Wang, L. Yang, W. Yang, Y. Wang, Z. Wang,S. Xu, W. Yan, H. Yang, W. Yuan, C. Zhang, J. Zhang, K. Zhang and G. Zhao(Chinese National Human Genome Center at Shanghai) for help withgenotyping; P. Fong, C. Lai, C. Lau, T. Leung, L. Luk and W. Tong (University ofHong Kong, Genome Research Centre) for help with genotyping; C. Pang(Chinese University of Hong Kong) for help with genotyping; K. Ding, B. Qiang,J. Zhang, X. Zhang and K. Zhou (Chinese National Human Genome Center atBeijing) for help with genotyping; Q. Fu, S. Ghose, X. Lu, D. Nelson, A. Perez,S. Poole, R. Vega and H. Yonath (Baylor College of Medicine); C. Bruckner,T. Brundage, S. Chow, O. Iartchouk, M. Jain, M. Moorhead and K. Tran(ParAllele Bioscience Inc.); N. Addleman, J. Atilano, T. Chan, C. Chu, C. Ha,T. Nguyen, M. Minton and A. Phong (UCSF) for help with genotyping, andD. Lind (UCSF) for help with quality control and experimental design;R. Donaldson and S. Duan (Washington University) for help with genotyping,and J. Rice and N. Saccone (Washington University) for help with experimentaldesign; J. Wigginton (University of Michigan) for help with implementing andtesting QA/QC software; A. Clark, B. Keats, R. Myers, D. Nickerson andA. Williamson for providing advice to NIH; J. Melone, M. Weiss andE. DeHaut-Combs (NHGRI) for help with project management; M. Gray fororganizing phone calls and meetings; D. Leja for help with figures; the Yorubapeople of Ibadan, Nigeria, the people of Tokyo, Japan, and the community atBeijing Normal University, who participated in public consultations andcommunity engagements; the people in these communities who were generousin donating their blood samples; and the people in the Utah CEPH communitywho allowed the samples they donated earlier to be used for the Project. Wealso thank A. Clark, E. Lander, C. Langley and R. Lifton for comments on earlierdrafts of the manuscript. This work was supported by the Japanese Ministry ofEducation, Culture, Sports, Science, and Technology, the Wellcome Trust,Nuffield Trust, Wolfson Foundation, UK EPSRC, Genome Canada, GenomeQuebec, the Chinese Academy of Sciences, the Ministry of Science andTechnology of the People’s Republic of China, the National Natural ScienceFoundation of China, the Hong Kong Innovation and Technology Commission,the University Grants Committee of Hong Kong, the SNP Consortium, the USNational Institutes of Health (FIC, NCI, NCRR, NEI, NHGRI, NIA, NIAAA, NIAID,NIAMS, NIBIB, NIDA, NIDCD, NIDCR, NIDDK, NIEHS, NIGMS, NIMH, NINDS,NLM, OD), the W.M. Keck Foundation, and the Delores Dore EcclesFoundation.
Author Contributions David Altshuler, Lisa D. Brooks, Aravinda Chakravarti,Francis S. Collins, Mark J. Daly and Peter Donnelly are members of the writinggroup responsible for this manuscript.
Author Information Reprints and permissions information is available atnpg.nature.com/reprintsandpermissions. The authors declare competingfinancial interests: details accompany the paper at www.nature.com/nature.Correspondence and requests for materials should be addressed to D.A.([email protected]) or P.D. ([email protected]).
ARTICLES NATURE|Vol 437|27 October 2005
1318
© 2005 Nature Publishing Group
The International HapMap Consortium (Participants are arranged by institution, listed alphabetically, and then alphabetically withininstitutions except for Principal Investigators and Project Leaders, as indicated.)
Genotyping centres: Baylor College of Medicine and ParAllele BioScience Richard A. Gibbs (Principal Investigator)1, John W. Belmont1,Andrew Boudreau2, Suzanne M. Leal1, Paul Hardenbol2, Shiran Pasternak1, David A. Wheeler1, Thomas D. Willis2, Fuli Yu1; Beijing GenomicsInstitute Huanming Yang (Principal Investigator)3, Changqing Zeng (Principal Investigator)3, Yang Gao3, Haoran Hu3,Weitao Hu3, ChaohuaLi3, Wei Lin3, Siqi Liu3, Hao Pan3, Xiaoli Tang3, Jian Wang3, Wei Wang3, Jun Yu3, Bo Zhang3, Qingrun Zhang3, Hongbin Zhao3, Hui Zhao3, JunZhou3; Broad Institute of Harvard and Massachusetts Institute of Technology Stacey B. Gabriel (Project Leader)4, Rachel Barry4, BrendanBlumenstiel4, Amy Camargo4, Matthew Defelice4, Maura Faggart4, Mary Goyette4, Supriya Gupta4, Jamie Moore4, Huy Nguyen4, Robert C.Onofrio4, Melissa Parkin4, Jessica Roy4, Erich Stahl4, Ellen Winchester4, Liuda Ziaugra4, David Altshuler (Principal Investigator)4,5; ChineseNational Human Genome Center at Beijing Yan Shen (Principal Investigator)6, Zhijian Yao6; Chinese National Human Genome Center atShanghai Wei Huang (Principal Investigator)7, Xun Chu7, Yungang He7, Li Jin7, Yangfan Liu7, Yayun Shen7, Weiwei Sun7, HaifengWang7, YiWang7, Ying Wang7, YingWang7, Xiaoyan Xiong7, Liang Xu7; Chinese University of Hong Kong Mary M. Y. Waye (Principal Investigator)8,Stephen K. W. Tsui8; Hong Kong University of Science and Technology Hong Xue (Principal Investigator)9, J. Tze-Fei Wong9; IlluminaLauna M. Galver (Project Leader)10, Jian-Bing Fan10, Sarah S. Murray10, Arnold R. Oliphant11, Mark S. Chee (Principal Investigator)12; McGillUniversity and Genome Quebec Innovation Centre Alexandre Montpetit (Project Leader)13, Fanny Chagnon13, Vincent Ferretti13, MartinLeboeuf13, Jean-Francois Olivier13, Michael S. Phillips13, Stephanie Roumy13, Clementine Sallee14, Andrei Verner13, Thomas J. Hudson (PrincipalInvestigator)13; Perlegen Sciences Kelly A. Frazer (Principal Investigator)15, Dennis G. Ballinger15, David R. Cox15, David A. Hinds15, Laura L.Stuve15; University of California at San Francisco and Washington University Pui-Yan Kwok (Principal Investigator)16, Dongmei Cai16,Daniel C. Koboldt17, Raymond D. Miller17, Ludmila Pawlikowska16, Patricia Taillon-Miller17, Ming Xiao16; University of Hong Kong Lap-CheeTsui (Principal Investigator)18, William Mak18, Pak C. Sham18, You Qiang Song18, Paul K. H. Tam18; University of Tokyo and RIKEN YusukeNakamura (Principal Investigator)19,20, Takahisa Kawaguchi20, Takuya Kitamoto20, Takashi Morizono20, Atsushi Nagashima20, YozoOhnishi20, Akihiro Sekine20, Toshihiro Tanaka20, Tatsuhiko Tsunoda20; Wellcome Trust Sanger Institute Panos Deloukas (Project Leader)21,Christine P. Bird21,Marcos Delgado21, Emmanouil T. Dermitzakis21, Rhian Gwilliam21, Sarah Hunt21, JonathanMorrison21, Don Powell21, BarbaraE. Stranger21, Pamela Whittaker21, David R. Bentley (Principal Investigator)22
Analysis groups: Broad Institute of Harvard and Massachusetts Institute of Technology Mark J. Daly (Project Leader)4,5, Paul I. W. deBakker4,5, Jeff Barrett4,5, Ben Fry4, Julian Maller4,5, Steve McCarroll4,5, Nick Patterson4, Itsik Pe’er4,5, Shaun Purcell5, Daniel J. Richter4, PardisSabeti4, Richa Saxena4,5, Stephen F. Schaffner4, Patrick Varilly4, David Altshuler (Principal Investigator)4,5; Cold Spring Harbor LaboratoryLincoln D. Stein (Principal Investigator)23, Lalitha Krishnan23, Albert Vernon Smith23, Gudmundur A. Thorisson23; Johns Hopkins UniversitySchool of Medicine Aravinda Chakravarti (Principal Investigator)24, Peter E. Chen24, David J. Cutler24, Carl S. Kashuk24, Shin Lin24; Universityof Michigan Goncalo R. Abecasis (Principal Investigator)25, Weihua Guan25, Heather M. Munro25, Zhaohui Steve Qin25, Daryl J. Thomas26;University of Oxford Gilean McVean (Project Leader)27, Leonardo Bottolo27, Susana Eyheramendy27, Colin Freeman27, JonathanMarchini27,Simon Myers27, Chris Spencer27, Matthew Stephens28, Peter Donnelly (Principal Investigator)27; University of Oxford, Wellcome TrustCentre for Human Genetics Lon R. Cardon (Principal Investigator)29, Geraldine Clarke29, David M. Evans29, Andrew P. Morris29, Bruce S.Weir30; RIKEN Tatsuhiko Tsunoda20; US National Institutes of Health James C. Mullikin31, Stephen T. Sherry32, Michael Feolo32
Community engagement/public consultation and sample collection groups: Beijing Normal University and Beijing Genomics InstituteHoucan Zhang33, Changqing Zeng3, Hui Zhao3; Health Sciences University of Hokkaido, Eubios Ethics Institute, and Shinshu UniversityIchiro Matsuda (Principal Investigator)34, Yoshimitsu Fukushima35, Darryl R. Macer36, Eiko Suda37; Howard University and University ofIbadan Charles N. Rotimi (Principal Investigator)38, Clement A. Adebamowo39, Ike Ajayi39, Toyin Aniagwu39, Patricia A.Marshall40, ChibuzorNkwodimmah39, Charmaine D. M. Royal38; University of Utah Mark F. Leppert (Principal Investigator)41, Missy Dixon41, Andy Peiffer41
Ethical, legal and social issues: Chinese Academy of Social Sciences Renzong Qiu42; Genetic Interest Group Alastair Kent43; KyotoUniversity Kazuto Kato44; Nagasaki University Norio Niikawa45; University of Ibadan School of Medicine Isaac F. Adewole39; University ofMontreal BarthaM. Knoppers14;University of Oklahoma MorrisW. Foster46;Vanderbilt University EllenWright Clayton47;Wellcome TrustJessica Watkin48
SNP discovery: Baylor College of Medicine Richard A. Gibbs (Principal Investigator)1, John W. Belmont1, Donna Muzny1, Lynne Nazareth1,Erica Sodergren1, George M. Weinstock1, David A. Wheeler1, Imtiaz Yakub1; Broad Institute of Harvard and Massachusetts Institute ofTechnology Stacey B. Gabriel (Project Leader)4, Robert C. Onofrio4, Daniel J. Richter4, Liuda Ziaugra4, BruceW. Birren4,Mark J. Daly4,5, DavidAltshuler (Principal Investigator)4,5; Washington University Richard K. Wilson (Principal Investigator)49, Lucinda L. Fulton49; WellcomeTrust Sanger Institute Jane Rogers (Principal Investigator)21, John Burton21, Nigel P. Carter21, Christopher M. Clee21, Mark Griffiths21,Matthew C. Jones21, Kirsten McLay21, Robert W. Plumb21, Mark T. Ross21, Sarah K. Sims21, David L. Willey21
Scientific management: Chinese Academy of Sciences Zhu Chen50, Hua Han50, Le Kang50; Genome Canada Martin Godbout51, John C.Wallenburg52; Genome Quebec Paul L’ Archeveque53, Guy Bellemare53; Japanese Ministry of Education, Culture, Sports, Science andTechnology Koji Saeki54; Ministry of Science and Technology of the People’s Republic of China Hongguang Wang55, Daochang An55,Hongbo Fu55, Qing Li55, Zhen Wang55; The Human Genetic Resource Administration of China Renwu Wang56; The SNP ConsortiumArthur L. Holden57; US National Institutes of Health Lisa D. Brooks58, Jean E. McEwen58, Christianne R. Bird58, Mark S. Guyer58, Patrick J.Nailer58, Vivian OtaWang58, Jane L. Peterson58, Michael Shi59, Jack Spiegel60, Lawrence M. Sung61, JonathanWitonsky62, Lynn F. Zacharia58,Francis S. Collins63; Wellcome Trust Karen Kennedy48, Ruth Jamieson48 & John Stewart48
Affiliations for participants: 1Baylor College of Medicine, Human Genome Sequencing Center, Department of Molecular and Human Genetics, 1 Baylor Plaza, Houston, Texas77030, USA. 2ParAllele Bioscience, Inc., 7300 Shoreline Court, South San Francisco, California 94080, USA. 3Beijing Genomics Institute, Chinese Academy of Sciences, Beijing100300, China. 4The Broad Institute of Harvard and Massachusetts Institute of Technology, 1 Kendall Square, Cambridge, Massachusetts 02139, USA. 5Massachusetts GeneralHospital and Harvard Medical School, Simches Research Center, 185 Cambridge Street, Boston, Massachusetts 02114, USA. 6Chinese National Human Genome Center at Beijing,
NATURE|Vol 437|27 October 2005 ARTICLES
1319

© 2005 Nature Publishing Group
3-707 N. Yongchang Road, Beijing Economic-Technological Development Area, 100176, China. 7Chinese National Human Genome Center at Shanghai, 250 Bi Bo Road, Shanghai201203, China. 8The Chinese University of Hong Kong, Department of Biochemistry, The Croucher Laboratory for Human Genomics, 6/F Mong Man Wai Building, Shatin, HongKong. 9Hong Kong University of Science and Technology, Department of Biochemistry, Clear Water Bay, Kowloon, Hong Kong. 10Illumina, 9885 Towne Centre Drive, San Diego,California 92121, USA. 1115518 Markar Road, Poway, California 92064, USA. 12Prognosys Biosciences, Inc., 4215 Sorrento Valley Boulevard, Suite 105, San Diego, California 92121,USA. 13McGill University and Genome Quebec Innovation Centre, 740 Drive Penfield Avnue, Montreal, Quebec H3A 1A4, Canada. 14University of Montreal, The Public LawResearch Centre (CRDP), P.O. Box 6128, Downtown Station, Montreal, Quebec H3C 3J7, Canada. 15Perlegen Sciences, Inc., 2021 Stierlin Court, Mountain View, California 94043,USA. 16University of California, San Francisco, Cardiovascular Research Institute, 513 Parnassus Avenue, Box 0793, San Francisco, California 94143, USA. 17Washington UniversitySchool of Medicine, Department of Genetics, 660 S. Euclid Avenue, Box 8232, St Louis, Missouri 63110, USA. 18University of Hong Kong, Genome Research Centre, 6/F,Laboratory Block, 21 Sassoon Road, Pokfulam, Hong Kong. 19University of Tokyo, Institute of Medical Science, 4-6-1 Sirokanedai, Minato-ku, Tokyo 108-8639, Japan. 20RIKENSNP Research Center, 1-7-22 Suehiro-cho, Tsurumi-ku Yokohama, Kanagawa 230-0045, Japan. 21Wellcome Trust Sanger Institute, The Wellcome Trust Genome Campus,Hinxton, Cambridge CB10 1SA, UK. 22Solexa Ltd, Chesterford Research Park, Little Chesterford, Nr Saffron Walden, Essex CB10 1XL, UK. 23Cold Spring Harbor Laboratory, 1Bungtown Road, Cold Spring Harbor, New York 11724, USA. 24Johns Hopkins University School of Medicine, McKusick-Nathans Institute of Genetic Medicine, BroadwayResearch Building, Suite 579, 733 N. Broadway, Baltimore, Maryland 21205, USA. 25University of Michigan, Center for Statistical Genetics, Department of Biostatistics, 1420Washington Heights, Ann Arbor, Michigan 48109, USA. 26Center for Biomolecular Science and Engineering, Engineering 2, Suite 501, Mail Stop CBSE/ITI, UC Santa Cruz, SantaCruz, California 95064, USA. 27University of Oxford, Department of Statistics, 1 South Parks Road, Oxford OX1 3TG, UK. 28University of Washington, Department of Statistics,Box 354322, Seattle, Washington 98195, USA. 29University of Oxford/Wellcome Trust Centre for Human Genetics, Roosevelt Drive, Oxford OX3 7BN, UK. 30North CarolinaState University, Bioinformatics Research Center, Campus Box 7566, Raleigh, North Carolina 27695, USA. 31US National Institutes of Health, National Human Genome ResearchInstitute, 50 South Drive, Bethesda, Maryland 20892, USA. 32US National Institutes of Health, National Library of Medicine, National Center for Biotechnology Information, 8600Rockville Pike, Bethesda, Maryland 20894, USA. 33Beijing Normal University, 19 Xinjiekouwai Street, Beijing 100875, China. 34Health Sciences University of Hokkaido, IshikariTobetsu Machi 1757, Hokkaido 061-0293, Japan. 35Shinshu University School of Medicine, Department of Medical Genetics, Matsumoto 390-8621, Japan. 36United NationsEducational, Scientific and Cultural Organization (UNESCO Bangkok), 920 Sukhumwit Road, Prakanong, Bangkok 10110, Thailand. 37University of Tsukuba, Eubios Ethics Institute,P.O. Box 125, Tsukuba Science City 305-8691, Japan. 38Howard University, National Human Genome Center, 2216 6th Street, NW, Washington DC 20059, USA. 39University ofIbadan College of Medicine, Ibadan, Oyo State, Nigeria. 40Case Western Reserve University School of Medicine, Department of Bioethics, 10900 Euclid Avenue, Cleveland, Ohio44106, USA. 41University of Utah, Eccles Institute of Human Genetics, Department of Human Genetics, 15 North 2030 East, Salt Lake City, Utah 84112, USA. 42Chinese Academyof Social Sciences, Center for Applied Ethics, 2121, Building 9, Caoqiao Xinyuan 3 Qu, Beijing 100054, China. 43Genetic Interest Group, 4D Leroy House, 436 Essex Road, LondonN1 3QP, UK. 44Kyoto University, Institute for Research in Humanities and Graduate School of Biostudies, Ushinomiya-cho, Sakyo-ku, Kyoto 606-8501, Japan. 45NagasakiUniversity Graduate School of Biomedical Sciences, Department of Human Genetics, Sakamoto 1-12-4, Nagasaki 852-8523, Japan. 46University of Oklahoma, Department ofAnthropology, 455 W. Lindsey Street, Norman, Oklahoma 73019, USA. 47Vanderbilt University, Center for Genetics and Health Policy, 507 Light Hall, Nashville, Tennessee37232-0165, USA. 48Wellcome Trust, 215 Euston Road, London NW1 2BE, UK. 49Washington University School of Medicine, Genome Sequencing Center, Box 8501, 4444 ForestPark Avenue, St Louis, Missouri 63108, USA. 50Chinese Academy of Sciences, 52 Sanlihe Road, Beijing 100864, China. 51Genome Canada, 150 Metcalfe Street, Suite 2100,Ottawa, Ontario K2P 1P1, Canada. 52McGill University, Office of Technology Transfer, 3550 University Street, Montreal, Quebec H3A 2A7, Canada. 53Genome Quebec, 630,boulevard Rene-Levesque Ouest, Montreal, Quebec H3B 1S6, Canada. 54Ministry of Education, Culture, Sports, Science, and Technology, 3-2-2 Kasumigaseki, Chiyodaku, Tokyo100-8959, Japan. 55Ministry of Science and Technology of the People’s Republic of China, 15 B. Fuxing Road, Beijing 100862, China. 56The Human Genetic ResourceAdministration of China, b7, Zaojunmiao, Haidian District, Beijing 100081, China. 57The SNP Consortium, 3 Parkway North, Deerfield, Illinois 60015, USA. 58US National Institutesof Health, National Human Genome Research Institute, 5635 Fishers Lane, Suite 4076, Bethesda, Maryland 20892, USA. 59Novartis Pharmaceuticals Corporation, BiomarkerDevelopment, One Health Plaza, East Hanover, New Jersey 07936, USA. 60US National Institutes of Health, Office of Technology Transfer, 6011 Executive Boulevard, Rockville,Maryland 20852, USA. 61University of Maryland School of Law, 500 W. Baltimore Street, Baltimore, Maryland 21201, USA. 62Frost & Sullivan, 2400 Geng Road, Suite 201, PaloAlto, California 94303, USA. 63US National Institutes of Health, National Human Genome Research Institute, 31 Center Drive, Bethesda, Maryland 20892, USA.
ARTICLES NATURE|Vol 437|27 October 2005
1320