vol 6, no 10 (2018)
TRANSCRIPT

Vol 6, No 10 (2018)
Archives of Business Research
DOI: http://dx.doi.org/10.14738/abr.610.2018
Archives of Business Research
Volume 6, Issue 10 - October - 2018
Table of Contents
Articles
Users ’ attitude towards telecommunication
operators: a Study on Grameenphone and
Banglalink
S. M. Sohel Ahmed
Marketing Ethics in Creative Industry : an
Exploration Study
Sri Hartini
Composition of Ingredients in Syubhah Semi
Processed Food, Trust and Purchase Behavior - A
Conceptual Framework
Reezlin Rahman
An Analytical-Exploratory Approach to a Socially-
Optimal, Sustainable, and Balancing Social Security
System
Reza G. Hamzaee, Stephanie Michelle Dilley,
Mengmeng Wang
Supply Response of Potato to Price and Non-price
factors in Swaziland
Daniel Vusi Dlamini
A Survey of Benefit Approaches and Innovation
Loop Required for IT Governance
Amit Ghildyal, Elizabeth Chang, Keith Joiner
ANALYSIS OF INTENTION TO USE
ELECTRONIC MONEY IN DENPASAR CITY:
TAM APPROACH
I Komang Sumerta, I Made Wardana
Customer Centricity: The Road to Financial
Inclusion The Case of the Commercial International
Bank (CIB) in Egypt
Hanan Elmoursy, Nazly Hussein, Sherif Ahmed
The Effect of Community Empowerment Program
for Fisherman Community to Enhance the Market
Penetration a Case Studies in Tuban Indonesia
Muslichah Erma W., Nova Retnowati, Soeharjoepri
Soeharjoepri
The impact of health information systems on the
performance of human resources (HR) in King
Faisal Specialist Hospital in Taif
Adnan Awad Shawabkeh
Correcting the Incorrect: an Exploratory Study into
the Role of the Controller in Counteracting
Financial Fake News
W. Veldman, D. M. Swagerman
Assessing Multiple-Item Manufacturing Capability
Measures: A Critical Review
Rhonda L. Hensley, Joanne S. Utley
Empirical Studies Use The Balanced Scorecard To
Measure Government Performance
Muchriana Muchran
Perceptions of destination image and effects on
college football fans: A case study of conference
realignment
Cheryl Rode, Angela Sebby, Kenneth Jordan
The Impact of Cultural Similarity on Consumer
Ethnocentrism Tendencies Toward Foreign Products
eman alshammari, MICHAEL WILLIAMS
Supply Chain Management and Organization
Performance: A Value Creation Perspective
Evans Kyeremeh, Mawuko Dza
Capital Mobility in the World: TPP Experience
Yutaka Kurihara
How Strategic International Human Resource (IHR)
Strategies can manage Organizational Performance
Challenges
Rossano V. Gerald
THE EFFECT OF COMPETENCE,
COMPENSATION OF ORGANIZATIONAL
CITIZENSHIP BEHAVIOR AND
PERFORMANCE OF EMPLOYEES IN LIFE
INSURANCE COMPANIES IN BATAM CITY
Suhardi Suhardi

Learning Pyramid Models To Improve Early
Childhood Science Skills
Masitowati Gatot
Comparative Impact Of Corporate Social
Responsibility On Marketing Performance: A Study
Of ABC PLC And ALEX Industries PLC, Imo State
Nigeria.
Anthony Nduka Nwachukwu, Agu Godswill Agu
Performance
Appraisal and
Employee
Commitment in
Abia State Civil
Service: A
Focus on
Ministries of
Education and
Works
Onyemaechi
Uchenna, Agu
Godswill Agu,
Emmanuel
Uche Uche
UNTITLED PDF
The Effect of Asset Growth With Profitability and
Company’s Value (Case Study: Coal Company was
Listed in Bursa Efek Indonesia during 2014-2016
Period)
Mulyanto Nugroho Nugroho
An Application of Timmons Model in the Mini
Entrepreneurial Logistics Project
Wee Yu Ghee
EFFECT OF COMPENSATION,
COMMUNICATION AND SPIRITUALITY AT
WORK ON THE PERFORMANCE OF THE
TURNOVER INTENTION AS AN
INTERVENING VARIABLE
Sumiati Sumiati Sumiati
THE INFLUENCES OF HIGH PERFORMANCE
WORK SYSTEM ON TRUST IN
MANAGEMENT, AND PERSONAL SAFETY
ORIENTATION OF SURABAYA FIRE
FIGHTERS
Zainal arief

New Product Introduction Prize (NPIP) and the
Market Value of the Firm: An Empirical
Investigation into the Computer, Electronic and
Communication Industry (CECI)
Isaac Quaye, Yinping Mu, Braimah Abudu, Alfred
Sarbah
___________________________________________________________________
Archives of Business Research; ISSN 2054-7404
Copyright Society for Science and Education, United Kingdom

ArchivesofBusinessResearch–Vol.6,No.10PublicationDate:Oct.25,2018DOI:10.14738/abr.610.5356.
Sumerta, I. K.,&Wardana, I.M. (2018).AnalysisOf IntentionToUseElectronicMoney InDenpasarCity: TAMApproach.ArchivesofBusinessResearch,6(10),86-103.
AnalysisOfIntentionToUseElectronicMoneyInDenpasarCity:TAMApproach
I.KomangSumerta
EconomicsandBusinessFaculty,UdayanaUniversity,Bali-Indonesia
I.MadeWardana
EconomicsandBusinessFaculty,
UdayanaUniversity,Bali-Indonesia
ABSTRACTThe rapid development of technology has penetrated various sectors of life in thecommunity,oneofwhichisinthebankingsector.Electronicmoneyhasadvantagesanddisadvantages that can affect the behavior of consumers to use it.This study aims toexplaintheusefulnessandperceivedconsumers'useofelectronicmoneyproducts.Thepopulationofthisresearchis infinite.Thesamplingmethodusedinthisstudyisnon-probability sampling.The sampling technique in this study was purposivesampling.Thesampleusedwas108respondents.TheanalyticaltoolusedisWarpPLS3.0Theresultsof thisstudyareperceivedusefulnessandperceivedeaseofusehasapositiveandsignificanteffectonusingelectronicmoney.Perceivedusefulnesshaveapositiveandsignificanteffectontheintentiontouseelectronicmoney.Theattitudeofusing electronic money has a positive and significant effect on the intention to useelectronicmoney.Perceived ease of use have a positive and significant effect on theperceived the usefulness of electronicmoney.The practical implication of electronicmoney issuing companies can improve and improve in terms of the community'sintention to use electronic money as a medium for future micropaymenttransactions.Factors that influence the intention to use in this study are perceivedusefulness,perceivedeaseandattitude.Theoreticalimplicationsinthisstudytoenrichthe concept of consumer behavior in marketing, especially the results of previousresearchontheintentionofusingelectronicmoney.Keywords:TAM,IntentionofUse,ElectronicMoney
INTRODUCTION
The rapid development of technology has penetratedmany sectors of life in society, one of
which is inankkanPERBsector.Advances in technology in the sector has been very rapidbanking case, from the advent of automated teller machines (ATMs),mobilebanking,to
internetbanking.The technological progress did not stop there, in 2009 the Indonesian
government together with Bank Indonesia issued a new banking product basedontechnologynamely electronic money.Technological advancements have an impact on all
industries, including the banking industry which currently can facilitate customer bankingactivitiesto bemore efficient and also friendly to its users(Akincietal.2004).In general,
technologicaldevelopments in the fieldof financial transactionsshapeconsumerbehavior to
tend to use more effective and efficient transaction tools, one of which is to use non-cashtransactions.Non-cashtransactionsthatarecurrentlydevelopingareusingelectronicmoney.

ArchivesofBusinessResearch(ABR) Vol.6,Issue10,Oct-2018
Copyright©SocietyforScienceandEducation,UnitedKingdom 87
Table1.CashTransactionVolumeandElectronicMoney
No. Year Cash(BillionsofRp.)
E-money(BillionsofRp.)
Total(BillionsofRp.) E-Money(%)
1 2010 54.158.062 693 54.158.755 0.001
2 2011 66.921.296 981 66.922.277 0,001
3 2012 99.396.764 1.971 99.398.735 0,002
4 2013 90.959.927 2.907 90.962.834 0,003
5 2014 111.795.756 3.319 111.799.075 0,003
6 2015 112.845.451 5.283 112.850.734 0,005
7 2016 111.827.354 7.063 111.834.417 0,006
8 2017* 96.847.623 1.264 96.848.887 0,001
*)UntilOctober2017
Source:BankIndonesia,2017.
Electronicsmoney isthe latestinstrumentinapaymentsystem,electronicmoneydefinedby
Soefianto(2012)asameansofpaymenthasthefollowingelements;issuedonthebasisofthevalue ofmoneydeposited in advance, the value ofmoney stored electronically in amedium
such as a server or chip, usedas a means of payment to traders who are not issuers ofelectronic money, as well as the value of electronic money deposited by the holder and
managedbytheissuerratherthanisadepositasreferredtointhelawgoverningbanking.The
increasingly widespread issuance of electronic money issued by banking and non-bankinginstitutions such as;Bank Mandiri withe-tollproduct, BCA with theFlazz
Cardproduct,PT.Telekomunikasi Indonesia withFlexiCashproducts, and Telkomsel withT-
cashproductswhichraisescompetitionsotightlyintheelectronicmoneybusiness.
Thedevelopmentof electronicmoney in Indonesia is very rapid since itwas issued in2009ago.According to data from Bank Indonesia (2017) until October 2017 the number of
electronic money circulating in the community reached 75,846,689 units, a very significant
increase from the 2010 data which only amounted to 7,914,018 units.In sum, electronicmoneyhasindeedincreased,butthisincreasehascontinuedtodeclinesince2013.In2017the
useofelectronicmoney isstill categorizedas lowbecause it is stillbelow1percentwhich isstillfarfromtheexpectationsofBankIndonesiawhichtargetstheuseofelectronicscanreach
1percentoftotaltransactions(Bisnis.com,2014).
Electronicmoneyhasadvantagesanddisadvantagesthatcanaffectthebehaviorofconsumers
to use it.Consumer behavior is the behavior shown by consumers in finding, buying, using,
evaluating and disposing of products and services that are expectedtomeet various needs(Schiffman and Kanuk, 2010).In this case, individualswho are consumers have the right to
accept or reject a product, is one form of consumer behavior (Howard and Sheth, 1979)explainsthatthetheoryofconsumerbehaviorcanbeseenfromtheprocess,namelytheinput
intheformofmarketingstimuliandtheenvironmentthatwillproduceoutputintheformof
attitude(attitudetowardbehavior), intention(attention), andpurchasebehavior (purchasebehavior).This basis is used(Davis, 1985)in developing a technology adoption intention
model, namelyTechnology Acceptance Model(TAM) is influenced by two indicators,
namelyperceived usefulnessandperceived ease of usethat can affect the use of behavior.information Technology.This attitude will affect the intention, and then the intention will
influencetheuseofinformationtechnology.
Consideringelectronicmoneyisanewproductintheworldoffinancialtransactionsandbased
on the use of high technology, theTechnology Acceptent Model(TAM)theory isveryappropriatetoexplainhowtheintentionsofprospectiveelectronicmoneyconsumersareseen
fromtheirattitudesandperceivedusefulnessandperceivedeaseofuseoftheproduct..

Sumerta, I. K.,&Wardana, I.M. (2018). AnalysisOf IntentionToUseElectronicMoney InDenpasar City: TAMApproach.Archives of BusinessResearch,6(10),86-103.
URL:http://dx.doi.org/10.14738/abr.610.5356. 88
In the development of research carried out based on TAM, there are inappropriate results
between one study and another.In a study conducted byYadavet al.(2015)found thatperceivedeaseofusedidnothaveapositiveandsignificanteffectonconsumerattitudesinthe
useof internet banking, this indicates that consumers feel that it is not easy touse internet
bankingandthisresultiscontrarytotheconceptoftheTAMitselfwhichstatesthateaseofuseperceived influence positive attitude.Several other studies have found that perceived
usefulness have a significant and significant effect on the intention to use (HasioandTang,2013., Dakduketal.2017) but several other studies get different results, where in a study
conducted by Mutianah et al (2012), Yadavetal.(2014) and Weiet al.(2017) found the
opposite, namely the perceived usefulness did not have a significant effect onuse.Researchconducted by Weietal.(2017) states that all variables in TAM, both perceived usefulness,
perceived ease of use and attitude have no significant effect on intention.This is whatencouragesresearcherstoconductresearchwiththeresearchsubjectisTAMwithelectronic
moneyastheobjectofresearch.
Researchthatuseselectronicmoneyasanobjectofresearchisstillveryrarelydone,previous
research on electronic money was conducted in Jakarta (Rahmatsyah, 2011).Research on
electronicmoneywiththeTAMapproachinmajorcitiesinBalihasneverbeendone.Basedontheabovebackground,theresearchaimsto:
1) Toexplaintheeffectofperceivedusefulnessonattitudesusingelectronicmoney.2) Toexplaintheeffectofperceivedeaseofuseontheattitudeofusingelectronicmoney.3) Toexplaintheinfluenceofattitudestowardstheintentionofusingelectronicmoney?4) Toexplaintheeffectofperceivedusefulnessonelectronicuseintentions.5) To explain the effect of perceived ease of use on the perceived the usefulness of
electronicmoney.
LITERATUREREVIEWMarketingStrategyConceptThemarketing concept is a social andmanagerial process in which individuals and groups
obtainwhattheyneed(needs)anddesire(wants)throughthecreation,supplyandexchangeof
everything that has value(value)with another person or group (Kotler, 1999).To apply theconcept of marketing, organizations must understand and remain with their customers to
provideproductsandservicesthatconsumerswillbuyanduse(Hawkins2001).
InfluenceofMarketingStrategiesTo develop an effective marketing strategy, there are aspects that influence the marketingprocess as explained in theWheel of Consumer Analysistheory(PeterandOlson, 2008).This
theory explains three aspects that influence effectiveness in marketing strategies, namely
consumereffectandcognition,consumerbehavior,andconsumerenvironment.
InTeoretis,affectiveandcognitiveaspectsrefertoothertypesofreactionsorpsychologicalresponse to a stimulus from the events that occurred in the neighborhood.The aspect of
consumerbehaviorisanimportantfactorinmarketingstrategies.AccordingtoSchifmannand
Kanuk (2010), the definition of consumer behavior is the behavior shown by consumers infinding, buying, using, evaluating, and disposing of products and services that are
expectedtomeet various needs.The last aspect is the environment that refers towhatis afactorexternal to theconsumerwhich influences theconsumeronwhat theythink, feel,and
do.

ArchivesofBusinessResearch(ABR) Vol.6,Issue10,Oct-2018
Copyright©SocietyforScienceandEducation,UnitedKingdom 89
ConsumerKnowledgeofProducts(Consumer'sKnowledge)Consumershavedifferentknowledgeofaproduct.Thisknowledgeisusedasaninterpretation
of information in making purchasing decisions.The level of product knowledge can becategorizedby class, form, brand, andmodel or feature. PeterandOlson (1998), argues that
thetypesofconsumerknowledgeabouttheproductcanbecategorizedintothreecategories:
productsebgaicollectionofattributes,acollectionofbenefitsandvaluesatisfaction.
ConsumerEngagement(Consumer'sInvolvement)Consumer involvement is referring to consumers' perceived things that are related or
importantfromcertainproducts,eventsoractivities(PeterandOlson,2008).Thisinvolvement
occurswhenconsumersperceiveorconsideraproduct,serviceormarketingmessagetofulfilltheir goals and needs.Consumer involvement or participation influences the level of
information search,decisionmakingprocesses, the formationofbeliefs, attitudes, intentionsandbehaviors,forexamplelookingforproductvariations,tryingotherproductbrands,brand
loyalty,frequencyofproductuse(BeharrelandDennison,1995).
ConsumerPerception.Consumerperceptionisafeelingorimpressionthataconsumerhasonaproduct.Perception
can be formed from consumer experience, as well as from the impression instilled byproducers,amongothersthroughtheappliedmarketingcommunication.Consumerperception
canaffecttheoveralldecisionmakingprocessindeterminingthepurchaseoruseofaproduct.
TheoryofReasonedAction(TRA)This theory was developed by FishbeinandAjzen (1975) and compiled using basicassumptions that humans are creatures with reason to decidewhatbehaviorto take, in a
consciousmanner and consider all available information.ThisTRA explains that behavior is
carriedoutbecauseindividualshavetheintentionordesiretoapplyit.
TheoryofPlannedBehavior(TPB)This theory is a development of TRA.This TPB develops TRA by adding a construct that
isperceivedbehavioralcontrolwill affect intention and behavior(Ajzen, 1991).At TPB there
arethreemainfactorsasdeterminantsofintention,firstisanattitudethatreflectstheextentto which individuals have an assessment of agreeing or disagreeing to conduct
behavior.Second, social factorsarealsocalledsubjectivenorms, referring toperceivedsocialpressuretodoornotconductbehavior.Thelastisbehaviorcontrol,whichreferstoperceived
easeordifficultyinperformingbehavior.
TechnologyAcceptanceModel(TAM)TheoryThe Technology Acceptance Model(TAM) developed by Fred Davis (1989) describes the
acceptanceoftechnologythatwillbeusedbytechnologyusers.Thistheorywasadoptedfromseveral models that were built to analyze and understand the factors that influence the
acceptanceoftheuseofnewtechnologies, includingthoserecordedinvariousliteratureandreferences to research results in the field of information technology areTheoryofReasoned
Action(TRA)andTheoryofPlannedBehavior(TPB).
CONCEPTUALFRAMEWORK
Takingintoaccountalltheexposurestothetheoriesdescribedabove,alongwiththepositive
and negative aspects that exist in these theories, a model of a thinking and conceptualframeworkisarrangedasshownbelow:
Sumerta, I. K.,&Wardana, I.M. (2018). AnalysisOf IntentionToUseElectronicMoney InDenpasar City: TAMApproach.Archives of BusinessResearch,6(10),86-103.
URL:http://dx.doi.org/10.14738/abr.610.5356. 90
Figure1.ConceptualFramework
Theresearcherdoesnotcorrelatetheinfluencebetweenperceivedeaseofuseandintentionof
use because based on the existing theory, it is less strengthening the relationship between
these variables.Based on the theory, the usage intention is influenced by the perceivedusefulness and attitudes of the consumers,while the perceived ease has a relationshipwith
perceivedusefulnessandattitude,becauseifsomeonefeelseasyinusinge-money,itwillfeele-moneyhasbenefitsandconsumerswilldeterminetheirattitudeagainsttheexistenceofe-
money.Theeaseofusinge-moneywillnotnecessarilyattract someone's interest inusinge-
money because if switching to a new payment method one needs more things that canencouragehisinterestinusinge-moneysuchasperceivedusefulnessandattitude. ResearchHypothesis:H1:Perceived usefulness have a positive and significant effect on the attitude of usingelectronicmoney.H2:Perceived usefulness has a positive and significant effect on intention to use electronicmoney.
H3:Theattitudeofusehasapositiveandsignificanteffectonthe intentiontouseelectronicmoney.
H4:Perceived ease of use have a positive and significant effect on the attitude of usingelectronicmoney.
H5:Perceivedeaseofusehaveapositiveandsignificanteffectontheperceivedtheusefulnessofusingelectronicmoney.
RESEARCHMETHODSTo get good research results, research design is needed to support and provide systematic
research results.This study uses a quantitative approach that is analyzed
associatively.Associative research is research that aims to determine the influence orrelationshipofavariableormore(Nugroho,2005:25).Togetgoodresearchresults,research
design is needed to support and provide systematic research results.This study uses a
H3
H2
H1
H5
H4
Perceived Usefulness
Intention of Use
Attitude
Perceived Ease of Use
ArchivesofBusinessResearch(ABR) Vol.6,Issue10,Oct-2018
Copyright©SocietyforScienceandEducation,UnitedKingdom 91
quantitativeapproachthatisanalyzedassociatively.Associativeresearchisresearchthataims
todeterminetheinfluenceorrelationshipofavariableormore(Nugroho,2005:25).
Table2.
VariableOperationalDefinitionVariable Indicator Source
PerceivedUsefulness(X1) PU1=Speedupthepayment
process
PU2=Increasestheaccuracyofthepaymentprocess
PU3=Feelsafer
PU4=Giveattractivepromotions
PU5=Moreefficient
TaylorandTodd(1995c),Mafeet
al.(2009),RigopouosandAskounis
(2007).
PerceivedEaseofUse(X2) PEOU1=Easeofuse
PEOU2=Easeofunderstanding
PEOU3=PracticalinusePEOU4=Flexibility
RigopouosandAskounis(2007),
Davis(1989).
Attitude(Y1)
A1=Desired
A2=Useful
A3=OK
A4=Fun
TaylorandTodd(1995c),
Bhattacherjee(2000),Peslaket
al.(2010
Intention(Y2) ITU1=LookingforInformation
ITU2=WillingtoBuy
ITU3=FindingOut
ITU4=LearnITU5=Willingtouse
TaylorandTodd(1995c),
RigopoulosandAskounis(2007),
Peslaketal.(2010)
Source:Dataprocessed,2018
Basedonitsnature,thetypeofdatausedinthisstudyisquantitativedata.Quantitativedataisdata that can be calculated and in the form of numbers (Nugroho, 2005: 27).Data were
quantified in this research thatthe datacanbeanumberinthe results of the questionnaire
datathathavebeendistributed.
Primary data sources come from distributing questionnaires to respondents in accordancewith predetermined criteria that have been obtained directly from respondents
regardingperceivedusefulness,perceivedeaseofuse,attitudeandintentiontouseelectronic
money.The population used in this study is the prospective consumer of electronic moneylocated inDenpasarwhosenumberscannotbe identified.Thesampledeterminationmethod
used in this study isnon-probability samplingwhere this technique does notprovideequalopportunitiesoropportunitiesforeachelementormemberofthepopulationto
bechosenasasample(Sugiyono,2015:44).
The sampling technique in this study waspurposive sampling.Thispurposive
samplingtechnique is a technique thatdetermines a samplebasedon certain considerations
and is determined intentionally by the researcher (Nugroho, 2005: 40).In this study using18indicators so that the number of respondents used for the sample is 18x6= 108
respondents.Determinationofasampleof108respondentsinaccordancewiththeprovisionsof sampling to obtainmaximum results should be used larger orequalto 100 samples.The
measurementscaleusedinthisstudyistheLikertscale,whichisascalethathasbeenwidely
used to ask respondents to mark the degree of approval or disagreement with a series ofstimulusobjects.TheLikertscaleusedis1tostronglydisagreeto5stronglyagree.

Sumerta, I. K.,&Wardana, I.M. (2018). AnalysisOf IntentionToUseElectronicMoney InDenpasar City: TAMApproach.Archives of BusinessResearch,6(10),86-103.
URL:http://dx.doi.org/10.14738/abr.610.5356. 92
DataanalysistechniqueInferentialStatisticalAnalysisDataanalysisinthisstudyusedPartialLeastSquare(PLS)approach.PLSisanequationmodel
forStructural Equation Modeling(SEM) based on components or variants.To praise the
hypothesisandproducea feasiblemodel, this studyusesStructuralEquationModeling(SEM)with avariance basedorcomponent basedapproachwithPartial Least Square(PLS).If the
structural model tobeanalyzed meets the recrusive model and the latent variable hasnormativeindicators.Reflectiveormixed,themostappropriateapproachtouseisPLS.
RESEARCHRESULTCharacteristicsofRespondents
Table3.CharacteristicsofRespondents
No. Variable Classification amount
Percentage(%)
1 Age(year) 19-23 26 24.1
24-28 57 52.8
29-33 16 14.8
34-38 5 4,6
39-43 1 0.9
44-48 1 0.9 49-53 1 0.9
54-58 1 0.9
2 Gender Woman 42 38.9
Man 66 61.1
3 Lasteducation Highschool 54 50
Diploma 5 4,6
Bachelor 47 43.5
Postgraduate 2 1.9
4 Work Student/Student 15 13,9 PNS/TNI/POLRI 2 1.9
Privateemployees 85 78.7
Entrepreneur 2 1.9
Professional 4 3.7
5 Expendituresin1month IDR1,000,000-IDR2,750,000 55 50,9
IDR2,750,001-IDR4,500,000 34 31.5
IDR4,500,001-IDR6,250,000 16 14.8
IDR6,250,000-IDR8,000,000 1 0.9 IDR.9,750,001-IDR.11,500,000 1 0.9
IDR13,250,001-IDR15,000,000 1 0.9
Source:Dataprocessed,2018
Table3shows several things related to the characteristics of respondents.Referring to thetable it can be seen that the male respondents more mmendominasi which amounted
to61,1percent comparedwith38.9percentof female respondents.Basedon theagegroup,
respondentsaged24 to28have thehighestpercentage,which is52.8percent.Basedon therespondents' last education, it can be seen that the level of high school education has the
highest percentage of 50 percent.Based on the type of work, can be seen in private sectoremployeeshavethehighestpercentagethatisequalto78,7percent.Basedonexpendituresin
one month, it can be seen spending of IDR 1,000,000 to IDR 2,750,000 has the highest
percentageof50,9percent.

ArchivesofBusinessResearch(ABR) Vol.6,Issue10,Oct-2018
Copyright©SocietyforScienceandEducation,UnitedKingdom 93
RespondentAnswerDistributionAccordingtoNataWirawan(2002:35)thedeterminationoffrequencydistributionisbasedon
theintervalvalue,sotoobtainthefrequencydistribution.Tofindouttheoverallassessmentoftheresearchvariables,itwillbeseenfromtheaveragescorewiththefollowingcriteria:
1.00-1.79=VeryLow
1.80-2.59=Low
2.60-3.39=Neutral
3,40-4,19=Height
4,20-5,00=VeryHighBased on the results of the study, it can be seen the responses of respondents from each
indicatorofeachvariableasfollows:
PerceivedUsefulnessTable4shows that the total average response scoreRespondents regarding the usefulnessperceptionvariablemeasuredusing5indicatorsis4.10.
Table4
AssessmentofRespondentsonVariablesPerceivedBenefit
No. StatementAnswerClassification
Average InformationSTS TS N S SS1 2 3 4 5
1 Speedupthepaymentprocess 0 1 7 62 38 4.27 Veryhigh
2Increasetheaccuracyofthepayment
process 0 4 13 56 35 4,13 High
3 Feelsafer 1 4 19 48 36 4.06 High
4 Giveattractivepromotions 4 6 30 45 23 3.71 High
5 Moreefficientintransactions 1 1 8 50 48 4.32 Veryhigh
AverageScoreTotal 4.10 HighSource:Dataprocessed,2018
Based on these results that the average respondent's overall answer about the perceived
usefulnessintheuseofelectronicmoneyinDenpasarCitywashigh.Indicatorwiththehighestaveragescoreismoreefficientintransactionsof4.32.
EaseofPerceptionTable 5shows that the total average score of respondents' responses regarding perceived
usefulnessvariablesmeasuredusing4indicatorsis4.07.
Table5AssessmentofRespondentsonEasePerceptionVariables
No. StatementAnswerClassification
Average InformationSTS TS N S SS1 2 3 4 5
1 Easytolearn 1 0 16 75 16 3.97 Veryhigh
2 Easytouseintransactions 0 0 13 59 36 4.21 Veryhigh
3 Practicalinuse 0 0 7 54 47 4.37 Veryhigh
4 Flexible(usedanytimeandanywhere) 1 11 27 45 24 3.74 High
AverageScoreTotal 4.07 HighSource:Dataprocessed,2018

Sumerta, I. K.,&Wardana, I.M. (2018). AnalysisOf IntentionToUseElectronicMoney InDenpasar City: TAMApproach.Archives of BusinessResearch,6(10),86-103.
URL:http://dx.doi.org/10.14738/abr.610.5356. 94
Basedontheseresultsthattheaveragerespondent'soverallanswerabouttheperceivedease
of use of electronic money in Denpasar is high.Indicator with the highest average score ispracticalinusageof4.37
AttitudeTable6shows that the total average score of respondents' responses regarding attitude
variablesmeasuredusing4indicatorsis4.06.
Table6AssessmentofRespondentsonAttitudeVariables
No. StatementAnswerClassification
Average InformationSTS TS N S SS1 2 3 4 5
1 Iamveryinterestedinelectronicmoney 0 4 10 61 33 4,14 High
2 ElectronicMoneyisveryuseful 0 2 15 57 34 4,14 High
3 Electronicmoneyisgoodtouse 0 0 20 59 29 4.08 High
4 Funelectronicmoney 0 3 26 59 20 3.89 High
AverageScoreTotal 4.06 HighSource:Dataprocessed,2018
Based on these results, the average respondent's overall answers to attitudes in the use ofelectronicmoneyinDenpasarCitywerehigh.Theindicatorwiththehighestaveragescoreis
veryinterestedinelectronicmoneyandelectronicmoneyisveryusefulat4.14.
IntentionofUseTable7shows that the total average score of respondents' responses regarding the useintentionvariablemeasuredusing5indicatorsis4.17.
Table7
AssessmentofRespondentsonVariableIntentionsofUse
No. StatementAnswerClassification
Average InformationSTS TS N S SS1 2 3 4 5
1Iwilllookformoredetailedinformation
aboutelectronicmoney. 0 1 16 61 30 4,11 High
2 Iamwillingtobuyelectronicmoney. 1 2 15 53 37 4,14 High
3 Iwillfindoutwheretobuyelectronicmoney. 0 3 16 57 32 4.09 High
4 Iwillfindouthowtouseelectronicmoney. 0 2 11 59 36 4.19 High
5 Iamwillingtouseelectronicmoney. 1 2 9 45 51 4.32 Veryhigh
AverageScoreTotal 4,17 HighSource:Dataprocessed,2018
Based on these results that the average respondent's overall answer about the intention of
using electronicmoney in Denpasar Citywas high.Indicatorwith the highest average scorethatiswillingtouseelectronicmoneyof4.32.
TestingofResearchInstrumentsValiditytestValiditytestcanbedonebycorrelatingbetweeninstrumentitemscoreswithatotalscoreofall
statement items.If thecorrelationbetweeneach itemscorestatementon the totalscore, thestatement points indicate the correlation coefficient value ≥ 0, 3then each item of the
statementissaidtobevalid(Sugiyono,2012:178).

ArchivesofBusinessResearch(ABR) Vol.6,Issue10,Oct-2018
Copyright©SocietyforScienceandEducation,UnitedKingdom 95
Table8InstrumentValidityTestResults
No. Variable Indicator Correlationcoefficient Information1 PerceivedUsefulness X1.1 0.408 Valid
X1.2 0.688 Valid
X1.3 0.705 Valid
X1.4 0.730 Valid X1.5 0.710 Valid
2 EaseofPerception X2.1 0.493 Valid
X2.2 0.851 Valid
X2.3 0.629 Valid
X2.4 0.718 Valid
3 Attitude Y1.1 0.705 Valid
Y1.2 0.729 Valid
Y1.3 0.754 Valid Y1.4 0.87 Valid
4 IntentionofUse Y2.1 0.909 Valid
Y2.2 0.863 Valid
Y2.3 0.905 Valid
Y2.4 0.884 Valid
Y2.5 0.815 Valid
Source:Dataprocessed,2018BasedonthevaliditytestinTable8shows18indicatorsusedhaveacorrelationvaluegreater
than0.3sothattheoverallindicatorsusedaredeclaredvalid.
ReliabilityTestReliability or reliability testing of instruments shows the extent towhich ameasurement isreturned to thesamesymptoms.A reliable instrument is an instrument that is used several
timestomeasurethesameobjectwillproducethesamedataoranswer.Theinstrumentissaidtobereliableifithasacronbachalpha≥0,60.(Sugiyono,2012:172)
Table9
InstrumentReliabilityTestResultsVariable Cronbach'sAlpha Information
PerceivedUsefulness 0.845 ReliableEaseofPerception 0.676 ReliableAttitude 0.941 ReliableIntentionofUse 0.916 Reliable
Source:Dataprocessed,2018
DATAANALYSISEvaluationoftheGoodnessoffitPLSmodel.BasedontheresultsofWarp-PLSoutput,thefollowingresultsareobtainedfromAPC,ARS,andAVIF.
Table10
GoodnessofFitFitmodel Index p-value Criteria InformationAveragepathcoefficient(APC) 0.487 P<0.001 P<0.050 Beaccepted
AverageR-Squared(ARS) 0,594 P<0.001 P<0.050 BeacceptedAverageBlockVarianceInflationFactor(AVIF) 1,990 <5 Beaccepted
Source:Dataprocessed,2018
Sumerta, I. K.,&Wardana, I.M. (2018). AnalysisOf IntentionToUseElectronicMoney InDenpasar City: TAMApproach.Archives of BusinessResearch,6(10),86-103.
URL:http://dx.doi.org/10.14738/abr.610.5356. 96
Basedon the resultsoftheAPCandARSvaluesabove, it canbesaid that the resultsof this
studycanbeacceptedbecausetheymeetthecriteriaofgoodnessoffitwheretheAPCandARSvaluesmustbesmallerthan0.05(SolihinandRatmono,2013;61).
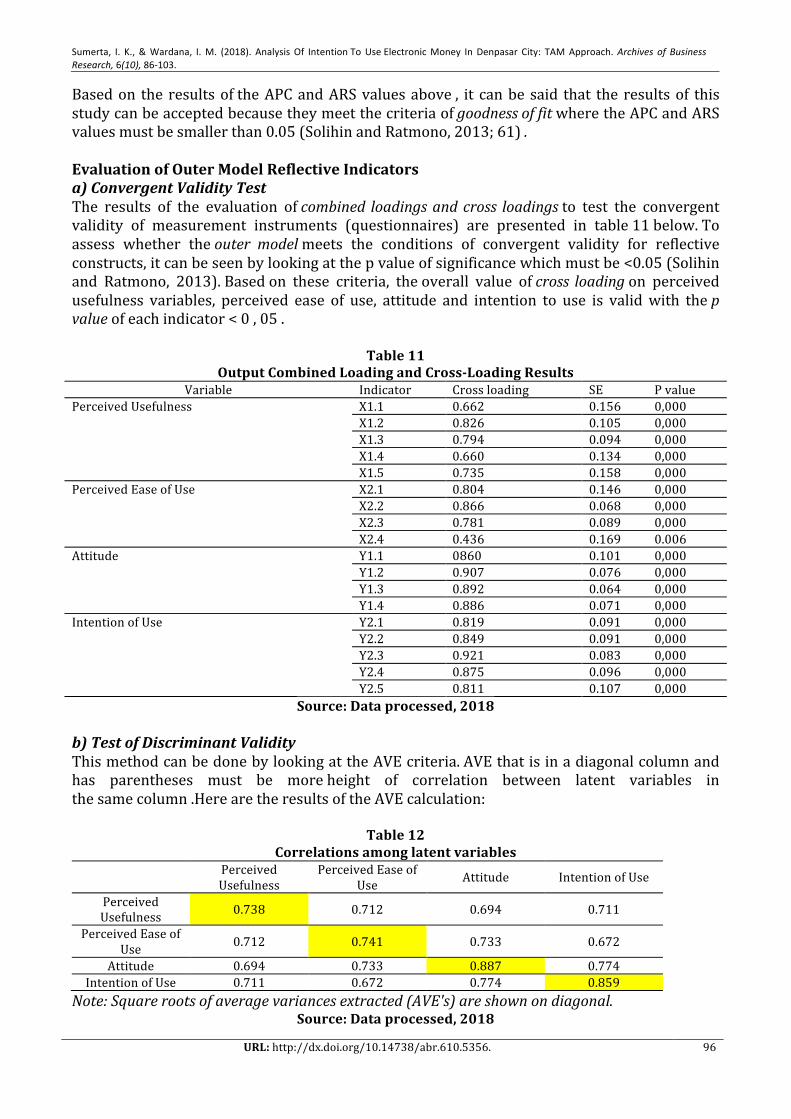
EvaluationofOuterModelReflectiveIndicatorsa)ConvergentValidityTestThe results of the evaluation ofcombined loadingsandcross loadingsto test the convergentvalidity of measurement instruments (questionnaires) are presented in table11below.To
assess whether theouter modelmeets the conditions of convergent validity for reflective
constructs,itcanbeseenbylookingatthepvalueofsignificancewhichmustbe<0.05(Solihinand Ratmono, 2013).Basedon these criteria, theoverall value ofcross loadingon perceived
usefulness variables, perceived ease of use, attitude and intention to use is validwith thepvalueofeachindicator<0,05.
Table11
OutputCombinedLoadingandCross-LoadingResultsVariable Indicator Crossloading SE Pvalue
PerceivedUsefulness X1.1 0.662 0.156 0,000
X1.2 0.826 0.105 0,000
X1.3 0.794 0.094 0,000
X1.4 0.660 0.134 0,000
X1.5 0.735 0.158 0,000
PerceivedEaseofUse X2.1 0.804 0.146 0,000
X2.2 0.866 0.068 0,000
X2.3 0.781 0.089 0,000
X2.4 0.436 0.169 0.006
Attitude Y1.1 0860 0.101 0,000
Y1.2 0.907 0.076 0,000
Y1.3 0.892 0.064 0,000
Y1.4 0.886 0.071 0,000
IntentionofUse Y2.1 0.819 0.091 0,000
Y2.2 0.849 0.091 0,000
Y2.3 0.921 0.083 0,000
Y2.4 0.875 0.096 0,000
Y2.5 0.811 0.107 0,000
Source:Dataprocessed,2018b)TestofDiscriminantValidityThismethodcanbedonebylookingattheAVEcriteria.AVEthatisinadiagonalcolumnandhas parentheses must be moreheight of correlation between latent variables in
thesamecolumn.HerearetheresultsoftheAVEcalculation:
Table12Correlationsamonglatentvariables
Perceived
UsefulnessPerceivedEaseof
UseAttitude IntentionofUse
PerceivedUsefulness
0.738 0.712 0.694 0.711
PerceivedEaseof
Use0.712 0.741 0.733 0.672
Attitude 0.694 0.733 0.887 0.774IntentionofUse 0.711 0.672 0.774 0.859
Note:Squarerootsofaveragevariancesextracted(AVE's)areshownondiagonal.
Source:Dataprocessed,2018

ArchivesofBusinessResearch(ABR) Vol.6,Issue10,Oct-2018
Copyright©SocietyforScienceandEducation,UnitedKingdom 97
Table12showsthatthecriteriafordiscriminantvalidityhavebeenfulfilledasindicatedbythe
squarerootAVEgreaterthanthecorrelationcoefficientbetweenconstructsineachindicator
ofeachvariablecanmeasurethesevariablespreciselythanwithothervariables.
a)Testthevalidityofresearchinstruments
Table13Averagevariancesextracted
AveragevariancesextractedPerceivedBenefit 0.545PerceivedEaseofUse 0.549Attitude 0,786IntentionofUse 0.733
Source:Dataprocessed,2018(Attachment7)
Averagevarianceextracted(AVE)foreachindicatorismorethan0,50,soitcanbesaidthat
thefourconstructsmeettheconvergentvaliditycriteria.
b)Researchinstrumentreliabilitytest
Table14
Researchinstrumentreliabilitytest Composite reliability coefficients Cronbach's alpha coefficients Perceived Benefit 0.856 0.788 Perceived Ease of Use 0.822 0.708 Attitude 0.936 0.909 Intention of Use 0.932 0.908
Source:Dataprocessed,2018
The reliability of the research instrument was measured using two measures,composite
reliabilityandcronbach's alpha.Based on these data, each indicator has met the sizeofcompositereliabilityandCronbach'salphais>0,70.
InnerModelEvaluationInner model evaluation aims to determine the goodness of fit model with the following
methods:a)R-Square(R2)Showsthestrongweakinfluencecausedbyvariationsinexogenousvariablesonendogenousvariables.TheR-Square valueis greater than 0, 50categorized as a strong model.TheR-
Squarevalues of each endogenous variable from the results of data processing performed
arepresentedintheformofTable15below:
Table15RatedR-SquareResearch
R-Square Value Criteria(Chin,1998)PerceivedBenefit 0.519 StrongPerceivedEaseofUse - Attitude 0.602 StrongIntentionofUse 0.661 Strong
Source:Dataprocessed,2018
BasedonthesedatathevalueoftheR-squareconstructperceivedusefulnessof0.519indicates
that the variance of perceived usefulnesscan be explained by 51.9% by the variance of

Sumerta, I. K.,&Wardana, I.M. (2018). AnalysisOf IntentionToUseElectronicMoney InDenpasar City: TAMApproach.Archives of BusinessResearch,6(10),86-103.
URL:http://dx.doi.org/10.14738/abr.610.5356. 98
perceived ease of use.R-squaredconstruct constructsof 0.602 indicate that the variance of
attitudescan be explained by 60, 2% by the variance of perceived usefulness, and theperceived ease of use.R-squaredconstruct of use intentionof0.661 indicatesthat the
varianceofuseintentioncanbeexplainedby66.1%byvarianceofperceivedusefulness,and
attitude.
b)Q-SquareQ-squarepredictiverelevancetomeasurehowwell theobservationvalue is generatedby the
model and its parameter estimates.ValueQ-square> 0 indicates the model haspredictive
relevance, otherwise if the value ofthe Q-square<0 indicates the model lackspredicttiverelevance.
Table16
ValueQ-SquareResearch Q-SquarePerceivedBenefit 0.521PerceivedEaseofUse -Attitude 0.605IntentionofUse 0.664
Source:Dataprocessed,2018
Q-squareis the result of testing predictive validity and the value must be greater thanzero(SolihinandRatmono,2013).Themodelestimationresultsshowgoodpredictivevalidity
of 0.521, 0.605 and 0.664, so that the value is above zero,whichmeans that the predictivevalidity of each of these variables is categorized as good.TheoverallQ-Square(Predictive
Relevance)valueofthemodelcanbecalculatedasfollows:
Q2=1-(1-R21)(1-R22)(1-R23)
Q2=1-(1-0.519)(1-0.602)(1-0.661)
Q2=1-(0.481)(0.398)(0.339)
Q2=1-0.0649 Q2=0.9351
ThecalculationaboveobtainedvalueofQ2at0.9351,so that thevalue isgreater than0and
thusmayotherwisegoodpredictivevalidity.
a)TestingVariableRelationshipStatisticsTestingofvariablerelationshipstatisticscanbeseenbylookingattheeffectsizevaluewhichis
calculatedas theabsolutevalueof individualcontributions foreach latentvariablepredictoronthevalueofR-Squared.
Table17
PathCoefficient
Standard
ErrorEffect
SizePath
coefficientsP
valuesPerceivedUsefulness à Attitude 0.097 0.247 0.354 0.001PerceivedUsefulness à IntentionofUse 0.077 0.235 0.330 0.001
PerceivedEaseofUse àPerceived
Usefulness0.074 0.519 0.720 0.001
PerceivedEaseofUse à Attitude 0.090 0.355 0.484 0.001Attitude à IntentionofUse 0.074 0.426 0.547 0.001
Source:Dataprocessed,2018

ArchivesofBusinessResearch(ABR) Vol.6,Issue10,Oct-2018
Copyright©SocietyforScienceandEducation,UnitedKingdom 99
Sizeeffectscanbegroupedintothreecategories:weak(0.02),medium(0.15),andlarge(0.35)
(SolihinandRatmono,2013;33).Table5.16showsthattheeffectsizevalueofeachvariableis
greaterthan0.2sothatitisinthemediumandlargecategory.Testingofvariablerelationshipstatistics can also be seen from thevalueofthe path coefficients for
eachvariablerelationshipshowsapositive and significantrelationshipbecausep-value is less
than0.05(SolihinandRatmono,2013;62).
Figure2.Modeltestingresults
Source:Dataprocessed,2018
DISCUSSION
TheinfluenceofperceptionsofusefulnessontheattitudeofusingelectronicmoneyThe resultsof hypothesis testingshowthat perceptions of usefulness have a positive and
significanteffectontheattitudeofusingelectronicmoney.Thisresultmeansthatthemoreapersonfeelsthatelectronicmoneyisbeneficial,itwillencouragesomeonetobepositiveabout
the use of electronic money.This is supported by researchsuch as that conducted
byAlagozandHekimoglu, (2012),Yadavet al.(2015),Baileyet al.(2017),Maet al.(2017)andWeiet al.(2017)get the same results, namely the Perceived usefulness has a positive
effectonattitude.
TheinfluenceofperceptionsofusefulnessontheintentionofusingelectronicmoneyBased on the hypothesis test, it is found that the Perceived usefulness has a positive andsignificant effect on the intention of using electronic money.This means that the more
someonefeelselectronicmoneyisuseful,thepersonwillhavemoreintentiontouseelectronic
money.ThisisconsistentwiththeresearchconductedbyGiovanisetal.(2012),
Safeenaet al.(2013),Awaet al.(2015),Dakduketal.(2017)andWeietal.(217)found thatperceptionsofusefulnesshaveapositiveandsignificanteffectonconsumerintentions.
Theeffectofusageattitudeontheintentionofusingelectronicmoney.Basedonthehypothesistest foundthattheattitudeofusingelectronicmoneyhasapositive
andsignificanteffecton the intentionofusingelectronicmoney.Thismeans that themorea
person has a positive attitude towards the use of electronic money, it will bepossibletoincreasetheperson'sintentiontouseelectronicmoney.Thisisconsistentwiththeresearch
ofYadav,et al.(2015),Dakduketal.(2017) andWeietal.(2017)found that attitude had apositiveandsignificanteffectonintention.
Effectofperceptionsofeaseofuseontheattitudeofusingelectronicmoney.BasedonthehypothesistestfoundthatthePerceivedeaseofusehasapositiveandsignificant
effectontheattitudeofusingelectronicmoney.Thismeansthatthemoresomeonefeelsthe
ease with the existence of electronic money, the person will have a more positive attitude

Sumerta, I. K.,&Wardana, I.M. (2018). AnalysisOf IntentionToUseElectronicMoney InDenpasar City: TAMApproach.Archives of BusinessResearch,6(10),86-103.
URL:http://dx.doi.org/10.14738/abr.610.5356. 100
towardselectronicunag.This is consistentwithprevious research that thePerceivedeaseof
usehasapositiveandsignificanteffectonattitudes,suchasresearchconductedbyHsiaoandTang(2014),Dakduketal.(2017)andWeietal.(2017).
TheinfluenceofperceptionsofeaseofuseonthePerceivedtheusefulnessofelectronicmoneyBasedonthehypothesistestfoundthatthePerceivedeaseofusehasapositiveandsignificanteffectonthePerceivedtheusefulnessofelectronicmoney.Thismeansthatthemoreaperson
feelsthattheeasegainedbyusingelectronicmoneywill improveone'sperceptionrelatedto
the usefulness of electronic money.This is supported byresearchbyRauniaretal.(2014),Phonthanukitithaworn,etal.(2015),Dakduketal.(2017)an
dWeietal.(2017)who found that the Perceived ease of use had a positive and significanteffectonperceptionsofusefulness.
IMPLICATIONSOFRESEARCHRESULTSImplicationsTeoretisBasedonthefindingsinthisLitianpene,thentheimplicationTeoretiscouldbesaidthatthis
research model, enrich the concept of consumer behavior in marketing, especially in theintention of using electronic money.The results of this study indicate thatperceptions of
usefulness,perceivedeaseandattitudehaveapositiveandsignificanteffectontheintentiontouse electronicmoney.The results also reinforce dansupportthe results of previous studies
relatedtotheintentionofusingelectronicmoney.It isexpectedthattheresultsofthisstudy
can be used as reference material in knowing the development of marketing strategies forelectronicmoneyproductsandthedevelopmentofconsumerbehaviortowardsintentionsor
interests and consumer responses in using electronic money and / or other new productsbasedontechnology.
PracticalImplicationsBased on the results of the study obtained practical implications about the factors that
influence the intention to use electronicmoney.Intention of usein this study is aconsumer
behaviorwhereconsumershaveadesiretouseanelectronicmoneyproduct.Thefactorsthatinfluence the intention to use in this study are perceptions of usefulness, perceived ease of
use,and attitude.The results of this study also enable electronicmoney issuing companies,especially those domiciled in Denpasar, to bemore aware of aspects that can improve and
improve in promoting or implementing appropriate marketing strategies to increase the
interest of the community's intention to use electronic money as a mediumforfuturemicropaymenttransactions.
CONCLUSIONSANDRECOMMENDATIONS ConclusionBasedon theresultsof thediscussions thathavebeencarriedout, the followingconclusionsareobtained:
1) Perceived usefulness and significant positive effect on the attitudes of the use ofelectronicmoney.Thisresultmeansthatthemoreapersonfeelsthatelectronicmoneyisbeneficial,itwillencouragesomeonetobepositiveabouttheuseofelectronicmoney.
2) Perceivedusefulnesspositiveandsignificanteffectontheintentionofuseofelectronicmoney.Thismeansthatthemoresomeonefeelselectronicmoneyisuseful,theperson
willhavemoreintentiontouseelectronicmoney.

ArchivesofBusinessResearch(ABR) Vol.6,Issue10,Oct-2018
Copyright©SocietyforScienceandEducation,UnitedKingdom 101
3) Theuseofelectronicmoneyhasapositiveandsignificanteffectontheintentiontouseelectronicmoney.Thismeansthatthemoreapersonhasapositiveattitudetowardsthe
useofelectronicmoney,itwillincreaseone'sintentiontouseelectronicmoney.4) Perceived ease of use positive and significant impact on the attitudes of the use of
electronicmoney.Thismeans themoreone feels feel the easewith electronicmoney
thensomeonewillincreasinglyhaveapositiveattitudetowardsuangelectronics.5) PerceivedeaseofusepositiveandsignificanteffectonthePerceivedtheusefulnessof
electronicmoney.Thismeansthatthemoreapersonfeelsthattheeasegainedbyusingelectronicmoneywill improveone'sperceptionrelatedtotheusefulnessofelectronic
money.
SUGGESTION
After studying, analyzing, discussing and drawing conclusions, the writer gives somesuggestions as a consideration in the future.The suggestions that can be submitted are as
follows.
ForPractitionersElectronicmoneypublisherswhouseelectronicmoneywillbemoregoodifyoucanincrease
marketingrelatedtotheusefulnessandusefulnessofelectronicmoneysothatitcancreateapositive attitude for its users.Based on the characteristics of respondents, the dominant
respondent'sageis24yearsto28years.Sothatbusinesspeoplewhoissueelectronicmoneytobemorelikelytotargetpeopleaged24to28yearsbecauseatthatagethecommunitytends
tobeinterestedintherenewalofpaymenttechnology,sothiswillfurtherfacilitatethespread
ofelectronicmoney.
ForAcademicsSuggestions for future researchare tobe considered to conduct research indifferentplacesand also expand the research area and target respondents who are more specializedforexampleinadolescentsoradults.Futurestudiesarealsoexpectedtoanalyzetherelationship
mediationofvariables -variables thatexist in theTAMtheory tomeasureandbroader lookfactorsthatmayaffectattitudesandintentionsintheuseofaproduct.Inthefuture,itisalso
expectedthatresearcherscanconductresearchnotonlytomeasureintentions,butalsotothe
variablesofconsumerbehaviortowardstheintentionstheyobtain.
RESEARCHLIMITATIONS1) This researchscopeonlyon the consumer electronicmoneyproducts inDenpasar, so
thatresearchresultscannotbegeneralizedtotheconsumerelectronicmoneyproducts
inotherregions.2) This research only examines the extent to the intention of prospective consumers
towardstheuseofelectronicmoney,atwhereinTAMisitpossibletoconductresearch
tomeasuretheattitudesofprospectiveconsumersthatariseasaresultoftheintentiontouseelectronicmoney.
3) This research is only carried out in certain time points (cross section),while theenvironment changes every time (dynamic), so this research is important to be done
againinthefuture.
ReferenceAjzen,I.1991.‘Thetheoryofplannedbehavior’,OrgnizationalBehaviordanHumanDecisionProcesses.Academia
Press.Inc.Vol.50,pp.179–211.
Akinci,S.,Aksoy,Ş.danAtilgan,E.2004.‘AdoptionofInternetbankingamongsophisticatedconsumersegmentsinanadvanceddevelopingcountry’,InternationalJournalofBankMarketing.Vol.22.No.3,pp.212–232.

Sumerta, I. K.,&Wardana, I.M. (2018). AnalysisOf IntentionToUseElectronicMoney InDenpasar City: TAMApproach.Archives of BusinessResearch,6(10),86-103.
URL:http://dx.doi.org/10.14738/abr.610.5356. 102
AlagozdanHekimoglu.2012.‘AStudyonTam:AnalysisofCustomerAttitudesinOnlineFoodOrderingSystem’,
Procedia-SocialdanBehavioralSciences.Vol.6.No.2,pp.1138–1143.
Bhattacherjee,A.2000."Acceptanceofe-commerceservices:thecaseofelectronicbrokerages",IEEETransactions
onSystem,Man,danCybernetics-PartA:SystemHumans,Vol.20.No.4.pp.411-20.
Chin,W.W.1998.ThePartialleastsquaresapproachforstructuralequationmodeling.inG.A.Marcoulides(Ed.),
Modernmethodsforbusinessresearch(pp.295-236).London:LawrenceErbaumAssociates.
Dakduk,S.EnriqueterHorst,ZuleymaSantalla,GermanMolinaandJoséMalavé.2017.‘Customerbehaviorin
electroniccommerce:Abayesianapproach’,JournalofTheoreticaldanAppliedElectronicCommerceResearch,Vol.
12.No.2,pp.1–20.
Davis.1989.S‘PerceivedUsefulness,PerceivedEaseOfUse,danUserAcceptance’,MISQuarterly,Vol.13.No.3,
pp.319–339.
Giovanis,A.N.,Binioris,S.danPolychronopoulos,G.2012‘AnextensionofTAMmodelwithIDTdan
security/privacyriskintheadoptionofinternetbankingservicesinGreece’,EuroMedJournalofBusiness.Vol.7.
No.1,pp.24–53.
Hawkins.2001.ConsumerBehavior:BuildingMarketingStrategy,NewYork:McGraw-HillInc.
Hawkins,D.I,danMothersbaugh,D.I.2010.ConsumerBehaviour:BuildingMarketingStrategy.11thedition.New
York:McGraw-Hill,Irwin.
HowarddanSheth.1979.TheTheoryofNuyerBehaviour,NewYork,JohnWiley.
Hsiao,C.-H.danTang,K.-Y.2014.‘Explainingundergraduates’behaviorintentionofe-textbookadoption’,Library
HiTech,Vol.32No.1,pp.139–163.
Kotler,PdanKevin,L,K.2006.MarketingManagement12e.PearsonInternationalEdition.NewJersey.
Kotler,Philip,danK.L.Keller.2009.ManajemenPemasaran.DiterjemahkanolehBobSabran.Jakarta:
Erlangga.
Latan,hengky,2012.StructuralEquationModeling,KonsepdanAplikasiMenggunakanProgramLisrel8.80,PenerbitAlfabeta,Bandung.
Li,J,.Dick,m.,Alvin,L.andFang,L.,2008.“TheRelationshipBetweenAttitudedanBehavior;AnEmpiricalStudyin
China”.UWABusinessSchool,TheUniversityofWesternAustralia,Crawley,Australia.
Ma,YoonJin,HaeJinGamandJenniferBanning.2017.‘Perceivedeaseofusedanusefulnessofsustainability
labelsonapparelproducts:applicationofthetechnologyacceptancemodel’,FashiondanTextiles.SpringerBerlin
Heidelberg,Vol.4.No.3.pp.1-20.
Mafe.2009.AComparativestudyofmobilemessagingserviceacceptancetoparticipateintelevisionprogrammes,
JournalofServiceManagement,Vol.2No.1.pp.69-102.
Nugroho,Agung.2005.StrategiJituMemilihMetodeStatisticPenelitiandenganSPSS.Jogyakarta.
Peter,P.J.,Olson,J.C.2008.“ConsumerBehaviorinMarketingStrategy”.EightEdition.McGraw-HillInternational
Edition.
Peslak,A.,Ceccucci,W.danSendall,P.2010,AnEmpiricalStudyofInstantMessaging(IM)BehaviorUsingTheory
OfReasonedAction.
PhonthanukitithawornChanchai,CarmineSellittoandMichelleFong,2015.‘UserIntentionstoAdoptMobile
PaymentServices:AStudyofEarlyAdoptersinThailandCHANCHAI’,JournalofInternetBankingdanCommerce,
Vol.20No.1,pp.1–11.
RigopoulosdanAskounis.2007.ATAMFrameworktoEvaluateUsers'PerceptiontowardsOnlineElectronic
Payments,JournalofInternetBankingdanCommerce,Vol.12.No.3.pp.1-20.
SafeenaR.HemaDate,NisarHundewale,andAbdullahKammani.2013.‘CombinationofTAMdanTPBinInternet
BankingAdoption’,InternationalJournalofComputerTheorydanEngineering,Vol.5.No.1.pp.146–150.
Schiffman,L.GdanKanuk,L.K,2010.“ConsumerBehavior”,10thedition.NewJersey,PearsonPrenticeHall.
Sugiyono,2015.MetodePenelitianKuantitatifKualitatifdanRdanD.Bandung.Afabeta.
Taylor,S.danTodd,P.A.1995.DecompositiondanCrossoverEffectsintheTheoryofPlannedBehavior:AStudyof
ConsumerAdoptionIntentions.InternationalJournalofResearchinMarketing,Vol.1No.2.pp.137-55.

ArchivesofBusinessResearch(ABR) Vol.6,Issue10,Oct-2018
Copyright©SocietyforScienceandEducation,UnitedKingdom 103
Taylor,SdanTood,P.A.1955c,UnderstandingInformationTechnologyUsage:ATestofCompetingModels,
InformationSystemResearch,Vol.6.No.2.pp.144-76.
Wei,QijunXie,SongXiaobaoPeng,andMuhammadShabbir.2017‘Predictorsfore-governmentadoption:
integratingTAM,TPB,trustdanperceivedrisk’,TheElectronicLibrary,Vol.35.No.1.pp.2–20.
Yadav,R.,Chauhan,V.danPathak,G.S.2015‘Intentiontoadoptinternetbankinginanemergingeconomy:a
perspectiveofIndianyouth’,InternationalJournalofBankMarketing,334,pp.530–544.doi:10.1108/EL-01-
2014-0022.
OnlineSource:htttp://www.bi.go.id
http://www.bisnis.com