volatileendeavors-smithvu
TRANSCRIPT

Volatile Endeavors:
Negotiating Left Turns Along the SE Hawthorne Bike Corridor
Aaron Smith Helen Vu
[email protected] [email protected]
Portland State University
USP 565
Fall Quarter, December 2009

VOLATILE ENDEAVORS: NEGOTIATING LEFT TURNS Smith & Vu 2
Abstract
Intersections and left-turn maneuvers have been identified as having the highest rates for negative
bicycle and automobile interactions. Our study determines the need for additional transition and
left-turn facilities along the eastbound Hawthorne bike corridor to access northbound residential
feeder routes. The following questions framed our research: What are bicyclists’ perceptions of
safety and comfort when performing a left-hand turn? Are they employing the suggested north-
south bicycle route, if not, why? The data used in this study was collected from three bicycle counts
and responses from 118 intercept surveys of existing users on the bike corridor. Survey results reveal
that 61% of riders find merging across Hawthorne during peak traffic flows to be “very
challenging.” If left-turn treatments were added to the intersection at Southeast 7th and Southeast
Hawthorne, 71% would perceive an increase in their sense of safety, and 50% of cyclists traveling
north indicate that they would modify their route in order to use this facility. This illustrates high
user demand for left-turn treatments. The results of this study may be used to set priorities in the
creation of a low-stress bicycle network by city and transportation designers, planners, and
engineers.

VOLATILE ENDEAVORS: NEGOTIATING LEFT TURNS Smith & Vu 3
Introduction
According to the Census Bureau’s American Communities Survey (2008), Portland, Oregon retains
the highest bicycle ridership in the country, with 6.4% of work commuters utilizing the bicycle as
their primary mode of transportation—a 52% jump from the prior year (as cited in “Portland Bike,
Pedestrian, and Transit,” 2009). These cycling rates in Portland have been achieved through the
city’s commitment to provide “low-stress, efficient, and comfortable facilit[ies].” The city reinforces
this idea in its action plan to “ensure all neighborhoods have adequate low-stress bicycle facilities
connecting to neighborhood commercial corridors and centers so that local residents can safely and
comfortably access them by bicycle or on foot” (Portland Bicycle Plan for 2030 [PBP 2030], 2009, p.
III & A-2).
The Hawthorne Bridge over the Willamette River serves as a primary gateway for bicyclists
traveling from downtown Portland into the city’s southeastern neighborhoods. At rush hour, as
cyclists journey eastward from the bridge along this designated bike corridor, commuters with
destinations to the north must merge across three lanes of heavy traffic in order to execute a left-
hand turn. This maneuver involves multiple points of conflict between bicyclists and motorists,
creating a potentially hazardous condition. This study examines the possible need for additional
transition facilities along the eastbound Hawthorne bike corridor (Hawthorne bridge to Southeast
12th Avenue) to allow safe access to northbound residential feeder routes, in keeping with the stated
goals of Portland’s Bicycle Plan for 2030.
In order to assess this need the following questions were posed: What are cyclists’ perceived
levels of ease and safety when navigating this corridor and performing a left-hand turn? Are these
cyclists employing the suggested north-south bike route that intersects this section of Hawthorne
and if not, where are they turning and why? How safe is the left-hand turn maneuver onto this
route? This study addresses these questions both through the perceptions of cyclists currently
VOLATILE ENDEAVORS: NEGOTIATING LEFT TURNS Smith & Vu 4
commuting along this corridor and through quantitative observations of existing conditions. The
resulting data may be a valuable resource to planners and engineers in identifying the necessity of
and demand for improved level of service at this location, and by cycling advocates who may lobby
for such improvements.
Literature Review
To bolster the reasoning behind PBP’s focus on the creation of a low-stress bicycle network, this
review will focus on the high conflict area of intersections and the maneuvering of left-hand turns.
For the purposes of this study, the preceding topics will be examined through relevant data on
facility safety and treatment, and will be limited to the modal perspective of the basic cyclist. A
spotlight within these bounds will help to promote PBP 2030 objectives.
Hazard Measurements: Numerous studies have combined crash statistics, roadway conditions,
and user data in order to analyze leading points of conflict between cyclists and vehicles. A nine-year
study conducted by Wachtel and Lewiston (1994) indicated that the majority of bicycle-motor
vehicle accidents occurred at intersections. They found that intersections made up 74% of all
bicycle-vehicle collisions (Wachtel and Lewiston, 1994). Data from Oregon’s Traffic Crash
Summary (2009) support this finding. The 2008 Portland pedalcycle summary shows that 196 out of
265 crashes took place at intersections, accounting for 74% of incidents that year (Oregon
Department of Transportation, 2009, p. 82). This number becomes more astounding when one
considers that only 10-20% of bicycle crashes are severe enough to be reported to officials (Portland
Office of Transportation, 2007).
It’s no wonder that even in European cities, where there has been a long history of bicycling
ingrained in the culture of day-to-day living, that the European Conference of Ministers of
Transport (ECMT) identifies the crossings of intersections and executions of left turns as hazardous

VOLATILE ENDEAVORS: NEGOTIATING LEFT TURNS Smith & Vu 5
to cyclists (ECMT, 2000, p. 28). Although it is not clear where crash reports and hospital trauma
statistics overlap, trauma records may provide greater insight on bicycle facility safety. In 2005,
Oregon hospitals had 297 patients from motor vehicle-pedalcyclist collisions; 3.7% of those patients
died from injuries sustained during the conflict (Trauma System and Patient Profile, 2005). As noted
in the Federal Highway Administration’s (FHWA) BIKESAFE, a 1996 study by Hunter et al. was
able to make a reliable distribution of bicycle crash types. Primary causes of automobile-bicycle
crashes were attributed to the following:
• A motorist failing to yield (21.7%)
• A bicyclist failing to yield at an intersection (16.8%)
• A motorist turning or merging into the path of the bicyclist (12.1%)
• A bicyclist failing to yield at midblock location (11.7%)
• A motorist overtaking a bicyclist (8.6%)
• A bicyclist turning or merging into the path of the motorist (7.3%) (as cited in
FHWA BIKESAFE, n.d.)
Contradicting measurements may be discovered when comparing various crash datasets. This is due
to the lack of uniformity of crash-reporting procedures across agencies. A January 2006 report from
the Portland Police Bureau implied that “cyclists merging into travel lanes” was the highest causal
factor of fatalities in bicycle-automobile crashes at 28% (Improving Bicycle Safety, 2007). Utilizing
methodologies to compute bicycle safety provides an additional option to gauge the cycling climate
of an area, and specifically an intersection. Rating models like the Bicycle Safety Index Rating and
Bicycle Level of Service have an intersection component, but fail to incorporate information about
crashes and conflicts. The FHWA also describes a more comprehensive rating tool, the Bicyclist
Intersection Safety Index (Bike ISI). This tool incorporates crash data, conflict and avoidance
maneuvers, and subjective intersection ratings in its rating of intersections (FHWA, n.d.).

VOLATILE ENDEAVORS: NEGOTIATING LEFT TURNS Smith & Vu 6
Gains in Safety: Despite the number of injuries and fatalities reported by Oregon’s crash reports,
Portland’s overall bicycle crash rate is decreasing, likely due to the exponential surge in bicycle
ridership. Development of the bicycle network, in the form of intersection and left-turn facility
upgrades, are consistent with PBP 2030 goals. Birk and Gellar (2005) state that engineers and
planners must construct facilities to the highest standards in order to increase cyclist’s ease of use,
and to minimize negative bicycle-automobile interactions. They have also effectively coined
Portland’s “build it and they will come” approach to describe the city’s success in increasing bicycle
use (Birk & Gellar, 2005). It is reported that over half of Portland residents limit their bicycling due
to traffic safety concerns. Yet multiple studies have shown that increases in bicycling activity itself
create safer conditions. In Copenhagen’s Cycle Policy (2002-2012), the report specifies that a
“critical mass of cyclists decreases accident risk because motorists become more aware of cyclists,
but also because more cyclists are indicative of a well-developed cycling network” (Nelson &
Scholar, n.d., p. 14).
Development of the bicycle network becomes more significant when one considers the three
categories of cyclists: A—advanced, B—basic, and C—children. Group A cyclists (10% of overall
cycling population) are more skilled and therefore more willing to use streets with or without bicycle
facilities in their desire to travel on the most direct route. Group B cyclists (40% of biking
population) are moderately skilled, have basic knowledge, and tend to bike occasionally, but prefer
routes with bicycle facilities. For group C (10% of population), biking or public transportation is
often their only modes of transportation because they are too young to drive (Allen, Rouphail,
Hummer, & Milazzon, 1998, p. 29). This means that the greatest potential for new cyclists will come
from group B. In order to attract these new bicyclists, Portland’s bicycle network must continue to
improve bicyclists’ conflict areas. The “subjective feelings of comfort and safety will determine
stress levels experienced, as well as the likelihood of traveling on specific routes or using specific

VOLATILE ENDEAVORS: NEGOTIATING LEFT TURNS Smith & Vu 7
travel modes” (Dewar & Olson, 2002, p. 597). Rietveld and Daniel found that overall perceptions of
bicycle facilities play a significant role in the decision to bicycle. Boslaugh et al. discovered an inverse
relationship between individual’s perceived safety risk and neighborhood bicycle ridership —the
higher the perception of risk, the lower the bicycling levels (as cited in Sener, Eluru, & Bhat, 2008, p.
2). This underscores the necessity to increase the safety of intersection and left-turn treatments.
Innovative Treatments: In their 2004 paper, “Safety Mega Issue,” the Institute of Transportation
Engineers (ITE) highlights the organization’s focus on the “design, construction, operation, and
maintenance of intersections for safety of all user groups.” By considering the needs of all users,
ITE’s improvements to intersection safety would contribute to making communities more livable
and sustainable. In order to produce this outcome and maximize resources, ITE stresses the
necessity for comprehensive research on the effectiveness of road countermeasures and bicycle
treatments (Safety Mega Issue, 2004). There are few bicycle treatments, and even less research,
which specifically address the challenge of intersections and left turns. The use of a colored bicycle
lane through an intersection is one technique to tackle this issue.
Colored bicycle lane marking through intersection
These brightly painted lanes guide cyclists’ movements through intersections and caution motorists
to conflicts with bicycle crossings. In a study of these treatments at intersections in Copenhagen,
VOLATILE ENDEAVORS: NEGOTIATING LEFT TURNS Smith & Vu 8
Jensen concluded that crash rates were reduced by 10% at sites with one demarcated bicycle lane.
However, if more than one colored bike lane were present at an intersection crash rates would
increase (Weigand, 2008, p.3). This highlights the importance of balancing the needs of all users by
designing complete streets.
Portland’s Platinum Bicycle Master Plan Process identified the intersections of Southeast
Hawthorne and 7th, and Southeast Hawthorne and 11th, as two of Portland’s fourteen most difficult
intersections to navigate as a bicyclist. The plan targeted these cumbersome intersections for
immediate treatment (Improving Bicycle Safety, 2007). Examples of some possible designs to
remedy the difficulty of left-hand turns include:
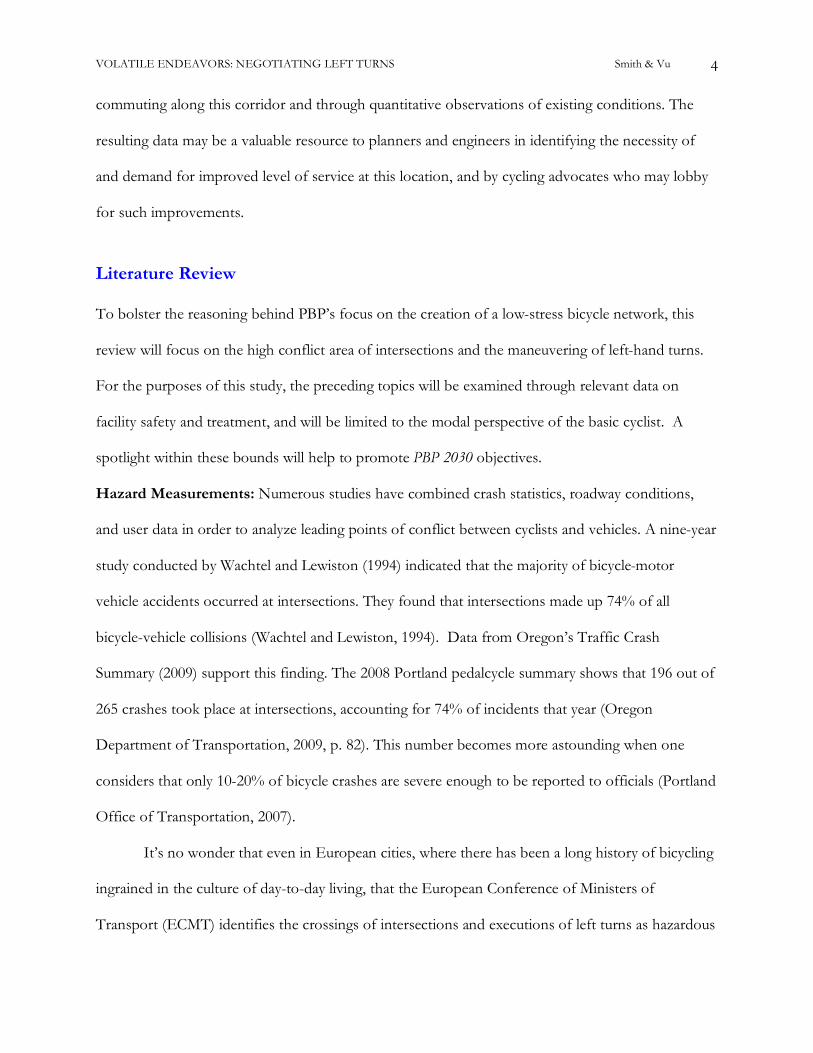
• Two-Stage Signalized Left Turn: aka Copenhagen-left, or Jug-handle turn
In the Copenhagen-left treatment, cyclists turn right at intersecting street and position themselves in
front of traffic at cross street. On green light, they proceed straight. It is the “go right to turn left”
design (PBP 2030: Appendix D, 2009, p. 26). This provides a safe way for cyclists to turn left from
the right lane—this treatment is commonly found in European cities.
VOLATILE ENDEAVORS: NEGOTIATING LEFT TURNS Smith & Vu 9
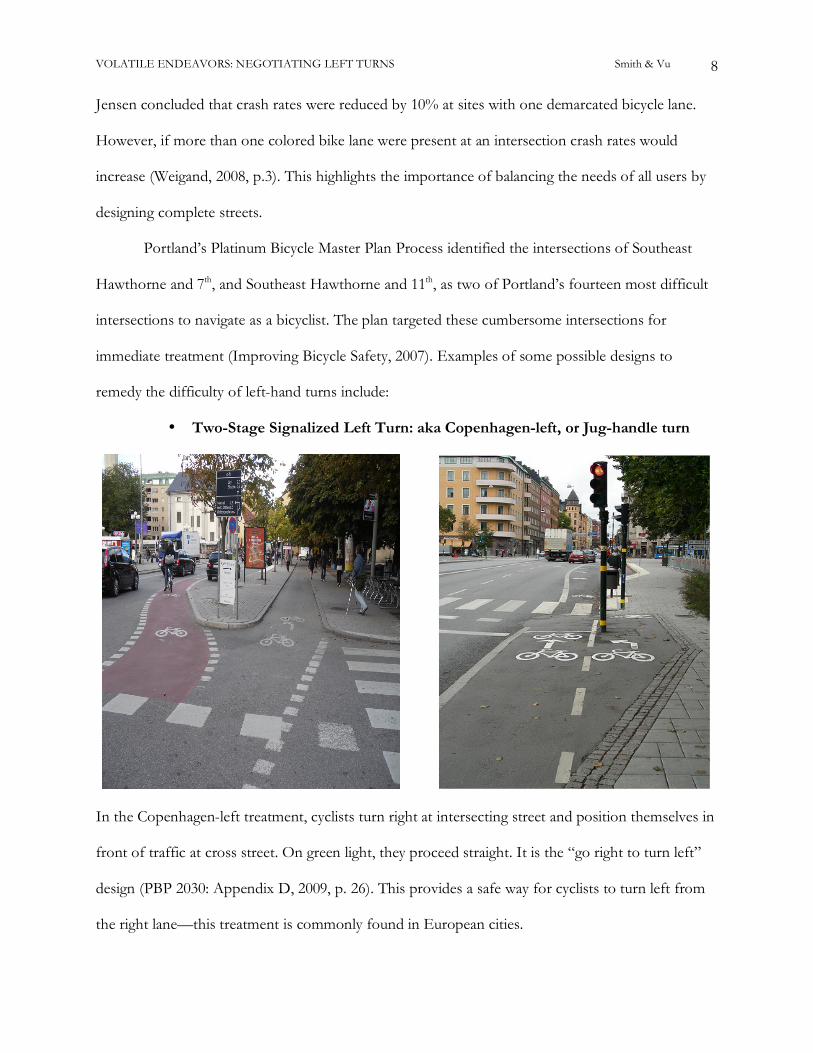
• Two Bike Lane Transition
This treatment decreases the number of merge maneuvers required to transition to the opposite
bikeway facility (San Francisco Department of Parking and Traffic, 2003). The use of color for the
left bike lane would warn motorists of high conflict points with left-turning cyclists, and would
designate preferred left-turn routes in the bicycle network.
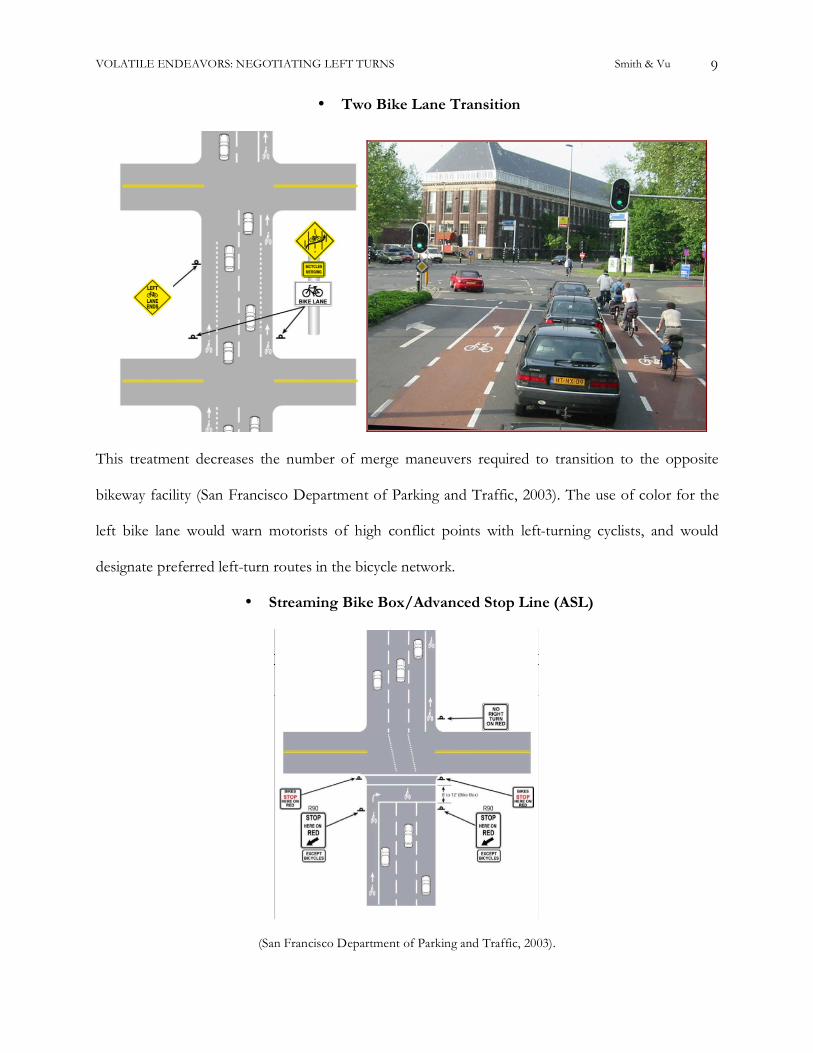
• Streaming Bike Box/Advanced Stop Line (ASL)
(San Francisco Department of Parking and Traffic, 2003).

VOLATILE ENDEAVORS: NEGOTIATING LEFT TURNS Smith & Vu 10
Pictured on the left: of SE 39th & SE Clinton, Portland, Oregon (Improving Bicycle Safety, 2007)
Pictured on the right: The Netherlands, bike box with marked turn lanes
Three studies in the UK; Allen, Bygrave et al., Wall, Davies et al., and Wheeler; found bike
boxes/ASLs effective for allowing bicyclists to position themselves in front of stopped vehicles at
signalized intersections. According to Allen et al. and Wall et al., this position reduces conflicts with
turning motorists. Cyclists perceived an increase in visibility and safety. Research in the UK and a
study in Eugene, Oregon, noted problems with vehicle encroachment in bike boxes, but hopefully
signage and education may remedy this issue (as cited in Weigand, 2008, p. 5).
• Bicycle Activated Signals: Scramble Traffic Light and Bicycle Only Signal Phase
VOLATILE ENDEAVORS: NEGOTIATING LEFT TURNS Smith & Vu 11
This treatment stops all motor vehicle movement at the intersection, provides an exclusive phase for
bikes and pedestrians, and eliminates two-stage crossings (Walker, Tresidder, & Birk, 2009, p. 42 &
48). In Portland, Oregon, Wolfe et al. collected data before and after an intersection was installed
with a bicycle scramble light. Their results indicate the intersection had an increase of bicycle usage
after the treatment was installed. In addition, illegal intersection crossings dropped from 78.1% to
4.2% (as cited in Weigand, 2008, p. 8). In a study conducted in Davis, California, research showed
that integrating a bicycle-only phase into the existing intersection signal minimized conflicts amongst
bicyclists and motor vehicles. In a cost-benefit analysis, the study found that savings in crash
reductions paid for the cost of signal installation (Korve and Niemeir, 2002).
Methods
In order to comprehensively assess the Southeast Hawthorne bike corridor’s adequate facilitation of
left turns onto the Southeast 7th Avenue corridor, and thus determine the need and priority for
additional facilities, this study will analyze three significant indicators:
• Quantitatively evaluated safety of the bicycle left-hand turn maneuver from eastbound
Southeast Hawthorne onto northbound Southeast 7th Ave., including its merge component
(from right-hand bike lane to left lane).
• User comfort and perception of safety in performing this maneuver.
• Demand for additional left-hand turn facilities at this intersection.
The methods described hereafter were chosen to evaluate these indicators by synthesizing objective
data from traffic counts and an inventory of facility characteristics with qualitative data from user
intercept surveys, and supplementing these measures though existing statistical data where
appropriate.

VOLATILE ENDEAVORS: NEGOTIATING LEFT TURNS Smith & Vu 12
Bicyclist Intersection Safety Index: Commonly referred to as “Bike ISI,” this tool consists of a
set of models developed in 2006 by the University of North Carolina’s Pedestrian and Bicycle
Information Center to rate the safety of approach legs and movements through intersections
(Carter, Hunter, Zegeer, Stewart, & Huang, 2006). Using extensively gathered crash data, behavioral
data (conflicts and avoidance maneuvers), and subjective ratings from expert users at 67 sites across
the U.S. (thirteen of which, incidentally, were in Portland), researchers developed a formula that
indexes safety to physical intersection characteristics (Carter et al., 2006). The calculation method for
Bike ISI, utilized in this study for a left turn from the right-hand bike lane of Southeast Hawthorne
onto Southeast 7th Ave., is described in Carter, Hunter, Zegeer, and Stewart’s Pedestrian and Bicyclist
Intersection Safety Indices: User Guide (2007). Inventory of the intersection will be taken from the
following geometric and operational characteristics (brackets indicate corresponding formula input
values):
• Presence of bicycle lane on main street (Hawthorne). [“presence”: 0=no, 1=yes; “absence”: 1=yes, 0=no]
• Average daily traffic volume on main street. [ADT in thousands]
• Number of through vehicle lanes on cross street (7th Ave.). [1, 2…]
• Number of traffic lanes bicyclists must cross to make left turn. [1, 2…]
• Speed limit on main street. [0=less than 35mph, 1=greater than or equal to 35mph]
• Presence of on-street parking on main street approach. [0=no, 1=yes]
• Presence of traffic signal at intersection. [0=no, 1=yes]
These data will then be plugged into the following formula:
Bike ISI = 1.100 + 0.025(main street ADT) + 0.836(bike lane presence) + 0.485(traffic signal presence) + 0.736(main street speed limit * bike lane presence) + 0.380(# of traffic lanes to cross * bike lane absence) + 0.200(on-street parking)
The calculated index value will occur on a range between 1 and 6, with 1 representing a relatively
safe intersection and 6 an unsafe intersection.

VOLATILE ENDEAVORS: NEGOTIATING LEFT TURNS Smith & Vu 13
Bike ISI was chosen for this study as a quantitative measure of safety due in large part to its
unique ability to evaluate a specific approach and turn maneuver at a given intersection. Though
previously developed methodologies do exist for measuring the “bicycle friendliness” of a given
street or intersection (e.g. Bicycle Compatibility Index, Bicycle Level of Service), these all assume a
continuous and straight line of bicycle travel, with no specific attention given to approaches or turns
(Carter et al., 2006). Additionally, Bike ISI is the only model that incorporates crash data or
behavioral data into its calculations, significantly increasing its objectivity and accuracy in measuring
true safety. Though it possesses great advantages over other models of bicycle compatibility with
respect to this study, Bike ISI was developed primarily as a comparative tool for ranking an
intersection’s relative safety against others across a city (Carter et al., 2006). Applied only to an
isolated location, the index value loses its local comparative significance and therefore becomes
more abstract in its indication of favorability. However, Carter et al. surveyed an intentionally
diverse array of sites in their pilot study (2006), so its results should form a useful baseline for
general comparison. The results of that study were categorized for comparison according to right-
turn, left-turn, and straight-through movements. The ratings for right turn and straight-through
movements were clustered at the lower end of the scale in a tighter distribution than left turns,
which were grouped in the middle of the scale across a wider range, indicating a lower average level
of safety but greater variation between sites (Carter et al., 2006).
Demand for additional left-turn facilities at Southeast 7th Ave. will be estimated through a
combination of user preference survey and manual user counts along existing facilities. The user
count portion will quantify the number of cyclists currently performing a left turn at 7th Ave. and at
relatively interchangeable locations nearby. The likelihood of these other cyclists to use 7th Ave.
after a left-turn-friendly redesign at its intersection with Hawthorne will be demonstrated in the
responses of survey participants from that group when asked whether they would modify their route

VOLATILE ENDEAVORS: NEGOTIATING LEFT TURNS Smith & Vu 14
to use 7th Ave. given such a redesign. A resulting estimation of demand emerges when these survey
responses are viewed in proportion to the number of cyclists observed turning after 7th. The
integration of observed data with user preference survey results is recognized in the Federal
Highway Administration’s Guidebook on Methods to Estimate Non-Motorized Travel: Overview of Methods
(1999) as significantly advantageous for predicting user behavior.
User Counts: A team of two data collectors will be stationed at the northeast corner of 9th and
Hawthorne, one facing westward and the other facing eastward. Each data collector will be given a
bicycle count form to record his or her observations (Appendix A). The westward-facing observer
will tally (by street) each left-turning bicyclist as they cross the observer’s sidewalk line of sight on
7th, 8th, and 9th Avenues. The eastward-facing observer will do the same for bicyclists turning left
onto 10th and 12th Avenues (11th being a one-way southbound). These observation points are
uniquely effective due to their relative lack of interference from car traffic (scanning across a
sidewalk as opposed to a street), and also to the fact that the heaviest bike traffic occurs on the street
furthest from the observer, maintaining a line of vision well-suited to the observation of multiple
streets. Three separate two-hour counts will be conducted during afternoon peak hours (4-6pm) on
a Tuesday, Wednesday, or Thursday, as these days are not shown to be statistically unique from one
another (Alta, 2009).
A number of logical assumptions constitute the rationale for the user count site selections.
Southeast 7th Ave. is the only designated north-south bike route intersecting the Hawthorne bike
route east of the bridge. Given that the intersection of these two streets is an acknowledged point of
difficulty for cyclist navigation (Portland Office of Transportation, 2007), and that the eastbound
Hawthorne bike corridor ends at 12th Ave., it stands to reason that cyclists encountering difficulty
with the left turn at 7th would likely turn instead at 8th, 9th, 10th, or 12th. It is also likely that a
significant number of Group A cyclists continuing their northward journey on 12th Ave. prefer this

VOLATILE ENDEAVORS: NEGOTIATING LEFT TURNS Smith & Vu 15
route, given its status as an arterial, but the allowance of five additional blocks for merging left may
play a role in that decision. Manual user counts are a more sensible option for this study than
automated counts due to their higher level of accuracy and lower cost (Schneider, Patten, and Toole,
2005). The labor intensity of manual user counts can be a drawback in situations involving
numerous count locations, but this study’s need for only two observers working only three hours
each does not raise that concern.
The City of Portland conducts annual bicycle counts throughout the city and publishes their
aggregated results each year, along with a summary discussion of notable trends. Their counts are
performed by 24-hour automated means in some locations and manually using peak flow
extrapolation at many others, including the four main Willamette River bridges (Portland Bicycle
Counts, 2007). Their 2007 study utilized 60 volunteers to conduct 93 counts across the city, among
98 sites selected. With a scope this broad, they were able to analyze detailed bicycle usage trends on
many different scales, from individual intersections to the city on the whole. The 2007 study
concluded that Portland’s bicycle use is increasing rapidly, and doing so at an increasing pace.
User Intercept Survey: The quantitative measures of safety and demand outlined to this point
comprise the important empirical component of this study, but they do not paint a complete picture
without the incorporation of subjective user input. An intercept survey facilitates a targeted
evaluation of users’ perceived comfort and level of safety. Demand for additional facilities can be
gauged more precisely through the directly stated preferences of potential users. For this study a user
intercept study will be conducted among eastbound cyclists at the southeast corner of Southeast 6th
Ave. and Southeast Hawthorne, shortly before they would reach the intersection at Southeast 7th
Ave. In order to maximize the sample of these cyclists, a large sign will be placed in their line of
sight one block west of the survey point (at Southeast Grand Ave. and Southeast Hawthorne) urging
their participation. A second sign will be placed at the location of the survey, in clear view of cyclists
VOLATILE ENDEAVORS: NEGOTIATING LEFT TURNS Smith & Vu 16
approaching in the bike lane. Given that the parallel parking strip between Hawthorne’s bike lane
and south curb does not allow parking on this portion of the block, it makes for a safe, highly
visible, and unobtrusive location for cyclists to dismount before receiving their questionnaires. There
is sufficient space here to accommodate a sizeable number of bicycles, and cyclists can transition to
this spot from the bike lane without facing bus or vehicular conflicts.
The user intercept survey method was selected for this study due to its effectiveness at
isolating and targeting the desired sample. Its time and day of occurrence will mimic that of the user
count in order to maximize the correspondence of their data sets. Depending on the number of
cyclists who choose to participate, attracting a sample size sufficient to achieve a maximum
acceptable sampling error of plus or minus 10% with a 95% confidence level may or may not require
more than one two-hour survey period. Ideally the survey will achieve a much lower sampling error
in one period, but due to the time and weather constraints surrounding this study, conducting the
sample across more than one period could be relatively burdensome. A tightly constrained sampling
error, however, is not necessary to adequately serve this study’s purpose of establishing a general
idea of demand.
An estimated count of daily peak-flow bicycle traffic near the survey location (population
size) will be used to calculate sampling error as represented in Table 8 of the Transportation
Cooperative Research Program’s TCRP Synthesis 63: On-board and Intercept Transit Survey Techniques
(2005). The Portland Department of Transportation recently observed a summer average of 7,379
bicycles per day on the Hawthorne bridge. Multiplying this count by a factor of 0.2 generally yields
an accurate 4-6pm peak-flow number (Geller, 2008), most of whom are presumably traveling east
and therefore exiting the bridge into our survey area. Certainly an unknown portion the bicyclists in
that count are traveling west, but this will only cause the actual sampling error to be lower than
calculated. The peak-flow number will be multiplied again by a factor of 0.5 to approximate the

VOLATILE ENDEAVORS: NEGOTIATING LEFT TURNS Smith & Vu 17
difference between a summer bicycle count and a winter count (Geller, 2009), assuming ridership
levels on the survey date in November are similar to those during the winter. The high population
number generated by not excluding westbound cyclists will be offset to some degree if the number
of cyclists on the date of the survey is greater than that of an average day during the winter. By the
calculation method described here, the population size for the survey is estimated at 738.
Though effective in its ability to target a specific group of users for detailed questioning, the
principle weaknesses of the user intercept survey as it pertains to this study lie in the time and labor
intensity required to gather sufficiently accurate data, and the difficulty in estimating an accurate
population size from which to calculate sampling error.
In April 2006 a study seeking to understand cyclist use of off-road paths was undertaken in
Melbourne, Australia, taking the form of an intercept survey coupled with a postage-paid self-
completion questionnaire (Rose, 2007). Systematic sampling was used to select one out of every four
counted cyclists for an intercept interview, in which they were asked to answer a few brief questions
and given the take-home questionnaire to be returned via mail. In the end only one in seven actually
completed the interview process, but of these an impressive 77% completed and mailed back the
questionnaire. A detailed set of statistics on off-road trail use was gleaned from the survey’s

VOLATILE ENDEAVORS: NEGOTIATING LEFT TURNS Smith & Vu 18
respondents, 85% of whom were commuters. The take-home-and-return questionnaire was
demonstrated here as a potentially effective way to augment the data gathered in an intercept survey.
The methodology outlined in this study for examining the question “Is there a need for
additional bicycle left-turn facilities at Southeast Hawthorne Blvd. and Southeast 7th Ave.?” matches
a pertinent selection of variables to a balanced set of established measurement techniques. A
synthesis of the resulting data will provide an appropriate indicator for evaluating this question.
Results and Interpretations
The data of primary interest in this study were gathered from the user intercept survey and are
augmented by the manual user counts and Bicyclist Intersection Safety Index. The user intercept
survey was conducted during the afternoon peak period of 4-6pm on two consecutive days, both
during relatively cold and overcast weather conditions. Daylight was present only during the first 30-
40 minutes of the survey period. Responses were collected from a total of 118 bicyclists out of the
estimated population size of 738, yielding a sampling error of ±8.3% at a 95% confidence level
(assuming a 50% sample proportion). Respondents were asked eleven questions, three regarding
bicycle usage characteristics, four regarding perception of safety and merge behavior in the study’s
location of interest, two determining the bicyclist’s current trip characteristics, and two regarding
attitudes toward a redesign of the intersection of Southeast 7th Ave. and Southeast Hawthorne. Five
of these questions were directed only at bicyclists turning left on their current trip, yet many others
still responded to them. Due to the questions of consistency that this raised, these responses were
removed from consideration.