volcanic fatalities database: analysis of volcanic threat
TRANSCRIPT
Brown, S., Jenkins, S., Sparks, S., Odbert, H., & Auker, M. (2017).Volcanic fatalities database: analysis of volcanic threat with distanceand victim classification. Journal of Applied Volcanology, 6(1), [15].https://doi.org/10.1186/s13617-017-0067-4
Publisher's PDF, also known as Version of recordLicense (if available):CC BYLink to published version (if available):10.1186/s13617-017-0067-4
Link to publication record in Explore Bristol ResearchPDF-document
This is the final published version of the article (version of record). It first appeared online via SpringerOpen athttps://appliedvolc.springeropen.com/articles/10.1186/s13617-017-0067-4. Please refer to any applicable termsof use of the publisher.
University of Bristol - Explore Bristol ResearchGeneral rights
This document is made available in accordance with publisher policies. Please cite only thepublished version using the reference above. Full terms of use are available:http://www.bristol.ac.uk/red/research-policy/pure/user-guides/ebr-terms/

DATABASE Open Access
Volcanic fatalities database: analysis ofvolcanic threat with distance and victimclassificationSarah K. Brown1*, Susanna F. Jenkins1,2, R. Stephen J. Sparks1, Henry Odbert1 and Melanie R. Auker1
Abstract
Volcanoes can produce far-reaching hazards that extend distances of tens or hundreds of kilometres in large eruptions,or in certain conditions for smaller eruptions. About a tenth of the world’s population lives within the potentialfootprint of volcanic hazards and lives are regularly lost through volcanic activity: volcanic fatalities were recordedin 18 of the last 20 years. This paper identifies the distance and distribution of fatalities around volcanoes and theactivities of the victims at the time of impact, sourced from an extensive search of academic and grey literature,including media and official reports. We update and expand a volcano fatality database to include all data from1500 AD to 2017. This database contains 635 records of 278,368 fatalities. Each record contains information onthe number of fatalities, fatal cause, incident date and the fatality location in terms of distance from the volcano.Distance data were previously available in just 5% of fatal incidents: these data have been significantly increasedto 72% (456/635) of fatal incidents, with fatalities recorded from inside the crater to more than 100 km from thesummit. Local residents are the most frequently killed, but tourists, volcanologists and members of the media arealso identified as common victims. These latter groups and residents of small islands dominate the proximalfatality record up to 5 km from the volcano. Though normally accounting for small numbers of fatalities, ballisticsare the most common cause of fatal incidents at this distance. Pyroclastic density currents are the dominant fatalcause at 5 to 15 km. Lahars, tsunami and tephra dominate the record after about 15 km. The new location dataare used to characterise volcanic threat with distance, as a function of eruption size and hazard type, and tounderstand how certain activities increase exposure and the likelihood of death. These findings support assessment ofvolcanic threat, population exposure and vulnerabilities related to occupation or activity.
Keywords: Volcanic hazards, Fatalities, Distance, Threat to life, Database
IntroductionVolcanic eruptions can cause loss of life and livelihoodsand result in major societal and economic disruption.There are 1508 active volcanoes: that is those with activ-ity suspected or confirmed during the last 10,000 years(Volcanoes of the World 4.5.3 downloaded 19/12/16,Global Volcanism Program, 2013: hereafter referred toas VOTW4.5.3 (GVP, 2013)). They are located in 86countries and additional territories worldwide (Brown etal. 2015a). Eruptions have the potential for causingregional and global effects, although the relative
infrequency of large eruptions (Volcanic ExplosivityIndex (VEI) ≥4) compared with small eruptions (VEI ≤3)means that effects are mostly local (to tens of kilo-metres). Over 29 million people worldwide live withinjust 10 km of active volcanoes, and around 800 millionpeople live within 100 km (Brown et al. 2015b), a dis-tance within which there is potential for devastating vol-canic hazards at some volcanoes.Understanding how volcanic threat varies with distance
from the volcano and which groups of people are affectedmost can contribute to risk reduction by providing empir-ical data on which to forecast impacts or supportevidence-based eruption planning and preparedness.Threat to life is influenced by distribution of both popula-tion and the footprint of volcanic products. We
* Correspondence: [email protected] of Earth Sciences, University of Bristol, Wills Memorial Building,Queen’s Road, Bristol BS8 1RJ, UKFull list of author information is available at the end of the article
© The Author(s). 2017 Open Access This article is distributed under the terms of the Creative Commons Attribution 4.0International License (http://creativecommons.org/licenses/by/4.0/), which permits unrestricted use, distribution, andreproduction in any medium, provided you give appropriate credit to the original author(s) and the source, provide a link tothe Creative Commons license, and indicate if changes were made.
Brown et al. Journal of Applied Volcanology (2017) 6:15 DOI 10.1186/s13617-017-0067-4
distinguish ‘threat’ from ‘risk’, as the latter incorporates anunderstanding of the vulnerabilities of the communities,and probabilities associated with the hazard, which is be-yond the scope of this paper.Research into volcanic fatalities has focussed on statis-
tical analysis of the numbers of fatalities over time, byhazard and eruption size. Auker et al. (2013) built onearlier work to develop a fatalities database, combiningdata from the Smithsonian Institution’s Global Volcan-ism Program (GVP), Witham et al. (2005), CRED EM-DAT and Munich Re. Their database contains brief de-scriptions of fatal incidents, but does not normally givetheir location.In this paper we identify the distance at which fatal-
ities occurred from volcanoes, discriminating betweendifferent hazards. We also classify the victims wherepossible, identifying their activity or occupation that leadto their presence in hazardous zones. These data aresourced from academic literature, media and official re-ports. We distinguish and discuss both eruptive andnon-eruptive fatalities, with hazards being present evenwhen a volcano is in quiescence. This new fatalities datacan be used to better understand volcanic threat withdistance, eruption size and hazard type, and has applica-tion in calculation of population exposure, vulnerabilitiesand risk.
Methods: Updating the fatalities database anddetermining fatal incident distanceThe fatalities database of Auker et al. (2013) containsfatal incidents from 1600 AD and provides brief incidentdescriptions, eruption start date and VEI, the number offatalities and fatal cause. This database has been updatedand refined to include additional data and updated ornew information on fatal cause, number of fatalities, thefatal incident occurrence date, descriptive details and allfatal incidents to July 2017. Here, we add a new datasetidentifying the location and distance of fatalities.The updated fatalities database is provided as Add-
itional file 1. Google Earth placemarks have been addedto show fatal incident locations, enabling the provisionof a downloadable dataset containing latitude and longi-tude (Additional file 2).In the following sections we introduce fatal causes, de-
scribe the identification of distance, and discuss datalimitations.
Fatal causesVolcanoes can produce a number of potentially lethalhazards (Baxter, 1990), referred to here as the fatalcause. Baxter (1990) described common physiologicalcauses of death due to volcanic hazards. However, med-ical cause of death is rarely identified in available
records, so it is the hazard itself that is linked to the fa-tality. Fatal cause categories are now described below.Pyroclastic density currents (PDCs: inclusive of pyro-
clastic flows, surges and blasts): PDCs can reach dis-tances of several kilometres and tens of kilometres inlarge explosive eruptions (Walker, 1983). In general,PDCs move too quickly for people to escape and deathis almost certain for those caught by a PDC. Baxter(1990) identified dead:injured ratios as high as 230:1.Deaths commonly result from thermal injury (includinglaryngeal and pulmonary oedema), asphyxiation and im-pact or blast trauma (Baxter, 1990).Tsunamis: These can result from the rapid entrance of
debris avalanches, PDCs or other volcanic products intoa water body, earthquakes accompanying eruptions, sub-marine eruptions, caldera collapse, or even volcanicshock waves (Latter, 1981). Tsunamis can devastate dis-tant shorelines and wash kilometres inland.Lahars: Lahars (volcanic mudflows) can extend tens to
hundreds of kilometres (Waythomas, 2014). Death andinjury typically result from trauma or asphyxiation(drowning). Lahars can be hot enough to cause burns(Baxter, 1990) and can occur years after an eruption assecondary lahars.Tephra: Tephra can be transported and deposited hun-
dreds, or even thousands, of kilometres from the vol-cano. Deaths typically occur in proximal areas of thickdeposition, through roof collapse, asphyxiation and bur-ial (Spence et al. 2005). Airborne ash can aggravate pul-monary conditions such as asthma (Horwell and Baxter,2006).Ballistics: Ballistics (large ejected clasts of a few cm
size or above) are typically restricted to within 5 km ofthe vent (Blong, 1984) and deaths and injuries are typic-ally due to trauma from direct impacts.Avalanche (inclusive of debris avalanches, sector col-
lapse and landslides): These result from the collapse ofunstable edifices due to seismicity, eruption or intenserainfall. Avalanches discharging into lakes or oceans cangenerate tsunamis; resultant fatalities are classified undertsunami.Lava flows: Lavas normally advance slowly, allowing
escape, but sudden outbursts of very fluid lavas cancause loss of life (Baxter et al. 1982). Deaths and injuriestypically arise if escape routes are cut off, or as small ex-plosions occur through interaction with water, vegeta-tion or fuel.Gas: Various gases are emitted at volcanoes during or
between eruptions, including gases that can be harmfulto health (e.g. carbon dioxide, hydrogen sulphide,sulphur dioxide, hydrogen chloride, hydrogen fluoride,carbon monoxide) (Hansell and Oppenheimer, 2004).Gases released from volcanic systems between eruptionsare hereafter called quiescent gas.
Brown et al. Journal of Applied Volcanology (2017) 6:15 Page 2 of 20
Lightning: Volcanic lightning is a common feature ofvolcanic ash clouds, especially in larger explosive erup-tions (McNutt and Williams, 2010).We also use Multiple where fatalities are attributed to
more than one cause and Uncertain when the cause isnot known.Indirect fatalities include accidents, for example re-
lated to evacuation or unsafe driving conditions, heartattacks and cascading hazards such as famine and dis-ease. Indirect deaths can occur over great distances andover considerable time periods after an eruption. Thedistance involved in indirect fatalities, such as victims offamine, is not easily quantifiable. Indirect deaths candwarf the numbers of direct deaths. For example, the1815 VEI 7 eruption of Tambora, Indonesia, resulted inabout 12,000 deaths through direct hazards includingPDCs, tephra fall and tsunamis during the short-livedcataclysmic stage of the eruption (Oppenheimer, 2003,and references therein). These fatalities occurred on theSanggar peninsula of Sumbawa at distances up to about40 km. Following the eruption an estimated further49,000 fatalities occurred throughout Sumbawa, Lombokand surrounding islands through the indirect causes offamine and disease; widespread crop failure and faminewas also reported across Europe, North America andAsia (Oppenheimer, 2003).Fatalities associated with seismicity are recorded, but it
is difficult to distinguish between volcanic and tectonicseismicity-related deaths in the literature. Thus, both in-direct and seismicity-related fatalities are excluded fromanalysis of fatalities and fatal incidents with distance,though are discussed in Fatalities during quiescence andVictim classification.
Determining the dates and distance of fatal incidents andfatalitiesThe fatality database records eruption dates (i.e. startdate of eruption as per GVP, 2013). This is not alwaysthe same as the date of the fatal incident within aneruption. Incident dates aid identification of specific in-cidents and help to avoid duplication. These dates cancommonly be obtained from activity bulletins. As an ex-ample, during the 1968–2010 eruption of Arenal, CostaRica, SEAN Bulletin 13:07 07/1988 (GVP, 1988) states:“On 6 July, a climber died near Arenal's crater rim afterbeing struck in the head by tephra. The victim and acompanion had approached to ~3 m from the crater rimwhen the explosion occurred”.Unless eruptive activity is typically located in fissure
zones or volcanic fields, evacuations and eruption plan-ning commonly focus on the summit of the volcano, andexisting population exposure assessment methods are typ-ically centred on the summit. Hence, despite recognisingthat some hazards originate in areas distal to this (effusive
flank vents for example), here the volcano to fatal incidentdistance is measured from the summit.Deaths are commonly reported in particular towns or
villages, or with relation to the summit or crater. Wedetermine the approximate distances at which fatalitiesoccurred relative to the volcano summit, through combin-ation of these descriptions with additional literature, in-cluding from volcano activity bulletins, online news andacademic articles. Judgement is required to interpretqualitative descriptions, as described below.The location is commonly linked to features of the
volcano and described as ‘at the summit’, ‘near the crater’,or ‘at the crater rim’. Although a precise distance is un-known, the location can be quite well constrained and isrecorded as <1 km in the database. An example is the1930 eruption of Asamayama, Japan, where the JapanMeteorological Agency (JMA) Fatality Database con-firms the proximity to the crater and fatal cause: “Vol-canic block: August 20, 1930: 6 people were killed nearthe crater”, with further confirmation in the NationalCatalogue of the Active Volcanoes of Japan (NCAVJ),4th Edition.Fatalities are commonly described on the cone or dur-
ing climbs to the summit. In these cases the location isassumed to be on the upper cone. A distance range isapproximated based on the radius of this upper cone es-timated using Google Earth. An example is the 1992eruption of Marapi, Indonesia, when “Bombs killed oneperson, seriously injured three, and caused minor injuriesto two others. The victims had climbed to the summitwithout consultation with the Mt. Marapi Volcano Ob-servatory or local authorities, although a hazard warninghad been in effect since 1987.” (GVP, 1992a, b). Marapi’sactive cone is about 10 km diameter (5 km radius centreto cone base), with a distinct treeline-upper cone bound-ary of <2 km diameter. The description thus suggeststhat the victim was possibly within 1 km, but certainlywithin 5 km and it is recorded as <5 km in the database.The town in which deaths occurred is sometimes re-
corded. When the town is named the approximate towncentre or Google Earth marker is used to determine thedistance. Minimum and maximum distances are alsoprovided for the town limits. Literature about the vol-canic activity and online maps and images help to iden-tify town location. An example is the 1996 eruption ofManam, Papua New Guinea: “The paroxysm accountedfor 13 deaths in a coastal village called Budua Old nearSW Valley” (GVP, 1996). Although this village cannot belocated in Google Earth, a map locating the valley allowsthe approximate location to be defined, and distancecalculated (~5 km).Manam also illustrates the use of island size to constrain
the maximum distance within which fatalities occurred.The island is at most 11 km across, with an approximately
Brown et al. Journal of Applied Volcanology (2017) 6:15 Page 3 of 20
central volcanic peak. The maximum distance from thecentre to the coast on any flank is about 6 km.Other literature can identify the extent of the fatal
cause and identify a distance range. For example, deathsare described through pyroclastic flows in the 1913eruption of Colima, Mexico. Here, the maximum dis-tance can be constrained to within 8 km, from mappingof ash flow deposits by Luhr and Carmichael (1980).
Data limitations and uncertaintiesWe consider both fatal incidents (an event with fatalities)and fatalities (number of victims). A single eruption canhave multiple fatal incidents and can include fatalities at arange of distances from a range of fatal causes. Fatalitiesare recorded as separate incidents when: (1) they are dueto different fatal causes; (2) they occurred at differenttimes. Fatalities are recorded as single incidents with sub-incidents when they are due to the same fatal cause at arange of distances. For example, the 57 direct fatalities atSt. Helens, USA in 1980 can be considered as one incident.However, we separate these into sub-incidents as we rec-ord 26 separate distances where the fatality locations couldbe identified from the literature (e.g. Eisele et al. 1981). Toaverage the distances in such an incident would not be ap-propriate, therefore individual distances are recorded andcan be counted in multiple distance bins in analysis.The database is prone to errors related to incorrect or
unreliable reporting. Multiple information sources andspecifics such as incident date or victim details are usedwherever possible to improve reliability. Ultimately,judgement is applied about whether a report is reliable
enough to include. A quality level index is introduced toevaluate data reliability (Table 1).Fatal incidents recorded at specific distances are consid-
ered data quality level 1 (QL 1), such as those mappedprecisely in the St. Helens eruption. Where the fatal inci-dent cannot be restricted to an exact distance, a distancerange is identified (QL 2). For example, about 3000 fatal-ities occurred in the 1951 eruption of Lamington, PapuaNew Guinea, when PDCs devastated the volcano’s northflank to a distance of up to 13 km (Gorshkov, 1963). Themajority of destroyed villages were at approximately 5 to10 km (Taylor, 1958). The distribution of fatalities betweenvillages is unknown, thus all fatalities are recorded as oneincident at <13 km. QL 3 data have no distance informa-tion available.QL 1 and 2 data are combined in our analysis. The max-
imum distance recorded in QL 2 incidents is used as thisrepresents a conservative estimation of threat. If the QL 2midpoint was used then this could underestimate thereach of the hazard. For example in the case of the 1951eruption of Lamington, a midpoint of 6.5 km would notadequately represent the distribution of fatalities, whichdominantly occurred at distances greater than this.Distances of fatal incidents can be used to characterise
distribution of threat with distance from a volcano andto understand the hazardous extent of different volcanicphenomena. The former requires measurement from thesummit, while the latter requires measurement from theactive vent, noting the occurrence of satellite vents.However, the location of the active vent is not always re-corded. Many hazard, exposure and risk assessments
Table 1 Assessing uncertainty in the determination of location of fatal incidents
Data QualityLevel (QL)
Conditions Distance data Percentage ofdatabase records
1 Location of the fatality is identified- Distance of fatality is given in literature- Position of fatality relative to eruptive crater (e.g. ‘craterrim’, ‘near crater’, ‘at summit’)
- Town/village is identified and located- Precise location is known- Small distance range is accurately identified (mid-pointused). This also applies to towns where the centre isused and outskirts represent uncertainty
Distance of fatality is precisely identified(e.g. 350 m, 7.2 km, 12 km, 400–600 m)
34%
2 Distance within which the fatality occurred is constrained by:- Size of cone (e.g. fatality described as on cone: radius takenfor upper cone from summit to clear change in slope usingelevation profile tool in Google Earth)
- Extent of the lethal flow as given in literature or identifiedon Google Earth (n.b. distance is measured from the distalflow end to the summit)
- The maximum distance from the summit crater to the coast(normally applicable to island volcanoes)
- The destructive radius/distance as described in literature(e.g. blast zones, PDC extents)
- Town is named or described but not precisely located
A distance range within which the fatalityoccurred is identified (e.g. <5 km, 8–14 km).The maximum distance vis used for analysis.
40%
3 No information is provided on fatality location and nonecan be inferred from the description or edifice/island size
Distance is unknown 26%
Brown et al. Journal of Applied Volcanology (2017) 6:15 Page 4 of 20
consider distance rings around a central volcano (e.g.Ewert and Harpel, 2004; Aspinall et al. 2011; Brown etal. 2015b). Our analyses use distance measured from thesummit, unless stated otherwise.In calderas or volcanic fields lacking a central edifice,
measurement is from fatal incident to the volcano coor-dinates in Google Earth from GVP (2013). These mea-surements therefore have larger uncertainties than forstratovolcanoes.The database uses the same enumeration method of
Auker et al. (2013) and Simkin et al. (2001) where quali-tative statements regarding the number of fatalities aregiven numeric values to permit analysis (Table 2).
ResultsThe updated fatalities database contains 635 records and278,368 fatalities recorded since 1500 AD through anyfatal cause. These records comprise 581 incidents, 19 ofwhich are further subdivided into 73 sub-incidents,where fatalities are identified at multiple distances. Sub-incidents are hereafter combined under incidents foranalysis. Of the total, 64 incidents and 61,612 fatalitiesare due to indirect fatal causes or seismicity: these areexcluded and discussed separately in our analysis.The difference in number of incidents and fatalities
compared with Auker et al. (2013) arises from the up-dates to the data, which included both addition and re-moval of fatal events and adjustments to the number offatalities recorded in some incidents.Fatalities are recorded at 194 volcanoes in 38 countries
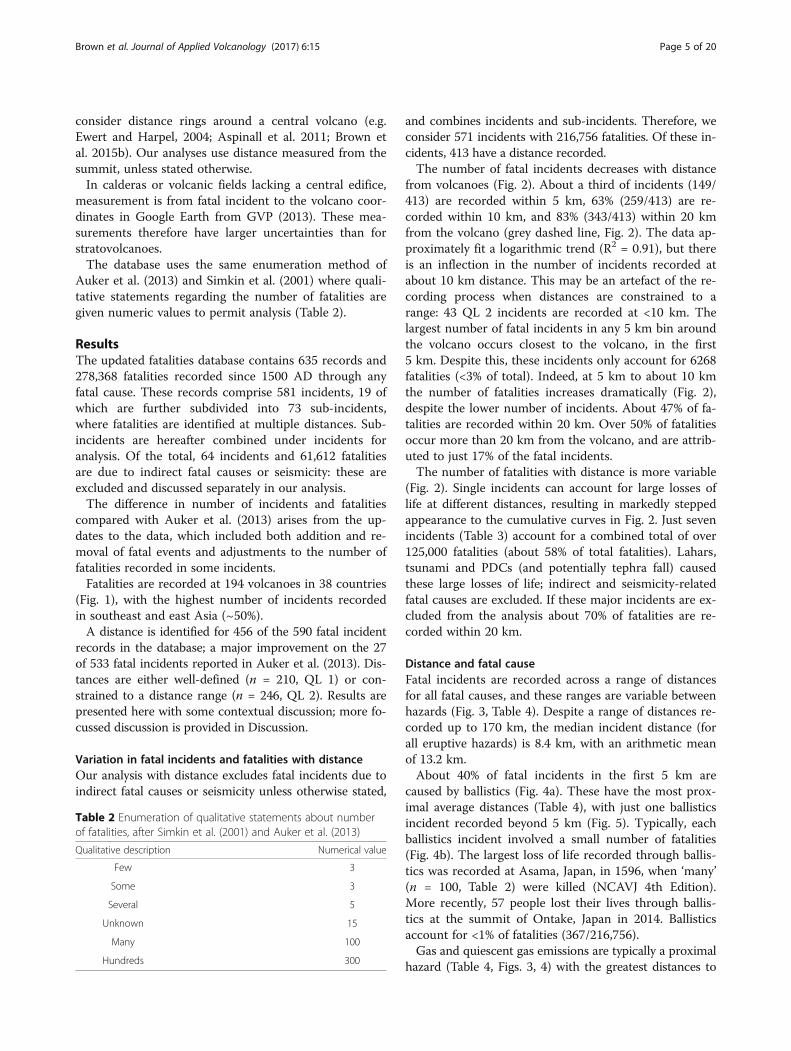
(Fig. 1), with the highest number of incidents recordedin southeast and east Asia (~50%).A distance is identified for 456 of the 590 fatal incident
records in the database; a major improvement on the 27of 533 fatal incidents reported in Auker et al. (2013). Dis-tances are either well-defined (n = 210, QL 1) or con-strained to a distance range (n = 246, QL 2). Results arepresented here with some contextual discussion; more fo-cussed discussion is provided in Discussion.
Variation in fatal incidents and fatalities with distanceOur analysis with distance excludes fatal incidents due toindirect fatal causes or seismicity unless otherwise stated,
and combines incidents and sub-incidents. Therefore, weconsider 571 incidents with 216,756 fatalities. Of these in-cidents, 413 have a distance recorded.The number of fatal incidents decreases with distance
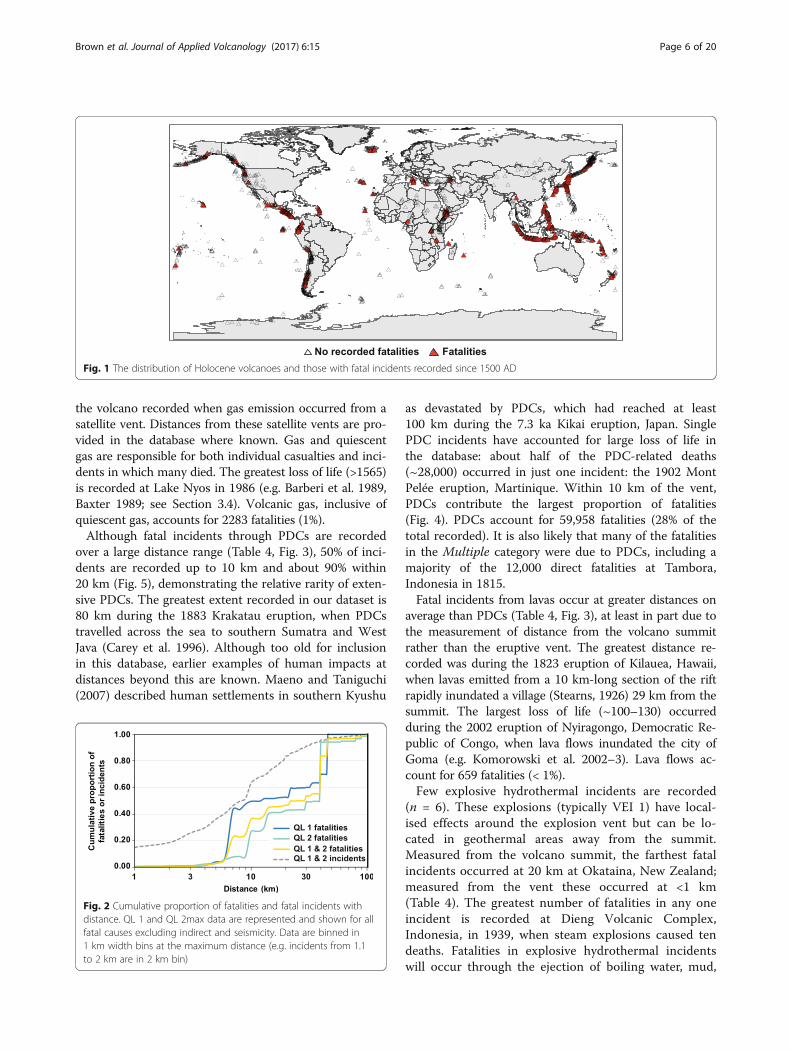
from volcanoes (Fig. 2). About a third of incidents (149/413) are recorded within 5 km, 63% (259/413) are re-corded within 10 km, and 83% (343/413) within 20 kmfrom the volcano (grey dashed line, Fig. 2). The data ap-proximately fit a logarithmic trend (R2 = 0.91), but thereis an inflection in the number of incidents recorded atabout 10 km distance. This may be an artefact of the re-cording process when distances are constrained to arange: 43 QL 2 incidents are recorded at <10 km. Thelargest number of fatal incidents in any 5 km bin aroundthe volcano occurs closest to the volcano, in the first5 km. Despite this, these incidents only account for 6268fatalities (<3% of total). Indeed, at 5 km to about 10 kmthe number of fatalities increases dramatically (Fig. 2),despite the lower number of incidents. About 47% of fa-talities are recorded within 20 km. Over 50% of fatalitiesoccur more than 20 km from the volcano, and are attrib-uted to just 17% of the fatal incidents.The number of fatalities with distance is more variable
(Fig. 2). Single incidents can account for large losses oflife at different distances, resulting in markedly steppedappearance to the cumulative curves in Fig. 2. Just sevenincidents (Table 3) account for a combined total of over125,000 fatalities (about 58% of total fatalities). Lahars,tsunami and PDCs (and potentially tephra fall) causedthese large losses of life; indirect and seismicity-relatedfatal causes are excluded. If these major incidents are ex-cluded from the analysis about 70% of fatalities are re-corded within 20 km.
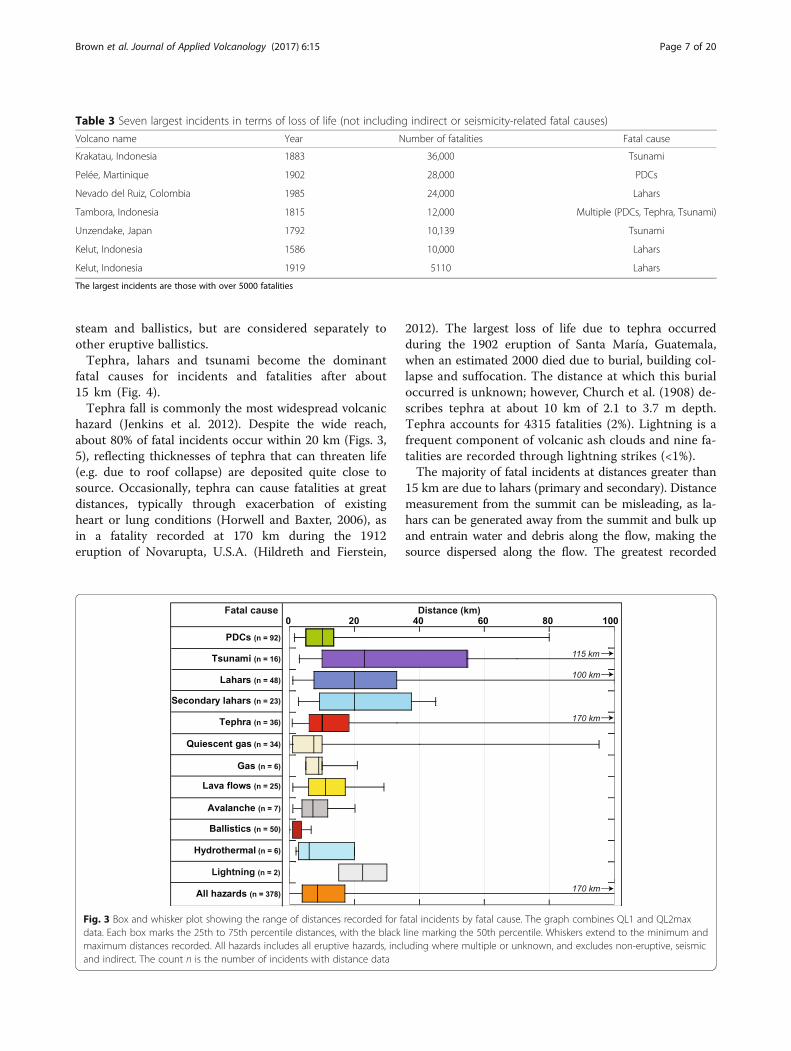
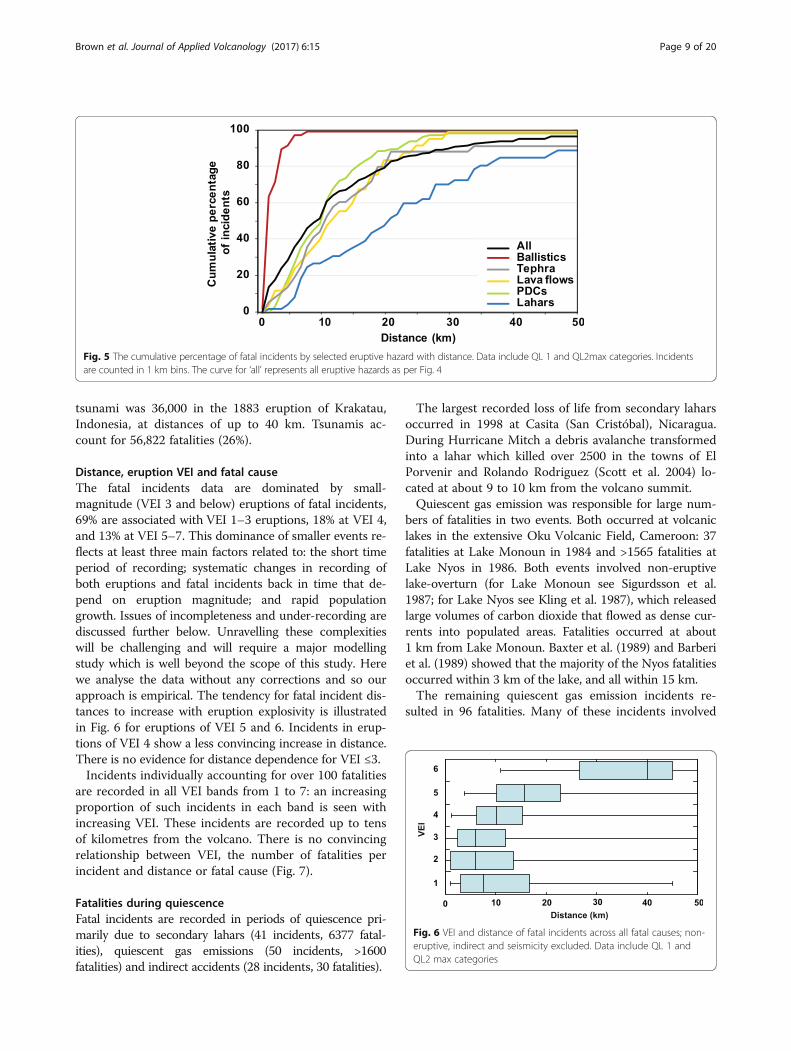
Distance and fatal causeFatal incidents are recorded across a range of distancesfor all fatal causes, and these ranges are variable betweenhazards (Fig. 3, Table 4). Despite a range of distances re-corded up to 170 km, the median incident distance (forall eruptive hazards) is 8.4 km, with an arithmetic meanof 13.2 km.About 40% of fatal incidents in the first 5 km are
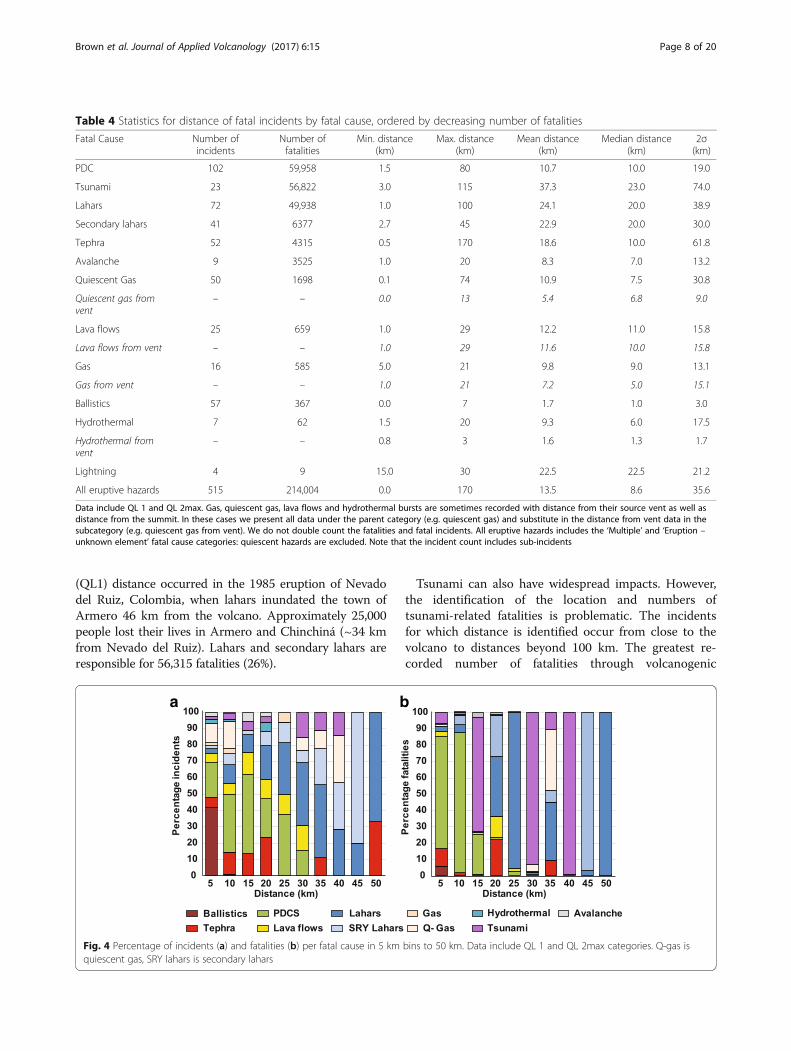
caused by ballistics (Fig. 4a). These have the most prox-imal average distances (Table 4), with just one ballisticsincident recorded beyond 5 km (Fig. 5). Typically, eachballistics incident involved a small number of fatalities(Fig. 4b). The largest loss of life recorded through ballis-tics was recorded at Asama, Japan, in 1596, when ‘many’(n = 100, Table 2) were killed (NCAVJ 4th Edition).More recently, 57 people lost their lives through ballis-tics at the summit of Ontake, Japan in 2014. Ballisticsaccount for <1% of fatalities (367/216,756).Gas and quiescent gas emissions are typically a proximal
hazard (Table 4, Figs. 3, 4) with the greatest distances to
Table 2 Enumeration of qualitative statements about numberof fatalities, after Simkin et al. (2001) and Auker et al. (2013)
Qualitative description Numerical value
Few 3
Some 3
Several 5
Unknown 15
Many 100
Hundreds 300
Brown et al. Journal of Applied Volcanology (2017) 6:15 Page 5 of 20
the volcano recorded when gas emission occurred from asatellite vent. Distances from these satellite vents are pro-vided in the database where known. Gas and quiescentgas are responsible for both individual casualties and inci-dents in which many died. The greatest loss of life (>1565)is recorded at Lake Nyos in 1986 (e.g. Barberi et al. 1989,Baxter 1989; see Section 3.4). Volcanic gas, inclusive ofquiescent gas, accounts for 2283 fatalities (1%).Although fatal incidents through PDCs are recorded
over a large distance range (Table 4, Fig. 3), 50% of inci-dents are recorded up to 10 km and about 90% within20 km (Fig. 5), demonstrating the relative rarity of exten-sive PDCs. The greatest extent recorded in our dataset is80 km during the 1883 Krakatau eruption, when PDCstravelled across the sea to southern Sumatra and WestJava (Carey et al. 1996). Although too old for inclusionin this database, earlier examples of human impacts atdistances beyond this are known. Maeno and Taniguchi(2007) described human settlements in southern Kyushu
as devastated by PDCs, which had reached at least100 km during the 7.3 ka Kikai eruption, Japan. SinglePDC incidents have accounted for large loss of life inthe database: about half of the PDC-related deaths(~28,000) occurred in just one incident: the 1902 MontPelée eruption, Martinique. Within 10 km of the vent,PDCs contribute the largest proportion of fatalities(Fig. 4). PDCs account for 59,958 fatalities (28% of thetotal recorded). It is also likely that many of the fatalitiesin the Multiple category were due to PDCs, including amajority of the 12,000 direct fatalities at Tambora,Indonesia in 1815.Fatal incidents from lavas occur at greater distances on
average than PDCs (Table 4, Fig. 3), at least in part due tothe measurement of distance from the volcano summitrather than the eruptive vent. The greatest distance re-corded was during the 1823 eruption of Kilauea, Hawaii,when lavas emitted from a 10 km-long section of the riftrapidly inundated a village (Stearns, 1926) 29 km from thesummit. The largest loss of life (~100–130) occurredduring the 2002 eruption of Nyiragongo, Democratic Re-public of Congo, when lava flows inundated the city ofGoma (e.g. Komorowski et al. 2002–3). Lava flows ac-count for 659 fatalities (< 1%).Few explosive hydrothermal incidents are recorded
(n = 6). These explosions (typically VEI 1) have local-ised effects around the explosion vent but can be lo-cated in geothermal areas away from the summit.Measured from the volcano summit, the farthest fatalincidents occurred at 20 km at Okataina, New Zealand;measured from the vent these occurred at <1 km(Table 4). The greatest number of fatalities in any oneincident is recorded at Dieng Volcanic Complex,Indonesia, in 1939, when steam explosions caused tendeaths. Fatalities in explosive hydrothermal incidentswill occur through the ejection of boiling water, mud,
Fig. 1 The distribution of Holocene volcanoes and those with fatal incidents recorded since 1500 AD
Fig. 2 Cumulative proportion of fatalities and fatal incidents withdistance. QL 1 and QL 2max data are represented and shown for allfatal causes excluding indirect and seismicity. Data are binned in1 km width bins at the maximum distance (e.g. incidents from 1.1to 2 km are in 2 km bin)
Brown et al. Journal of Applied Volcanology (2017) 6:15 Page 6 of 20
steam and ballistics, but are considered separately toother eruptive ballistics.Tephra, lahars and tsunami become the dominant
fatal causes for incidents and fatalities after about15 km (Fig. 4).Tephra fall is commonly the most widespread volcanic
hazard (Jenkins et al. 2012). Despite the wide reach,about 80% of fatal incidents occur within 20 km (Figs. 3,5), reflecting thicknesses of tephra that can threaten life(e.g. due to roof collapse) are deposited quite close tosource. Occasionally, tephra can cause fatalities at greatdistances, typically through exacerbation of existingheart or lung conditions (Horwell and Baxter, 2006), asin a fatality recorded at 170 km during the 1912eruption of Novarupta, U.S.A. (Hildreth and Fierstein,
2012). The largest loss of life due to tephra occurredduring the 1902 eruption of Santa María, Guatemala,when an estimated 2000 died due to burial, building col-lapse and suffocation. The distance at which this burialoccurred is unknown; however, Church et al. (1908) de-scribes tephra at about 10 km of 2.1 to 3.7 m depth.Tephra accounts for 4315 fatalities (2%). Lightning is afrequent component of volcanic ash clouds and nine fa-talities are recorded through lightning strikes (<1%).The majority of fatal incidents at distances greater than
15 km are due to lahars (primary and secondary). Distancemeasurement from the summit can be misleading, as la-hars can be generated away from the summit and bulk upand entrain water and debris along the flow, making thesource dispersed along the flow. The greatest recorded
Table 3 Seven largest incidents in terms of loss of life (not including indirect or seismicity-related fatal causes)
Volcano name Year Number of fatalities Fatal cause
Krakatau, Indonesia 1883 36,000 Tsunami
Pelée, Martinique 1902 28,000 PDCs
Nevado del Ruiz, Colombia 1985 24,000 Lahars
Tambora, Indonesia 1815 12,000 Multiple (PDCs, Tephra, Tsunami)
Unzendake, Japan 1792 10,139 Tsunami
Kelut, Indonesia 1586 10,000 Lahars
Kelut, Indonesia 1919 5110 Lahars
The largest incidents are those with over 5000 fatalities
Fig. 3 Box and whisker plot showing the range of distances recorded for fatal incidents by fatal cause. The graph combines QL1 and QL2maxdata. Each box marks the 25th to 75th percentile distances, with the black line marking the 50th percentile. Whiskers extend to the minimum andmaximum distances recorded. All hazards includes all eruptive hazards, including where multiple or unknown, and excludes non-eruptive, seismicand indirect. The count n is the number of incidents with distance data
Brown et al. Journal of Applied Volcanology (2017) 6:15 Page 7 of 20
(QL1) distance occurred in the 1985 eruption of Nevadodel Ruiz, Colombia, when lahars inundated the town ofArmero 46 km from the volcano. Approximately 25,000people lost their lives in Armero and Chinchiná (~34 kmfrom Nevado del Ruiz). Lahars and secondary lahars areresponsible for 56,315 fatalities (26%).
Tsunami can also have widespread impacts. However,the identification of the location and numbers oftsunami-related fatalities is problematic. The incidentsfor which distance is identified occur from close to thevolcano to distances beyond 100 km. The greatest re-corded number of fatalities through volcanogenic
Table 4 Statistics for distance of fatal incidents by fatal cause, ordered by decreasing number of fatalities
Fatal Cause Number ofincidents
Number offatalities
Min. distance(km)
Max. distance(km)
Mean distance(km)
Median distance(km)
2σ(km)
PDC 102 59,958 1.5 80 10.7 10.0 19.0
Tsunami 23 56,822 3.0 115 37.3 23.0 74.0
Lahars 72 49,938 1.0 100 24.1 20.0 38.9
Secondary lahars 41 6377 2.7 45 22.9 20.0 30.0
Tephra 52 4315 0.5 170 18.6 10.0 61.8
Avalanche 9 3525 1.0 20 8.3 7.0 13.2
Quiescent Gas 50 1698 0.1 74 10.9 7.5 30.8
Quiescent gas fromvent
– – 0.0 13 5.4 6.8 9.0
Lava flows 25 659 1.0 29 12.2 11.0 15.8
Lava flows from vent – – 1.0 29 11.6 10.0 15.8
Gas 16 585 5.0 21 9.8 9.0 13.1
Gas from vent – – 1.0 21 7.2 5.0 15.1
Ballistics 57 367 0.0 7 1.7 1.0 3.0
Hydrothermal 7 62 1.5 20 9.3 6.0 17.5
Hydrothermal fromvent
– – 0.8 3 1.6 1.3 1.7
Lightning 4 9 15.0 30 22.5 22.5 21.2
All eruptive hazards 515 214,004 0.0 170 13.5 8.6 35.6
Data include QL 1 and QL 2max. Gas, quiescent gas, lava flows and hydrothermal bursts are sometimes recorded with distance from their source vent as well asdistance from the summit. In these cases we present all data under the parent category (e.g. quiescent gas) and substitute in the distance from vent data in thesubcategory (e.g. quiescent gas from vent). We do not double count the fatalities and fatal incidents. All eruptive hazards includes the ‘Multiple’ and ‘Eruption –unknown element’ fatal cause categories: quiescent hazards are excluded. Note that the incident count includes sub-incidents
a b
Fig. 4 Percentage of incidents (a) and fatalities (b) per fatal cause in 5 km bins to 50 km. Data include QL 1 and QL 2max categories. Q-gas isquiescent gas, SRY lahars is secondary lahars
Brown et al. Journal of Applied Volcanology (2017) 6:15 Page 8 of 20
tsunami was 36,000 in the 1883 eruption of Krakatau,Indonesia, at distances of up to 40 km. Tsunamis ac-count for 56,822 fatalities (26%).
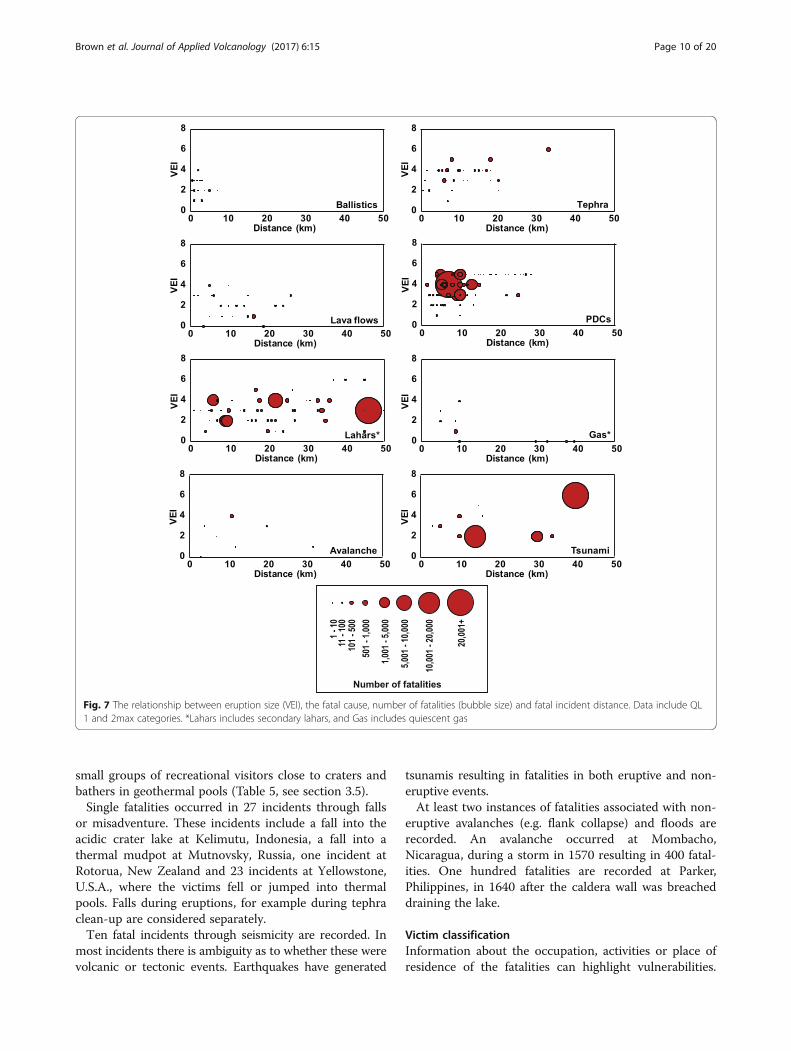
Distance, eruption VEI and fatal causeThe fatal incidents data are dominated by small-magnitude (VEI 3 and below) eruptions of fatal incidents,69% are associated with VEI 1–3 eruptions, 18% at VEI 4,and 13% at VEI 5–7. This dominance of smaller events re-flects at least three main factors related to: the short timeperiod of recording; systematic changes in recording ofboth eruptions and fatal incidents back in time that de-pend on eruption magnitude; and rapid populationgrowth. Issues of incompleteness and under-recording arediscussed further below. Unravelling these complexitieswill be challenging and will require a major modellingstudy which is well beyond the scope of this study. Herewe analyse the data without any corrections and so ourapproach is empirical. The tendency for fatal incident dis-tances to increase with eruption explosivity is illustratedin Fig. 6 for eruptions of VEI 5 and 6. Incidents in erup-tions of VEI 4 show a less convincing increase in distance.There is no evidence for distance dependence for VEI ≤3.Incidents individually accounting for over 100 fatalities
are recorded in all VEI bands from 1 to 7: an increasingproportion of such incidents in each band is seen withincreasing VEI. These incidents are recorded up to tensof kilometres from the volcano. There is no convincingrelationship between VEI, the number of fatalities perincident and distance or fatal cause (Fig. 7).
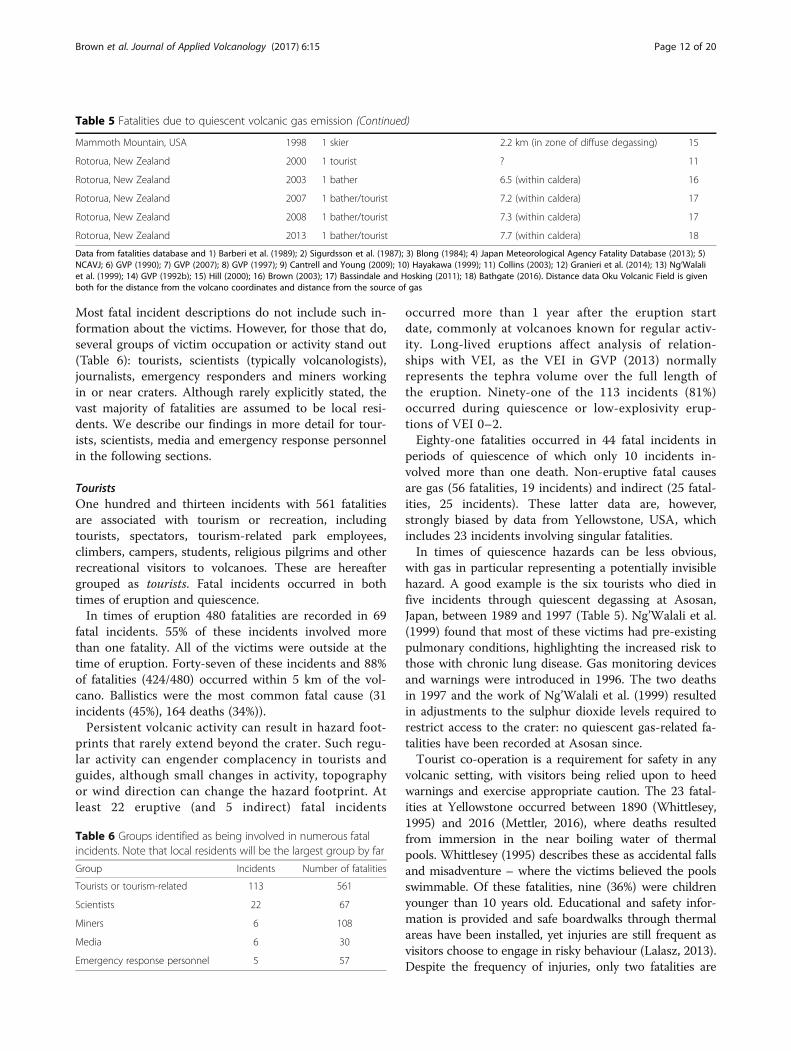
Fatalities during quiescenceFatal incidents are recorded in periods of quiescence pri-marily due to secondary lahars (41 incidents, 6377 fatal-ities), quiescent gas emissions (50 incidents, >1600fatalities) and indirect accidents (28 incidents, 30 fatalities).
The largest recorded loss of life from secondary laharsoccurred in 1998 at Casita (San Cristóbal), Nicaragua.During Hurricane Mitch a debris avalanche transformedinto a lahar which killed over 2500 in the towns of ElPorvenir and Rolando Rodriguez (Scott et al. 2004) lo-cated at about 9 to 10 km from the volcano summit.Quiescent gas emission was responsible for large num-
bers of fatalities in two events. Both occurred at volcaniclakes in the extensive Oku Volcanic Field, Cameroon: 37fatalities at Lake Monoun in 1984 and >1565 fatalities atLake Nyos in 1986. Both events involved non-eruptivelake-overturn (for Lake Monoun see Sigurdsson et al.1987; for Lake Nyos see Kling et al. 1987), which releasedlarge volumes of carbon dioxide that flowed as dense cur-rents into populated areas. Fatalities occurred at about1 km from Lake Monoun. Baxter et al. (1989) and Barberiet al. (1989) showed that the majority of the Nyos fatalitiesoccurred within 3 km of the lake, and all within 15 km.The remaining quiescent gas emission incidents re-
sulted in 96 fatalities. Many of these incidents involved
Fig. 5 The cumulative percentage of fatal incidents by selected eruptive hazard with distance. Data include QL 1 and QL2max categories. Incidentsare counted in 1 km bins. The curve for ‘all’ represents all eruptive hazards as per Fig. 4
Fig. 6 VEI and distance of fatal incidents across all fatal causes; non-eruptive, indirect and seismicity excluded. Data include QL 1 andQL2 max categories
Brown et al. Journal of Applied Volcanology (2017) 6:15 Page 9 of 20
small groups of recreational visitors close to craters andbathers in geothermal pools (Table 5, see section 3.5).Single fatalities occurred in 27 incidents through falls
or misadventure. These incidents include a fall into theacidic crater lake at Kelimutu, Indonesia, a fall into athermal mudpot at Mutnovsky, Russia, one incident atRotorua, New Zealand and 23 incidents at Yellowstone,U.S.A., where the victims fell or jumped into thermalpools. Falls during eruptions, for example during tephraclean-up are considered separately.Ten fatal incidents through seismicity are recorded. In
most incidents there is ambiguity as to whether these werevolcanic or tectonic events. Earthquakes have generated
tsunamis resulting in fatalities in both eruptive and non-eruptive events.At least two instances of fatalities associated with non-
eruptive avalanches (e.g. flank collapse) and floods arerecorded. An avalanche occurred at Mombacho,Nicaragua, during a storm in 1570 resulting in 400 fatal-ities. One hundred fatalities are recorded at Parker,Philippines, in 1640 after the caldera wall was breacheddraining the lake.
Victim classificationInformation about the occupation, activities or place ofresidence of the fatalities can highlight vulnerabilities.
Fig. 7 The relationship between eruption size (VEI), the fatal cause, number of fatalities (bubble size) and fatal incident distance. Data include QL1 and 2max categories. *Lahars includes secondary lahars, and Gas includes quiescent gas
Brown et al. Journal of Applied Volcanology (2017) 6:15 Page 10 of 20
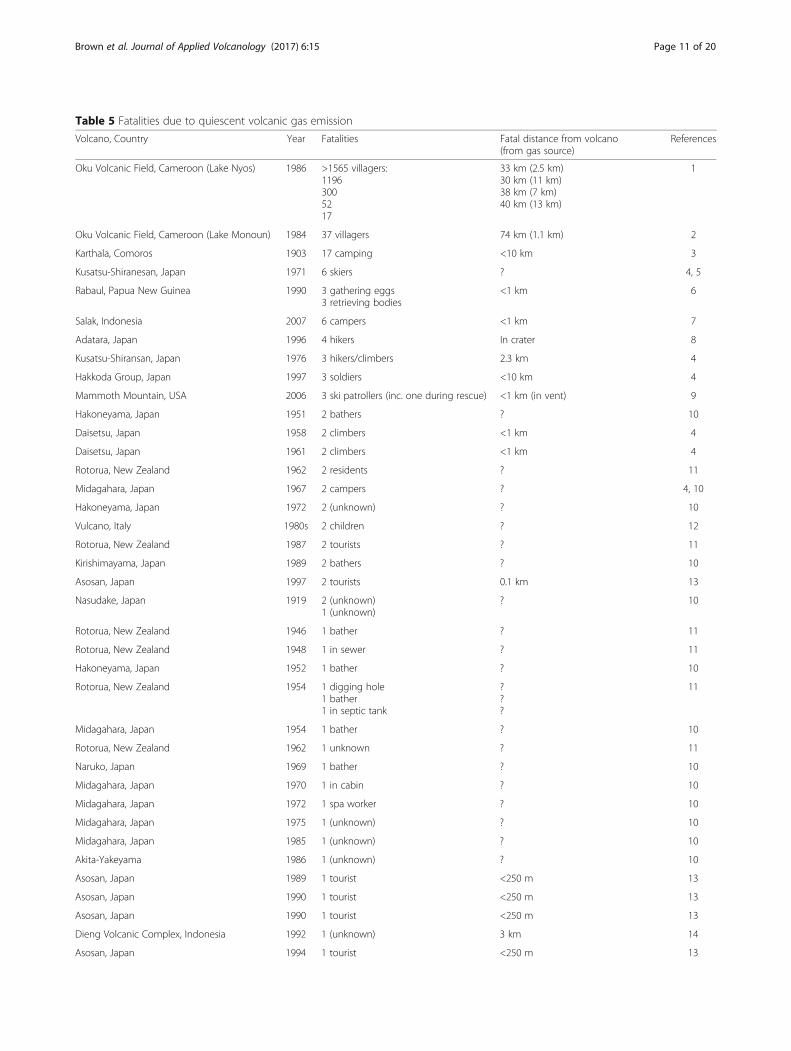
Table 5 Fatalities due to quiescent volcanic gas emission
Volcano, Country Year Fatalities Fatal distance from volcano(from gas source)
References
Oku Volcanic Field, Cameroon (Lake Nyos) 1986 >1565 villagers:11963005217
33 km (2.5 km)30 km (11 km)38 km (7 km)40 km (13 km)
1
Oku Volcanic Field, Cameroon (Lake Monoun) 1984 37 villagers 74 km (1.1 km) 2
Karthala, Comoros 1903 17 camping <10 km 3
Kusatsu-Shiranesan, Japan 1971 6 skiers ? 4, 5
Rabaul, Papua New Guinea 1990 3 gathering eggs3 retrieving bodies
<1 km 6
Salak, Indonesia 2007 6 campers <1 km 7
Adatara, Japan 1996 4 hikers In crater 8
Kusatsu-Shiransan, Japan 1976 3 hikers/climbers 2.3 km 4
Hakkoda Group, Japan 1997 3 soldiers <10 km 4
Mammoth Mountain, USA 2006 3 ski patrollers (inc. one during rescue) <1 km (in vent) 9
Hakoneyama, Japan 1951 2 bathers ? 10
Daisetsu, Japan 1958 2 climbers <1 km 4
Daisetsu, Japan 1961 2 climbers <1 km 4
Rotorua, New Zealand 1962 2 residents ? 11
Midagahara, Japan 1967 2 campers ? 4, 10
Hakoneyama, Japan 1972 2 (unknown) ? 10
Vulcano, Italy 1980s 2 children ? 12
Rotorua, New Zealand 1987 2 tourists ? 11
Kirishimayama, Japan 1989 2 bathers ? 10
Asosan, Japan 1997 2 tourists 0.1 km 13
Nasudake, Japan 1919 2 (unknown)1 (unknown)
? 10
Rotorua, New Zealand 1946 1 bather ? 11
Rotorua, New Zealand 1948 1 in sewer ? 11
Hakoneyama, Japan 1952 1 bather ? 10
Rotorua, New Zealand 1954 1 digging hole1 bather1 in septic tank
???
11
Midagahara, Japan 1954 1 bather ? 10
Rotorua, New Zealand 1962 1 unknown ? 11
Naruko, Japan 1969 1 bather ? 10
Midagahara, Japan 1970 1 in cabin ? 10
Midagahara, Japan 1972 1 spa worker ? 10
Midagahara, Japan 1975 1 (unknown) ? 10
Midagahara, Japan 1985 1 (unknown) ? 10
Akita-Yakeyama 1986 1 (unknown) ? 10
Asosan, Japan 1989 1 tourist <250 m 13
Asosan, Japan 1990 1 tourist <250 m 13
Asosan, Japan 1990 1 tourist <250 m 13
Dieng Volcanic Complex, Indonesia 1992 1 (unknown) 3 km 14
Asosan, Japan 1994 1 tourist <250 m 13
Brown et al. Journal of Applied Volcanology (2017) 6:15 Page 11 of 20
Most fatal incident descriptions do not include such in-formation about the victims. However, for those that do,several groups of victim occupation or activity stand out(Table 6): tourists, scientists (typically volcanologists),journalists, emergency responders and miners workingin or near craters. Although rarely explicitly stated, thevast majority of fatalities are assumed to be local resi-dents. We describe our findings in more detail for tour-ists, scientists, media and emergency response personnelin the following sections.
TouristsOne hundred and thirteen incidents with 561 fatalitiesare associated with tourism or recreation, includingtourists, spectators, tourism-related park employees,climbers, campers, students, religious pilgrims and otherrecreational visitors to volcanoes. These are hereaftergrouped as tourists. Fatal incidents occurred in bothtimes of eruption and quiescence.In times of eruption 480 fatalities are recorded in 69
fatal incidents. 55% of these incidents involved morethan one fatality. All of the victims were outside at thetime of eruption. Forty-seven of these incidents and 88%of fatalities (424/480) occurred within 5 km of the vol-cano. Ballistics were the most common fatal cause (31incidents (45%), 164 deaths (34%)).Persistent volcanic activity can result in hazard foot-
prints that rarely extend beyond the crater. Such regu-lar activity can engender complacency in tourists andguides, although small changes in activity, topographyor wind direction can change the hazard footprint. Atleast 22 eruptive (and 5 indirect) fatal incidents
occurred more than 1 year after the eruption startdate, commonly at volcanoes known for regular activ-ity. Long-lived eruptions affect analysis of relation-ships with VEI, as the VEI in GVP (2013) normallyrepresents the tephra volume over the full length ofthe eruption. Ninety-one of the 113 incidents (81%)occurred during quiescence or low-explosivity erup-tions of VEI 0–2.Eighty-one fatalities occurred in 44 fatal incidents in
periods of quiescence of which only 10 incidents in-volved more than one death. Non-eruptive fatal causesare gas (56 fatalities, 19 incidents) and indirect (25 fatal-ities, 25 incidents). These latter data are, however,strongly biased by data from Yellowstone, USA, whichincludes 23 incidents involving singular fatalities.In times of quiescence hazards can be less obvious,
with gas in particular representing a potentially invisiblehazard. A good example is the six tourists who died infive incidents through quiescent degassing at Asosan,Japan, between 1989 and 1997 (Table 5). Ng’Walali et al.(1999) found that most of these victims had pre-existingpulmonary conditions, highlighting the increased risk tothose with chronic lung disease. Gas monitoring devicesand warnings were introduced in 1996. The two deathsin 1997 and the work of Ng’Walali et al. (1999) resultedin adjustments to the sulphur dioxide levels required torestrict access to the crater: no quiescent gas-related fa-talities have been recorded at Asosan since.Tourist co-operation is a requirement for safety in any
volcanic setting, with visitors being relied upon to heedwarnings and exercise appropriate caution. The 23 fatal-ities at Yellowstone occurred between 1890 (Whittlesey,1995) and 2016 (Mettler, 2016), where deaths resultedfrom immersion in the near boiling water of thermalpools. Whittlesey (1995) describes these as accidental fallsand misadventure – where the victims believed the poolsswimmable. Of these fatalities, nine (36%) were childrenyounger than 10 years old. Educational and safety infor-mation is provided and safe boardwalks through thermalareas have been installed, yet injuries are still frequent asvisitors choose to engage in risky behaviour (Lalasz, 2013).Despite the frequency of injuries, only two fatalities are
Table 5 Fatalities due to quiescent volcanic gas emission (Continued)
Mammoth Mountain, USA 1998 1 skier 2.2 km (in zone of diffuse degassing) 15
Rotorua, New Zealand 2000 1 tourist ? 11
Rotorua, New Zealand 2003 1 bather 6.5 (within caldera) 16
Rotorua, New Zealand 2007 1 bather/tourist 7.2 (within caldera) 17
Rotorua, New Zealand 2008 1 bather/tourist 7.3 (within caldera) 17
Rotorua, New Zealand 2013 1 bather/tourist 7.7 (within caldera) 18
Data from fatalities database and 1) Barberi et al. (1989); 2) Sigurdsson et al. (1987); 3) Blong (1984); 4) Japan Meteorological Agency Fatality Database (2013); 5)NCAVJ; 6) GVP (1990); 7) GVP (2007); 8) GVP (1997); 9) Cantrell and Young (2009); 10) Hayakawa (1999); 11) Collins (2003); 12) Granieri et al. (2014); 13) Ng’Walaliet al. (1999); 14) GVP (1992b); 15) Hill (2000); 16) Brown (2003); 17) Bassindale and Hosking (2011); 18) Bathgate (2016). Distance data Oku Volcanic Field is givenboth for the distance from the volcano coordinates and distance from the source of gas
Table 6 Groups identified as being involved in numerous fatalincidents. Note that local residents will be the largest group by far
Group Incidents Number of fatalities
Tourists or tourism-related 113 561
Scientists 22 67
Miners 6 108
Media 6 30
Emergency response personnel 5 57
Brown et al. Journal of Applied Volcanology (2017) 6:15 Page 12 of 20
recorded in the last 30 years at Yellowstone, suggestingsafety measures have been largely successful and the vis-itor population has become more risk averse at this vol-cano. Seventeen deaths are recorded at Rotorua, NewZealand since 1946, of which at least seven were tourists.These fatalities occurred primarily at hot pools throughquiescent gas emissions. The decrease in incidents overtime seen at Yellowstone is not seen here, with seven inci-dents since 2000. Recommendations were made in 2010aimed at improving safety at geothermal pools (Bassindaleand Hosking, 2011).
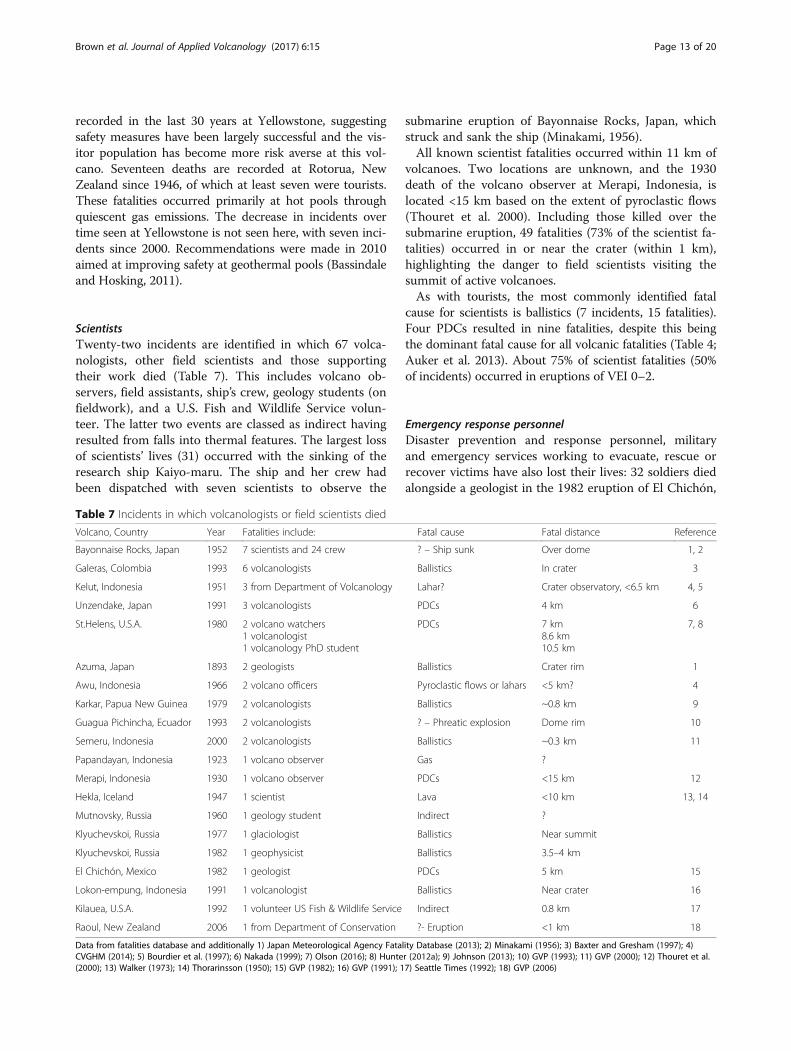
ScientistsTwenty-two incidents are identified in which 67 volca-nologists, other field scientists and those supportingtheir work died (Table 7). This includes volcano ob-servers, field assistants, ship’s crew, geology students (onfieldwork), and a U.S. Fish and Wildlife Service volun-teer. The latter two events are classed as indirect havingresulted from falls into thermal features. The largest lossof scientists’ lives (31) occurred with the sinking of theresearch ship Kaiyo-maru. The ship and her crew hadbeen dispatched with seven scientists to observe the
submarine eruption of Bayonnaise Rocks, Japan, whichstruck and sank the ship (Minakami, 1956).All known scientist fatalities occurred within 11 km of
volcanoes. Two locations are unknown, and the 1930death of the volcano observer at Merapi, Indonesia, islocated <15 km based on the extent of pyroclastic flows(Thouret et al. 2000). Including those killed over thesubmarine eruption, 49 fatalities (73% of the scientist fa-talities) occurred in or near the crater (within 1 km),highlighting the danger to field scientists visiting thesummit of active volcanoes.As with tourists, the most commonly identified fatal
cause for scientists is ballistics (7 incidents, 15 fatalities).Four PDCs resulted in nine fatalities, despite this beingthe dominant fatal cause for all volcanic fatalities (Table 4;Auker et al. 2013). About 75% of scientist fatalities (50%of incidents) occurred in eruptions of VEI 0–2.
Emergency response personnelDisaster prevention and response personnel, militaryand emergency services working to evacuate, rescue orrecover victims have also lost their lives: 32 soldiers diedalongside a geologist in the 1982 eruption of El Chichón,
Table 7 Incidents in which volcanologists or field scientists died
Volcano, Country Year Fatalities include: Fatal cause Fatal distance Reference
Bayonnaise Rocks, Japan 1952 7 scientists and 24 crew ? – Ship sunk Over dome 1, 2
Galeras, Colombia 1993 6 volcanologists Ballistics In crater 3
Kelut, Indonesia 1951 3 from Department of Volcanology Lahar? Crater observatory, <6.5 km 4, 5
Unzendake, Japan 1991 3 volcanologists PDCs 4 km 6
St.Helens, U.S.A. 1980 2 volcano watchers1 volcanologist1 volcanology PhD student
PDCs 7 km8.6 km10.5 km
7, 8
Azuma, Japan 1893 2 geologists Ballistics Crater rim 1
Awu, Indonesia 1966 2 volcano officers Pyroclastic flows or lahars <5 km? 4
Karkar, Papua New Guinea 1979 2 volcanologists Ballistics ~0.8 km 9
Guagua Pichincha, Ecuador 1993 2 volcanologists ? – Phreatic explosion Dome rim 10
Semeru, Indonesia 2000 2 volcanologists Ballistics ~0.3 km 11
Papandayan, Indonesia 1923 1 volcano observer Gas ?
Merapi, Indonesia 1930 1 volcano observer PDCs <15 km 12
Hekla, Iceland 1947 1 scientist Lava <10 km 13, 14
Mutnovsky, Russia 1960 1 geology student Indirect ?
Klyuchevskoi, Russia 1977 1 glaciologist Ballistics Near summit
Klyuchevskoi, Russia 1982 1 geophysicist Ballistics 3.5–4 km
El Chichón, Mexico 1982 1 geologist PDCs 5 km 15
Lokon-empung, Indonesia 1991 1 volcanologist Ballistics Near crater 16
Kilauea, U.S.A. 1992 1 volunteer US Fish & Wildlife Service Indirect 0.8 km 17
Raoul, New Zealand 2006 1 from Department of Conservation ?- Eruption <1 km 18
Data from fatalities database and additionally 1) Japan Meteorological Agency Fatality Database (2013); 2) Minakami (1956); 3) Baxter and Gresham (1997); 4)CVGHM (2014); 5) Bourdier et al. (1997); 6) Nakada (1999); 7) Olson (2016); 8) Hunter (2012a); 9) Johnson (2013); 10) GVP (1993); 11) GVP (2000); 12) Thouret et al.(2000); 13) Walker (1973); 14) Thorarinsson (1950); 15) GVP (1982); 16) GVP (1991); 17) Seattle Times (1992); 18) GVP (2006)
Brown et al. Journal of Applied Volcanology (2017) 6:15 Page 13 of 20
Mexico, when a pyroclastic flow overran the town ofFrancisco León, about 5 km from the summit (BulletinSEAN 07–05, GVP, 1982); 12 disaster preventionpersonnel and two policemen died in the 1991 Unzen-dake eruption (Ministry of Land, Infrastructure andTransport 2007) 4 km from the summit; eight rescuerswere killed in a helicopter crash at Dieng Volcanic Com-plex, Indonesia, during evacuation efforts in 2017(Jakarta Globe 2017); and two rescuers died in 2006 atMerapi, Indonesia, after taking shelter in a bunker whichwas buried by pyroclastic flows about 4 km from thesummit (Wilson et al. 2007). A radio operator reportingon the activity of St. Helens in 1980 for the WashingtonDepartment of Emergency Services died in the PDC atabout 12 km (Hunter, 2012b).Although not classified as emergency responders,
fatality records exist for individuals who perished dur-ing rescue and recovery efforts. At Rabaul, PapuaNew Guinea, in 1990, three were killed whilstattempting to recover the bodies of three friends andrelatives who were overcome by volcanic gases in avent (GVP, 1990). At Mammoth Mountain, USA, in2006, two ski patrollers fell into a fumarole and wereasphyxiated. Rescue efforts saw the further death ofone colleague and hospitalisation of seven others(Cantrell and Young, 2009).
MediaThirty media employees died in six incidents: within1 km of the vent at Semeru (Indonesia), Santa María(Guatemala) and Pacaya (Guatemala); within 3 km atSinabung (Indonesia); 4 km at Unzendake (Japan) and atabout 13 km at St. Helens (USA). The lava dome col-lapse at Unzendake generated a PDC in 1991 (Nakada,1999), resulting in the deaths of 43 people, including 16journalists and four of the journalists’ drivers (Ministryof Land, Infrastructure and Transport, 2007). Victims atUnzendake, Sinabung, Pacaya and Semeru were withinthe declared danger zones.
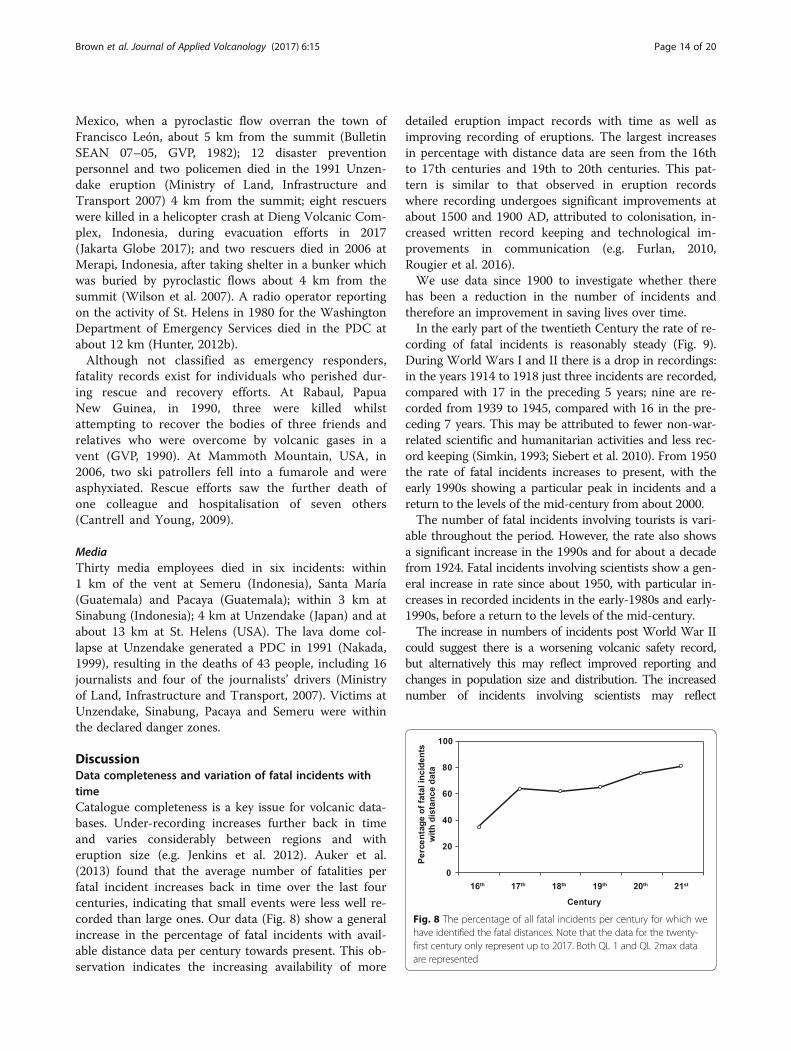
DiscussionData completeness and variation of fatal incidents withtimeCatalogue completeness is a key issue for volcanic data-bases. Under-recording increases further back in timeand varies considerably between regions and witheruption size (e.g. Jenkins et al. 2012). Auker et al.(2013) found that the average number of fatalities perfatal incident increases back in time over the last fourcenturies, indicating that small events were less well re-corded than large ones. Our data (Fig. 8) show a generalincrease in the percentage of fatal incidents with avail-able distance data per century towards present. This ob-servation indicates the increasing availability of more
detailed eruption impact records with time as well asimproving recording of eruptions. The largest increasesin percentage with distance data are seen from the 16thto 17th centuries and 19th to 20th centuries. This pat-tern is similar to that observed in eruption recordswhere recording undergoes significant improvements atabout 1500 and 1900 AD, attributed to colonisation, in-creased written record keeping and technological im-provements in communication (e.g. Furlan, 2010,Rougier et al. 2016).We use data since 1900 to investigate whether there
has been a reduction in the number of incidents andtherefore an improvement in saving lives over time.In the early part of the twentieth Century the rate of re-
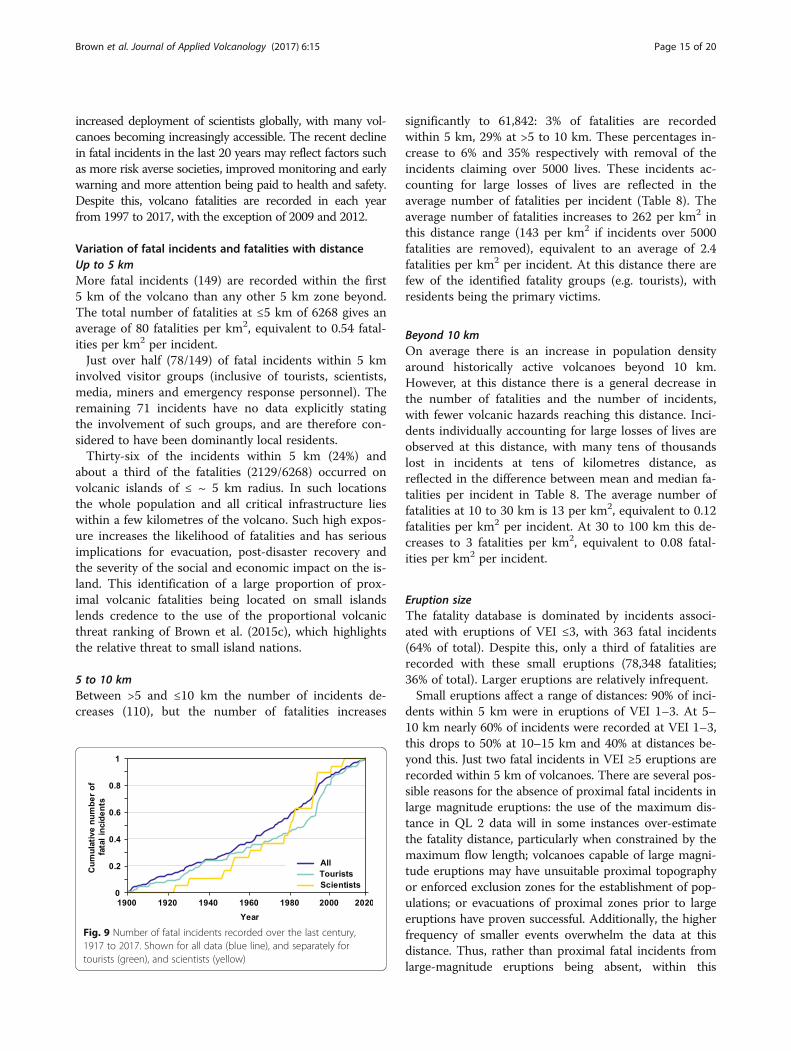
cording of fatal incidents is reasonably steady (Fig. 9).During World Wars I and II there is a drop in recordings:in the years 1914 to 1918 just three incidents are recorded,compared with 17 in the preceding 5 years; nine are re-corded from 1939 to 1945, compared with 16 in the pre-ceding 7 years. This may be attributed to fewer non-war-related scientific and humanitarian activities and less rec-ord keeping (Simkin, 1993; Siebert et al. 2010). From 1950the rate of fatal incidents increases to present, with theearly 1990s showing a particular peak in incidents and areturn to the levels of the mid-century from about 2000.The number of fatal incidents involving tourists is vari-
able throughout the period. However, the rate also showsa significant increase in the 1990s and for about a decadefrom 1924. Fatal incidents involving scientists show a gen-eral increase in rate since about 1950, with particular in-creases in recorded incidents in the early-1980s and early-1990s, before a return to the levels of the mid-century.The increase in numbers of incidents post World War II
could suggest there is a worsening volcanic safety record,but alternatively this may reflect improved reporting andchanges in population size and distribution. The increasednumber of incidents involving scientists may reflect
Fig. 8 The percentage of all fatal incidents per century for which wehave identified the fatal distances. Note that the data for the twenty-first century only represent up to 2017. Both QL 1 and QL 2max dataare represented
Brown et al. Journal of Applied Volcanology (2017) 6:15 Page 14 of 20
increased deployment of scientists globally, with many vol-canoes becoming increasingly accessible. The recent declinein fatal incidents in the last 20 years may reflect factors suchas more risk averse societies, improved monitoring and earlywarning and more attention being paid to health and safety.Despite this, volcano fatalities are recorded in each yearfrom 1997 to 2017, with the exception of 2009 and 2012.
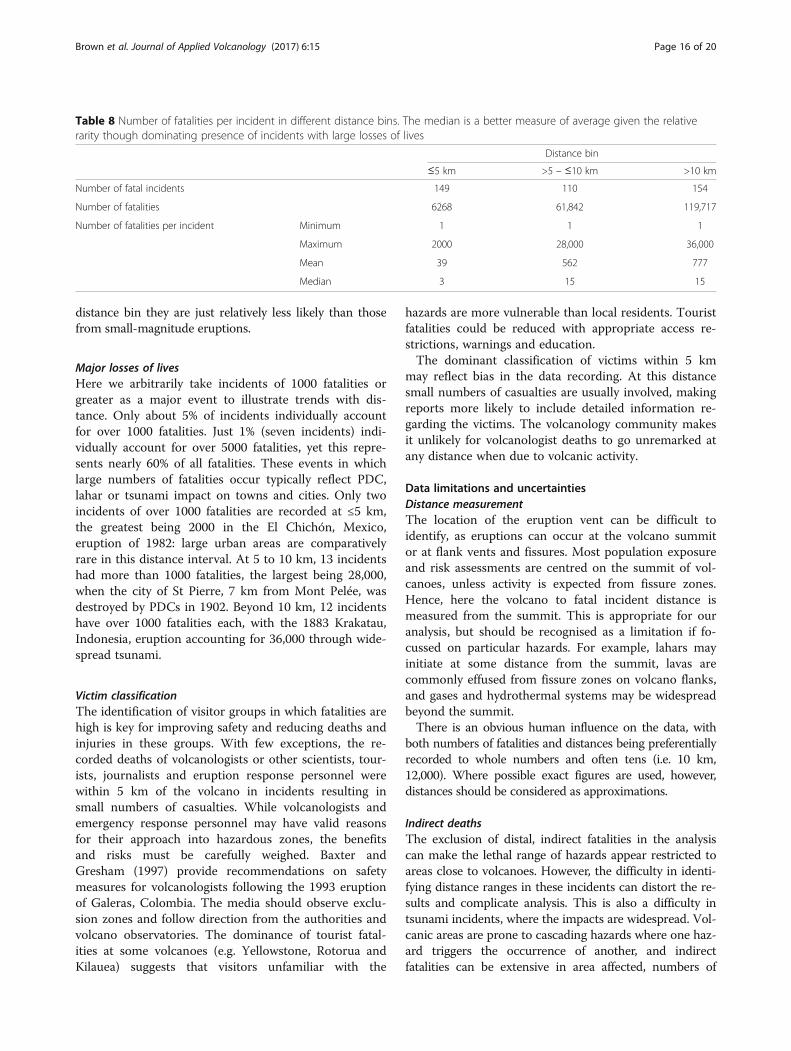
Variation of fatal incidents and fatalities with distanceUp to 5 kmMore fatal incidents (149) are recorded within the first5 km of the volcano than any other 5 km zone beyond.The total number of fatalities at ≤5 km of 6268 gives anaverage of 80 fatalities per km2, equivalent to 0.54 fatal-ities per km2 per incident.Just over half (78/149) of fatal incidents within 5 km
involved visitor groups (inclusive of tourists, scientists,media, miners and emergency response personnel). Theremaining 71 incidents have no data explicitly statingthe involvement of such groups, and are therefore con-sidered to have been dominantly local residents.Thirty-six of the incidents within 5 km (24%) and
about a third of the fatalities (2129/6268) occurred onvolcanic islands of ≤ ~ 5 km radius. In such locationsthe whole population and all critical infrastructure lieswithin a few kilometres of the volcano. Such high expos-ure increases the likelihood of fatalities and has seriousimplications for evacuation, post-disaster recovery andthe severity of the social and economic impact on the is-land. This identification of a large proportion of prox-imal volcanic fatalities being located on small islandslends credence to the use of the proportional volcanicthreat ranking of Brown et al. (2015c), which highlightsthe relative threat to small island nations.
5 to 10 kmBetween >5 and ≤10 km the number of incidents de-creases (110), but the number of fatalities increases
significantly to 61,842: 3% of fatalities are recordedwithin 5 km, 29% at >5 to 10 km. These percentages in-crease to 6% and 35% respectively with removal of theincidents claiming over 5000 lives. These incidents ac-counting for large losses of lives are reflected in theaverage number of fatalities per incident (Table 8). Theaverage number of fatalities increases to 262 per km2 inthis distance range (143 per km2 if incidents over 5000fatalities are removed), equivalent to an average of 2.4fatalities per km2 per incident. At this distance there arefew of the identified fatality groups (e.g. tourists), withresidents being the primary victims.
Beyond 10 kmOn average there is an increase in population densityaround historically active volcanoes beyond 10 km.However, at this distance there is a general decrease inthe number of fatalities and the number of incidents,with fewer volcanic hazards reaching this distance. Inci-dents individually accounting for large losses of lives areobserved at this distance, with many tens of thousandslost in incidents at tens of kilometres distance, asreflected in the difference between mean and median fa-talities per incident in Table 8. The average number offatalities at 10 to 30 km is 13 per km2, equivalent to 0.12fatalities per km2 per incident. At 30 to 100 km this de-creases to 3 fatalities per km2, equivalent to 0.08 fatal-ities per km2 per incident.
Eruption sizeThe fatality database is dominated by incidents associ-ated with eruptions of VEI ≤3, with 363 fatal incidents(64% of total). Despite this, only a third of fatalities arerecorded with these small eruptions (78,348 fatalities;36% of total). Larger eruptions are relatively infrequent.Small eruptions affect a range of distances: 90% of inci-
dents within 5 km were in eruptions of VEI 1–3. At 5–10 km nearly 60% of incidents were recorded at VEI 1–3,this drops to 50% at 10–15 km and 40% at distances be-yond this. Just two fatal incidents in VEI ≥5 eruptions arerecorded within 5 km of volcanoes. There are several pos-sible reasons for the absence of proximal fatal incidents inlarge magnitude eruptions: the use of the maximum dis-tance in QL 2 data will in some instances over-estimatethe fatality distance, particularly when constrained by themaximum flow length; volcanoes capable of large magni-tude eruptions may have unsuitable proximal topographyor enforced exclusion zones for the establishment of pop-ulations; or evacuations of proximal zones prior to largeeruptions have proven successful. Additionally, the higherfrequency of smaller events overwhelm the data at thisdistance. Thus, rather than proximal fatal incidents fromlarge-magnitude eruptions being absent, within this
Fig. 9 Number of fatal incidents recorded over the last century,1917 to 2017. Shown for all data (blue line), and separately fortourists (green), and scientists (yellow)
Brown et al. Journal of Applied Volcanology (2017) 6:15 Page 15 of 20
distance bin they are just relatively less likely than thosefrom small-magnitude eruptions.
Major losses of livesHere we arbitrarily take incidents of 1000 fatalities orgreater as a major event to illustrate trends with dis-tance. Only about 5% of incidents individually accountfor over 1000 fatalities. Just 1% (seven incidents) indi-vidually account for over 5000 fatalities, yet this repre-sents nearly 60% of all fatalities. These events in whichlarge numbers of fatalities occur typically reflect PDC,lahar or tsunami impact on towns and cities. Only twoincidents of over 1000 fatalities are recorded at ≤5 km,the greatest being 2000 in the El Chichón, Mexico,eruption of 1982: large urban areas are comparativelyrare in this distance interval. At 5 to 10 km, 13 incidentshad more than 1000 fatalities, the largest being 28,000,when the city of St Pierre, 7 km from Mont Pelée, wasdestroyed by PDCs in 1902. Beyond 10 km, 12 incidentshave over 1000 fatalities each, with the 1883 Krakatau,Indonesia, eruption accounting for 36,000 through wide-spread tsunami.
Victim classificationThe identification of visitor groups in which fatalities arehigh is key for improving safety and reducing deaths andinjuries in these groups. With few exceptions, the re-corded deaths of volcanologists or other scientists, tour-ists, journalists and eruption response personnel werewithin 5 km of the volcano in incidents resulting insmall numbers of casualties. While volcanologists andemergency response personnel may have valid reasonsfor their approach into hazardous zones, the benefitsand risks must be carefully weighed. Baxter andGresham (1997) provide recommendations on safetymeasures for volcanologists following the 1993 eruptionof Galeras, Colombia. The media should observe exclu-sion zones and follow direction from the authorities andvolcano observatories. The dominance of tourist fatal-ities at some volcanoes (e.g. Yellowstone, Rotorua andKilauea) suggests that visitors unfamiliar with the
hazards are more vulnerable than local residents. Touristfatalities could be reduced with appropriate access re-strictions, warnings and education.The dominant classification of victims within 5 km
may reflect bias in the data recording. At this distancesmall numbers of casualties are usually involved, makingreports more likely to include detailed information re-garding the victims. The volcanology community makesit unlikely for volcanologist deaths to go unremarked atany distance when due to volcanic activity.
Data limitations and uncertaintiesDistance measurementThe location of the eruption vent can be difficult toidentify, as eruptions can occur at the volcano summitor at flank vents and fissures. Most population exposureand risk assessments are centred on the summit of vol-canoes, unless activity is expected from fissure zones.Hence, here the volcano to fatal incident distance ismeasured from the summit. This is appropriate for ouranalysis, but should be recognised as a limitation if fo-cussed on particular hazards. For example, lahars mayinitiate at some distance from the summit, lavas arecommonly effused from fissure zones on volcano flanks,and gases and hydrothermal systems may be widespreadbeyond the summit.There is an obvious human influence on the data, with
both numbers of fatalities and distances being preferentiallyrecorded to whole numbers and often tens (i.e. 10 km,12,000). Where possible exact figures are used, however,distances should be considered as approximations.
Indirect deathsThe exclusion of distal, indirect fatalities in the analysiscan make the lethal range of hazards appear restricted toareas close to volcanoes. However, the difficulty in identi-fying distance ranges in these incidents can distort the re-sults and complicate analysis. This is also a difficulty intsunami incidents, where the impacts are widespread. Vol-canic areas are prone to cascading hazards where one haz-ard triggers the occurrence of another, and indirectfatalities can be extensive in area affected, numbers of
Table 8 Number of fatalities per incident in different distance bins. The median is a better measure of average given the relativerarity though dominating presence of incidents with large losses of lives
Distance bin
≤5 km >5 – ≤10 km >10 km
Number of fatal incidents 149 110 154
Number of fatalities 6268 61,842 119,717
Number of fatalities per incident Minimum 1 1 1
Maximum 2000 28,000 36,000
Mean 39 562 777
Median 3 15 15
Brown et al. Journal of Applied Volcanology (2017) 6:15 Page 16 of 20
fatalities and time after eruption. An example of post-eruption indirect fatalities is the 1902 Santa Mariaeruption Guatemala, when a malaria epidemic “cost morelives than the eruption itself – many times more” with anestimated 2000 fatalities as the ash had killed the birds,but not the mosquitoes (Church et al. 1908). The potentialfor such indirect fatalities should be recognised in com-munity planning and preparedness efforts.Care should be taken in maintenance of the database
to ensure the fatal cause is clearly identifiable and vol-canic in origin.
Data availabilityThere are known issues with data completeness in theeruption record, with under-recording affected by fac-tors including time and location. The fatality dataset isrelatively small and is likely incomplete. The distance de-terminations aid the understanding of volcanic fatalitiesbut there are many other factors that should be consid-ered and should be a focus of future work and databaseimprovements. Healthcare facilities hold data onvolcano-related fatalities that is not easily accessible andmay not be reported elsewhere. For example, indirect fa-talities through falls from roofs during tephra clean-up ormental health complications are likely under-reported inthe scientific literature and activity bulletins. Future up-dates to and development of the database would benefitfrom collaboration with in-country sources such as vol-cano observatories, geosciences agencies and healthcarefacilities to widen the data available and ensure datacompleteness.Our analysis is undertaken across the world’s volca-
noes, irrespective of local population size and topog-raphy. Such factors have some control over the locationand occurrence of fatalities, and as such may impact therecorded distribution of fatalities. We do not considerthe effects of exclusion zones, evacuations and emer-gency management which have helped save many thou-sands of lives. For example, the 2010 eruption of Merapi,Indonesia, claimed nearly 400 lives, however an esti-mated 10,000 to 20,000 lives were saved by timely evacu-ations (Surono et al. 2012).To better understand eruptions and their impacts and
to reduce disaster risk we need comprehensive, system-atic data collection as data are highly variable with timeand location. Amongst other aims, the UN’s SendaiFramework for Disaster Risk Reduction 2015–2030(United Nations, 2015) seeks a reduction in lives lost.Data availability and accessibility make measurement ofsuch a factor challenging. Sendai should be viewed as acall to spur advancement in data collection and accessi-bility and international collaboration. One of the desiredaims of the UN is to better understand victim
demographics, to aid identification of vulnerable groups:data crucial to this aim are gender, disability, age, fatalcause, fatality location, occupation and residence type.
Applications of the dataPopulation Exposure IndexAn application of the new fatality distance data is in theweighting of population data in the Population ExposureIndex (PEI; Aspinall et al. 2011; Brown et al. 2015b). Theexposed population living around a volcano and withinthe footprint of potential hazards is a major factor in vol-canic risk. Ewert and Harpel (2004) calculated populationsin increasing radii circles centred on volcanoes to defineVolcano Population Indices (VPI). However, it is prefera-ble to have a single index for risk estimation. A rationalway of developing such an index is to recognise that threatdecreases in a general way with distance and to use the fa-tality distance data as an empirical basis for weighting.The PEI was introduced by Aspinall et al. (2011) and
was amended and applied globally by Brown et al.(2015b). Aspinall et al. (2011) weighted VPI10 and VPI30(population within 10 and 30 km) by area of rings of 10and 30 km and the historic occurrence of fatalitieswithin these distances. Brown et al. (2015b) includeddistances to 100 km, to capture the majority of hazardsin the majority of eruptions. Both Aspinall et al. (2011)and Brown et al. (2015b) used the distance described in27 fatal incidents in the database of Auker et al. (2013)to determine the weighting. Our new dataset expandsthe number of incidents with a recorded distance to 413,improving confidence in weightings. Indirect fatalitiesand fatalities through seismicity are excluded from thiscount. Of these, 175 are QL1 data. As QL2 data repre-sents a range over which fatalities occurred it is excludedfor the purposes of PEI calculation.Despite a six-fold increase in the fatalities dataset there
is little change in the weightings and resultant PEI scoresdue to the overriding occurrence of fatal incidents in thefirst 10 km: 91 incidents at ≤10 produces a weighting of0.941; 63 incidents at >10 to ≤30 produces a weightingof 0.057; 19 incidents at >30 to ≤100 gives a weightingof 0.002. VPI10, VPI30 and VPI100 are weighted by theseresults at each volcano to produce a PEI score. Eighthundred twenty-five volcanoes are given a low PEI, 295a moderate PEI and 384 a high PEI. It is this latter groupwhere population exposure is particularly high.A companion paper will further explain and explore
the PEI, and provide the PEI classifications for theworld’s volcanoes.
Future of the fatalities databaseThe fatalities database will be available and free to usethrough the Global Volcano Model (GVM), via http://www.globalvolcanomodel.org/. The database provided as
Brown et al. Journal of Applied Volcanology (2017) 6:15 Page 17 of 20
per this paper is Version 1. Periodic updates will bemade as new data becomes available and new versionswill thus be released. Readers are invited to contributeto the database via the corresponding author. The fatal-ities dataset will also be incorporated into Volcanoes ofthe World database through the GVP.
Conclusions and final remarksThe updated fatalities database holds 635 records with278,368 fatalities in total, considering all fatal causes.The distance at which fatalities occurred from the vol-cano is identified in 456 incidents, ranging from insidethe crater to over 100 km. The removal of indirect andseismicity-related fatal incidents leaves 216,756 fatalitiesin 571 incidents: distance is recorded in 413 of these in-cidents. Distances are recorded from within the volcanicvent to 170 km, but nearly half of the fatal incidents arerecorded within 10 km (259 incidents, 45%) and 67,680fatalities (31%). The distribution of fatalities with dis-tance is highly dependent on the occurrence of major in-cidents in which thousands die. These occur at distancesbeyond 5 km and to tens of kilometres, typically due tohazardous flows or tsunamis. Ballistics dominate theproximal incident record, PDCs the medial, and lahars,tsunami and tephra the distal record.Residents make up the largest number of fatalities but
visitor groups including scientists, tourists, the mediaand emergency responders are involved in 152 fatal inci-dents resulting in 823 fatalities, 76% of which occurredwithin 5 km or inside the caldera and many in eruptionsof low VEI or during times of quiescence.Reducing mortality from disasters is a priority target
of the Sendai Framework for Disaster Risk Reduction.As such, systematic fatality data collection is crucial. Inline with the requirements of Sendai, we recommendthat future volcanic fatalities are recorded with at least abasic level of detail covering: gender, location, date ofdeath and fatal cause. Further desirable data include thevictim’s name (this prevents record duplication, butshould not be made publically accessible), age, occupa-tion or activity at time of death (e.g. tourist) and place ofresidence. A better understanding about the lethal rangeand lethal elements of volcanic hazards could be gainedif the physiological cause of death was also recorded(e.g. pulmonary oedema). If volcano-related injuries wererecorded in a similar manner, this would provide empir-ical data for the further development of safety recom-mendations, equipment and less vulnerable structures.The distribution of fatalities and quantification of fatal
distances enables an analysis of volcanic threat to lifearound volcanoes, and permits more robust calculationsof population exposure to volcanic hazards. The weight-ings in the Population Exposure Index proposed and
applied by Aspinall et al. (2011) and Brown et al. (b)were found to be similar in our much larger dataset.The ever-growing population exposed to volcanic haz-
ards is a significant factor increasing risk. Risk can be re-duced with improvements in forecasting and monitoring,together with increased societal resilience achievedthrough raising awareness and development of volcanicemergency management plans. Exposure can be reducedthrough timely evacuations and restrictions on develop-ment of urban areas in potential volcanic hazard foot-prints. Such mitigation measures can be improved uponand supported by the fatality dataset and the understand-ing of threat with distance.
Additional files
Additional file 1: Excel spreadsheet of the fatalities database, version 1.(XLSX 231 kb)
Additional file 2: KML file for use in Google Earth with the locations offatal incidents. (KML 205 kb)
AbbreviationsFatal Cause: The volcanic hazard responsible for the loss of life; Fatalincidents: The occurrence of a fatality or fatalities with one fatal causeidentified and one date; Fatal sub-incidents: The occurrence of a fatality orfatalities with one fatal cause identified and one date but listed separatelydue to the identification of multiple distances; Fatalities: Number of victims;GVM: Global Volcano Model; GVP: Global Volcanism Program; JMA: JapanMeteorological Agency; LaMEVE: Large Magnitude Explosive VolcanicEruptions database; NCAVJ: National Catalogue of the Active Volcanoes ofJapan; PEI: Population Exposure Index; Q-gas: Quiescent gas; QL1data: Quality level 1 data where distance is precisely known; QL2data: Quality level 2 data where distance is constrained to a range and themaximum distance is used; SRY lahars: Secondary lahars; VEI: VolcanicExplosivity Index; VHI: Volcanic Hazard Index; VOTW: Volcanoes of the World:the catalogue of holocene volcanoes of the Global Volcanism Program;VPI: Volcano Population Index
AcknowledgementsThe authors would like to thank Ben Andrews of the Global VolcanismProgram and the reviewers for their constructive comments on themanuscript.
FundingThis study was undertaken with funding from the United Nations Office forDisaster Risk Reduction GR4678 and NERC grants RE2261 and GR4299.
Availability of data and materialsThe updated fatalities database is provided as additional material to thispaper.
Authors’ contributionsSKB conceived of the study with input from SFJ and RSJS. Data collectionand analysis was undertaken by SKB. The final manuscript was prepared bySKB with input from SFJ, RSJS, HO and MRA. All authors read, reviewed andapproved the final manuscript.
Ethics approval and consent to participateNot applicable.
Consent for publicationNot applicable.
Competing interestsThe authors declare that they have no competing interests.
Brown et al. Journal of Applied Volcanology (2017) 6:15 Page 18 of 20
Publisher’s NoteSpringer Nature remains neutral with regard to jurisdictional claims in publishedmaps and institutional affiliations.
Author details1School of Earth Sciences, University of Bristol, Wills Memorial Building,Queen’s Road, Bristol BS8 1RJ, UK. 2Earth Observatory of Singapore, NanyangTechnological University, Singapore 639798, Singapore.
Received: 3 March 2017 Accepted: 30 August 2017
ReferencesAspinall W, Auker M, Hincks T, Mahony S, Nadim, F, Pooley J, Sparks RSJ, Syre E.
Volcano hazard and exposure in GFDRR priority countries and risk mitigationmeasures – GFDRR Volcano Risk Study. Bristol: Bristol University CabotInstitute and NGI Norway for the World Bank: NGI Report 20100806; 2011. p.3.
Auker MR, Sparks RSJ, Siebert L, Crosweller HS, Ewert J. A statistical analysis of theglobal historical volcanic fatalities record. J Appl Volcanol. 2013;2:1–24.
Barberi F, Chelini W, Marinelli G, Martini M. The gas cloud of Lake Nyos(Cameroon, 1986): Results of the Italian technical mission. J VolcanolGeotherm Res. 1989;39:125–34.
Bassindale T, Hosking M. Deaths in Rotorua’s geothermal hot pools: hydrogensulphide poisoning, Forensic Science International; 2011. p. 28–9.
Bathgate B. Australian doctor’s hot pool death sparks warning. 2016. http://www.stuff.co.nz/national/77540135/Australian-doctors-hot-pool-death-sparks-warning. Accessed 12 July 2017.
Baxter PJ. Medical effects of volcanic eruptions: I. Main causes of death andinjury. Bull Volcanol. 1990;52:532–44.
Baxter PJ, Gresham A. Deaths and injuries in the eruption of Galeras Volcano,Colombia, 14 January 1993. J Volcanol Geotherm Res. 1997;77:325–38.
Baxter PJ, Bernstein RS, Falk H, French J, Ing R. Medical aspects of volcanicdisaster: an outline of hazards and emergency response measures. Disasters.1982;6(4):268–76.
Baxter PJ, Kapila M, Mfonfu D. Lake Nyos disaster, Cameroon, 1986: themedical effects of large scale emission of carbon dioxide? Br Med J.1989;298:1437–41.
Blong RJ. Volcanic hazards: a sourcebook on the effects of eruptions. AcademicPress Australia; 1984.
Bourdier J-L, Pratomo I, Thouret J-C, Boudon G, Vincent PM. Observations,stratigraphy and eruptive processes of the 1990 eruption of Kelut volcano,Indonesia. J Volcanol Geotherm Res. 1997;79:181–203.
Brown JM. Rotorua hot pools charged over artist’s death. 2003. http://www.nzherald.co.nz/nz/news/article.cfm?c_id=1&objectid=3536962. Accessed 12July 2017.
Brown SK, Loughlin SC, Sparks RSJ, Vye-Brown C, Barclay J, Calder E, Cottrell E,Jolly G, Komorowski J-C, Mandeville C, Newhall C, Palma J, Potter S, ValentineG. Global volcanic hazard and risk. In: Loughlin SC, Sparks RSJ, Brown SK,Jenkins SF, Vye-Brown C, editors. Global Volcanic Hazards and Risk.Cambridge: Cambridge University Press; 2015a. p. 81–172.
Brown SK, Auker MR, Sparks RSJ. Populations around Holocene volcanoes anddevelopment of a Population Exposure Index. In: Loughlin SC, Sparks RSJ,Brown SK, Jenkins SF, Vye-Brown C, editors. Global Volcanic Hazards and Risk.Cambridge: Cambridge University Press; 2015b. p. 223–32.
Brown SK, Sparks RSJ, Jenkin SF. Global distribution of volcanic threat. In:Loughlin SC, Sparks RSJ, Brown SK, Jenkins SF, Vye-Brown C, editors. GlobalVolcanic Hazards and Risk. Cambridge: Cambridge University Press; 2015c. p.359–69.
Cantrell L, Young M. Fatal fall into a volcanic fumarole. Wilderness andEnvironmental Medicine. 2009;20:77–9.
Carey S, Sigurdsson H, Mandeville C, Bronto S. Pyroclastic flows and surges overwater: an example from the 1883 Krakatau eruption. Bull Volcanol. 1996;57:493–511.
Church F, Maudslay A, Gehrke AH, Anderson T. The volcanoes of Guatemala:Discussion. Geogr J. 1908;31:485–9.
Collins S. Sulphur City gases under scrutiny. New Zealand Herald; 2003. http://www.nzherald.co.nz/nz/news/article.cfm?c_id=1&objectid=3511691. Accessed12 July 2017.
CVGHM. Data Dasar Gunungapi Indonesia. 2014. http://www.vsi.esdm.go.id/index.php/gunungapi/data-dasar-gunungapi. Accessed 31 Jan 2017.
Eisele JW, O’Halloran RL, Reay DT, Lindholm GR, Lewman LV, Brady WJ. Deathsduring the May 18, 1980, eruption of Mount St. Helens. Med Int. 1981;305:931–6.
Ewert JW, Harpel CJ. In harm’s way: population and volcanic risk. Geotimes. 2004;49:14–7.
Furlan C. Extreme value methods for modelling historical series of large volcanicmagnitudes. Stat Model. 2010;10:113–32.
Global Volcanism Program. Report on El Chichon (Mexico). In: McClelland L,editor. Scientific Event Alert Network Bulletin, 7:5. Smithsonian Institution;1982. doi:10.5479/si.GVP.SEAN198205-341120. Accessed 13 Feb 2017.
Global Volcanism Program. Report on Arenal (Costa Rica). In: McClelland L, editor.Scientific Event Alert Network Bulletin, 13:17. Smithsonian Institution; 1988.doi:10.5479/si.GVP.SEAN198807-345033. Accessed 13 Feb 2017.
Global Volcanism Program. Report on Rabaul (Papua New Guinea). In: McClelland L,editor. Bulletin of the Global Volcanism Network, 15:16. Smithsonian Institution;1990. doi:10.5479/si.GVP.BGVN199006-252140. Accessed 13 Feb 2017.
Global Volcanism Program. Report on Lokon-Empung (Indonesia). In: McClellandL, editor. Bulletin of the Global Volcanism Network, 16:10. SmithsonianInstitution; 1991. doi:10.5479/si.GVP.BGVN199110-266100. Accessed 13 Feb2017.
Global Volcanism Program. Report on Marapi (Indonesia). In: McClelland L, editor.Bulletin of the Global Volcanism Network, 17:16. Smithsonian Institution;1992a. doi:10.5479/si.GVP.BGVN199206-261140. Accessed 13 Feb 2017.
Global Volcanism Program. Report on Dieng Volcanic Complex (Indonesia). In:McClelland L, editor. Bulletin of the Global Volcanism Network, 17:14.Smithsonian Institution; 1992b. doi:10.5479/si.GVP.BGVN199204-263200.Accessed 13 Feb 2017.
Global Volcanism Program. Report on Guagua Pichincha (Ecuador). In: Venzke E,editor. Bulletin of the Global Volcanism Network, 18:12. SmithsonianInstitution; 1993. doi:10.5479/si.GVP.BGVN199302-352020. Accessed 13 Feb2017.
Global Volcanism Program. Report on Manam (Papua New Guinea). In:Wunderman R, editor. Bulletin of the Global Volcanism Network, 21:12.Smithsonian Institution; 1996. doi:10.5479/si.GVP.BGVN199612-251020.Accessed 13 Feb 2017.
Global Volcanism Program. Report on Adatarayama (Japan). In: Wunderman R,editor. Bulletin of the Global Volcanism Network, 22:29. SmithsonianInstitution; 1997. doi:10.5479/si.GVP.BGVN199709-283170. Accessed 12 July2017.
Global Volcanism Program. Report on Semeru (Indonesia). In: Wunderman R,editor. Bulletin of the Global Volcanism Network, 25:27. SmithsonianInstitution; 2000. https://doi.org/10.5479/si.GVP.BGVN200007-263300.Accessed 13 Feb 2017.
Global Volcanism Program. Report on Raoul Island (New Zealand). In:Wunderman R, editor. Bulletin of the Global Volcanism Network, 31:33.Smithsonian Institution; 2006. doi:10.5479/si.GVP.BGVN200603-242030.Accessed 13 Feb 2017.
Global Volcanism Program. Report on Salak (Indonesia). In: Wunderman R, editor.Bulletin of the Global Volcanism Network, 32:39. Smithsonian Institution;2007. doi:10.5479/si.GVP.BGVN200709-263050. Accessed 12 July 2017.
Global Volcanism Program. Volcanoes of the World, v. 4.5.3. Venzke E, editor.Smithsonian Institution; 2013. doi:10.5479/si.GVP.VOTW4-2013. Accessed 19Dec 2016.
Jakarta Globe. Rescue chopper crashes while on the way to evacuate residentsfrom Dieng eruption. 2017. http://jakartaglobe.id/news/rescue-chopper-crashes-while-on-the-way-to-evacuate-residents-from-dieng-eruption/.Accessed 12 July 2017.
Gorshkov GS. Directed volcanic blasts. Bull Volcanol. 1963;26:83–8.Granieri D, Carapezza ML, Barberi F, Ranaldi M, Ricci T, Tarchini L. Atmospheric
dispersion of natural carbon dioxide emissions on Vulcano Island, Italy.J Geophys Res Solid Earth. 2014;119:5398–413.
Hansell A, Oppenheimer C. Health hazards from volcanic gases: a systematicliterature review. Arch Environ Heath. 2004;59:628–39.
Hayakawa Y. Catalog of volcanic eruptions during the past 2,000 years in Japan.J Geogr. 1999;108(4):472–88.
Hildreth W, Fierstein J. The Novarupta-Katmai eruption of 1912 – largest eruptionof the twentieth century: centennial perspectives. US Geological SurveyProfessional Paper 1791. 2012.
Hill PM. Possible asphyxiation from carbon dioxide of a cross-country skier ineastern California: a deadly volcanic hazard. Wilderness and EnvironmentalMedicine. 2000;11:192–5.
Brown et al. Journal of Applied Volcanology (2017) 6:15 Page 19 of 20
Horwell CJ, Baxter PJ. The respiratory health hazards of volcanic ash: a review forvolcanic risk mitigation. Bull Volcanol. 2006;69:1–24.
Hunter D. Dedication: The geologists who died at Mount St. Helens. ScientificAmerican; 2012a. https://blogs.scientificamerican.com/rosetta-stones/dedication-the-geologists-who-died-at-mount-st-helens/. Accessed 24 Jan2017.
Hunter D. The cataclysm: “Vancouver! Vancouver! This is it!”. Scientific American;2012b. Online at: https://blogs.scientificamerican.com/rosetta-stones/the-cataclysm-vancouver-vancouver-this-is-it/. Accessed 24 Jan 2017.
Japan Meteorological Agency and Volcanological Society of Japan (eds). VolcanicFatalities in Japan. Japan Meteorological Agency. 2013. http://www.data.jma.go.jp/svd/vois/data/tokyo/STOCK/souran_eng/menu.htm. Accessed 1 May 2015.
Jenkins S, Magill C, McAneney J, Blong R. Regional ash fall hazard I: a probabilisticassessment methodology. Bull Volcanol. 2012;74:1699–712.
Johnson RW. Fire Mountains of the Islands: A history of volcanic eruptions anddisaster management in Papua New Guinea and the Solomon Islands.Canberra: ANU E Press; 2013.
Kling GW, Clark MA, Wagner GN, Compton HR, Humphrey AM, Devine JD, EvansWC, Lockwood JP, Tuttle ML, Koenigsberg EJ. The 1986 Lake Nyos GasDisaster in Cameroon, West Africa. Science. 1987;236:169–75.
Komorowski JC, Tedesco D, Kasereka M, Allard P, Papale P, Vaselli O, Durieux J,Baxter P, Halbwachs M, Akumbe M, Baluku B, Briole P, Ciraba M, Dupin JC,Etoy O, Garcin D, Hamaguchi H, Houlie N, Kavotha KS, Lemarchand A,Lockwood J, Lukaya N, Mavonga G, De Michelle M, Mpore S, Mukambilwa K,Munyololo F, Newhall C, Ruch J, Yalire M, Wafula M. (2002-2003) The January2002 flank eruption of Nyiragongo volcano (Democratic Republic of Congo):Chronology, evidence for a tectonic rift trigger, and impact of lava flows onthe city of Goma. Acta Vulcanol 14/15:27-62.
Lalasz CB. Risky behaviours in Yellowstone National Park: the potential role ofdecision-making and justice on vistor’s behaviour. Hum Dimens Wildl. 2013;18(3):181–93.
Latter JH. Tsunamis of volcanic origin: summary of causes, with particularreference to Krakatoa, 1883. Bull Volcanol. 1981;44(3):467–90.
Luhr JF, Carmichael ISE. The Colima Volcanic Complex, Mexico: I. Post-calderaandesites from Volcán Colima. Contrib Mineral Petrol. 1980;71:343–72.
Maeno F, Taniguchi H. Spatiotemporal evolution of a marine caldera-formingeruption, generating a low-aspect ratio pyroclastic flow, 7.3 ka, Kikai caldera,Japan: Implication from near-vent eruptive deposits. J Volcanol GeothermRes. 2007;167:212–38.
McNutt SR, Williams ER. Volcanic lightning: global observations and constraintson source mechanisms. Bull Volcanol. 2010;72:1153–67.
Mettler K. Man’s death shows the enticing beauty-and deadly power- ofYellowstone’s colourful hot springs. The Washington Post; 2016. https://www.washingtonpost.com/news/morning-mix/wp/2016/06/09/mans-death-shows-the-enticing-beauty-and-deadly-power-of-yellowstones-colorful-hot-springs/.Accessed 13 Feb 2017.
Minakami T. Report on volcanic activities and volcanological studies in Japan forthe period from 1951 to 1954. Bull Volcanol. 1956;18:39–76.
Ministry of Land, Infrastructure and Transport. Unzen-Fugendake eruptionexecutive summary, 1990–1995. Unzen Restoration Project Office, KyushuRegional Construction Bureau. 2007. www.sabo-int.org/projects/unzen_01.pdf. Accessed 13 Feb 2017.
Nakada S, Shimizu H, Ohta K. Overview of the 1990-1995 eruption at UnzenVolcano. J Volcanol Geotherm Res. 1999;89:1–22.
Ng’Walali PM, Koreeda A, Kibayashi K, Tsunenari S. Fatalities by inhalation ofvolcanic gas at Mt. Aso crater in Kumamoto, Japan. Legal Med. 1999;1:180–4.
Olson S. Eruption: the untold story of Mount St. Helens. W.W. New York: Nortonand Company; 2016.
Oppenheimer C. Climatic, environmental and human consequences of thelargest known historic eruption: Tambora volcano (Indonesia) 1815. ProgPhys Geogr. 2003;27:230.
Rougier J, Sparks RSJ, Cashman KV. Global recording rates for large eruptions.J Appl Volcanol. 2016;5:11.
Scott KM, Vallance JW, Kerle N, Macias JL, Strauch W, Devoli G. Catastrophicprecipitation-triggered lahar at Casita volcano, Nicaragua: occurrence, bulkingand transformation. Earth Surf Process Landf. 2004;30:59–79.
Seattle Times (1992) Colo. Woman Dies; Seattle Man Escapes. The Seattle Times.http://community.seattletimes.nwsource.com/archive/?date=19920226&slug=1477840. Accessed 31 Jan 2017.
Siebert L, Simkin T, Kimberly P. Volcanoes of the World. Berkeley: University ofCalifornia Press; 2010.
Sigurdsson H, Devine JD, Tchoua FM, Presser TS, Pringle MKW, Evans WC. Originof the lethal gas burst from Lake Monoun, Cameroun. J Volcanol GeothermRes. 1987;31:1–16.
Simkin T. Terrestrial volcanism in space and time. Annu Rev Earth Planet Sci.1993;21:427–52.
Simkin TA, Siebert L, Blong R. Volcano fatalities – lessons from the historicalrecord. Science. 2001;291(5502):255.
Spence RJS, Kelman I, Baxter PJ, Zuccaro G, Petrazzuoli S. Residential building andoccupant vulnerability to tephra fall. Nat Hazards Earth Syst Sci. 2005;5:477–94.
Stearns HT. The Keaiwa or 1823 lava flow from Kilauea volcano, Hawaii. TheJournal of Geology. 1926;34:336–51.
Surono JP, Pallister J, Boichu M, Buongiorno MF, Budisantoso A, Costa F,Andreastuti S, Prata F, Scchneider D, Clarisse L, Humaida H, Sumarti S,Bignani C, Griswold J, Carn S, Oppenheimer C, Lavigne F. The 2010 explosiveeruption of Java’s Merapi volcano – a ‘100-year’ event. J Volcanol GeothermRes. 2012;241-242:121–35.
Taylor GA. The 1951 eruption of Mount Lamington, Papua. Department ofNational Development, Bureau of Mineral Resources, Geology andGeophysics Bulletin; 1958. No. 38.
Thorarinsson S. The eruption of Mt. Hekla 1947-1948. Bull Volcanol. 1950;10:157–68.Thouret J-C, Lavigne F, Kelfoun K, Bronto S. Toward a revised hazard assessment
at Merapi volcano, Central Java. J Volcanol Geotherm Res. 2000;100:479–502.United Nations. Sendai Framework for Disaster Risk Reduction 2015–2030.
Geneva; 2015.Walker GPL. Lengths of lava flows. Philos Trans R Soc Lond. 1973;274:107–18.Walker GPL. Ignimbrite types and ignimbrite problems. J Volcanol Geotherm Res.
1983;17:65–88.Waythomas CF. Water, ice and mud: lahars and lahar hazards at ice- and snow-
clad volcanoes. Geol Today. 2014;30:34–9.Whittlesey LH. Death in Yellowstone, deaths and foolhardiness in the first
national park. Roberts Rinehart; 1995.Wilson T, Kaye G, Stewart C, Cole J. Impacts of the 2006 eruption of Merapi
volcano, Indonesia, on agriculture and infrastructure. GNS Science Report.2007.
Witham CS. Volcanic disasters and incidents: a new database. J VolcanolGeotherm Res. 2005;148:191–233.
Brown et al. Journal of Applied Volcanology (2017) 6:15 Page 20 of 20