volcanic hazard impacts to critical infrastructure: a review · volcanic hazard impacts to critical...
TRANSCRIPT

Journal of Volcanology and Geothermal Research 286 (2014) 148–182
Contents lists available at ScienceDirect
Journal of Volcanology and Geothermal Research
j ourna l homepage: www.e lsev ie r .com/ locate / jvo lgeores
Review
Volcanic hazard impacts to critical infrastructure: A review
G. Wilson a,⁎, T.M. Wilson a, N.I. Deligne b, J.W. Cole a
a Department of Geological Sciences, University of Canterbury, Private Bag 4800, Christchurch 8140, New Zealandb GNS Science, PO Box 30368, Lower Hutt 5040, New Zealand
⁎ Corresponding author. Tel.: +64 3 364 2987.E-mail addresses: [email protected] (G
(J.W. Cole).
http://dx.doi.org/10.1016/j.jvolgeores.2014.08.0300377-0273/© 2014 The Authors. Published by Elsevier B.V(http://creativecommons.org/licenses/by-nc-nd/3.0/).
a b s t r a c t
a r t i c l e i n f oArticle history:Received 15 July 2014Accepted 13 August 2014Available online 10 September 2014
Keywords:VulnerabilityImpact quantificationDamage stateDisruptionFragility functionVulnerability functionVolcanic risk
Effective natural hazard risk assessment requires the characterisation of both hazards and vulnerabilities ofexposed elements. Volcanic hazard assessment is at an advanced state and is a considerable focus of volcanic sci-entific inquiry, whereas comprehensive vulnerability assessment is lacking. Cataloguing and analysing volcanicimpacts provide insight on likely societal and physical vulnerabilities during future eruptions. This paper reviewsdocumented disruption and physical damage of critical infrastructure elements resulting from four volcanichazards (tephra fall, pyroclastic density currents, lavaflows and lahars) of eruptions in the last 100 years.Wede-fine critical infrastructure as including energy sector infrastructure, water supply and wastewater networks,transportation routes, communications, and critical components. Common trends of impacts and vulnerabilitiesare summarised, which can be used to assess and reduce volcanic risk for future eruptions. In general, tephra fallscause disruption to these infrastructure sectors, reducing their functionality, whilst flow hazards (pyroclasticdensity currents, lava flows and lahars) are more destructive causing considerable permanent damage. Volcanicrisk assessment should include quantification of vulnerabilities and we challenge the volcanology community toaddress this through the implementation of a standardised vulnerability assessment methodology and thedevelopment and use of fragility functions, as has been successfully implemented in other natural hazard fields.
© 2014 The Authors. Published by Elsevier B.V. This is an open access article under the CC BY-NC-ND license(http://creativecommons.org/licenses/by-nc-nd/3.0/).
Contents
1. Introduction . . . . . . . . . . . . . . . . . . . . . . . . . . . . . . . . . . . . . . . . . . . . . . . . . . . . . . . . . . . . . . 1492. Natural hazard risk assessment . . . . . . . . . . . . . . . . . . . . . . . . . . . . . . . . . . . . . . . . . . . . . . . . . . . . . 152
2.1. Natural hazard vulnerability assessments . . . . . . . . . . . . . . . . . . . . . . . . . . . . . . . . . . . . . . . . . . . . . 1522.2. Volcanic perspective on vulnerability assessments . . . . . . . . . . . . . . . . . . . . . . . . . . . . . . . . . . . . . . . . . 154
2.2.1. Data sources . . . . . . . . . . . . . . . . . . . . . . . . . . . . . . . . . . . . . . . . . . . . . . . . . . . . . . 1542.2.2. Quantifying vulnerability . . . . . . . . . . . . . . . . . . . . . . . . . . . . . . . . . . . . . . . . . . . . . . . . 1542.2.3. Challenges in assessing physical vulnerability . . . . . . . . . . . . . . . . . . . . . . . . . . . . . . . . . . . . . . . 155
3. Historically observed impacts to critical infrastructure . . . . . . . . . . . . . . . . . . . . . . . . . . . . . . . . . . . . . . . . . . . 1583.1. Electrical supply networks . . . . . . . . . . . . . . . . . . . . . . . . . . . . . . . . . . . . . . . . . . . . . . . . . . . . 158
3.1.1. Insulator flashover . . . . . . . . . . . . . . . . . . . . . . . . . . . . . . . . . . . . . . . . . . . . . . . . . . . 1583.1.2. Damage to electrical lines . . . . . . . . . . . . . . . . . . . . . . . . . . . . . . . . . . . . . . . . . . . . . . . . 1583.1.3. Damage at generation sites . . . . . . . . . . . . . . . . . . . . . . . . . . . . . . . . . . . . . . . . . . . . . . . . 1583.1.4. Clean-up disruption . . . . . . . . . . . . . . . . . . . . . . . . . . . . . . . . . . . . . . . . . . . . . . . . . . . 159
3.2. Water supply networks . . . . . . . . . . . . . . . . . . . . . . . . . . . . . . . . . . . . . . . . . . . . . . . . . . . . . 1613.2.1. Physical damage . . . . . . . . . . . . . . . . . . . . . . . . . . . . . . . . . . . . . . . . . . . . . . . . . . . . 1623.2.2. Disruption to water treatment . . . . . . . . . . . . . . . . . . . . . . . . . . . . . . . . . . . . . . . . . . . . . . 1623.2.3. Water quality impacts . . . . . . . . . . . . . . . . . . . . . . . . . . . . . . . . . . . . . . . . . . . . . . . . . . 1623.2.4. Water shortages . . . . . . . . . . . . . . . . . . . . . . . . . . . . . . . . . . . . . . . . . . . . . . . . . . . . 163
3.3. Wastewater treatment networks . . . . . . . . . . . . . . . . . . . . . . . . . . . . . . . . . . . . . . . . . . . . . . . . . 1633.3.1. Physical damage . . . . . . . . . . . . . . . . . . . . . . . . . . . . . . . . . . . . . . . . . . . . . . . . . . . . 163
. Wilson), [email protected] (T.M. Wilson), [email protected] (N.I. Deligne), [email protected]
. This is an open access article under the CC BY-NC-ND license

149G. Wilson et al. / Journal of Volcanology and Geothermal Research 286 (2014) 148–182
3.3.2. Treatment disruption . . . . . . . . . . . . . . . . . . . . . . . . . . . . . . . . . . . . . . . . . . . . . . . . . . 1643.4. Transportation networks . . . . . . . . . . . . . . . . . . . . . . . . . . . . . . . . . . . . . . . . . . . . . . . . . . . . . 164
3.4.1. Road networks and vehicles . . . . . . . . . . . . . . . . . . . . . . . . . . . . . . . . . . . . . . . . . . . . . . . 1643.4.2. Rail network and trains . . . . . . . . . . . . . . . . . . . . . . . . . . . . . . . . . . . . . . . . . . . . . . . . . 1663.4.3. Ports and ships . . . . . . . . . . . . . . . . . . . . . . . . . . . . . . . . . . . . . . . . . . . . . . . . . . . . . 1673.4.4. Airports . . . . . . . . . . . . . . . . . . . . . . . . . . . . . . . . . . . . . . . . . . . . . . . . . . . . . . . . 168
3.5. Communication networks . . . . . . . . . . . . . . . . . . . . . . . . . . . . . . . . . . . . . . . . . . . . . . . . . . . . 1683.5.1. Physical damage to communication equipment . . . . . . . . . . . . . . . . . . . . . . . . . . . . . . . . . . . . . . 1683.5.2. Disruption to communication equipment . . . . . . . . . . . . . . . . . . . . . . . . . . . . . . . . . . . . . . . . . 168
3.6. Critical components . . . . . . . . . . . . . . . . . . . . . . . . . . . . . . . . . . . . . . . . . . . . . . . . . . . . . . . 1683.6.1. Physical damage to critical components . . . . . . . . . . . . . . . . . . . . . . . . . . . . . . . . . . . . . . . . . . 1693.6.2. Disruption to critical components . . . . . . . . . . . . . . . . . . . . . . . . . . . . . . . . . . . . . . . . . . . . 169
3.7. Buildings . . . . . . . . . . . . . . . . . . . . . . . . . . . . . . . . . . . . . . . . . . . . . . . . . . . . . . . . . . . . 1703.7.1. Physical damage from lateral loads . . . . . . . . . . . . . . . . . . . . . . . . . . . . . . . . . . . . . . . . . . . . 1703.7.2. Physical damage from static loads . . . . . . . . . . . . . . . . . . . . . . . . . . . . . . . . . . . . . . . . . . . . 1703.7.3. Other impact mechanisms . . . . . . . . . . . . . . . . . . . . . . . . . . . . . . . . . . . . . . . . . . . . . . . . 170
4. Characteristics of impacts to critical infrastructure . . . . . . . . . . . . . . . . . . . . . . . . . . . . . . . . . . . . . . . . . . . . . 1704.1. Disruption impacts to critical infrastructure . . . . . . . . . . . . . . . . . . . . . . . . . . . . . . . . . . . . . . . . . . . . 171
4.1.1. Critical infrastructure disruption from direct hazard impacts . . . . . . . . . . . . . . . . . . . . . . . . . . . . . . . . 1714.1.2. Critical infrastructure disruption during clean-up operations . . . . . . . . . . . . . . . . . . . . . . . . . . . . . . . . 1724.1.3. Critical infrastructure disruption in exclusion zones . . . . . . . . . . . . . . . . . . . . . . . . . . . . . . . . . . . . 172
4.2. Physical damage to critical infrastructure . . . . . . . . . . . . . . . . . . . . . . . . . . . . . . . . . . . . . . . . . . . . . 1734.3. Estimating critical infrastructure vulnerability . . . . . . . . . . . . . . . . . . . . . . . . . . . . . . . . . . . . . . . . . . . 173
4.3.1. Hazard intensity metrics . . . . . . . . . . . . . . . . . . . . . . . . . . . . . . . . . . . . . . . . . . . . . . . . 1734.3.2. Disruption and damage states . . . . . . . . . . . . . . . . . . . . . . . . . . . . . . . . . . . . . . . . . . . . . . 1734.3.3. Interactions between volcanic hazards . . . . . . . . . . . . . . . . . . . . . . . . . . . . . . . . . . . . . . . . . . 177
5. Future direction . . . . . . . . . . . . . . . . . . . . . . . . . . . . . . . . . . . . . . . . . . . . . . . . . . . . . . . . . . . . 1785.1. Implications for volcanic risk assessment . . . . . . . . . . . . . . . . . . . . . . . . . . . . . . . . . . . . . . . . . . . . . 1785.2. Goals for the next 10 to 25 years . . . . . . . . . . . . . . . . . . . . . . . . . . . . . . . . . . . . . . . . . . . . . . . . . 179
6. Summary . . . . . . . . . . . . . . . . . . . . . . . . . . . . . . . . . . . . . . . . . . . . . . . . . . . . . . . . . . . . . . . 179Acknowledgements . . . . . . . . . . . . . . . . . . . . . . . . . . . . . . . . . . . . . . . . . . . . . . . . . . . . . . . . . . . . . 180References . . . . . . . . . . . . . . . . . . . . . . . . . . . . . . . . . . . . . . . . . . . . . . . . . . . . . . . . . . . . . . . . . 180
1. Introduction
The aim of natural hazard risk assessment is to evaluate the extentand nature of risk in a particular area by evaluating potential hazardsthat together could harm people, property and services (UNISDR,2009). Risk assessments are an integral part of the risk managementprocess (Fig. 1) and comprise hazard, exposure and vulnerability assess-ments (Marzocchi et al., 2012). Recent natural disasters such as theEyjafjallajökull eruption in Iceland (2010), the Tōhoku earthquake andtsunami in Japan (2011), Hurricane Sandy in the USA (2012) and
Hazard assessment
Vulnerability assessment
Exposure assessment
Risk mitigation
Risk assessment
Risk management
Fig. 1. Schematic description of components and process followed during natural hazardrisk management.
Typhoon Haiyan in the Philippines (2013) highlight the need for effec-tive natural hazard risk management and sustainable development(UNISDR, 2014). Various studies have identified society's increasingvulnerability to disasters as a consequence of population expansion inhazardous areas and increasing economic and environmental strains(Rougier et al., 2013). Risk assessment and management are essentialfor identifying, avoiding and minimising losses associated with naturalhazard impacts. Usingquantitative risk assessment provides a numericalestimation of risk which can facilitate comparisons between differentnatural hazards and locations and allow prioritisation of risk mitigationstrategies to increase society's resilience to these hazards. Risk mitiga-tion strategies can be broadly classified as:
(1) Land-use planning (citing) used to decrease exposure of people,buildings and infrastructure to natural hazards.
(2) System and component design to improve resilience if exposedto natural hazards
(3) Contingency planning (i.e., preparedness and response) used toreduce the impacts of natural hazards and decrease restorationand recovery times.
A challenge for volcanic risk assessment is the multi-hazard charac-teristic of volcanic eruptions (Sparks et al., 2013). Tephra falls, pyroclasticdensity currents (PDCs), lava flows and lahars can occur simultaneouslyor sequentially and over differing spatial and temporal scales, potentiallyadversely affecting society (see Table 1 for hazard descriptions). Thethreat to society is considerable: there are at least ~600 million peopleliving in areas that could be affected by volcanic eruptions (Auker et al.,2013). As populations increase in volcanically active areas, exposureand vulnerability to volcanic hazards will increase (Chester et al., 2000).However, pre-emptive hazard assessment, volcanic monitoring, earlywarning, crisis management and other mitigative strategies can reducethe impact on society (Sparks et al., 2013). For example, the number oflikely fatalities was reduced by two orders of magnitude during the

Table 1Description of hazard origin, transport, composition, primary damaging characteristics and common hazard intensity metrics for tephra falls, pyroclastic density currents (PDCs), lava flows and lahars.
Hazard Hazard characteristics Primary damaging characteristics Hazard intensity metric (HIM) definitions
Tephra fall • Origin: explosive volcanic eruptions or fire fountaining as a resultof magma fragmentation.
• Transport: dispersed in convective eruption plumes up to 40–50 km vertically and thousands of kilometres laterally.a,b,c
• Composition: vitric (volcanic glass), crystalline and/or lithic par-ticles. Blocks and bombs (N64 mm in diameter), lapilli (2–64 mm) and ash (b2 mm).d
• Loading: relates tephra thickness and bulk density. Increased load-ing leads to structural damage of buildings and infrastructure.e
• Thickness: similar to loading and generally decreases exponentiallywith distance from the vent.f
• Dispersal: tephra can be dispersed over wide extents. Tephra de-posits may be eroded and remobilised by wind and/or water forlong periods post-eruption.g
• Grainsize: smaller particles are dispersed further from the vent andcan penetrate smaller openings than larger particles.
• Surface chemistry: tephra particles have surface coatings of solublesalts as a result of scavenging in volcanic plumes.h Salts may bereleased upon contact with water, resulting in watercontamination.i Acidic coatings may cause corrosion of metals.j
• Abrasiveness: tephra is highly abrasive due to the hardness andangular morphology of individual particles.k
• Thickness (common unit: mm): accumulated thickness of tephrafall.
• Static load (common units: kg/m2, kPa): mass of tephra per unitarea on a surface. Indicates load on an object in the vertical direc-tion.
• Particle density (common unit: kg/m3): the density of individualparticles influences their mobility and settling rate in liquids.
• Surface chemistry (common unit: mg/kg dry weight for individualelements): concentration of soluble salt layer on the surface oftephra particles.
• Grainsize: particle size distribution of tephra at a particular site.• Moisture content (common unit: vol. %): water content of tephradeposit. Influenced by plume dynamics, environmental conditionsduring and subsequent to deposition.
• Hardness: particle hardness influences abrasiveness of tephra de-posits.
• Atmospheric concentration (common unit: μg/m3): concentrationof tephra particles suspended in air. Is relevant for aircraft safety,visibility and human health.
PDC • Origin: (1) collapse of an unstable eruption column, (2) directedblast, (3) low pyroclastic fountaining, and (4) lava domecollapse.b,l,m
• Transport: gravity-driven flows which accelerate down slope atvelocities up to 300 m/sn and travel distances of tens ofkilometres.o
• Composition: mixtures of generally hot volcanic ejecta and gas.p
• Dynamic pressure: relate the flows density to its velocity. Dynamicpressures can be on the order of tens of kilopascalsq enough todamage or destroy buildings and infrastructure.
• Run-out distance: PDCs can flow distances of tens of kilometres, aregenerally confined to valleys,o although overtopping can unpre-dictably occur.m
• Temperature: may reach 1100 °Cm, sufficient to burn commonbuilding materials.r
• Abrasiveness: pyroclastic material is highly abrasive and in combi-nation with high flow velocity can cause significant abrasion toimpacted surfaces.
• Dynamic pressure (common unit: kPa): the kinetic energy per unitvolume of the flow which changes with flow density and velocity.Used to infer lateral impacts.
• Velocity (common unit: m/s): velocity of the PDC during emplace-ment. Can be used instead of dynamic pressure if PDC density isunknown.
• Temperature (common unit: °C): temperature of the PDC at em-placement.
• Thickness of deposit (common unit: mm): thickness of the PDCdeposit after emplacement has ceased.
Lava flow • Origin: outpourings of molten rock from volcanic vents or fissures.• Transport: flows emplaced as a dynamically continuous unit elon-gated downslope. Lengths are typically b10 km and velocities~10's km/h, although higher velocities are documented.s
• Composition: the majority of flows are basaltic in composition al-though high silica and non-silicate flows occur.s,t
• Morphology: flows tend to travel along confined paths as cohesive,sometimes massive, units (10 m thick) which impact and inun-date objects in the flow path. Flows solidify on cooling.
• Temperature: are between 800–1200 °Cs during eruption, suffi-cient to ignite fires.
• Presence of lava: whether lava is present at a particular location,regardless of lava flow depth.
• Depth of flow (common unit: mm): depth of the solidified lavaflow.
• Dynamic pressure (common unit: kPa): the kinetic energy per unitvolume of the flow which changes with flow density and velocity.Used to infer lateral impacts.
• Velocity (common unit: m/s): velocity of the lava flow during em-placement. Can be used instead of dynamic pressure if flow densi-ty is unknown.
• Temperature (common unit: °C): temperature of the flow. Ambienttemperature around flow margins is equally important for infra-structure damage considerations.
150G.W
ilsonetal./JournalofV
olcanologyand
Geotherm
alResearch286
(2014)148
–182

• Cooling duration (common units: hours, days): time that it takesfor a lava flow to cool sufficiently to reinstate infrastructure on topof flow.
Lahar • Origin: (1) eruption of hot pyroclastic material onto ice or snow,(2) eruptions through crater lakes, (3) breakout of crater lakes orother water bodies, and (4) rainfall after eruptions of voluminoustephra.u
• Transport: gravity-driven flows which travel downslope at veloci-ties of 10 m/s and travel 10's km.b
• Composition: slurry of volcaniclastic material (i.e., tephra) andwater other than normal streamflow.v
• Velocity: can travel at high velocities which can partially damageor destroy buildings and infrastructure in flow path.
• Erosive: commonly erosive which can destabilise structures (e.g.,bridge piers and abutments) located in or near to flow channels.
• Run-out distance: can travel for long distances and inundate largeareas.
• Depth: commonly up to tens of metres in valleys and thin veneersoutside of valleysw which is sufficient to bury infrastructure andsometimes inundate buildings and structure.
• Temporal: lahars may occur post eruption (“secondary”) for manyyears as rain remobilises pyroclastic material, prolonging hazardimpact.x
• Dynamic pressure (common unit: kPa): the kinetic energy per unitvolume of the flow which changes with flow density and velocity.Used to infer lateral impacts.
• Velocity (common unit: m/s): velocity of the lahar during em-placement. Can be used instead of dynamic pressure if lahar den-sity is unknown.
• Thickness of deposit (common unit: mm): thickness of the lahardeposit remaining after emplacement.
• Depth of flow (common unit: mm): depth of the lahar during em-placement. Depth of flow can be greater than deposit thickness.
a Carey and Bursik (2000).b Parfitt and Wilson (2008).c Lockwood and Hazlett (2010).d Cashman et al. (2000).e Spence et al. (1996).f Johnston (1997).g Wilson et al. (2011).h Óskarsson (1980).i Witham et al. (2005).j Oze et al. (2013).k Wilson et al. (2012b).l Branney and Kokelaar (2002).m Nakada (2000).n Wilson and Houghton (2000).o Valentine and Fisher (2000).p Burgisser and Bergantz (2002).q Clarke and Voight (2000).r Blong (1984).s Kilburn (2000).t Griffiths (2000).u Waitt (2013).v Smith and Fritz (1989).w Vallance (2000).x Gran et al. (2011).
151G.W
ilsonetal./JournalofV
olcanologyand
Geotherm
alResearch286
(2014)148
–182

152 G. Wilson et al. / Journal of Volcanology and Geothermal Research 286 (2014) 148–182
1991 eruption of Mt. Pinatubo, Philippines when thousands of peoplewere evacuated prior to the climactic eruption (Sparks et al., 2013). Thedeath toll since 1900 from volcanic eruptions is small compared toother natural hazards; for example, in that time period there were~280,000 fatalities from volcanic eruptions (Auker et al., 2013) comparedto N2million from earthquakes (Holzer and Savage, 2013). However, dis-ruption, damage and economic loss from volcanic eruptions are consider-able, althoughhard to quantify (Sparks et al., 2013). One aspect ofmodernsociety that is commonly and sometimes severely disrupted anddamagedby volcanic hazards is critical infrastructure (Blong, 1984; Wilson et al.,2012b), the focus of this paper. Critical infrastructure is defined as a net-work of man-made systems and processes that function collaborativelyto produce and distribute essential goods and services (Rinaldi et al.,2001) which are heavily relied upon by society for daily function (Dunnet al., 2013). The critical infrastructure discussed here includes electricalsupply networks, water andwastewater networks, terrestrial transporta-tion networks and communications. We also consider buildings, heating,ventilation and air conditioning (HVAC) systems and electronic equip-ment common to all infrastructure sectors. There has been a lack ofsystematic, quantitative collection and reporting of impacts to criticalinfrastructure, which has hindered quantitative risk assessment.
In this review we build an evidence base of disruption and directdamage to critical infrastructure sectors from tephra falls, PDCs, lavaflows and lahars, and distil common impact trends to contribute to im-proved quantitative volcanic risk assessment. Section 2 of this paperplaces this review in the context of natural hazard risk assessment andsummarises physical vulnerability assessments in volcanology andother natural hazards whilst also highlighting some of the challengesfacedwith adoption of robust quantitative volcanic vulnerability assess-ment. Section 3 summarises the current knowledge of physical impactsto critical infrastructure from volcanic hazards highlighting vulnerableinfrastructure components and impact mechanisms from a range of in-ternational case studies. In Section 4wediscuss general trends in impactseverity and at which hazard intensities disruption and damagemay belikely to occur for each hazard.We also provide an approach to estimatevulnerability with impact states and fragility functions. We conclude inSection 5 with a discussion of future directions for continued develop-ment of quantitative physical vulnerability assessment with the goalto improve volcanic risk assessment. Definitions of terms used through-out this review are in Table 2.
2. Natural hazard risk assessment
Natural hazard risk assessments combine hazard, exposure, and vul-nerability assessments (Fig. 1) in order to determine the risk posed to asite, area or region from a single- or multi-hazard source. Risk assess-ment informs the development of mitigation strategies and effectiverisk management, reducing loss and increasing resilience (Papathoma-Köhle et al., 2011). We provide a brief description of these assessmentsand refer the reader to Rougier et al. (2013) and Smith (2013) for in-depth reviews of natural hazard and risk assessments.
Hazard assessment procedures are similar for all natural hazards andconcern determining hazard occurrence frequency, the spatial extent(hazard footprint) and hazard intensities (e.g., tephra thickness) withinthe hazard footprint (Smith, 2013). Deterministic (scenario-based) orprobabilistic (range of scenarios) hazard models are used, the choiceof which is determined by data availability and the type of assessmentrequired (Panza et al., 2011). Hazard assessment outputs are commonlyin the form of hazardmapswhich showhazard intensity as a function ofspatial extent or hazard curves which show exceedance probability ofcertain hazard intensities at a given location. Exposure assessments iden-tify the number, typology and location of elements (e.g., buildings, infra-structure and people) which have the potential to be impacted by thehazard(s) of interest. Exposure assessments can be at any scale, fromsite specific to regional, although an inverse relationship generally existsbetween level of detail and spatial scale. These assessments commonly
make use of existing asset inventory data sets (e.g., asset databasesheld by local and regional authorities: Schmidt et al., 2011), althoughproject specific data sets may be obtained through field investigationor remote sensing (e.g., Foulser-Piggott et al., 2014; Jenkins et al.,2014a). Vulnerability assessments are concernedwith the consequencesof natural hazard impacts on exposed elements and may be undertakenin physical, economic and/or social contexts (Fuchs et al., 2012) (seeSection 2.1 for a detailed discussion).
Risk assessments are the combination of hazard, exposure andvulnerability assessments (Fig. 1) and determine the nature and ex-tent of risk to a site, area or region of interest. Assessments can bequalitative (descriptive data) or quantitative (measurable data) ora combination of both, depending on the nature of available dataand the purpose of the assessment (Jelínek et al., 2012). If possible,quantitative assessments are preferred because they can facilitate amore precise comparison between risks, although results can beexpressed using qualitative descriptions such as ‘high’, ‘medium’ or‘low’ risk (Jelínek et al., 2012) to facilitate effective communication(Uzielli et al., 2008). There is an increasing use of multi-hazard riskassessment (e.g., Schneider and Schauer, 2006; Schmidt et al.,2011; Marzocchi et al., 2012; UNISDR, 2013) for particular sites or re-gions that may be impacted by more than one natural hazard as thecombined effect of all hazards influences risk (Zuccaro et al., 2008).Hazard, exposure and vulnerability assessments for each hazard arecombined to create a multi-hazard risk index or ranking for a partic-ular area (Marzocchi et al., 2012).
Whilst in theory both hazard and vulnerability aspects of risk assess-ment should be advanced to the same level of detail, there is often dis-crepancy between the two, notably for volcanic hazards (Sparks et al.,2013). Quantitative assessments of various volcanic hazards and theirprocesses are well advanced (e.g., Bonadonna, 2006; Wadge, 2009;Jenkins et al., 2012), with fieldwork, laboratory studies and numericalmodels providing qualitative outputs for the spatial and temporal ex-tent and intensities of hazards, whilst taking into account uncertainties.Vulnerability assessments are less advanced. For tephra fall and PDCthere has been steady progress in qualitative understanding of vulnera-bility for structures, agriculture and some critical infrastructure, howev-er quantitative assessment of vulnerability over a range of hazardintensities is more sparse. This lack of comprehensive understandingcan preclude robust quantitative volcanic risk assessment (Wilsonet al., 2012b; Jenkins et al., 2014a).
2.1. Natural hazard vulnerability assessments
There are different types of vulnerability (e.g., physical, social, eco-nomic; see Fuchs et al., 2012); in this paper we restrict our focus tophysical vulnerability, that is, the susceptibility of an infrastructure sys-tem or component to impact from a natural hazard. There are threemain approaches for physical vulnerability assessment: the use of vul-nerability indicators, damage matrices, and fragility or vulnerabilityfunctions (Kappes et al., 2012). Fig. 2 briefly summarises these ap-proaches and provides examples of when they may be used in volcanicvulnerability assessment.
Data for deriving physical vulnerability assessments come from em-pirical, analytical, expert judgement, and hybrid sources (Rossetto andElnashai, 2003). Table 3 presents some of the advantages and disadvan-tages of each approach. The most common data source for all naturalhazards, including volcanic eruptions, is observational (empirical) datacollected during or immediately after a hazardous event. These dataare generally scarce due to the danger and limited access in impactedzones, the expense of collecting such data and the infrequent natureof some hazards (Jenkins et al., 2014a), although some remote sensingtechniques allow data collection in hazardous areas (e.g., Sanyal andLu, 2005; Mas et al., 2012; Dong and Shan, 2013; Jenkins et al., 2014a).The advantage of empirical data is that a range of hazard intensitiesand exposed element properties are taken into account, which are

Table 2Definitions of terms used throughout this review.
Term Definition Reference
Natural hazard A dangerous natural phenomenon that may cause loss of life, property damage and disruption. UNISDR (2009)Exposure People, property, systems and other elements present in the hazard zone that are subject to potential loss. UNISDR (2009)Vulnerability The characteristic of an element that makes it susceptible to the effects of a hazard. UNISDR (2009)Risk The combination of the probability of an event and its negative consequences. UNISDR (2009)Risk assessment A methodology to determine the nature and extent of risk. UNISDR (2009)Risk management The systematic approach of managing uncertainty and minimising potential loss through the implementation of
mitigation strategies.UNISDR (2009)
Resilience The ability of a system to absorb and recovery from the effects of a hazard. UNISDR (2009)Critical infrastructure A network of man-made systems and processes that function collaboratively to produce and distribute essential goods
and services.Sectors include: electrical supply networks, water and wastewater networks, transportation routes, communications,electronics and air conditioning.
Rinaldi et al. (2001)
Impact Function of the hazard and vulnerability on the exposed asset. Jenkins et al. (2014b)Impact mechanism The different methods by which a natural hazard can impact infrastructure. –
Impact severity The relative level of damage to elements. –
Disruption Impact caused to infrastructure prior to the onset of physical damage. –
Physical damage General term to describe damage to infrastructure causing complete loss of function until repair or replacement isundertaken.
–
Hazard intensity The magnitude of a hazard at a particular site. We use the terms “low” and “high” to describe the end members ofhazard intensity.
–
Hazard intensity metric (HIM) Different hazard properties which can impact infrastructure. These properties can be measured and are related to thelevel of impact.
–
Fragility function Equations which express the probability of differing levels of damage sustained for different infrastructure as afunction of hazard intensity.
Rossetto et al. (2013)
Mitigation The lessening of the adverse impacts of hazards through policy or structural strategies. UNISDR (2009)
153G. Wilson et al. / Journal of Volcanology and Geothermal Research 286 (2014) 148–182
often difficult to include in models. Empirical data can also be used toconfirm and calibrate other data sources and assessments (e.g., Turneret al., 2013), although this is unfortunately rare (Rossetto andElnashai, 2003). In the absence of empirical data, other forms of data
Description
Vulnerability • Vulnerability
information rKappes et al
• Widely used assessment spectrum of
Example:Vulnerability inhazard level a
Damage matr• Define the pr
element at a Rossetto et a
• Matrices mayvulnerability
• Used when ispecific haza
Example:Probability of EPDC intensity.
Fragility func• Quantitativel
function of ha• Used when t• Requires larg
Example:Probability of rtephra load forfrom Elsevier)
0
0.2
0.4
0.6
0.8
1
0 5 10 15 20
Tephra load (kPa)
Class A
Class B
Class C1
Class C2
Class D
Roof class
Vulnerability approach example
Damage level
PDC intensity
4 kPa 6 kPa 8 kPa 10 kPa
D0 0.0 0.00.1 0.0 0.0
D1 0.1 0.2 0.0 0.0
D2 0.19 0.13 0.0 0.0
D3 0.28 0.31 0.0 0.0
D4 0.3 0.31 0.1 0.0
D5 0.15 0.54 0.9 1.0
Population exposure index
Volcanic hazard level
1 (low) 2 3 (high)
0-0.5 1 1 1
1 1 2 2
1.5 1 2 3
2 2 2 3
2.5-3 2 3 3
Pro
babi
lity
of r
oof c
olla
pse
Fig. 2.Graphical representation and descriptions of the threemost common approaches to assetrices and fragility functions.Zuccaro et al. (2008).
such as analytical (experimental), expert judgement or hybrid combi-nations can be sought (Table 3).
A quick note on risk assessment in other natural hazard fields iswar-ranted to place volcanic risk assessment in context. Earthquake risk
indicatorindicators or indices represent a property of a system and provide egarding its susceptibility to natural hazard(s) impacts (Birkmann, 2006;., 2012).in social sciences, but less common in physical vulnerabilitydue to difficulties in applicability of indicators to characterise a large hazards (Kappes et al., 2012).
dices (coloured squares) for developing countries based upon volcanicnd population exposure. From Aspinall et al. (2011).
ixobability of a specific damage level being reached for a infrastructure specific hazard intensity level (Menoni, 2006; Kappes et al., 2012;l., 2013). only provide data for specific regions where elements fit defined
classes, limiting their wide applicability.nfrastructure damage can be easily assigned to a damage level and rd intensity.
uropean building class A being at a specific damage level for a specific D0-no damage, D5-complete damage. From Zuccaro et al. (2008).
tiony estimates the probability of a damage state being exceedance as a zard intensity.
here is sufficient hazard intensity data for all damage states.e statistically valid data sets.
eaching partial or total roof collapse (damage state D5) as a function of European roofs (reprinted from Zuccaro et al. (2008) with permission
.
ss natural hazard vulnerability: vulnerability indicators (Aspinall et al., 2011); damagema-

Table 3Advantages and disadvantages of the different methodological approaches used to develop fragility and vulnerability functions in natural hazard vulnerability assessment.Modified from Schultz et al. (2010).
Approach Data Advantages Disadvantages
Empirical • Controlled experiments• Post-event damage assessment
• Repeatable experiments• Range of hazard and infrastructurecharacteristics taken into account
• Difficulties in replicating natural hazards inlaboratory
• Site, region, structure specific• Scarce data of variable quality
Judgement-based • Expert elicitation • Assess wide range of impacts, someof which have not been previouslyobserved
• Not limited by impact data or models• Can be used to refine other functions
• Quality depends on expert's expertise andsubjectivity
• Can be difficult to validate• Differing and contradictory opinions
Analytical • Numerical modelling • Increased reliability and repeatabilityand reduced bias
• Can be extrapolated to new situations
• Substantial computation• Based on simplifications and assumptions
Hybrid • Combination of differentapproaches
• Reduce limitations by combining differentapproaches
• Reduce uncertainties in fragility functions
• Limitations are the same as individual approaches
Table 4Existing critical infrastructure fragility and vulnerability functions developed for differentvolcanic hazards. We found no published peer-reviewed fragility functions for water sup-ply, communication networks or lava flows. See Supplementary material 1 for a review ofthese functions.
Tephra fall PDC Lahar
Electrical supply a
Wastewater networks b
Transportation networks b
Buildings b,c,d d,e,f e
Critical components g
a Wardman et al. (2012c).b Kaye (2007).c Spence et al. (2005).d Zuccaro et al. (2008).e Zuccaro and De Gregorio (2013).f Spence et al. (2007).g Wilson et al. (2012a).
154 G. Wilson et al. / Journal of Volcanology and Geothermal Research 286 (2014) 148–182
assessment has well established quantitative vulnerability assessmentsthat estimate damage, disruption and casualty impacts (Reitherman,2012), which have informed the establishment of robust seismic build-ing codes; pioneeringwork began in the 1980s focusing on seismic safe-ty of nuclear power plants (e.g., Kennedy et al., 1980; Kennedy andRavindra, 1984). The field has well-established methods for post-earthquake building assessments (Rossetto et al., 2010) and for derivingfragility functions to probabilistically estimate structural damage(Porter et al., 2007). Other natural hazard fields employ similar empiri-cal approaches to earthquake vulnerability assessment but are less welldefined. Analytical modelling approaches are also used to develop fra-gility functions (e.g., Vaidogas and Juocevičius, 2008; Koshimura et al.,2009; Quan Luna et al., 2011). As afield, volcanology trails behind earth-quake risk assessments but is on par with landslide and tsunami riskassessment.
2.2. Volcanic perspective on vulnerability assessments
Volcanic risk assessment has typically focused on loss of life andtherefore physical vulnerability assessments have primarily targetedbuilding damage and occupant exposure with limited analysis of otherphysical societally-relevant assets such as critical infrastructure.
2.2.1. Data sourcesObservational data is the key data set for modern volcano risk as-
sessment, and began in earnest with observations in the aftermath ofthe 1980 eruption of Mt. St. Helens, USA which affected critical infra-structure, health and economic activities across Washington (Lipmanand Mullineaux, 1981). A formative review of the effects of volcaniceruptions is presented by Blong (1984), who documents a wide rangeof volcanic hazard impacts on buildings, infrastructure, agriculture,economy and people. The Blong (1984) review is a significant contribu-tion to the field and is the basis for the current understanding of impactsto the built environment and still relied upon heavily today. Since theeruption of Mt. St. Helens, field observations following eruptions fromMt. Pinatubo in 1991 (e.g., tephra induced building damage: Spenceet al., 1996), Rabaul in 1994 (e.g., tephra induced building damage:Blong, 2003a), Montserrat in 1997 (e.g., PDC induced building damage:Baxter et al., 2005), Merapi in 2010 (e.g., PDC induced building andinfrastructure damage: Jenkins et al., 2013) and other case studies(e.g., Wilson et al., 2012b; Jenkins et al., 2014a) have strengthened theknowledge regarding volcanic impacts to society, particularly aroundbuilding damage and occupant safety. In order to continue collectinghigh quality empirical data Jenkins et al. (2014a) proposes a standardisedphysical vulnerability survey methodology detailing minimum data re-quirements to ensure quantifiable data collection.
Where observational data are lacking, experimental assessment(e.g., Spence et al., 2004a; Zuccaro et al., 2008; Wardman et al., 2012c)has been used to estimate vulnerability. Experimental data are sparsedue to difficulties in accurately replicating somevolcanic hazard proper-ties in the laboratory (Jenkins et al., 2014a). Theoretical calculations(e.g., Petrazzuoli and Zuccaro, 2004; Jenkins et al., 2013) and expert elic-itation (e.g., Coppersmith et al., 2009; Aspinall and Crooke, 2013) canalso be used to produce both qualitative and quantitative vulnerabilityassessments that can be applied to a range of element typology and haz-ard properties.
2.2.2. Quantifying vulnerabilityQuantifying vulnerability of buildings is more common within the
literature as volcanic risk assessment is primarily concerned with lossof life. Jenkins et al. (2014b) suggest that vulnerability assessments ofbuildings can also be undertaken to: (1) identify buildings that maybenefit from mitigation measures; (2) quantify potential damage andloss of buildings following successful evacuation; and (3) support devel-opment of improved construction guidelines for new buildings. As such,numerous studies (Spence et al., 2005, 2007; Marti et al., 2008; Zuccaroet al., 2008) and field observations (Spence et al., 1996; Baxter et al.,2005; Jenkins et al., 2013) have quantitatively estimated building vul-nerability for volcanic hazards, particularly tephra falls and PDCs. Theoutputs of these studies are similar to those of earthquake risk assess-ment and describe building damage as a function of hazard intensityusing hazard intensity thresholds, damage matrices and fragility andvulnerability functions. See Supplementary material 1 for a brief reviewof fragility and vulnerability functions derived for volcanic hazards. Themajority of these studies have assessed vulnerability to European

155G. Wilson et al. / Journal of Volcanology and Geothermal Research 286 (2014) 148–182
buildings with a large focus on buildings in Naples, Italy and those sur-roundingMt. Vesuvius. The primary reason for the focus on these build-ings is because there is a large population living close to or on the flanksof one of the most dangerous volcanoes in the world (Baxter et al.,2008). As such, these assessments apply only to European building ty-pologies would need to be re-evaluated and refined for other areas ofinterest.
In contrast, vulnerability assessment for critical infrastructure sys-tems and components is not well established, with the majority of as-sessments qualitative in nature. However, damage or disruption tocritical infrastructure is likely to have a higher magnitude impact on so-ciety than building damage (Jenkins et al., 2014a) due to the intercon-nectedness of these infrastructure (Wilson et al., 2012b). The NewZealand Volcanic Impacts Study Group (NZ VISG) has over the past15–20 years systematically assessed tephra fall impacts to critical infra-structure through post eruption impact assessment and semi-structureinterviews with critical infrastructure managers (Wilson et al., 2012b,2014). These studies (e.g., Wilson et al., 2012b) provide a large amountof qualitative data describing the likely impacts and points of
Table 5Summary table of documented volcanic impacts to critical infrastructure grouped by decade in
Sector Damage Tephra fallsylppuslacirtcelE
Flashover # * §Abrasion – dry #Abrasion – wet *CorrosionGravel contaminationPhysical damage tolines
§
Water supplynetwork
Pump, motor abrasion # *Pipe, channel blockage × # *Pipe rupturesIntake & filter blockages
× *
Water quality decrease × # §Water shortages × *
Wastewater network
Pump, motor abrasion × #Pipe blockage × # §Infill of tanks §Filter blockage §Treatment disruption # §
TransportationRoad damageRoad burial/closure * §Vehicle damage # * §Traction/visibilityreduction
# * §
Airport closure or damage
× # *
Aircraft damage × # *Railway closure or damage
× #
Port closure or damage ×Ship damage §
CommunicationsPhysical damage # §Signal interference # * §
sgnidliuBLateral impact damageRoof damage/ collapse * §FireCorrosion *Gutter damage * §Burial × §
Criticalcomponents
Computer damage # §HVAC damage *
vulnerability for each critical infrastructure sector as a result of tephrafall. Some studies have attempted to quantitatively relate infrastructuredisruption and damage to hazard intensity using intensity thresholds(e.g., Jenkins et al., 2014b) and fragility functions (Table 4 and Supple-mentary material 1). However, these quantitative relationships havebeen based on few empirical data and therefore are associated withsizeable uncertainty. There is a need to refine infrastructure vulnerabil-ity estimates for tephra fall and volcanic flow hazards in order to haverobust volcanic risk assessments, hence the need for this review andcontinued and standardised research in this field.
2.2.3. Challenges in assessing physical vulnerability
There are a number of aspects when assessing physical vulnerabilityin regards to volcanic hazards which make fully-quantitative ap-proaches difficult to achieve. Douglas (2007) attributed this to a numberof challenges, including:
(1) Volcanic eruptions aremulti-hazard events and therefore criticalinfrastructure sites can by impacted by multiple sequential or
dicating the prevalence and occurrence of impacts over time.
PDCs Lava flows Lahars
++
*++
§ × § §
++ × *
* § × § §+ ×
+ §
+
# § × # § # * ++ § # § ++ # * # × #+ #
+ * § §
++ × # × #
+ ××
*+
× # * § + × # * § # * § ++ #
× * + # §
# § × # § # *
+

Table 6Summary of the main vulnerabilities for critical infrastructure sectors for impacts from tephra falls, PDCs, lava flows and lahars and whether impacts can be mitigated by site exclusion (avoidance), physical design of infrastructure or response andoperational planning.
Infrastructuresector
Hazard
Tephra fall PDC Lava flow Lahar
Electrical supply • Vulnerability: Flashover of insulators, abrasion ofHEP turbines, line breakage, tephra ingress intocritical equipment.
• Site exclusiona: No• Designb: Increase insulation and use of anti-pollution strategies to minimise flashover.Strengthen structures or use tephra shedding de-signs to minimise tephra loading. Increase sys-tem redundancy.
• Contingency planningc: Tephra clean-up opera-tions and methods. Use of backup generators.
• Vulnerability: Breakage of towers, poles and lines,damage to other structures, abrasion of HEP tur-bines.
• Site exclusion: Yes — where possible all equip-ment should be located away from valleys andknown flow paths.
• Design: Strengthen some structures if possible.Locating services underground.
• Contingency planning: Clean-up operations andmethods.
• Vulnerability: Breakage of towers, poles and lines,damage and inundation to other structures.
• Site exclusion: Yes — where possible all equip-ment should be located away from known flowpaths.
• Design: Locating services underground. Con-struction of embankments around critical com-ponents.
• Contingency planning: –
• Vulnerability: Breakage of towers, poles and lines,damage to other structures, sedimentation inHEP storage reservoirs, abrasion of HEP turbines.
• Site exclusion: Yes — where possible all equip-ment should be located away from valleys andknown flow paths.
• Design: Locating services underground. Con-struction of embankments aroundcritical components. Use of hardenedmaterials to limit abrasion.
• Contingency planning: Use of early warning sys-tems, rain gauges and flow sensors. Clean-up op-erations and methods.
Water supplynetwork
• Vulnerability: Increased turbidity,decreased water quality, increased water de-mand, clogging of filters, abrasion of movingparts in motors and pumps, corrosion of metals.
• Site exclusion: No• Design: Strengthen structures to minimise tephraload damage. Cover open filter beds, clarifiersand pumps. Consider the use of groundwatersources to increase resilience.
• Contingency planning: Tephra clean-upoperations using dry methods (brooms, shovels).Anticipate increased water demand and possiblecontamination. Increase maintenance frequency.Close water intakes until turbidity decreases.
• Vulnerability: Lateral loading damage to tanks,well heads and pipes.
• Site exclusion: Yes — where possible all equip-ment should be located away from valleys andknown flow paths.
• Design: Strengthen all structures at treatment fa-cility. Strengthen pipes crossing flow paths orlocate them deep underground.
• Contingency planning: Clean-up operations andmethods. Anticipate possible watercontamination.
• Vulnerability: Burial of underground accesspoints, rupturing of pipes.
• Site exclusion: Yes — where possible all equip-ment should be located away from known flowpaths.
• Design: Construction of embankments aroundcritical components.
• Contingency planning: –
• Vulnerability: Lateral loading damage to tanks,well heads and pipes, erosive damage to under-ground pipes, abrasion damage to river intakestructures.
• Site exclusion: Yes — where possible all equip-ment should be located away from valleys andknown flow paths.
• Design: Use of abrasion resistant materials for in-take structures in rivers.
• Contingency planning: Clean-up operations andmethods. Anticipate possible water contamina-tion. Close water intakes until turbidity de-creases. Use of early warning systems.
Wastewaternetwork
• Vulnerability: Abrasion damage to componentswith moving parts, blockage of filters andscreens, ingress into pipe network and treatmentfacility.
• Site exclusion: No• Design: Strengthen structures to minimise tephraload damage. Cover exposed equipment, tanksand pumps. Limit tephra ingress by utilising sep-arate stormwater system.
• Contingency planning: Tephra clean-upoperations and methods. Increase maintenancefrequency. Consider bypassing pumping stationsand treatment facilities to protect against furtherequipment damage.
• Vulnerability: Lateral loading damage to struc-tures and equipment, ingress into pipe network.
• Site exclusion: Yes — where possible all equip-ment should be located away from valleys andknown flow paths.
• Design: Strengthen all structures at treatment fa-cility. Strengthen pipes crossing flow paths orlocate them deep underground.
• Contingency planning: Clean-up operations andmethods.
• Vulnerability: Lateral loading damage to struc-tures and equipment. Burial of underground ac-cess points.
• Site exclusion: Yes — where possible all equip-ment should be located away from known flowpaths.
• Design: Construction of embankments aroundcritical components.
• Contingency planning: –
• Vulnerability: Lateral loading damage to struc-tures and equipment, ingress into pipe network.
• Site exclusion: Yes — where possible all equip-ment should be located away from valleys andknown flow paths.
• Design: Construction of bunds aroundoxidation ponds to prevent lahar ingress.
• Contingency planning: Clean-up operations andmethods. Use of early warning systems.
Transportationnetworks
• Vulnerability: Reduced visibility and traction,covering of road and runway markings, abrasionand corrosion damage to vehicles, jamming ofrail switches, and disruption to airspace.
• Site exclusion: No
• Vulnerability: Burial of roads, rail networks andairport runways, increased sedimentation intoharbours, erosive damage and destruction ofbridges, extensive damage to vehicles.
• Site exclusion: Yes — where possible all routes
• Vulnerability: Burial of roads, rail networks andairport runways.
• Site exclusion: Yes — where possible all routesshould be located away from known flow paths.
• Design: Construction of embankments around
• Vulnerability: Burial of roads, rail networks andairport runways, increased sedimentation intoharbours, erosive damage and destruction ofbridges, extensive damage to vehicles.
• Site exclusion: Yes — where possible all routes
156G.W
ilsonetal./JournalofV
olcanologyand
Geotherm
alResearch286
(2014)148
–182

• Design: Strengthen buildings (airports, train sta-tions) and increase roof pitch to minimise tephraload damage.
• Contingency planning: Tephra clean-up opera-tions and methods. Road, rail and airport closureprotocols. Established tephra avoidance guide-lines for aircraft.
should be located away from valleys and knownflow paths.
• Design: Raise bridge decks over valleys andstrengthen piers and abutments.
• Contingency planning: Identify alternate routes ifprimary routes are damaged. Anticipate the needfor temporary bridges. Clean-up operations andmethods.
critical parts of the network.• Contingency planning: –
should be located away from valleys and knownflow paths.
• Design: Automated barriers to close road and railroutes when lahars occur. Raise bridge decksover valleys and strengthen piers and abutments.
• Contingency planning: Use of early warning sys-tems. Identify alternate routes if primary routesare damaged. Anticipate the need for temporarybridges.
Communications • Vulnerability: Signal interference and attenua-tion, corrosion of metal surfaces.
• Site exclusion: No• Design: Strengthen structures or use tephrashedding designs to minimise tephra loading.Sealing of equipment to prevent tephra ingress.
• Contingency planning: Tephra clean-up opera-tions and methods. Use of different redundantand backup communication systems. Increasemaintenance frequency.
• Vulnerability: Signal interference and attenua-tion, damage of towers, poles and masts, burial ofequipment.
• Site exclusion: Yes — where possible all equip-ment should be located away from valleys andknown flow paths.
• Design: Locate services underground orinside strengthened buildings. Strengthen allequipment, especially those crossing flow paths.
• Contingency planning: Clean-up operations. In-crease maintenance frequency.
• Vulnerability: Damage of towers, poles and masts,burial of equipment.
• Site exclusion: Yes — where possible all equip-ment should be located away from known flowpaths.
• Design: Construction of embankments aroundcritical parts of the network. Locate equipmentinside strengthened buildings.
• Contingency planning: –
• Vulnerability: Damage of towers, poles and masts,burial of equipment.
• Site exclusion: Yes — where possible all equip-ment should be located away from valleys andknown flow paths.
• Design: Locate services underground orinside strengthened buildings. Strengthen allequipment, especially those crossing flow paths.
• Contingency planning: Clean-up operations. In-crease maintenance frequency. Use of earlywarning systems.
Criticalcomponents
• Vulnerability: Clogging of air filters, overheating,short circuits, abrasion of moving parts, and cor-rosion of metal surfaces.
• Site exclusion: No• Design: Seal equipment and locate equipment in-side sealed buildings to prevent tephra ingress.Install air filters designed for fine particles. Installhoods over HVAC air intakes.
• Contingency planning: Tephra clean-up opera-tions and methods. Increase maintenancefrequency.
• Vulnerability: Destruction and transportation ofequipment.
• Site exclusion: Yes — where possible all equip-ment should be located away from valleys andknown flow paths.
• Design: Relocation of equipment into strength-ened buildings.
• Contingency planning: Clean-up operations andmethods. Increase maintenance frequency.
• Vulnerability: Destruction and burial of equip-ment.
• Site exclusion: Yes — where possible all equip-ment should be located away from known flowpaths.
• Design: Relocation of equipment into strength-ened buildings.
• Contingency planning: –
• Vulnerability: Destruction and transportation ofequipment.
• Site exclusion: Yes — where possible all equip-ment should be located away from valleys andknown flow paths.
• Design: Relocation of equipment into strength-ened buildings.
• Contingency planning: Use of early warning sys-tems. Clean-up operations and methods. Increasemaintenance frequency.
Buildings • Vulnerability: Blocked and/or damaged gutters,tephra ingress, corrosion of metal surfaces, andstructural damage to roof.
• Site exclusion: No• Design: Strengthen roofs, increasing roof pitch toreduce static load.
• Contingency planning: Sealing of building to pre-vent tephra ingress. Removing tephra from roofto prevent collapse.
• Vulnerability: Damage to windows and doors,structural damage to whole building, inundationand burial, ignition of fires.
• Site exclusion: Yes — where possible all buildingsshould be located away from valleys and knownflow paths.
• Design: Strengthen walls and avoid having themperpendicular to flow path to reduce dynamicload. Use of shutters on openings to prevent in-gress.
• Contingency planning: Evacuation planning andimplementation.
• Vulnerability: Structural damage to whole build-ing, burial, ignition of fires.
• Site exclusion: Yes — where possible all buildingsshould be located away from known flow paths.
• Design: Strengthen building walls. Use of non-flammable materials.
• Contingency planning: –
• Vulnerability: Inundation and burial,structural damage to walls, float building offfoundations.
• Site exclusion: Yes — where possible all buildingsshould be located away from valleys and knownflow paths.
• Design: Strengthen walls and avoid having themperpendicular to flow path to reduce dynamicload. Fix buildings to foundations.
• Contingency planning: Use of early warning sys-tems. Evacuation planning and implementation.
a A ‘yes’ for site exclusion indicates that infrastructure development should be avoided at a particular site as damage from a hazard cannot be mitigated.b Design considerations include altering the design of components and infrastructure sectors to lower their vulnerability to disruption and damage fromvolcanic hazards (e.g., strengthen building roof) and the design of site protectionmeasures for
flow hazards (e.g., construction of diversion barriers).c Contingency planning involves making decisions and plans in advance about themanagement and response to volcanic eruptions to minimise impact severity and decrease recovery time (e.g., evacuation plans, clean-up plans and availability of
resources).
157G.W
ilsonetal./JournalofV
olcanologyand
Geotherm
alResearch286
(2014)148
–182

158 G. Wilson et al. / Journal of Volcanology and Geothermal Research 286 (2014) 148–182
simultaneous hazards. This can lead to a range of different impactmechanisms to be considered, again adding complexity.
(2) Individual volcanic hazards can cause different types of damage to the same assetdepending on the hazard properties. For example, tephra fall can damage ametalroof by increasing the static load causing it to collapse, in addition to damaging itthrough corrosion and abrasion.
(3) There are no widely adopted volcanic building codes or building performanceguidelines which regulate infrastructure design in volcanic hazard zones andprompt vulnerability assessment and fragility function development.
(4) There is a diverse range of infrastructure system design, configuration and com-ponents which make it difficult to assign generic vulnerability assessments forall infrastructure sectors.
(5) Time scales leadingup to volcanic eruptions can be long compared to earthquakes(discrete events). Long eruption lead times can allow pre-event warnings,resulting in evacuations which remove the danger to life. Given the focus onloss of life vulnerabilities, the mitigative measure of mandatory, encouraged, orself-evacuations reduces social pressure to evaluate building fragility.
(6) Volcanic episodeswithmultiple hazardous events can take place over a long time,adding complexity to vulnerability assessments.
(7) Difficulties in accuratelymeasuring hazard intensity (e.g., bulk densities of lahars,dynamic pressures of PDCs, tephra thickness). Often PDC and lahar parametersare inferred from deposits due to personal safety concerns and destruction ofmeasuring instruments during flow emplacement. Deposits, especially tephrafall, may be reworked by erosional processes and thus incorrectly measured(Engwell et al., 2013).
(8) Volcanic eruptions are infrequent events, resulting in a lack of quantitative obser-vational impact data. Volcanic post event assessments are primarily focused onthe hazard itself and not the impacts.
3. Historically observed impacts to critical infrastructure
In order to estimate vulnerability to critical infrastructure during fu-ture eruptions, insights can be gained from analysing past impacts. Inthis section we review the literature to provide a semi-qualitative over-viewof disruption and damage to critical infrastructure by volcanic haz-ards.We consider impacts from tephra falls, PDCs, lava flows and lahars(see Table 1 for hazard descriptions) to electrical supply networks,water supply and wastewater networks, terrestrial transportation net-works, communications, computers and air conditioning. As buildingsand critical components (HVAC and electronic equipment) are widelyused as key components in each infrastructure sector we finish with adedicated section for critical components and building impacts(Sections 3.6 and 3.7, respectively). Table 5 tabulates documented im-pact occurrence per decade for the past century for each infrastructuresector indicating the prevalence and occurrence of impacts over time.Table 6 summarises themain vulnerabilities for each infrastructure sec-tor and summarises mitigation actions based on site exclusion, infra-structure design and operation and response planning.
3.1. Electrical supply networks
Electricity is essential for a functioning modern society and thecontinued operation of other critical infrastructure. Electrical equip-ment and apparatus used in power generation, transmission and dis-tribution is typically located above ground, comprising of a series ofnodes (power stations, substations) connected by extensive corri-dors (transmission and distribution lines) which can stretch thou-sands of kilometres (Fig. 3A). The ubiquitous scope of the electricalsupply network increases its level of exposure making the networkparticularly vulnerable to volcanic hazards (Wardman et al.,2012c). Volcanic hazards affect the electric supply network in a num-ber of ways (Fig. 4), the most common being temporary outagescaused by insulator flashover as a result of tephra accumulation(Wardman et al., 2012c). Many of the impacts discussed below canoccur at any location within the network as similar equipment is lo-cated throughout the network (Fig. 3A). See Wardman et al. (2012c)for a review of tephra fall impacts and mitigation strategies for theelectrical supply network.
3.1.1. Insulator flashoverThe most common tephra fall impact on the electrical supply net-
work is insulator flashover (Wardman et al., 2012c). A flashover is anunintended electrical discharge (short circuit) around the insulatorand typically leads to a line fault. Dry tephra has high resistivity but inthe presence of moisture resistivity becomes very low (Wardmanet al., 2012b). Sowhen tephra is deposited on insulators, in the presenceofmoisture, aflashovermay result. Itmay only take one insulator to suf-fer flashover for an entire line of potentially hundreds of kilometres tobe disrupted. Tephra, in this case, can result from direct falls, PDCs orfrom wind remobilisation of unconsolidated tephra deposits. Flashoverhas been observedworldwide after volcanic eruptionswhere tephra ac-cumulations exceed ~3 mm (Fig. 4). However tephra moisture contentis the critical factor controlling flashover occurrence, as dry tephra hasvery low electrical conductivity (Wardman et al., 2012b). Insulatorand system design also influence flashover susceptibility. Wardmanet al. (2012c) found that tephra accumulations on the underside of insu-lators are equally important as accumulations on the topside inassessing vulnerability. Electrical supply providers can minimise tephrainduced flashover by increasing insulation, using anti-pollution designsand cleaning strategies (Wardman et al., 2012c).
Tolerance to flashover faults and continued operation of electricalnetworks have been documented in some cases (Fig. 4), althoughWardman et al. (2012c) suggest that they may be under-reported as itis more common to document failures. Tolerance is observed over awide range of tephra fall thicknesses ranging from 2 to 300 mm. Differ-ences in tolerance values are due to different component designs, teph-ra properties and environmental conditions, as these parametersinfluence how tephra affects insulators.
3.1.2. Damage to electrical linesVolcanic flows have snapped poles and damaged electrical lines,
resulting in supply disruption, during volcanic eruptions of: Heimaey,Iceland in 1973 (lava flows: Morgan, 2000); Mauna Loa, Hawaii in1984 (lava flows: Associated Press, 1984; Hawaiian VolcanoObservatory, 1998a); Nyiragongo, Democratic Republic of the Congo(DRC) in 2002 (lava flows: Baxter and Ancia, 2002); Chaitén, Chile in2008 (lahars: Wilson et al., 2009); and Merapi in 2006 (PDCs: Wilsonet al., 2007). Fig. 5 shows that these impacts tend to occur at low hazardintensities although the scarce evidence suggests that any presence ofvolcanic flows is likely to cause disruption to electrical infrastructure.Tephra accumulations on lines may cause them to break such as thosethat occurred in the 2008 eruption of Chaitén, although here snowadded to the load on the lines (Wilson et al., 2012b). Flow deposits, es-pecially solidified lava flows, will restrict access to buried services(e.g., underground cables) limiting future serviceability.
3.1.3. Damage at generation sitesHydroelectric power (HEP) turbines at generation sites are particu-
larly vulnerable to abrasion after tephra material (either from directfall or PDCs and lahars) is deposited into storage reservoirs. Tephrasuspended in reservoirs may pass through turbines causing abrasionto them and other auxiliary components over time (Fig. 6A). Abrasionreduces the performance and life span of turbines leading to turbine re-placement (e.g., Meredith, 2007). For example, four turbines at theAgoyan HEP station, Ecuador have been replaced over the last21 years as a result of abrasion damage from ongoing tephra fall fromVolcán Tungurahua being deposited in the Pastaza catchment (Sword-Daniels et al., 2011). Tephra properties (e.g., particle hardness andmor-phology) and exposure time are theprimary controls on abrasion occur-rencewith longer exposure times leading to increased abrasion severityalthough turbine design, materials, protective coatings and mainte-nance will also influence abrasion damage. Wind turbines and bladesare also at risk of abrasion by tephra particles andmay result in damageand reduced performance similar to that caused by sand particles(e.g., Khalfallah and Koliub, 2007; Dalili et al., 2009).

1
4
2
Water source• Open water bodies• Groundwater• Reservoirs• Rivers• Intake structures• Water quality
Treatment process(1) Coagulation
• Coagulation process(2) Clarification
• Mechanical skimmers• Settling tanks• Tank capacity• Filters and screens
(3) Filtration• Filters and screens
(4) Disinfection• UV lights• Filters• Water quality
General• Pumps & pipe network• Buildings
Storage Customers• Supply• Water quality
Pumps & pipe network Pumps & pipe
network
B – Water supply network
Pumps & pipe network (regardless of location)• Pumps/impellers• Filters• Motors• Buildings
3
Generation
Transmission & distribution
Substation Substation
Hydroelectric power station
Geothermal power station
Thermal power stationRenewable energy
Consumers• Supply
Towers, poles, lines, insulators
Generation• Turbines• Motors• Cooling equipment• Air intakes• Intake gates (HEP)• Buildings and structures
A – Electrical supply network
Substations (regardless of network location)• Insulators• Gravel cover• Switching equipment• Transformers• Buildings
Line network (regardless of location)• Insulators• Lines• Towers• Poles
Fig. 3. Schematic of (A) an electrical supply network showing generation at different power stations and then transmission and distribution to consumers (modified fromWardman et al.,2012c) and (B) a water supply network from water source, water treatment through to distribution to consumers. Components vulnerable to volcanic hazards are indicated in italics.
159G. Wilson et al. / Journal of Volcanology and Geothermal Research 286 (2014) 148–182
The only known example of a geothermal power generation sitebeing impacted by tephra fall is the Amatitlán plant located 3 kmnorth of Volcán Pacaya, Guatemala. During the 2010 eruption of Pacaya,the plant received 20 cm of coarse tephra and bombs up to 250 mm indiameter. The upward facing uncovered steam condenser fans sufferedabrasion damage and denting from falling blocks, rendering them non-operational (Wardman et al., 2012a).Minor denting of intake and outletpipe cladding also occurred. The plant was shut down for three weekswhilst cleaning was undertaken (Wardman et al., 2012a).
Lahars have been documented impacting river water intake systemsused for generation site cooling. After the 1980 Mt. St. Helens eruption,lahars filled the Columbia River with sediment, the same river wherethe now decommissioned Trojan Nuclear Power Plant had a water in-take system. Fortunately the water intake was located in an area withless sedimentation and the plant was off-line at the time of the eruptionfor fuel replacement (Schuster, 1981).
New renewable energy technologies such as photovoltaic (PV)panels may be impacted by volcanic hazards as they are open to the at-mosphere; however there is limited empirical observation of this occur-ring. One instance occurred during the 2011 eruption of Shinmoedake,Japan, when tephra accumulated (b2 mm) on PV panels at the Univer-sity of Miyazaki, 50 km east of the vent. PV panel performance was
reduced by ~60% (Ota et al., 2012) but recovered after rainfall removedthe tephra a few days later.
3.1.4. Clean-up disruptionDeposition of unconsolidated tephra deposits either from direct falls
orflows (PDCs and lahars) at electrical supply sitesmay require removalto restore function. Tephra clean-up operations have been conducted byelectrical supply operators worldwide to minimise ongoing flashoverfaults and prevent future tephra induced impacts (e.g., corrosion, abra-sion) to their components and network (Fig. 4). Documented thick-nesses of when cleaning occurs are varied; ranging from 1 mm aftereruptions at Tungurahua (1999–2010) to N100 mm after the eruptionof Pacaya in 2010 (Fig. 4). This range in thickness can be attributed to in-frastructure design, tephra properties and the operational practices ofthe particular electrical supply providers. In some instances cleaningcan be undertaken whilst components are energised, reducing theneed to shut down and limiting disruption (Wardman et al., 2012c),however, controlled shutdowns may be necessary in order to protectequipment and personnel (Sword-Daniels et al., 2011) (Fig. 4). Con-trolled shutdowns will cause supply disruptions unless there are re-dundant networks capable of supplying electricity whilst cleaning isbeing undertaken.

Fig. 4. Summary of documented tephra fall impacts and disruption to the electrical network as a function of tephra thickness for (A) generation, (B) substations and (C) transmission anddistribution (modified fromWardman et al., 2012c). Note: only data where tephra thickness is known or derived are plotted.
160 G. Wilson et al. / Journal of Volcanology and Geothermal Research 286 (2014) 148–182
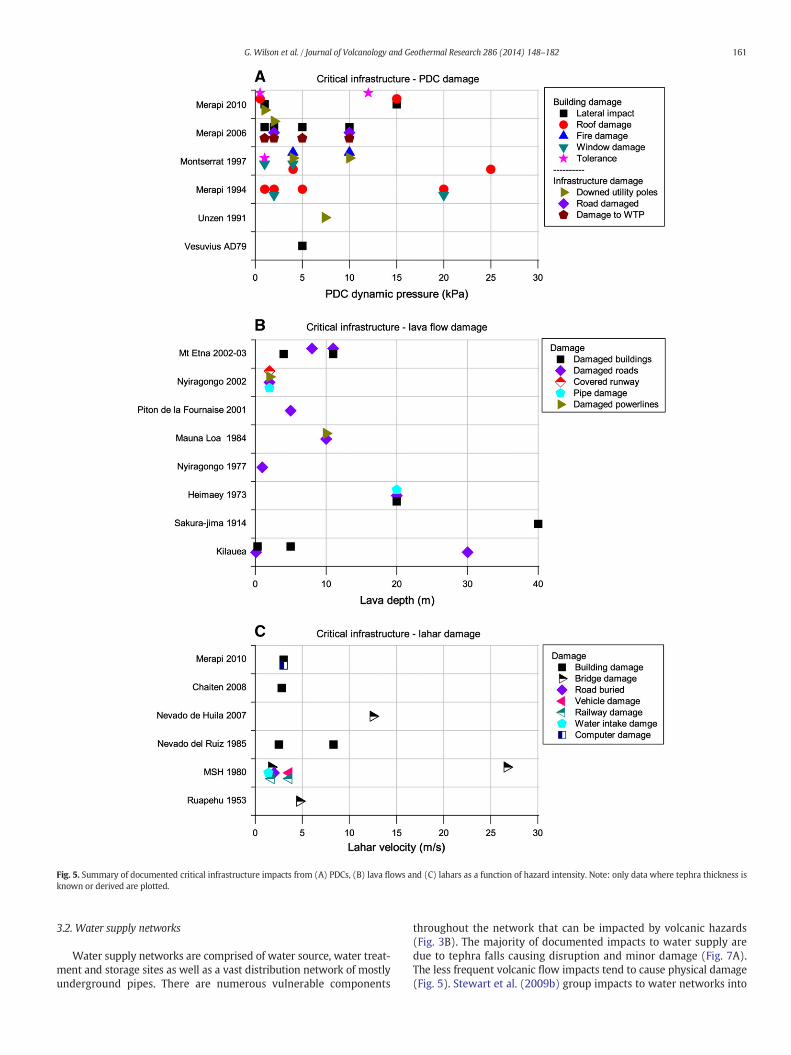
Fig. 5. Summary of documented critical infrastructure impacts from (A) PDCs, (B) lava flows and (C) lahars as a function of hazard intensity. Note: only data where tephra thickness isknown or derived are plotted.
161G. Wilson et al. / Journal of Volcanology and Geothermal Research 286 (2014) 148–182
3.2. Water supply networks
Water supply networks are comprised of water source, water treat-ment and storage sites as well as a vast distribution network of mostlyunderground pipes. There are numerous vulnerable components
throughout the network that can be impacted by volcanic hazards(Fig. 3B). The majority of documented impacts to water supply aredue to tephra falls causing disruption and minor damage (Fig. 7A).The less frequent volcanic flow impacts tend to cause physical damage(Fig. 5). Stewart et al. (2009b) group impacts to water networks into

Fig. 6. (A) Abrasion damage to a turbine removed from the Agoyan hydro electric power station, Ecuador as a result of exposure to tephra laden water derived from the 1999–2010 erup-tions of Volcán Tungurahua (photo: Johnny Wardman). (B) Houses covered with a thin layer of tephra after the eruption of Mt. Kelud on February 14, 2014 (photo: Dwi Oblo).(C) personnel cleaning tephra from the Bariloche, Argentina water treatment plant after the June 4, 2011 eruption of PCCVC (photo: Carol Stewart). (D) Laboratory experiments to deter-mine the settling rate of tephra in water. Each beaker contains a different tephra and shows the turbidity after 1 h of settling (photo: J White).
162 G. Wilson et al. / Journal of Volcanology and Geothermal Research 286 (2014) 148–182
three categories: (1) direct physical damage; (2) changes inwater qual-ity; and (3) water demand issues which are very much controlled bysystem design. We follow this structure here.
3.2.1. Physical damagePhysical damage to water supply networks tends to be caused by
volcanic flows, heavy tephra falls and prolonged exposure to tephra.Volcanic flows have caused complete destruction of water supplyinfrastructure as a result of increased lateral loading (Fig. 5). Groundwa-ter well heads, springs, reservoirs and pipes were damaged aroundMontserrat by PDCs (Howe, 2003) and lahars (CDERA, 2006) duringthe 1995 eruption of Soufrière Hills volcano. Water pipes have beendamaged and buried by lahars around Mayon volcano, Philippines(Nasol, 2001; Smithsonian Institution, 2002) and by lava flows inGoma, DRC after the 2002 eruption of Nyiragongo (SmithsonianInstitution, 2001; Baxter and Ancia, 2002). These examples show thatwater supply infrastructure located above ground in or near flowpaths (i.e., river valleys) are vulnerable to damage from volcanic flowsat low hazard intensities (Fig. 5).
Direct tephra falls or exposure to tephra–water slurries (such asthose in pipes) can causeminor physical damage in the formof abrasionof moving parts (e.g., pumps, motors) and corrosion of metals. Damageof this nature is documented after numerous eruptions (Stewart et al.,2006; Wilson et al., 2012b) and is attributed to tephra thicknesses ex-ceeding 30 mm (Fig. 7A), however duration of exposure is the primarycontrol on this type of damage, which is difficult to establish in thesecases. Tephra-induced damage reduces pumping efficiency whichleads to reduction in production and distribution capacity and increasedmaintenance and/or repair of pumps and pipes.
3.2.2. Disruption to water treatmentDisruption and increased maintenance from tephra falls are more
common than physical damage (Wilson et al., 2012b). Treatment dis-ruption occurs when there is partial to complete blockage of water in-takes, filters and pipes, as these have to be cleaned before normaloperation can resume (Fig. 6C). These impacts can occur at tephra thick-nesses N1 mm (Fig. 7A). This can be illustrated from a case study fromthe 2011 eruption of the Puyehue–Cordón Caulle volcanic complex(PCCVC), Chile. During this eruption the town of Bariloche, 100 kmfrom the vent, received 30–45mm of tephra and the town of Jacobacci,240 km from the vent, received 50 mm of tephra (Wilson et al., 2013).The Bariloche plant was designed for low levels of suspended solidsand rawwater passed directly through the sandfilters. During the erup-tion, tephra laden water blocked the filter pore spaces requiring addi-tional daily cleaning to return filter functionality and water treatmentcapacity (Wilson et al., 2013). In contrast, in Jacobacci water supplieswere resilient to disruption as all pumphouses were enclosed andwater is sourced from groundwater wells (Wilson et al., 2013). This ex-ample illustrates that system design will affect impact occurrence andseverity (Stewart et al., 2009b).
3.2.3. Water quality impactsRaw and treated water within water supply networks can also be
impacted by volcanic hazards and requires consideration in vulnerabil-ity assessments. We refer the reader to Stewart et al. (2006, 2009a,2009b) and Wilson et al. (2012b) for in-depth reviews.
Water quality impacts occurwhen tephra, from either tephra falls orPDCs, enters water source areas or treatment facilities (Fig. 3B). Tephra

Fig. 7. (A) Summary of documented tephra fall impacts and disruption to (A) the water supply network and (B) thewastewater network as a function of tephra thickness. Note: only datawhere tephra thickness is known or derived are plotted.
163G. Wilson et al. / Journal of Volcanology and Geothermal Research 286 (2014) 148–182
will cause an increase in turbidity (cloudiness of water caused bysuspended particles) at tephra thicknesses N2 mm (Figs. 6D and 7A)(Stewart et al., 2006). Chemical contamination of water occurs as solu-ble surface coatings on fresh tephra particles dissolve readily upon con-tact with water, releasing a range of ions (Witham et al., 2005; Delmelleet al., 2007). Increased ion concentration may breach drinking waterstandards, however this is usually only for short time periods (Stewartet al., 2009a). Chemical contamination of water supplies from tephrafall is difficult to predict prior to an eruption due to variability in solublesalt and water chemistry, however it can occur at tephra thicknessesN1 mm (Fig. 7). Turbidity and chemical contamination are commonlycontrolled though management practices (Stewart et al., 2009b), how-ever if turbidity becomes too high to treat effectively, the treatmentplant may have to be shut down. This occurred at the Ship Creek treat-ment facility in Anchoragewhich received 3mmof tephra andwas shutdown for 30 h as a precaution following the 1992 eruption of Mt. Spurr,Alaska (Wilson et al., 2012b).
3.2.4. Water shortagesAfter tephra falls, clean-up is commonly undertaken by washing
away unconsolidated deposits placing large demands on water re-sources (Wilson et al., 2012b). In 1992 Anchorage, Alaska was coveredwith 3 mm of tephra from the eruption of Mt. Spurr. After residents
began cleaning tephra deposits, there were severe water shortagesand loss of pressure in some parts of the city (Stewart et al., 2009b). Incontrast, successful management of water supply occurred in Esquel,Argentina during the eruption of Volcán Chaitén in 2008. During resi-dential clean-up supply exhaustion was avoided as authorities advisedresidents to use alternative ‘dry’ clean-up methods such as use ofbrooms and shovels (Stewart et al., 2009b).
3.3. Wastewater treatment networks
Wastewater networks comprise an underground network of pipesand pumps and above ground treatment facilities (Fig. 8A).Wastewaternetworks may be combined with stormwater systems or the two maybe completely separate. Combinedwastewater and stormwater systemsare more vulnerable to impacts than separate systems because uncon-solidated tephra can easily enter the network through stormwaterdrains (Barnard, 2009).
3.3.1. Physical damageThere is limited documented evidence of volcanic flows directly
impacting wastewater treatment facilities, except in the case of Plym-outh, Monserrat in which the entire town was destroyed by pyroclasticflows from Soufrière Hills volcano in 1997 (Rozdilsky, 2001). Abrasion

Exchange
Towers, masts & dishes
Satellites
Signal
Buried cable network
Roadside cabinet
Electronic equipment
B – Communication network
C – Transportation networks
A – Wastewater network
Buried networkCollection Treatment
Primary treatment• Filtration• Sediment scrapers• Pumps
City waste
Pumps & pipe network• Pumps & motors• Pipes• Filters• BuildingsStormwater runoff
• Stormwater drains
1
3
2Secondary treatment• Aeration• Bacterial treatment
Tertiary treatment• Filtration• UV disinfection
Discharge
Airport
Terminal buildings• Communications• Electronic equipment• HVAC
Aircraft• Engines• Leading edges• Windshields• Instruments
Runway and aprons• Paved surfaces• Runway markings
Port
Ships• Engines• Air intakes• Water intakes
Harbour
Wharf infrastructure• Buildings• Paved surfaces• Cranes
Rail network
Tracks• Signalling• Track switching• Communication• Track ballast (gravel)• Track surface
Buildings
Trains• Engines• Air intakes• Communication• Windshields• Exterior surface
Road network
Vehicles• Engines• Air & oil filters• Windshields• Paintwork
Road network• Roads• Bridges• Road markings
Fig. 8. Schematic of (A) wastewater and stormwater collection and treatment network, (B) typical components usedwithin communication networks and (C) air, rail, sea and road trans-portation networks and vehicles. Components vulnerable to volcanic hazards are indicated in italics.
164 G. Wilson et al. / Journal of Volcanology and Geothermal Research 286 (2014) 148–182
damage to pumps, pipes, sediment scrapers, filtration components anddebris screens may occur as tephra laden slurries pass through thesecomponents (Blong, 1984; Johnston, 1997; Barnard, 2009) again occur-ring over extended periods of time. Eruptions from Mt. St. Helens(1980), El Reventador, Ecuador (2002) and Pacaya (2010) show abra-sion damage occurring over tephra thicknesses ranging from 4–50 mm Fig. 7B.
3.3.2. Treatment disruptionWastewater treatment can be disrupted if tephra is deposited direct-
ly onto treatment facilities as the capacities of open ponds, reactors andclarifiers will be reduced (Fig. 7B) (Wilson et al., 2012b). For example,disruption occurred during the 2010 eruption of Pacaya volcano whena combined sludge and sedimentation tank in Guatemala Citywas filledwith 4–5 m of tephra and had to be cleaned before continued operation(Wilson et al., 2012b). Tephra can form large hardened and unpumpablemasses within the pipe networkwhich requiremanual removal (Wilsonet al., 2012b). Fig. 7B suggests that pipe blockage occurs with tephrathicknesses N3 mm however accumulations larger than this may occurin pipes. Blockages are likely to occur at distinct points and not through-out the entire network.
If treatment disruption and/or damage become excessive, wastewa-termight have to bypass the system and be discharged into the environ-ment as untreated waste. This decision was made at the Yakima waste
treatment facility, USA after it received 10 mm of tephra from the1980 Mt. St. Helens eruption (Blong, 1984). Tephra caused damage tomost of the treatment facility including the biofilters and a decisionwas made four days after the eruption to bypass treatment and dis-charge waste, after chlorination, into the Yakima River (Barnard,2009). The decision was made because continued operation of theplant would have caused greater damage andmore periods of dischargewould have occurred in the future.
3.4. Transportation networks
Transportation networks can be vast and cover large expanses of thelandscape, increasing their exposure to volcanic hazards similar to elec-trical networks (Fig. 8C). Volcanic hazards have been documented ad-versely affecting all transportation systems (e.g., road networks,vehicles, rail tracks, trains, ports, ships, airports; Figs. 5 and 9A). Addi-tionally, a number of cascading impacts may occur, not discussed here,affecting other sectors which rely on transportation, as well as possibleevacuation and emergency response during a volcanic crisis.
3.4.1. Road networks and vehicles
3.4.1.1. Physical damage. Volcanic flows can cause physical damage toroad networks (Fig. 5). Perhaps the best known example of this was

Fig. 9. Summary of documented tephra fall impacts and disruption to (A) the transportation network and (B) critical components and communication equipment as a function of tephrathickness. Note: only data where tephra thickness is known or derived are plotted.
165G. Wilson et al. / Journal of Volcanology and Geothermal Research 286 (2014) 148–182
after the 1980 eruption of Mt. St. Helens where lahars and PDCs causedextensive damage or destruction to 300 kmof road and 48bridges in thevalleys draining the volcano (Blong, 1984). Bridges are particularly vul-nerable as they generally cross flow paths and can be damaged byscouring around abutments and piers and lateral loading (Nairn,2002). Roadways located on flow channel banks are vulnerable to un-dercutting by lahars. For example, threemonths after the 2010 eruptionof Merapi volcano, Indonesia, a lahar eroded a 60 m section of a majorhighway causing its closure (Smithsonian Institution, 2011).
Lava flows, regardless of depth, cause irreparable damage to roadsaround the world by simply crossing them (Fig. 5B). Since the early1900s, numerous roads in Hawaii have been covered by lava from erup-tions of Mauna Loa and Kilauea (Blong, 1984; Hawaiian VolcanoObservatory, 1998b, 2000). Thin (b1 m) flows buried a main road inGoma during the 1977 Nyiragongo eruption, DRC (Blong, 1984) andagain during the 2002 eruption (Baxter et al., 2003). Sections of roads
along the western and southern flanks of Mt. Etna, Italy have been bur-ied numerous times by lava flows (Smithsonian Institution, 1999;Andronico et al., 2005). These examples indicate that lava flows con-form to a binary impactmodel based on the presence or absence of lava.
PDCs can move, overturn, burn and/or impact vehicles located inflow paths. For example, vehicles within 15 km of Mt. St. Helens weretotally destroyed by the 1980 eruption (Blong, 1984). During the Sep-tember 1991 Unzen, Japan eruption, a vehicle sustained extensivepanel damage, was burnt and transported 120 m by PDCs (Fujii andNakada, 1999). Lahars are also likely to completely damage vehicles asthey are carried downstream whilst being impacted by debris (Blong,1984); however reports are limited. Tephra particles can damage vehi-cles by abrading moving parts and blocking air and oil filters (Wilsonet al., 2012b). Windshields and paintwork are highly susceptible toabrasion from tephra, which can be made worse by attempting toclean these surfaces. Despite possible damage, resilience has also been

Fig. 10. A sequence of photos, from left to right, showing the remobilisation of tephra and decrease in visibility from a passing car as the car travels towards the observer near VolcánChaitén after the 2008 eruption.Photos: G Leonard.
166 G. Wilson et al. / Journal of Volcanology and Geothermal Research 286 (2014) 148–182
documented. For example, in Yakima, USA, after the 1980Mt. St. Helenseruption, 30 police cars whichwere used during tephra falls suffered nolong term damage, other than increased oil change frequency (Blong,1984).
3.4.1.2. Disruption.Decreased road drivability in the formof traction loss,covered roadmarkings and poor visibility (Fig. 10) can result from teph-ra fall or remobilised unconsolidated tephra deposits (Nairn, 2002;Leonard et al., 2005; Wilson et al., 2012b). These impacts start tooccur at thin (~2–3 mm) tephra thicknesses (Fig. 9A). Disruption may
Fig. 11. Burial and destruction of the runway and terminal building at the W. H. Bramble Airpobeen completely buried and abandoned.Photos: Brian Digital.
increase as authorities close roads, limit the number of circulating vehi-cles or lower the speed limit to decrease the likelihood of traffic acci-dents and limit tephra remobilisation. Clean-up operation followingtephra fall will restore road drivability although it may be possible todrive on thick tephra deposits as they become compacted over time.
3.4.2. Rail network and trains
3.4.2.1. Physical damage.Rail bridges are vulnerable to lahar damage asthey are likely to cross lahar paths. In 1953, a lahar travelled down
rt, Montserrat by a PDC during the 1997 eruption of Soufrière Hills. The runway has since

167G. Wilson et al. / Journal of Volcanology and Geothermal Research 286 (2014) 148–182
the Whangaehu River on the slopes of Mt. Ruapehu, New Zealandand collapsed part of the Tangiwai rail bridge minutes before a pas-senger train arrived (Scott, 2013). The train derailed and plungedinto the river; 151 people were killed. Valentine (1998) studieddamage from nuclear weapon blasts and inferred that PDC damageto trains and rail tracks will occur at dynamic pressures N10 kPa.Lava flows have blocked, covered and damaged railway lines numer-ous times in the 1900s around Mt. Etna and Mt. Vesuvius, Italy ren-dering them unusable (Blong, 1984). It is likely that railways linescovered by lava flows of any depth will result in complete localiseddamage.
3.4.2.2. Disruption. Disruption to the rail network is most likely fromtephra fall. The best documented example of tephra fall impacting railnetworks is the 2011 Shinmoedake eruption in Japan. Here 168 km oftrack and 48 stations were impacted by tephra, causing delays and can-cellations (Smithsonian Institution, 2010; Magill et al., 2013). The mainissueswere themechanical failure of track switches and loss of electricalcontact between the track and train (Fig. 9A), which in this rail networkis how communications are sent to the train operator. Problems did notbegin at a particular critical threshold, and therefore a zero tolerancepolicy was adopted with services cancelled until tephra was removed
Fig. 12. (A, B) Extensive damage to a school in Chaitén town, Chile from a lahar after the 2008ground around the foundations has been scoured. (C) Burial of a building, up to window levelalso damaged. (D) A building in Chaitén town, inundated by a lahar after the 2008 eruption ofPhotos: G Leonard.
(Magill et al., 2013). Track ballast (crushed gravel used to supporttracks) was infiltrated by tephra, reducing its cushioning propertiesand required frequent replacement. Tephra also infiltrated train carriages,requiring additional cleaning. Damage was minimised by suspendingservices in ashy conditions (Magill et al., 2013).
3.4.3. Ports and shipsLahars and PDCs can affect harbours or water bodies due to in-
creased sedimentation. The most notable example occurred in the Co-lumbia Shipping Canal, USA after the 1980 Mt. St. Helens eruption.Lahar deposits filled it and reduced its capacity by 85%, rendering thecanal effectively unusable (Blong, 1984), affecting the economy in thePacific Northwest. Lava flows have also affected ports, the best knownevent is the 1973 Eldfell eruption in Heimaey, Iceland. Lava threatenedto block the harbour entrance, however, an extensive lava cooling oper-ation successfully prevented this from occurring (Williams and Moore,2008).
Ships may sustain damage, such as abrasion of moving parts andclogging of air filters and water intakes during tephra falls (Wilsonet al., 2012b). Vesiculated tephra (pumice and scoria) can float onwater creating a pumice raft, whichmay be ingested into ship water in-takes (Wilson et al., 2012b) and/or disrupt shipping routes. There are
eruption of Volcán Chaitén. Two exterior walls have been completely removed and the, in Chaitén town from a lahar after the 2008 eruption of Volcán Chaitén. A power pole isVolcán Chaitén.

168 G. Wilson et al. / Journal of Volcanology and Geothermal Research 286 (2014) 148–182
instances of resilience, for example, during the 2008 eruption of OkmokVolcano, Alaska several boats receivedminor tephra fall with no impactsother than damage to one air filter (Neal et al., 2011).
3.4.4. Airports
3.4.4.1. Physical damage to airports. Volcanic flows can completely de-stroy airports if they are located near river valleys or flood plains. Duringthe 1997 eruption of Soufrière Hills volcano, Montserrat, the W. H.Bramble Airport was overrun and completely destroyed by PDCs(Guffanti et al., 2009) (Fig. 11). Likewise, after the 2008 eruption ofChaitén volcano, lahars completely buried the Chaitén airport runwayand inundated many associated buildings; the airport subsequentlyclosed (Pallister et al., 2010). A temporary airport runway wasestablished on awidened road to restore flights to the area. The runwayat Goma International Airport, DRC was inundated by lava during the2002Nyiragongo eruption, reducing the runway's length by 1 km, how-ever it is still usable for smaller sized aircraft (Baxter and Ancia, 2002).
Damage to aircraft in flight is well documented and includes: loss ofengine thrust as a result of tephra ingestion and adherence to turbineblades; and abrasion of turbine blades, windshields, leading edges, pro-truding probes and sensors. We refer the reader to Casadevall (1994),the International Civil Aviation Organization (2007), Guffanti et al.(2010), Dunn (2012) and Drexler et al. (2011) for comprehensive re-views of tephra related damage to aircraft.
3.4.4.2. Disruption to aviation. Trace (~1mm) quantities of tephra depos-ited on runways, taxiways and aprons can reduce visibility, cause loss oftraction, interrupt ground services and damage parked aircraft (Guffantiet al., 2009) (Fig. 9A).When these impacts occur, airports typically closedue to flying safety regulations leading to widespread disruption. Be-cause such thin tephra deposits can close airports, airports located indistal areasmay also be affected resulting in widespread airport closureand travel disruption. In addition, the presence of tephra in the atmo-sphere can force the closure of airspace or the re-routing of travelroutes. For example, during the 2010 eruption of Eyjafjallajökull volca-no, Iceland, European and North Atlantic airspace was closed for six
Fig. 13. Summary of documented tephra fall impacts to buildings as a function of tephra
days in April 2010 to prevent potential aircraft damage and limit riskto life (Sammonds et al., 2010).
3.5. Communication networks
Communication networks are typically expansive and comprise awide range of components in many different network configurations(Fig. 8B).
3.5.1. Physical damage to communication equipmentVolcanic flows are likely to cause considerable damage to communi-
cation infrastructure (e.g., tower, poles, lines) if they are situated in flowpaths or in areas close to the volcano, however evidence is scarce.During the 1991 Unzen eruption, numerous utility poles were brokenat their bases after being impacted by PDCs (Clarke and Voight, 2000).
3.5.2. Disruption to communication equipmentTheoretically tephra particles may cause communication signal at-
tenuation and interference as it is known that dust storms cause thistype of disruption (e.g., Saleh and Abuhdima, 2011). A review byWilson et al. (2009) suggest that tephra induced signal attenuationmay preferentially affect low frequency (30–300 kHz) services. Signalinterference has been reported during tephra falls from Pacaya volcano,Guatemala (Wardman et al., 2012a), Tungurahua volcano, Ecuador(Sword-Daniels et al., 2011), Mt. Hudson, Chile (Wilson et al., 2011)and Merapi volcano, Indonesia (Wilson et al., 2007) (Fig. 9B), howeverthese occurrences are poorly documented. In contrast, cellular andultra high frequency networks and telemetered sites operated withoutinterruption in Futaleufú, Chile, which received N150mmof tephra dur-ing the 2008 Chaitén eruption (Wilson et al., 2012b).
3.6. Critical components
Wedefine critical components as those that are integral tomost crit-ical infrastructure sectors such as heating, ventilation and air condition-ing (HVAC) systems and electronic equipment. HVAC systems are usedinmost critical infrastructure sectors for internal environmental control,
thickness. Note: only data where tephra thickness is known or derived are plotted.
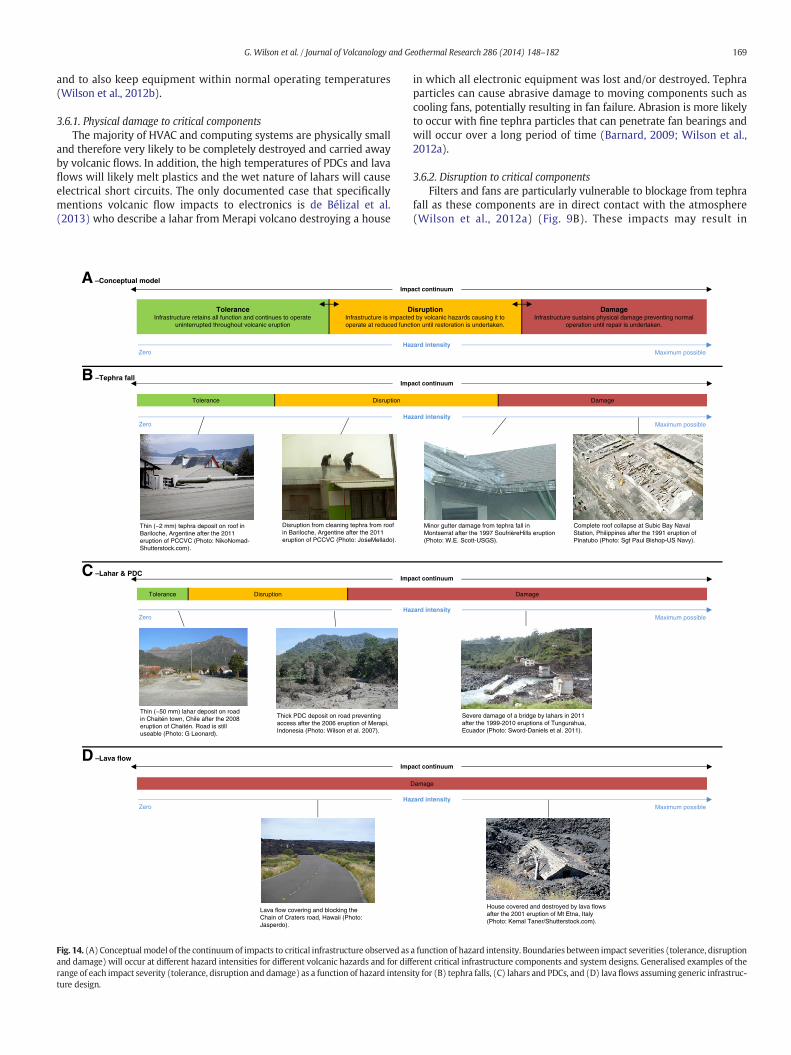
169G. Wilson et al. / Journal of Volcanology and Geothermal Research 286 (2014) 148–182
and to also keep equipment within normal operating temperatures(Wilson et al., 2012b).
3.6.1. Physical damage to critical componentsThe majority of HVAC and computing systems are physically small
and therefore very likely to be completely destroyed and carried awayby volcanic flows. In addition, the high temperatures of PDCs and lavaflows will likely melt plastics and the wet nature of lahars will causeelectrical short circuits. The only documented case that specificallymentions volcanic flow impacts to electronics is de Bélizal et al.(2013) who describe a lahar from Merapi volcano destroying a house
Thin (~2 mm) tephra deposit on roof in Bariloche, Argentine after the 2011 eruption of PCCVC (Photo: NikoNomad-Shutterstock.com).
Disruption from cleaning tephra from roof in Bariloche, Argentine after the 2011 eruption of PCCVC (Photo: Jo eMellado).
Thin (~50 mm) lahar deposit on road in Chaitén town, Chile after the 2008 eruption of Chaitén. Road is still useable (Photo: G Leonard).
Thick PDC deposit on road preventing access after the 2006 eruption of Merapi, Indonesia (Photo: Wilson et al. 2007).
Lava flow covering and blocking the Chain of Craters road, Hawaii (Photo: Jasperdo).
B –Tephra fall
ToleranceInfrastructure retains all function and continues to operate
uninterrupted throughout volcanic eruption
DInfrastructure is impacteoperate at reduced func
HaZero
Imp
Tolerance Disruption
HaZero
Imp
C –Lahar & PDC
Tolerance Disruption
HaZero
Imp
D –Lava flow
HaZero
Imp
A –Conceptual model
Fig. 14. (A) Conceptualmodel of the continuumof impacts to critical infrastructure observed asand damage) will occur at different hazard intensities for different volcanic hazards and for diffrange of each impact severity (tolerance, disruption and damage) as a function of hazard intensture design.
in which all electronic equipment was lost and/or destroyed. Tephraparticles can cause abrasive damage to moving components such ascooling fans, potentially resulting in fan failure. Abrasion is more likelyto occur with fine tephra particles that can penetrate fan bearings andwill occur over a long period of time (Barnard, 2009; Wilson et al.,2012a).
3.6.2. Disruption to critical componentsFilters and fans are particularly vulnerable to blockage from tephra
fall as these components are in direct contact with the atmosphere(Wilson et al., 2012a) (Fig. 9B). These impacts may result in
Minor gutter damage from tephra fall in Montserrat after the 1997 SoufrièreHills eruption (Photo: W.E. Scott-USGS).
Complete roof collapse at Subic Bay Naval Station, Philippines after the 1991 eruption of Pinatubo (Photo: Sgt Paul Bishop-US Navy).
Severe damage of a bridge by lahars in 2011 after the 1999-2010 eruptions of Tungurahua, Ecuador (Photo: Sword-Daniels et al. 2011).
House covered and destroyed by lava flows after the 2001 eruption of Mt Etna, Italy (Photo: Kemal Taner/Shutterstock.com).
isruptiond by volcanic hazards causing it to tion until restoration is undertaken.
DamageInfrastructure sustains physical damage preventing normal
operation until repair is undertaken.
zard intensityMaximum possible
act continuum
Damage
zard intensityMaximum possible
act continuum
Damage
zard intensityMaximum possible
act continuum
Damage
zard intensityMaximum possible
act continuum
a function of hazard intensity. Boundaries between impact severities (tolerance, disruptionerent critical infrastructure components and system designs. Generalised examples of theity for (B) tephra falls, (C) lahars and PDCs, and (D) lava flows assuming generic infrastruc-

Total damageNo damage
Total disruption
No disruption
11 data points
3 data points
Electrical supply
Water supply and wastewater networks
Transportation networks
Buildings
Critical components
Tephra
PDC
Lava flow
Lahar
Fig. 15. Relationship between critical infrastructure disruption and damage for investigat-ed eruptions (1973–2011) as a result of tephra fall (blue), PDC (red), lava flow (orange)and lahar (purple). Black line shows an idealised 1:1 relationship between disruptionand damage, where disruption are impacts that occur prior to the onset of physical dam-age and damage are impacts that occur as a result of direct physical damage (Section 3).
170 G. Wilson et al. / Journal of Volcanology and Geothermal Research 286 (2014) 148–182
overheating and shutdown of HVAC and electronic equipment,causing disruption to services. During the 1992 Mt. Spurr, Alaskaeruption, tephra fall (3 mm) blocked a number of HVAC systemfilters. Fortunately no electronic equipment overheated due to thecool ambient temperatures in Anchorage at the time (Wilsonet al., 2012b). Computers may also suffer from jamming of mechan-ical components and keyboards and overheating under a thick cov-ering of tephra (Gordon et al., 2005; Wilson et al., 2012a). Generallydisruption appears to be temporary as once tephra has beenremoved from the components, functionality is restored (Wilsonet al., 2012a).
3.7. Buildings
Buildings and other similar structures can be impacted by all volcanichazards considered here. Buildings may experience no or light physicaldamage through to complete destruction. We review structural damagefrom increased lateral and static loads, fire, abrasion and corrosion. Werefer the reader to Baxter et al. (2005) and Jenkins et al. (2014a) for a de-tailed review of building impacts for tephra fall and PDC hazards.
3.7.1. Physical damage from lateral loadsVolcanic flows cause extensive damage to buildings located in and
near flow paths (e.g., de Bélizal et al., 2013) (Fig. 5). Historic eruptionsat Mt. Vesuvius (79 AD) and Mt. Pelée, Martinique (1902) and the re-cent eruptions at Mt. St. Helens (1980), Unzen volcano (1991) andMerapi volcano (1994, 2006, 2010) demonstrate that PDCs cause sub-stantial damage to buildings and structures (Fig. 5A). Lahars generatedduring and after the eruptions of Mt. Pinatubo (1991) and Chaitén(2008) flowed into populated areas, causing considerable destructionand burial of buildings (Janda et al., 1996; Pierson et al., 2013)(Fig. 12) and large economic losses (Mercado et al., 1996). The principaldamaging mechanism of these flows is increased lateral loads. If lateralloads are greater than the strength of a building's walls and roof (de-pending on the flow height) structural damage will result and in theworst case the building will collapse. Windows and doors are themost vulnerable components in a building as they have low resistanceto lateral loads and are easily damaged by entrained debris impacts(Baxter et al., 2005; Spence et al., 2007). Shielding of buildings by topog-raphy and other buildings can affect damage distribution (Zuccaro andIanniello, 2004).
Lavaflows are less energetic than PDCs and lahars and cause damageto buildings due to their considerable mass and ‘bulldozing’ action(i.e., lava flows can push buildings over) (Fig. 5B). Weaker buildingsand those located in lava flow paths or on the flanks of the volcanoare most vulnerable and sustain the highest degree of damage. Numer-ous volcanoes have produced lava flows that have caused damage tobuildings, including Mt. Vesuvius, Mt. Etna, Nyiragongo volcano, Kilau-ea, Sakura-jima and Heimaey (Blong, 1984). Attempts have beenmade to lessen the impacts of lava flows through water cooling offlows (e.g., Heimaey, 1973: Williams, 1997) and by diverting flowswith barriers (e.g., Mt. Etna, 2001: Barberi et al., 2003) with varyinglevels of success.
3.7.2. Physical damage from static loadsTephra falls can cause damage to buildings by increased static load as
a result of tephra accumulation (Fig. 13). High intensity tephra falls(N100 mm) can increase the static load on a building's roof and if it ex-ceeds the load carrying capacity, damage or collapsemay occur (Spenceet al., 1996) (Fig. 13). Damage and indeed tolerance to damage is depen-dent on building typology and maintenance, tephra density, thicknessand moisture content, as water will increase bulk density and thereforetephra load (Johnston, 1997). During the 1973 Heimaey eruption nu-merous houses with flat roofs suffered collapse following accumulationof ~1 m of dry tephra (Blong, 1984). In contrast, during the 1991 Mt.Pinatubo eruption, ~200 mm of wet tephra was sufficient to cause
severe roof damage to ~50% of the building stock in the town ofCastillejos, whilst the remaining 50% of buildings sustained no orminor damage (Spence et al., 1996). Tephra removal may exacerbateroof damage due to increased static load from people on the roof(Jenkins et al., 2014a). Buildings in close proximity to the volcano aremost vulnerable to structure damage as this is commonly where highintensity tephra accumulations occur.
Non-structural components such as gutters and roof overhangs arevulnerable to increased static loads. Because these elements were notdesigned to withstand large loads, they will sustain damage first duringlow intensity tephra fall.
3.7.3. Other impact mechanismsFire can also cause damage to buildings following PDCs, lava flows
and hot tephra particles. PDCs comprise of hot gases and particles andif these infiltrate a building fires can be ignited. In addition, lava flowshave temperatures above the ignition point of common constructionmaterials and therefore can ignite fires causing damage to many build-ings. In most cases if buildings are not destroyed by lava flow impact,they will be destroyed by fire (Blong, 1984). Flow deposits may alsobury buildings causing further damage and preventing access (Fig. 12).
Abrasion of exterior elements such as windows and cladding mayoccur as a result of tephra falls, PDCs or lahars however damage is likelyto be aesthetic. In addition, prolonged tephra exposure, in the presenceof water, may cause corrosion damage to metal roofs and gutters (Ozeet al., 2013).
4. Characteristics of impacts to critical infrastructure
Empirical data of impacts to critical infrastructure presented above(Section 3) suggests that primary impacts occur on a continuum fromcausing disruption to complete damage (Fig. 14). The hazard intensitywindowoverwhichdisruption anddamage occurs is dependent onhaz-ard type and characteristics, infrastructure design and any preparednessand response actions (Fig. 14). However, disruption resulting from teph-ra fall, PDC and lahar hazards tends to occur at low hazard intensitieswhere there is insufficient intensity to cause damage. Physical damageresults at higher hazard intensities. In contrast, lava flows rarely causedisruption to critical infrastructure systems and tend to cause damageat all intensities (Fig. 5). Secondary disruptionwill also result from phys-ical damage to infrastructure components. A semi-quantitative analysisof infrastructure impacts (Fig. 15), which draws upon impact data fromFigs. 4, 5, 7, 9, and 13 shows that tephra falls tend to cause disruptiontype impacts and less damage, whilst volcanic flows cause high levelsof both damage and associated secondary disruption. The solid line in

Table 7Relevant tephra fall hazard intensity metrics for each infrastructure sector.
Critical infrastructure sector Tephra fall hazard intensity metrics
Thickness Staticload
Particledensity
Surfacechemistry
Grainsize Moisturecontent
Hardness(abrasiveness)
Atmosphericconcentration
Electrical supplyGeneration E E e e ETransmission &
distributionE e E e E t
Water supply networkSource E T E e TTreatment E T E E E EBuried network t t t E
Wastewater networkTreatment E T E e E EBuried network t T t E
Transportation networkRoad E t e e e eAir E t t e E ERail E t t e T eSea e t E t e e T
Buildings E E e T e TCommunication systems e T eCritical components
HVAC E T E e e TElectronics E e E E e T
Abbreviations are: E— strong empirical bases (numerous post-eruption and analytical data); e—weak empirical bases (few post-eruption data); T— strong theoretical bases (likely to berelevant but no post-eruption data); and t — weak theoretical bases (may be relevant). Refer to Table 1 for definitions of hazard intensity metrics.
Table 8Relevant PDC hazard intensity metrics for each infrastructure sector.
Critical infrastructure sector PDC hazard intensity metrics
Dynamicpressure
Velocity Temperature Thickness ofdeposit
Electrical supplyGeneration T T TTransmission & distribution E E t t
Water supply networkSource E E TTreatment T T tBuried network e t
Wastewater networkTreatment T T tBuried network
Transportation networkRoad E T eAir E T tRail T tSea t t
Buildings E E E eCommunication systems E E tCritical components
HVAC T T TElectronics t T T T
Abbreviations are: E — strong empirical bases (numerous post-eruption and analyticaldata); e — weak empirical bases (few post-eruption data); T — strong theoretical bases(likely to be relevant but no post-eruption data); and t — weak theoretical bases (maybe relevant). Refer to Table 1 for definitions of hazard intensity metrics.
171G. Wilson et al. / Journal of Volcanology and Geothermal Research 286 (2014) 148–182
Fig. 15 shows the 1:1 relationship between disruption and damage, withthose infrastructure that plot above or below this line showing their ten-dency to preferentially cause one impact type over the other. A limitationof Fig. 15 is that it assumes generic infrastructure design. There are nu-merous different components, designs and network configurations forsuch infrastructure systems which may vary within and between cities,regions and countries. Each different infrastructure design can influencevulnerability as each design will be tolerant to different hazardintensities.
In the following subsections we discuss the characterisation of im-pacts as causing disruption (Section 4.1) or damage (Section 4.2)based upon hazard types and intensities and infrastructure design. Weexplore how clean-up, exclusion zones, infrastructure design and differ-ent hazard properties influence impact type and severity. We finish bydeveloping impact scales, based on hazard intensity thresholds, to esti-mate vulnerability (Section 4.3.2).
4.1. Disruption impacts to critical infrastructure
Disruption to critical infrastructure can occur as a result of direct inter-actionwith volcanic hazards (Section 4.1.1), as a result of hazard clean-upoperations (Section 4.1.2) and from restricted access with the implemen-tation of emergency management exclusion zones (Section 4.1.3).
4.1.1. Critical infrastructure disruption from direct hazard impactsExamining observed impacts (Section 3) and hazard intensity rela-
tionships (Figs. 4, 5, 7, 9, 13) it is evident thatmost infrastructure sectorscan be disrupted by the direct impact of tephra fall, PDCs and lahars. AsFig. 14 shows, disruption tends to occur at low hazard intensities.
During low intensity tephra falls, there appears to be insufficient ac-cumulated tephra mass to induce any increased static loading damageon these infrastructure components and tephra will simply accumulateon exposed components (Fig. 6B). Likewise, for low intensity regions ofPDCs and lahars (i.e., flow peripheries) there is insufficient dynamicpressure to cause physical damage to critical infrastructure (Baxteret al., 2005) and depositionwill occur. The deposition of unconsolidatedtephra in or on components will cause disruption and reduce functionby causing blockages (e.g., air and water filters) or limiting access and
preventing use of certain infrastructure such as buildings and transpor-tation networks.
In addition, the presence of tephra particles in the atmosphere cancause significant and prolonged disruption for some infrastructure, par-ticularly transportation networks as suspended tephra will reduce visi-bility and cause abrasion damage, for example, the 2010 eruption ofEyjafjallajökull, Iceland and subsequent closure of European and NorthAmerican airpace for six days to prevent aircraft damage (Sammondset al., 2010).

Table 9Relevant lava flow hazard intensity metrics for each infrastructure sector.
Critical infrastructure Lava flow hazard intensity metrics
Presence of lava Depth of flow Dynamic pressure Velocity Temperature Cooling duration
Electrical supplyGeneration T T T TTransmission & distribution e e T T
Water supply networkSource T t t tTreatment T t t tBuried network e E
Wastewater networkTreatment T T TBuried network t
Transportation networkRoad E E TAir E E TRail ESea E E
Buildings E E E E ECommunication systems T T T TCritical components
HVAC T T t tElectronics T T t
Abbreviations are: E— strong empirical bases (numerous post-eruption and analytical data); e—weak empirical bases (few post-eruption data); T— strong theoretical bases (likely to berelevant but no post-eruption data); and t — weak theoretical bases (may be relevant). Refer to Table 1 for definitions of hazard intensity metrics.
Table 10Relevant lahar hazard intensity metrics for each infrastructure sector.
Critical infrastructure sector Lahar hazard intensity metrics
Dynamicpressure
Velocity Thickness ofdeposit
Depth offlow
Electrical supplyGeneration T T TTransmission & distribution E E t e
Water supply networkSource T T TTreatment T T t tBuried network e e
Wastewater networkTreatment T T t tBuried network t t
Transportation networkRoad E E EAir T T ERail E E TSea t t e
Buildings E E ECommunication systems T T t tCritical components
HVAC T T TElectronics e e e
Abbreviations are: E — strong empirical bases (numerous post-eruption and analyticaldata); e — weak empirical bases (few post-eruption data); T — strong theoretical bases(likely to be relevant but no post-eruption data); and t — weak theoretical bases (maybe relevant). Refer to Table 1 for definitions of hazard intensity metrics.
172 G. Wilson et al. / Journal of Volcanology and Geothermal Research 286 (2014) 148–182
Infrastructure component and system design will also influence dis-ruption. Components with no or few moving parts are unlikely to bedamaged at low hazard intensities as tephra particles will not be lodgedbetween moving parts; a primary cause of abrasion damage. However,these components will become covered in tephra limiting access andcausing disruption. Systems with electrical components (e.g., insulatorsand electronic devices) may sustain short circuit faults in the presenceof wet tephra (Wardman et al., 2012c), disrupting their operation. In ad-dition, some infrastructure systems and components, such as road trans-portation and electrical insulators, are resilient to damage at all tephrahazard intensities and are likely to be disrupted at high hazard intensities(Figs. 4 and 8A).
Somedisruptionmay only affect the infrastructure operators. For ex-ample, after the 2011 PCCVC eruption, sandfilters at the Barilochewatertreatment plant required increased maintenance time for cleaninghowever during this time there were no water outages and servicescontinued as normal (Wilson et al., 2013). In these instances, increasedmaintenance requirements will incur additional costs and may preventoperators from undertaking other tasks.
4.1.2. Critical infrastructure disruption during clean-up operationsTephra falls, PDCs and lahars produce unconsolidated deposits that
require removal and clean-up to avoid ongoing and prolonged disrup-tion or to reinstate critical infrastructure services (Wilson et al.,2012b). Proper clean-up will reduce tephra remobilisation, and mini-mise the potential for future damage (e.g., abrasion and corrosion)and human health effects which can result from inhalation of tephraparticles (Horwell and Baxter, 2006).Whilst it is possible for some infra-structure sectors to clean deposits from their equipment and sites with-out causing disruption (e.g., live cleaning of electrical networks), manysectors will have to partially or completely shutdown (a controlledshutdown) to undertake cleaning. Performing controlled shutdownsof all or parts of an infrastructure network will cause further disruptionand prevent society from using these services. In many cases however,this is unavoidable as continued operation may result in physical dam-age of components leading to further disruption. Controlled shutdownsfor cleaning purposes have been documented for electrical supplies toprevent continual flashover (Fig. 4), water supplies to prevent watershortages and plant damage (Fig. 7A) and at airport runways to preventaircraft damage and tephra remobilisation (Fig. 9A). Ultimately the de-cision to clean up unconsolidated deposits and/or initiate controlled
shutdowns will be dependent on hazard intensity but also on the oper-ational practices of the particular infrastructure operators.
4.1.3. Critical infrastructure disruption in exclusion zonesDisruption to critical infrastructure can occur without the presence
of any volcanic hazards through the implementation and enforcementof evacuation and exclusion zones by emergency management author-ities. Generally these zones will be developed for flow hazards, asthese are more dangerous than tephra fall. Zones may be implementedprior to the onset of an eruption or during an eruption to prevent loss oflife in dangerous areas. If infrastructure networks or sites are located

173G. Wilson et al. / Journal of Volcanology and Geothermal Research 286 (2014) 148–182
within these zones, services are likely to be disrupted as personnel willnot be able to access these areas. For example, during the eruption ofMontserrat (1995–ongoing) and the subsequent destruction of Plym-outh, the water utility had to move some of the springs and wellswhich were located inside the exclusion zone (Sword-Daniels et al.,2014). If infrastructurewithin an exclusion zone is damaged it is unlike-ly that personnel will be able to enter to perform repairs unless anagreement is made with emergency management officials.
4.2. Physical damage to critical infrastructure
All volcanic hazards considered here can cause physical damage tocritical infrastructure sectors and components. Physical damage hasbeen observed occurring at all intensity levels for PDCs, lahars andlava flows (Fig. 5) and at high intensity tephra falls (Figs. 4, 5, 7, 9, 13).
Abrasion damage can occur to any exposed element as a result ofcontamination with tephra particles or from passing PDCs and lahars.Components with moving parts such as water and wastewater pumps,electrical switches, and cooling fans are more vulnerable as tephra par-ticles may become lodged between moving surfaces. Abrasion damageto pumps has been documented for water supply and wastewater net-works at tephra thicknesses of N30 mm and N4 mm, respectively(Fig. 7). Whilst these reports document the tephra thickness at whichdamage occurred, hazard exposure time, which is a primary control forabrasion severity, is not documented. Likewise, corrosion of metal sur-faces, particularly building roofs (Fig. 13), also occurs over time. In addi-tion, increasing tephra thickness will increase corrosion severity asmore acidic tephra leachates will be delivered to the roof surface (Ozeet al., 2013).
At higher tephra fall intensities structural damage can occur due toincreased static loading. Most observed tephra-induced structural dam-age has occurred to buildings (residential and commercial) and theirroofs (Fig. 13), as research has tended to focus on occupant safety. How-ever, tephra accumulations on other exposed infrastructure compo-nents (e.g., electrical substation gantries, water storage and treatmenttanks) are likely to cause structural damage if the load exceeds thestructure's strength. Damage severity is influenced by tephra densityand moisture content as these parameters increase so does the staticload on the structure (Macedonio and Costa, 2012; Jenkins et al.,2014a). Damage to non-structural elements is likely to occur first asthey are inherently weaker than engineered structural components.
PDCs, lahars and lava flows cause physical damage at all hazard in-tensities (Fig. 5). The primary damagemechanism is increased dynamicpressures which overcome structural design causing structures to fail.PDCs and lahars become rapidly less energetic with increasing distancefrom vent and flow axis (Spence et al., 2004b; Jenkins et al., 2013) andhigher damage severity is expected in flow paths and river valleys andin proximal areas (Baxter et al., 2005). However, damage assessmentsof Baxter et al. (2005) and Jenkins et al. (2013) suggest that dynamicpressures can vary between ~1 and 5 kPa within tens of metres,resulting in non-uniform building damage. For most infrastructure sec-tors there is a lack of data (Fig. 5) regarding gradations in damage sever-ity and therefore as a first order approximation, we assume a binaryimpactmodel,where damage is predicated on thepresence of a volcanicflow(s). However for building damage there is sufficient impact data(e.g., Spence et al., 2004a; Baxter et al., 2005; Jenkins et al., 2013) to as-sess gradational damage.
Lava flows and sufficiently hot PDCs will cause fire damage to com-bustible structures and materials. Once a structure is ignited it will gen-erally be completely destroyed byfire; formost structures, the benefit ofextinguishing the fire is far outweighed by life safety concerns thatwould be encountered in an attempt. Buildings, structures and infra-structure (e.g., transportation routes) will become inundated and cov-ered by volcanic flows, resulting in disruption or permanent damage,especially for lava which will solidify once cooled.
4.3. Estimating critical infrastructure vulnerability
Estimating vulnerability of critical infrastructure to volcanic erup-tions can be difficult due to the number of facets that influence vulner-ability and resilience. By reviewing empirical data (Figs. 4, 5, 7, 9, 13)relationships between disruption and/or damage and hazard intensity(Section 4.3.1) can be estimated and presented using impact scales(Section 4.3.2). When assessing vulnerability, consideration must alsobe given to the interactions between multiple volcanic hazards(Section 4.3.3).
4.3.1. Hazard intensity metricsVolcanic hazards have a number of different hazard properties
which can cause disruption and damage. This is in contrast to other nat-ural hazards where there are generally few hazard properties whichcontribute to disruption and damage. For example, the principal damag-ing property of earthquakes is ground shaking, commonly assessed bypeak ground acceleration, whereas PDCs can cause damage through lat-eral loading (dynamic pressure) and fire (temperature). We definethese properties collectively as hazard intensity metrics (HIMs). Whenassessing vulnerability a single HIM may not accurately capture all ofthe impactful attributes that a hazard has to a particular infrastructuresector. To this end, Tables 7–10 present the relative relevance of differ-ent HIMs for each volcanic hazard and infrastructure sector and providean indication on whether these are strong empirical or theoretical rela-tionships. Selection of a HIM for vulnerability and risk assessmentshould consider: (1) the HIMs' appropriateness to accurately describea range of impact severity; (2) the ease of HIM measurement in thefield or laboratory; and (3) the applicability of the HIM to hazardmodel outputs. The most appropriate and commonly used HIM candi-dates are thickness or mass loading (tephra fall), dynamic pressure(PDC),flowheight (lavaflow) andflowvelocity (lahar), however differ-ent HIMs can be used depending on the impact(s) and infrastructuresector(s) of interest.
4.3.2. Disruption and damage statesTo classify and categorise impacts to critical infrastructure a com-
mon impact scale can be used (Blong, 2003b)which includes disruptionand damage states. In volcanology, impact scales are available for build-ing damage from tephra fall (e.g., Spence et al., 1996; Blong, 2003a) andPDC impacts (e.g., Spence et al., 2004b; Baxter et al., 2005). Here we ex-pand impact scale coverage to include critical infrastructure sectors ex-amined in Section 3 for tephra fall, PDC, lava flow and lahar hazards(Tables 11–14).We define four common impact levels: Level 0, no dam-age; Level 1, cleaning required; Level 2, repair required; and Level 3, re-placement or financially expensive repair. Four levels were chosenbecause empirical impact data across a range of impact levels was lack-ing for most infrastructure and therefore further subdivision was notjustified. Separate descriptions for disruption and physical damage areprovided to reflect impact dichotomy presented in Sections 4.1 and4.2. For each impact scale (Tables 11–14) the most diagnostic HIM,based on its relationship with empirically observed impacts, was used,these are: thickness (tephra fall); dynamic pressure (PDC); flow depth(lava flow); and flow velocity (lahar) (Tables 7–10). Intensity thresh-olds were derived by categorising empirical impact data in Figs. 4, 5, 7,9, and 13 and Section 3 and by using expert judgement to indicate antic-ipated impacts where data was lacking, primarily at high hazardintensities.
For tephra fall (Table 11), different intensity thresholds were de-rived for each critical infrastructure sector because each sector respondsdifferently given a specific hazard intensity. For example, ~1 mm oftephra will close an airport whilst this tephra thickness will not causeany damage to a building. Differences in how infrastructures respondto tephra fall precluded the use of generic tephra fall thresholds whichwould be applicable to all infrastructure sectors. In contrast, for PDCsand lahars (Tables 12 and 14) we consider impacts to be binary for all

Table 11Proposed disruption and damage levels for expected impacts to critical infrastructure as a function of tephra fall thickness (mm).
Level Level 0 Level 1 Level 2 Level 3
Description No damage Cleaning required Repair required Replacement or financiallyexpensive repair
Electrical supply Threshold (mm) b3 3–10 10–100 N100Damage No damage Possible abrasion to some moving
parts, infiltration of tephra intosubstation gravel.
Damage to exposed equipmentespecially those with movingparts, possible electrical linebreakage.
Structural damage to someequipment at generation andtransmission/distribution sites,irreparable damage to movingparts (e.g., hydro powerturbines).
Disruption No disruption Temporary disruption to service caused by insulator flashover, cleaning andrepair.
Widespread disruption toelectrical supply with possiblepermanent disruption.
Water supply network Threshold (mm) b1 1–20 20–100 N100Damage No damage Possible clogging of filters and
some abrasion to movingcomponents.
Damage to pumping equipment,other moving parts and infilling oftanks.
Collapse of reservoir roofs andinfilling of open reservoirs andtanks.
Disruption No disruption Normal operation with increasedfrequency of filter cleaning andincreased turbidity.
Contamination of water andincreased treatment required.Possible water use restrictions.
Severe contamination of watersupply and exhaustion of supplydue to damage and/or increaseddemand.
Wastewater network Threshold (mm) b3 3–10 10–50 N50Damage No damage Possible minor abrasion to pumps,
clogging of filters and possibleinterference with chemicaltreatment process.
Large amounts of sedimentationin network some causingblockages, some damage totreatment plant components andpossible infilling of open tanks.
Widespread sedimentationthroughout entire networkcausing some blockages,irreparable damage to pumps andextensive structural damage totreatment plant components.
Disruption No disruption Reduced capacity, operation withincreased cleaning of filters.
Temporary disruption to serviceto unblock network and cleantanks possibly resulting indischarge of untreated sewage.
Long term to possible permanentdisruption to service. Unable totreat wastewater, discharge ofuntreated sewage.
Airport Threshold (mm) b1 1–30 30–150 N150Damage No damage Possible abrasion of runway and
apron markings and possibleabrasion of paved surfaces.
Moderate abrasion of pavedsurfaces and landing lights.
Complete burial.
Disruption Airport open Airport closure, reduced visibility. Possible permanent closure.Road Threshold (mm) b2 2–50 50–150 N150
Damage No damage Possible abrasion of roadmarkings and possible abrasion ofpaved surfaces.
Moderate abrasion of pavedsurfaces, weak bridges mayexperience structural damage.
Complete burial, structuraldamage to some bridges.
Disruption No disruption Reduced visibility, loss of traction,covering of markings and possibleroad closure.
Roads impassable for 2WDvehicles. Dangerous drivingconditions.
Roads impassable if tephra isunconsolidated, compactedtephra may be driven on by 4WDvehicles. Widespread roadclosures.
174G.W
ilsonetal./JournalofV
olcanologyand
Geotherm
alResearch286
(2014)148
–182

Rail Threshold (mm) b1 1–30 30–150 N150No damage Possible abrasion and/or corrosion of railway tracks and signals, jamming of
mechanical signals and contamination of track ballast.Complete burial
No disruption Reduced visibility, signals andcommunications disrupted.
Loss of traction and possiblederailing.
Impassable.
Marine Threshold (mm) b1 1–30 30–150 N150No damage Possible abrasion of paved
surfaces.Moderate abrasion of pavedsurfaces, pumice rafts coveringthe water surface.
Complete burial of paved surfaces.
No disruption Reduced visibility on land and sea. Ship movements obstructed bypumice rafts.
Inoperable.
Vehicles Threshold (mm) b3 3–30 30–100 N100Damage No damage Possible abrasion and/or corrosion
to windshields, paintwork, aircraftleading edges, moving parts andclogging of air filters.
Extensive abrasion of movingparts and possible seizing ofengines.
Extensive damage that isuneconomical to repair.
Disruption No disruption Infiltration of tephra into personalcompartments.
Frequent fluid and filterreplacement and possiblecleaning and reconditioning ofengines.
Completely inoperable.
Communications Threshold (mm) b5 5–30 30–100 N100Damage No damage No damage Blockage and shutdown of cooling
systems and damage to exposedcomponents (e.g., dishes, towers,lines).
Structural damage tocommunication components(e.g., dishes, towers, lines).
Disruption No disruption Overloading of communicationnetwork from high demand andpossible signal attenuation andinterference.
Temporary disruption to servicedue to shutdowns and cleaning.
Permanent disruption.
Buildings Threshold (mm) b10 10–100 100–500 N500Damage No damage Light roof damage and gutter
damage and possible abrasion towindows and cladding.
Severe roof damage, damage tovertical structure, possible partialcollapse.
Complete roof collapse and severedamage to rest of building.
Disruption Occupied Infiltration of tephra into buildingand able to be occupied.
Large volumes of tephra insidebuilding as well as parts of thestructure, uninhabitable.
Beyond economic repair anduninhabitable.
Critical components Threshold (mm) b1 1–10 10–50 N50Damage No damage No damage Abrasion of moving parts and
blockage of filters.Extensive damage to mostcomponents.
Disruption No disruption Reduced function until cleaned. Reduced function and temporaryshutdowns until cleaned.
Uneconomic to repair, disruptionto service until replaced.
Disruption and damage descriptions and threshold values are subject to uncertainty and assume generic infrastructure design. Italicised threshold values indicate where expert judgement was used to derive theoretical estimates of when disruptionand damage would occur. Disruption and damage at higher intensities (Level 3) include those at lower intensities (Level 1).
175G.W
ilsonetal./JournalofV
olcanologyand
Geotherm
alResearch286
(2014)148
–182

Table 12Proposed disruption and damage levels for expected impacts to critical infrastructure as a function of PDC dynamic pressure (kPa).
Level Level 0 Level 1 Level 2 Level 3
Description No damage Cleaning required Repair required Replacement or financiallyexpensive repair
Electrical supply Threshold (kPa) b0 – – N0Damage No damage – – Destruction of
transmission anddistribution lines, poles,towers and substations anddamage to generation sites.
Disruption No disruption – – Permanent disruption toservice.
Water supply network Threshold (kPa) b0 – – N0Damage No damage – – Damage to treatment
facilities and above-groundpipes and infilling of un-covered water sources.
Disruption No disruption – – Permanent disruption toservice.
Wastewater network Threshold (kPa) b0 – – N0Damage No damage – – Damage to treatment
facilities and above-groundpipes, infilling of ponds andblockage of drains.
Disruption No disruption – – Permanent disruption toservice.
Transport Threshold (kPa) b0 – – N0Damage No damage – – Complete burial and heat
damage of paved surfacesand railways. Destructionof some bridges. Infilling ofharbours.
Disruption No disruption – – Roads and rail impassableand widespread closures.
Vehicles Threshold (kPa) b0 – – N0Damage No damage – – Vehicles buried,
extensively damaged bypressure and heat andswept away.
Disruption No disruption – – Completely inoperable.Communications Threshold (kPa) b0 – – N0
Damage – – Destruction of ground levelcomponents (e.g., lines,cabinets, exchanges).
Disruption No disruption – – Permanent disruption andsignal interference causedby pyroclastic surges.
Buildings Threshold (kPa) b1 1–10 10–25 N25Damage No damage Openings damaged,
possible internal firedamage, external firedamage, sandblasting ofwalls and some damage toweak masonry.
All opening damaged,missile impacts evidentand partial collapse ofwalls and/or roof,extensive internal firedamage.
Complete damage tobuilding with fewstructural elementsremaining.
Disruption Occupied Infiltration of tephra,missiles and buildingmaterial into building andfire damage making ituninhabitable.
Beyond economic repairand uninhabitable.
Critical components Threshold (kPa) b0 – – N0Damage No damage – – Complete destruction of
exposed electronicequipment with mostbeing swept away and/orburied and melting ofplastic components.
Disruption No disruption – – No functionality anduneconomic to repair.
Disruption and damage descriptions and threshold values are subject to uncertainty and assume generic infrastructure design. Impacts to most infrastructure are considered binary (seeSection 4.2) thus there are no descriptions for Level 1 or Level 2 except for buildings where there is additional empirical data. Italicised threshold values indicate where expert judgementwas used to derive theoretical estimates of when disruption and damage would occur.
176 G. Wilson et al. / Journal of Volcanology and Geothermal Research 286 (2014) 148–182
infrastructure sectors except buildings.Whilst theremay be gradationalinfrastructure impacts from PDCs and lahars at flow margins (seeSection 4.2) we found insufficient empirical evidence to derive hazardthresholds for intermediary impact states. Intermediary impact states
for building damage are included and are drawn from the existing scalesof Baxter et al. (2005) and Spence et al. (2004b). For lavaflowhazardsweconsider impacts to be binary for all infrastructure sectors (Table 13)based on the destructiveness of lava flows.

177G. Wilson et al. / Journal of Volcanology and Geothermal Research 286 (2014) 148–182
Caution is urged when using our impact scales (Tables 11–14) as anumber of assumptions have beenmade, such as: generic infrastructuredesign and typology, one discrete hazard occurrence and no mitigationactions taken by infrastructure operators. These scales should only beused either as guides or at regional scale vulnerability and risk assess-ment. Whenever possible, local vulnerability studies which accountfor each system's vulnerability characteristics should be undertakenfirst.
4.3.3. Interactions between volcanic hazardsDuring a volcanic eruption multiple hazardous phenomena often
occur simultaneously or in short succession. This is caused by changesin eruption style (from effusive to explosive or from explosive to
Table 13Proposed disruption and damage levels for expected impacts to critical infrastructure as a func
Level Level 0 Lev
Description No damage Cle
Electrical supply Threshold (m) b0 –
Damage No damage –
Disruption No disruption –
Water supply network Threshold (m) b0 –
Damage No damage –
Disruption No disruption –
Wastewater network Threshold (m) b0 –
Damage No damage –
Disruption No disruption –
Transport Threshold (m) b0 –
Damage No damage –
Disruption No disruption –
Vehicles Threshold (m) b0 –
Damage No damage –
Disruption No disruption –
Communications Threshold (m) b0 –
Damage No damage –
Disruption No disruption –
Buildings Threshold (m) b0 –
Damage No damage –
Disruption Occupied –
Critical components Threshold (m) b0 –
Damage No damage –
Disruption No disruption –
Disruption and damage descriptions and threshold values are subject to uncertainty and assumeSection 4.2) thus there are no descriptions for Level 1 or Level 2.
effusive), during explosive eruptions or as a result of multiple ventserupting simultaneously. The interaction and impact of multiple volca-nic hazards on critical infrastructure may lead to different vulnerabilityoutcomes compared to single hazard impacts. However, multiple volca-nic hazard impacts are rarely studied because of the increased complex-ity of hazard and infrastructure interactions.
One study that addresses multi-volcanic hazard impacts is Zuccaroet al. (2008). They investigate impacts on residential buildings fromtephra fall with simultaneous earthquakes or PDCs for a simulated Mt.Vesuvius eruption. For the combination of tephra fall and earthquakea decrease in the seismic response of the building was observed,i.e., the building is more susceptible to earthquake damage if tephra isdeposited on the roof. For the scenario of tephra fall followed by a
tion of lava flow depth (m).
el 1 Level 2 Level 3
aning required Repair required Replacement or financiallyexpensive repair
– N0– Destruction of
transmission anddistribution lines, poles,towers and damage aburial of substations andgeneration sites.
– Permanent disruption toservice.
– N0– Damage to treatment
facilities and above-groundpipes and infilling of un-covered water sources.
– Permanent disruption toservice.
– N0– Damage to treatment
facilities and above-groundpipes, infilling of ponds andburial of drains.
– Permanent disruption toservice.
– N0– Complete burial heat
damage to paved surfacesand railways.
– Transportation routesimpassable resulting inpermanent closure.
– N0– Vehicles buried and burnt.– Completely inoperable.– N0– Destruction and burial of
ground level components(e.g., lines, cabinets,exchanges).
– Permanent disruption.– N0– Complete fire damage to
building and burial.– Beyond economic repair
and uninhabitable.– N0– Complete destruction and
burial of exposedelectronic equipment andmelting of plasticcomponents.
– No functionality anduneconomic to repair.
generic infrastructure design. Impacts to all infrastructure are considered binary (see

Table 14Proposed disruption and damage levels for expected impacts to critical infrastructure as a function of lahar velocity (m/s).
Level Level 0 Level 1 Level 2 Level 3
Description No damage Cleaning required Repair required Replacement or financiallyexpensive repair
Electrical supply Threshold (m/s) b0 – – N0Damage No damage – – Destruction of transmission
and distribution lines, poles,towers and substations anddamage to generation sites(e.g., abrasion to hydro pow-er turbines).
Disruption No disruption – – Permanent disruption toservice.
Water supplynetwork
Threshold (m/s) b0 – – N0Damage No damage – – Damage to treatment
facilities, above-groundpipes and water intakestructures and infilling ofuncovered water sources.
Disruption No disruption – – Permanent disruption toservice due to damage andsevere contamination.
Wastewaternetwork
Threshold (m/s) b0 – – N0Damage No damage – – Damage to treatment
facilities and above-groundpipes, infilling of ponds andblockage of drains.
Disruption No disruption – – Permanent disruption toservice.
Transport Threshold (m/s) b0 – – N0Damage No damage – – Complete burial and erosion
damage to paved surfacesand railways. Destruction ofsome bridges and scour ofembankments. Infilling ofharbour.
Disruption No disruption – – Transportation routesimpassable resulting inpermanent closure.
Vehicles Threshold (m/s) b0 – – N0Damage No damage – – Vehicles buried, extensively
damaged by pressure andswept away.
Disruption No disruption – – Completely inoperable.Communications Threshold (m/s) b0 – – N0
Damage No damage – – Destruction of ground levelcomponents (e.g., lines, cab-inets, exchanges).
Disruption No disruption – – Permanent disruption.Buildings Threshold (m/s) b1 1–3 3–5 N5
Damage No damage Damage to openings andnon-structural elements andinfilling of building interiorwith debris.
Moderate structural damageto walls, some partiallycollapse.
Complete damage tobuilding with few structuralelements remaining and/orswept off foundations.
Disruption Occupied Infiltration of debris and building material into buildingmaking it uninhabitable.
Beyond economic repair anduninhabitable.
Criticalcomponents
Threshold (m/s) b0 – – N0Damage No damage – – Complete destruction of
exposed electronicequipment with most beingswept away and/or buried.
Disruption No disruption – – No functionality anduneconomic to repair.
Disruption and damage descriptions and threshold values are subject to uncertainty and assume generic infrastructure design. Impacts to most infrastructure are considered binary (seeSection 4.2) thus there are no descriptions for Level 1 or Level 2 except for buildings where there is additional empirical data. Italicised threshold values indicate where expert judgementwas used to derive theoretical estimates of when disruption and damage would occur.
178 G. Wilson et al. / Journal of Volcanology and Geothermal Research 286 (2014) 148–182
PDC, Zuccaro et al. (2008) found that the vertical load exerted on theroof from tephra fall provided a stabilising effect when the buildingwas impacted by a PDC.Whilst this approach estimatedbuilding vulner-ability it could also be applied to critical infrastructure. Multi-volcanichazard research should be advanced to develop vulnerability assess-ments for volcanic eruptions and/or scenarios rather than just specificindividual volcanic hazards.
5. Future direction
5.1. Implications for volcanic risk assessment
Over the past few decades there has been an emphasis on under-standing, quantifying and modelling volcanic hazards. This has pro-duced a number of high quality empirical, physical and probabilistic

179G. Wilson et al. / Journal of Volcanology and Geothermal Research 286 (2014) 148–182
models which evaluate occurrence probabilities and spatial extents ofvarious volcanic hazards (e.g., Schilling, 1998; Bonadonna, 2006;Charbonnier and Gertisser, 2009; Wadge, 2009; Marzocchi et al.,2010; Jenkins et al., 2012). These models have contributed to a detailedunderstanding of volcanic hazards and have greatly improved thecontribution of volcanology science to disaster risk reduction andmanagement.
At present, volcanic vulnerability and comprehensive risk assess-ments are less advanced than hazard assessments (Section 2), howeverthe contributions of Blong (1984), Spence et al. (1996), Blong (2003a),Baxter et al. (2005), Wardman et al. (2012c), Wilson et al. (2012b)and Jenkins et al. (2014a) have progressively increased and broadenedthe knowledge of volcanic impact occurrence, damage mechanisms,mitigation strategies and emergency management response. Whilstthese studies go a longway towards improved vulnerability assessment,collectively they have not progressed to the point of developing robustquantitative vulnerability models to inform land-use planning and in-frastructure design codes (perhaps with the exception of residentialbuildings). Additionally, lack of awareness of volcanic impacts in criticalinfrastructure mitigation strategies, such as citing, design and contin-gency planning rarely, if ever, consider volcanic hazards. Whilst land-use planning and engineering designmight not be appropriate in all sit-uations it is appropriate for sensitive and/or high value infrastructure,such as nuclear power stations. For example, the International AtomicEnergy Agency initiative (IAEA, 2013) has considered volcanic hazardsin site evaluation at nuclear power installations. TheNZVISG science/in-dustry collaboration is also an example of critical infrastructure organi-sations supporting and using volcanic resiliency research to reduce risk(Wilson et al., 2014). And global awareness is increasingwith the inclu-sion of volcanic hazards for the first time in the Global Assessment Re-port on Disasters Risk Reduction 2015 (Jenkins et al., 2014b).Engineering design, often implemented at little extra cost, and effectivecontingency planning is likely to offer substantial societal benefitsthrough reduced infrastructure service downtime and restorationcosts. A cost–benefit analysis would be the next step to investigate thevalue of such mitigation strategies.
5.2. Goals for the next 10 to 25 years
Reducing the impacts of volcanic eruptions on society is the ultimategoal of volcanic riskmanagement. Population growth, land-use pressureand society's increasing expectation of infrastructure performance dur-ing and after disasters will make this a challenge for critical infrastruc-ture operators.
To progress towards increased critical infrastructure resilience, acrucial first step is for infrastructure operators to include volcanic haz-ards as a risk routinely managed. A value proposition is requiredwhere scientists and operators identify and establish the risk contextand demonstrate the value of risk mitigation. The scientific communitymust support this collaboration through producing the best possiblequality hazard, vulnerability and risk information to support riskmitiga-tion and management. Broad and in-depth understanding of direct andindirect impacts from all credible volcanic hazards and hazard intensi-ties is required. By first understanding the intensity at which impactsoccur for different critical infrastructure components and the resultingimpact severity enables decisions to be made about the most appropri-ate mitigation strategy for the particular situation; whether it be land-use planning, infrastructure design or contingency planning (Table 6).To improve volcanic vulnerability assessments, the volcanology com-munity in partnership with engineers, infrastructure operators, riskand continuity managers, and the communities which rely on criticalservices, need to identify safe and acceptable levels of critical infrastruc-ture performance during volcanic crises by robustly analysing existingimpact data and seeking additional quantitative empirical and theoret-ical data. Continued investment in research to identify and refine vulner-ability (or conversely resilience) of critical infrastructure requires
continued field observations, laboratory experiments and numericalmodelling to inform mitigation strategies and resilience design. We ac-knowledge that this can be resource intensive and in some cases imprac-tical due to hazard and infrastructure complexity, but if the benefit ofmitigation strategies is well defined and recognised then such invest-ments become justified. Mitigation for volcanic hazards is also likely toreduce risk for other non-volcanic hazards.
Future research priorities to reduce risk and increase resilience forcritical infrastructure sectors that we believe should be addressed with-in the next 10 to 25 years are:
(1) Focus on quantitative vulnerability estimation for critical infra-structure impacted by volcanic hazards. This should includeopen source standardised methodologies and databases for col-lection of quantitative impact data from post-eruption field as-sessments, laboratory experiments and numerical modellingand the derivation of fragility and vulnerability functions. Devel-oping such approaches for critical infrastructurewill be challeng-ing due to the wide variability in system and component design,operational requirements and the interdependency between dif-ferent infrastructure sectors. However, a standardised approachallows repeatable quantitative vulnerability estimates to bemade and facilitates direct comparisons with other critical infra-structure and natural hazards.
(2) Laboratory analysis of infrastructure systems and componentsunder controlled conditions tomore robustly informvulnerabilityestimates; particularly for high-value infrastructure componentsfrom which society requires high levels of reliable performance.
(3) Increasing the awareness of volcanic hazards, their impacts andthe value of volcanic risk management for critical infrastructureoperators. This may be achieved through partnerships betweenvolcanic scientists, infrastructure operators and engineers to en-courage the inclusion of volcanic hazards in infrastructure siteevaluation/assessment criteria, design and contingency planningaimed at increasing resilience.
(4) Demonstrate the value of volcanic riskmanagement for critical in-frastructure by the provision of useful andunderstandable vulner-ability and mitigation information, backed by cost–benefitanalysis, to critical infrastructure operators so informed decisionmaking regarding infrastructure operation and resilience cantake place.
6. Summary
This paper reviews disruption and physical damage impacts to criti-cal infrastructure sectors from tephra falls, pyroclastic density currents(PDC), lava flows and lahars. Data are primarily from post-eruption im-pact assessments and are generally qualitative, although several quanti-tative assessments are available. Impacts to critical infrastructure can beclassified on a continuum from disruption to complete damage. Impactseverity is primarily controlled by the type of hazard, its intensity andthe specific type of infrastructure and its design. In general, disruptionoccurs at low hazard intensities for tephra falls, PDCs and lahars, whilstphysical damage occurs at higher intensities for all hazards. Lava flowsare the exception and tend to cause physical damage at all intensities.
Quantitative volcanic hazard assessment is at an advanced state,however, quantitative vulnerability assessments are lacking. The lackof these assessments can be attributed to: (1) difficulties in determiningwhich hazard characteristic is the primary cause of damage to infra-structure and its accurate measurement; (2) ongoing eruptions, clean-up and mitigative strategies can alter infrastructure impacts and arechallenging to account for in assessments; and (3) lack of volcanic con-struction or design codes, or performance guidelines which couldprompt and facilitate detailed vulnerability assessment. Despite this,several studies have assessed the vulnerability of buildings and criticalinfrastructure sectors impacted by tephra fall, PDCs and lahars. To

180 G. Wilson et al. / Journal of Volcanology and Geothermal Research 286 (2014) 148–182
facilitate continued development of vulnerability assessments in volca-nology, impacts to critical infrastructure from volcanic hazards shouldbe quantified in a more robust, systematic and standardised manner.We have highlighted a number of aspects to consider when estimatingvulnerability and developing fragility and vulnerability functions, suchas hazard intensity measures, hazard interactions, infrastructure inter-dependencies, limitations and uncertainties.
We challenge the volcanology community to create a consistentmethodology for the development and refinement of physical vulnera-bility assessment for all volcanic hazards and critical infrastructure. Thefinal goal is to provide robust quantified vulnerability estimates for vol-canic riskmanagers, decisionmakers and policy experts in order tomin-imise disruption, reduce economic losses and loss of life during volcaniceruptions.
Supplementary data to this article can be found online at http://dx.doi.org/10.1016/j.jvolgeores.2014.08.030.
Acknowledgements
We are grateful to Mr. T. Horscroft, Elsevier review paper coordina-tor, for inviting this review paper. Thanks to Dr. Carol Stewart and Dr.Graham Leonard for discussions and perspectives which improved thecontent and presentation of this manuscript. We greatly acknowledgefunding support fromDEVORA (GW, TW, NID), theMinistry of Business,Innovation and Employment's Natural Hazard Research Platform con-tract C05X0804 (TW and JC), Mason Trust (GW), Royal Society of NewZealand (Canterbury Branch) travel grant (GW), GNS Science and theEarthquake Commission.
References
Andronico, D., Branca, S., Calvari, S., Burton, M., Caltabiano, T., Corsaro, R.A., Del Carlo, P.,Garfì, G., Lodato, L., Miraglia, L., Murè, F., Neri, M., Recora, E., Pompolio, M., Salerno,G., Spampinato, L., 2005. A multi-disciplinary study of the 2002–03 Etna eruption: in-sights into a complex plumbing system. Bull. Volcanol. 67 (4), 314–330.
Aspinall, W., Crooke, R., 2013. Quantifying scientific uncertainty from expert judgementelicitation. In: Rougier, J., Sparks, R.S.J., Hill, L. (Eds.), Risk and Uncertainty Assessmentfor Natural Hazards. Cambridge University Press, Cambridge, p. 588.
Aspinall, W., Auker, M., Hincks, T., Mahony, S., Nadim, F., Pooley, J., Sparks, S., Syre, E.,2011. GFDRR, Volcano Risk Study, Volcano Hazard and Exposure in GFDRR PriorityCountries and Risk Mitigation Measures. Norwegian Geotechnical Institute report20100806.
Associated Press, 1984. Lava cuts main power line. The Spokesman—Review. , (Spokane,Washington).
Auker, M.R., Sparks, R.S.J., Siebert, L., Crosweller, H.C., Ewert, J., 2013. A statistical analysisof the global historical volcanic fatalities record. J. Appl. Volcanol. 2 (1), 1–24.
Barberi, F., Brondi, F., Carapezza, M.L., Cavarra, L., Murgia, C., 2003. Earthen barriers to con-trol lava flows in the 2001 eruption of Mt. Etna. J. Volcanol. Geotherm. Res. 123 (1),231–243.
Barnard, S., 2009. The vulnerability of New Zealand lifelines infrastructure to ashfall(PhDThesis) University of Canterbury, Christchurch, New Zealand.
Baxter, P.J., Ancia, A., 2002. Human Health and Vulnerability in the Nyiragongo VolcanoCrisis Democratic Republic of Congo 2002. World Health Organisation.
Baxter, P., Allard, P., Halbwachs, M., Komorowski, J., Andrew, W., Ancia, A., 2003. Humanhealth and vulnerability in the Nyiragongo volcano eruption and humanitarian crisisat Goma, Democratic Republic of Congo. Acta Vulcanol. 14, 109–114.
Baxter, P.J., Boyle, R., Cole, P., Neri, A., Spence, R.J.S., Zuccaro, G., 2005. The impacts of py-roclastic surges on buildings at the eruption of the Soufrière Hills, Montserrat. Bull.Volcanol. 67, 292–313.
Baxter, P.J., Aspinall, W.P., Neri, A., Zuccaro, G., Spence, R.J.S., Cioni, R., Woo, G., 2008.Emergency planning and mitigation at Vesuvius: a new evidence-based approach.J. Volcanol. Geotherm. Res. 178 (3), 454–473.
Blong, R.J., 1984. Volcanic Hazards: A Sourcebook on the Effects of Eruptions. AcademicPress, Sydney.
Blong, R.J., 2003a. Building damage in Rabaul, Papua New Guinea, 1994. Bull. Volcanol. 65(1), 43–54.
Blong, R.J., 2003b. A review of damage intensity scales. Nat. Hazards 29, 57–76.Bonadonna, C., 2006. Probabilistic modelling of tephra dispersion. In: Mader, H.M., Coles,
S.G., Connor, C.B., Connor, L.J. (Eds.), Statistics in VolcanologySpecial Publication ofIAVCEI. Geological Society of London, London, pp. 243–259.
Branney, M.J., Kokelaar, P., 2002. Pyroclastic Density Currents and the Sedimentation ofIgnimbrites. Geological Society, London.
Burgisser, A., Bergantz, G.W., 2002. Reconciling pyroclastic flow and surge; the mul-tiphase physics of pyroclastic density currents. Earth Planet. Sci. Lett. 202,405–418.
Carey, S., Bursik, M., 2000. Volcanic plumes. In: Sigurdsson, H., Houghton, B.F., McNutt, S.R., Rymer, H., Stix, J. (Eds.), Encyclopedia of Volcanoes. Elsevier Inc., San Diego, pp.527–544.
Casadevall, T.J., 1994. Volcanic ash and aviation safety. Proceedings of the First Interna-tional Symposium on Volcanic Ash and Aviation Safety. US Geological Survey Bulletin,Seattle, Washington.
Cashman, K.V., Sturtevant, B., Papale, P., Navon, O., 2000. Magmatic fragmentation. In:Sigurdsson, H., Houghton, B.F., McNutt, S.R., Rymer, H., Stix, J. (Eds.), Encyclopediaof Volcanoes. Elsevier Inc., San Diego, pp. 421–430.
CDERA, 2006. Montserrat Soufrière Hills Volcano Situation Report Number 3. EmergencyOperations centre, (May 21).
Charbonnier, S., Gertisser, R., 2009. Numerical simulations of block-and-ash flows usingthe Titan2D flow model: examples from the 2006 eruption of Merapi Volcano, Java,Indonesia. Bull. Volcanol. 71 (8), 953–959.
Chester, D.K., Degg, M., Duncan, A.M., Guest, J.E., 2000. The increasing exposure of cities tothe effects of volcanic eruptions: a global survey. Environ. Hazards 2 (3), 89–103.
Clarke, A.B., Voight, B., 2000. Pyroclastic current dynamic from aerodynamics of tree orpole blow-down. J. Volcanol. Geotherm. Res. 100, 395–412.
Coppersmith, K.J., Jenni, K.E., Perman, R.C., Youngs, R.R., 2009. Formal expert assessmentin probabilistic seismic and volcanic hazard analysis. In: Connor, C.B., Chapman, N.A., Connor, L.J. (Eds.), Volcanic and Tectonic Hazard Assessment for Nuclear Facilities.Cambridge University Press, United Kingdom, pp. 593–611.
Dalili, N., Edrisy, A., Carriveau, R., 2009. A review of surface engineering issues critical towind turbine performance. Renew. Sust. Energ. Rev. 13 (2), 428–438.
de Bélizal, E., Lavigne, F., Hadmoko, D.S., Degeai, J.-P., Dipayana, G.A., Mutaqin, B.W.,Marfai, M.A., Coquet, M., Mauff, B.L., Robin, A.-K., 2013. Rain-triggered lahars follow-ing the 2010 eruption of Merapi volcano, Indonesia: a major risk. J. Volcanol.Geotherm. Res. 261, 330–347.
Delmelle, P., Lambert, M., Dufrêne, Y., Gerin, P., Óskarsson, N., 2007. Gas/aerosol–ash in-teraction in volcanic plumes: new insights from surface analysis of fine ash particles.Earth Planet. Sci. Lett. 259, 159–170.
Dong, L., Shan, J., 2013. A comprehensive review of earthquake-induced building damagedetection with remote sensing techniques. Int. J. Photogramm. Remote Sens. 84,85–99.
Douglas, J., 2007. Physical vulnerability modelling in natural hazard risk assessment. Nat.Hazards Earth Syst. Sci. 7, 283–288.
Drexler, J.M., Gledhill, A.D., Shinoda, K., Vasiliev, A.L., Reddy, K.M., Sampath, S., Padture,N.P., 2011. Jet engine coatings for resisting volcanic ash damage. Adv. Mater. 23,2419–2424.
Dunn, M.G., 2012. Operation of gas turbine engines in an environment contaminatedwithvolcanic ash. J. Turbomach. 134, 1–18.
Dunn, S., Fu, G., Wilkinson, S., Dawson, R., 2013. Network theory for infrastructuresystems modelling. Proceedings of the ICE—Engineering Sustainability 166,pp. 281–292.
Engwell, S.L., Sparks, R.S.J., Aspinall, W., 2013. Quantifying uncertainties in the measure-ment of tephra fall thickness. J. Appl. Volcanol. 2 (1), 1–12.
Foulser-Piggott, R., Bevington, J., Vicini, A., 2014. End-to-end Demonstration of the Inven-tory Data Capture Tools. GEM Technical Report 2014-06 V1.0.0.
Fuchs, S., Birkmann, J., Glade, T., 2012. Vulnerability assessment in natural hazard and riskanalysis: current approaches and future challenges. Nat. Hazards 64, 1969–1975.
Fujii, T., Nakada, S., 1999. The 15 September 1991 pyroclastic flows at Unzen Volcano(Japan): a flow model for associated ash-cloud surges. J. Volcanol. Geotherm. Res.89 (1), 159–172.
Gordon, K.D., Cole, J.W., Rosenberg, M.D., Johnston, D.M., 2005. Effects of volcanic ash oncomputers and electronic equipment. Nat. Hazards 34 (2), 231–262.
Gran, K.B., Montgomery, D.R., Halbur, J.C., 2011. Long-term elevated post-eruption sedi-mentation at Mount Pinatubo, Philippines. Geol. Soc. Am. Bull. 39, 367–370.
Griffiths, R.W., 2000. The dynamics of lava flows. Annu. Rev. Fluid Mech. 32 (1), 477–518.Guffanti, M., Mayberry, G.C., Casadevall, T.J., Wunderman, R., 2009. Volcanic hazards to
airports. Nat. Hazards 51, 287–302.Guffanti, M., Casadevall, T.J., Budding, K., 2010. Encounters of aircraft with volcanic ash
clouds; a compilation of known incidents, 1953–2009. US Geological Survey Data Se-ries 545, ver. 1.0.
Hawaiian Volcano Observatory, 1998a. How Vulnerable Are the Kulani Prison Sites to Fu-ture Lava Flows?
Hawaiian Volcano Observatory, 1998b. The Mauna Loa Eruption of 1926.Hawaiian Volcano Observatory, 2000. The 1955 Eruption: Spur to a New Era of Under-
standing Kilauea.Holzer, T.L., Savage, J.C., 2013. Global earthquake fatalities and population. Earthquake
Spectra 29 (1), 155–175.Horwell, C.J., Baxter, P.J., 2006. The respiratory health hazards of volcanic ash: a review for
volcanic risk mitigation. Bull. Volcanol. 69 (1), 1–24.Howe, T., 2003. The impact of the Montserrat volcanic eruption on water and sanitation.
12th Annual CWWA Conference, Bahamas.IAEA, 2013. Volcanic Hazards in Site Evaluation for Nuclear Installations: Specific Safety
Guide. International Atomic Energy Agency, Vienna, Austria.International Civil Aviation Organization, 2007. Doc 9691: Manual on Volcanic Ash, Ra-
dioactive Material and Toxic Chemical Clouds.Janda, R.J., Daag, A.S., Delos Reyes, P., Newhall, C.G., Pierson, T.C., Punongbayan, R.S.,
Rodolfo, K.S., Solidum, R.U., Umbal, J.V., 1996. Assessment and response to lahar haz-ard around Mount Pinatubo, 1991 to 1993. In: Newhall, C.G., Punongbayan, R. (Eds.),Fire and Mud: Eruptions and Lahars of Mount Pinatubo, Philippines. Philippine Insti-tute of Volcanology and Seismology, Quezon City, pp. 107–139.
Jelínek, R., Krausmann, E., González, M., Álvarez-Gómez, J., Birkmann, J., Welle, T., 2012.Approaches for tsunami risk assessment and application to the city of Cádiz, Spain.Nat. Hazards 60 (2), 273–293.

181G. Wilson et al. / Journal of Volcanology and Geothermal Research 286 (2014) 148–182
Jenkins, S., Magill, C., McAneney, J., Blong, R., 2012. Regional ash fall hazard I: a probabi-listic assessment methodology. Bull. Volcanol. 74 (7), 1699–1712.
Jenkins, S., Komorowski, J.-C., Baxter, P.J., Spence, R.J.S., Picquout, A., Lavigne, F., Surono, 2013.TheMerapi 2010 eruption: an interdisciplinary impact assessmentmethodology for study-ing pyroclastic density current dynamics. J. Volcanol. Geotherm. Res. 261, 316–329.
Jenkins, S., Spence, R.J.S., Fonseca, J.F.B.D., Solidum, R.U., Wilson, T.M., 2014a. Volcanic riskassessment: quantifying physical vulnerability in the built environment. J. Volcanol.Geotherm. Res. 276, 105–120.
Jenkins, S., Wilson, T.M., Magill, C., Miller, V., Stewart, C., Marzocchi, W., Boulton, M.,2014b. Volcanic Ash Fall Hazard and Risk: Technical Background Paper for the UN-ISDR 2015 Global Assessment Report on Disaster Risk Reduction. Global VolcanoModel and IAVCEI.
Johnston, D.M., 1997. Physical and Social Impacts of Past and Future Volcanic Eruptions inNew Zealand(PhD Thesis) Massey University, Palmerston North, New Zealand.
Kappes, M.S., Papathoma-Köhle, M., Keiler, M., 2012. Assessing physical vulnerability formulti-hazards using an indicator-based methodology. Appl. Geogr. 32 (2), 577–590.
Kaye, G., 2007. RiskScape Volcano — a volcanic hazard risk assessment model forRiskScape. GNS Science Report 2007/38.
Kennedy, R.P., Ravindra, M.K., 1984. Seismic fragilities for nuclear power plant risk stud-ies. Nucl. Eng. Des. 79 (1), 47–68.
Kennedy, R.P., Cornell, C.A., Campbell, R.D., Kaplan, S., Perla, H.F., 1980. Probabilistic seis-mic safety study of an existing nuclear power plant. Nucl. Eng. Des. 59 (2), 315–338.
Khalfallah, M.G., Koliub, A.M., 2007. Effect of dust on the performance of wind turbines.Desalination 209 (1), 209–220.
Kilburn, C.R.J., 2000. Lava flows and flow fields. In: Sigurdsson, H., Houghton, B.F.,McNutt, S.R., Rymer, H., Stix, J. (Eds.), Encyclopedia of Volcanoes. Elsevier Inc.,San Diego, pp. 291–305.
Koshimura, S., Oie, T., Yanagisawa, H., Imamura, F., 2009. Developing fragility functions fortsunami damage estimation using numerical model and post-tsunami data fromBanda Aceh, Indonesia. Coast. Eng. J. 51, 243–273.
Leonard, G.S., Johnston, D.M., Williams, S., Cole, J.W., Finnis, K., Barnard, S., 2005. Impactsand management of recent volcanic eruptions in Ecuador: lessons for New Zealand.GNS Science Report 2005/20.
Lipman, P.W., Mullineaux, D.R., 1981. The 1980 eruptions of Mount St. Helens, Washing-ton. U.S. Geological Survey Prof. Paper 1250 (701–718 pp.).
Lockwood, J.P., Hazlett, R.W., 2010. Volcanoes: Global Perspectives. Wiley-Blackwell,Chichester, United Kingdom (539 pp.).
Macedonio, G., Costa, A., 2012. Rain effect on the load of tephra deposits. Nat. HazardsEarth Syst. Sci. 12 (4), 1229–1233.
Magill, C., Wilson, T.M., Okada, T., 2013. Observations of tephra fall impacts from the 2011Shinmoedake eruption, Japan. Earth Planets Space 65, 677–698.
Marti, J., Spence, R.J.S., Calogero, E., Ordoñez, A., Felpeto, A., Baxter, P.J., 2008. Estimatingbuilding exposure and impact to volcanic hazards in Icod de los Vinos, Tenerife(Canary Islands). J. Volcanol. Geotherm. Res. 178 (3), 553–561.
Marzocchi, W., Sandri, L., Selva, J., 2010. BET_VH: a probabilistic tool for long-term volca-nic hazard assessment. Bull. Volcanol. 72 (6), 705–716.
Marzocchi, W., Garcia-Aristizabal, A., Gasparini, P., Mastellone, M.L., Di Ruocco, A., 2012. Basicprinciples of multi-risk assessment: a case study in Italy. Nat. Hazards 62, 551–573.
Mas, E., Koshimura, S., Suppasri, A., Matsuoka, M., Matsuyama, M., Yoshii, T., Jimenez, C.,Yamazaki, F., Imamura, F., 2012. Developing tsunami fragility curves using remotesensing and survey data of the 2010 Chilean Tsunami in Dichato. Nat. HazardsEarth Syst. Sci. 12, 2689–2697.
Mercado, R.A., Lacsamana, J.B.T., Pineda, G.L., 1996. Socioeconomic impacts of the MountPinatubo eruption. In: Newhall, C.G., Punongbayan, R. (Eds.), Fire and Mud: Eruptionsand Lahars of Mount Pinatubo, Philippines. Philippine Institute of Volcanology andSeismology, Quezon City, pp. 1063–1069.
Meredith, I., 2007. Sharing experiences with applying coatings to turbines. Hydro Rev.Worldw. 15, 34–36.
Morgan, A.V., 2000. The Eldfell eruption, Heimaey, Iceland: a 25-year retrospective.Geosci. Can. 27, 11–18.
Nairn, I.A., 2002. The effects of volcanic ash fall (tephra) on road and airport surfaces. GNSScience Report 2002/13.
Nakada, S., 2000. Hazards from pyroclastic flows and surges. In: Sigurdsson, H., Houghton,B.F., McNutt, S.R., Rymer, H., Stix, J. (Eds.), Encyclopedia of Volcanoes. Elsevier Inc.,San Diego, pp. 945–955.
Nasol, R., 2001. ‘Nanang’ aftermath, lahar destroys town'swater pipes. Philippine Daily In-quirer, Philippines.
Neal, C.A., McGimsey, R.G., Dixon, J.P., Cameron, C.E., Nuzhdaev, A.A., Chibisova, M., 2011.2008 volcanic activity in Alaska, Kamchatka, and the Kurile Islands: summary ofevents and response of the Alaska Volcano Observatory. U.S. Geological Survey Scien-tific Investigations Report 2010-5243.
Óskarsson, N., 1980. The interaction between volcanic gases and tephra: fluorine adheringto tephra of the 1970 Hekla eruption. J. Volcanol. Geotherm. Res. 8, 251–266.
Ota, Y., Araki, K., Nishioka, K., 2012. Impact of volcanic ash on CPV system in MiyazakiJapan. 8th International Conference on Concentrating Photovoltaic Systems. AIPPublishing, pp. 340–343.
Oze, C., Cole, J.W., Scott, A., Wilson, T.M., Wilson, G., Gaw, S., Hampton, S., Doyle, C., Li, Z.,2013. Corrosion of metal roof materials related to volcanic ash interactions. Nat. Haz-ards. 71, 785–802.
Pallister, J.S., Major, J.J., Pierson, T.C., Hoblitt, R.P., Lowenstern, J.B., Eichelberger, J.C., Lara,L., Moreno, H., Muñoz, J., Castro, J.M., 2010. Interdisciplinary studies of eruption atChaitén Volcano, Chile. EOS Trans. Am. Geophys. Union 91, 381–382.
Panza, G.F., Irikura, K., Kouteva, M., Peresan, A., Wang, Z., Saragoni, R., 2011. Advancedseismic hazard assessment. Pure Appl. Geophys. 168 (1), 1–9.
Papathoma-Köhle, M., Kappes, M., Keiler, M., Glade, T., 2011. Physical vulnerability assess-ment for alpine hazards: state of the art and future needs. Nat. Hazards 58 (2), 645–680.
Parfitt, E.A., Wilson, L., 2008. Fundamentals of Physical Volcanology. Blackwell Publishing,Massachusetts, USA (256 pp.).
Petrazzuoli, S.M., Zuccaro, G., 2004. Structural resistance of reinforced concrete buildingsunder pyroclastic flows: a study of the Vesuvian area. J. Volcanol. Geotherm. Res. 133(1), 353–367.
Pierson, T.C., Major, J.J., Amigo, Á., Moreno, H., 2013. Acute sedimentation response torainfall following the explosive phase of the 2008–2009 eruption of Chaitén volcano,Chile. Bull. Volcanol. 75 (5), 1–17.
Porter, K., Kennedy, R., Bachman, R., 2007. Creating fragility functions for performance-based earthquake engineering. Earthquake Spectra 23, 471–489.
Quan Luna, B., Blahut, J., van Westen, C.J., Sterlacchini, S., van Asch, T.W.K., Akbas, S.O.,2011. The application of numerical debris flowmodelling for the generation of phys-ical vulnerability curves. Nat. Hazards Earth Syst. Sci. 11, 2047–2060.
Reitherman, R.K., 2012. Earthquakes and Engineers: An International History. ASCE Pub-lications, Virginia, USA
Rinaldi, S.M., Peerenboom, J.P., Kelly, T.K., 2001. Identifying, understanding, and analyzingcritical infrastructure interdependencies. IEEE Control. Syst. 21 (6), 11–25.
Rossetto, T., Elnashai, A., 2003. Derivation of vulnerability functions for European-type RCstructures based on observational data. Eng. Struct. 25, 1241–1263.
Rossetto, T., Kappos, A.J., Kouris, L.A., Indirli, M., Borg, R.P., Lloyd, T.O., Sword-Daniels, V., 2010. Comparison of Damage Assessment Methodologies for Dif-ferent Natural Hazards.
Rossetto, T., Ioannou, I., Grant, D.N., 2013. Existing empirical vulnerability and fragilityfunctions: compendium and guide for selection. GEM Technical Report 2013-X.GEM Foundation, Pavia, Italy.
Rougier, J., Sparks, R.S.J., Hill, L., 2013. Risk and uncertainty assessment for natural haz-ards. Cambridge University Press, Cambridge (588 pp.).
Rozdilsky, J.L., 2001. Second hazards assessment and sustainable hazards mitigation: di-saster recovery on Montserrat. Nat. Hazards Rev. 2 (2), 64–71.
Saleh, I.M., Abuhdima, E.M., 2011. Effect of sand and dust storms on microwave propaga-tion signals in Southern Libya. J. Energy Power Eng. 5 (12), 1199–1204.
Sammonds, P., McGuire, B., Edwards, S., 2010. Volcanic Hazards From Iceland, Analysisand Implications of the Eyjafjallajökull Eruption. UCL Institute for Risk and DisasterReduction, London.
Sanyal, J., Lu, X., 2005. Remote sensing and GIS‐based flood vulnerability assessment ofhuman settlements: a case study of Gangetic West Bengal, India. Hydrol. Process.19 (18), 3699–3716.
Schilling, S., 1998. LAHARZ: GIS programs for automated mapping of lahar-inundationhazard zones. U.S. Geological Survey Open-file Report 98-638.
Schmidt, J., Matcham, I., Reese, S., King, A., Bell, R., Henderson, R., Smart, G., Cousins, J.,Smith, W., Heron, D., 2011. Quantitative multi-risk analysis for natural hazards: aframework for multi-risk modelling. Nat. Hazards 58 (3), 1169–1192.
Schneider, P.J., Schauer, B.A., 2006. HAZUS—its development and its future. Nat. HazardsRev. 7 (2), 40–44.
Schultz, M.T., Gouldby, B.P., Simm, J.D., Wibowo, J.L., 2010. Beyond the Factor of Safety:Developing Fragility Curves to Characterize System Reliability. U.S. Army Corps of En-gineers. U.S. Army Engineer Research and Development Center, (ERDC SR-10-1).
Schuster, R.L., 1981. Effects of the eruptions on civil works and operations in the PacificNorthwest. In: Lipman, P.W., Mullineaux, D.R. (Eds.), The 1980 Eruptions of MountSt. Helens, Washington. U.S. Geological Survey Prof. Paper 1250, pp. 701–718.
Scott, B.J., 2013. A revised catalogue of Ruapehu volcano eruptive activity: 1830–2012.GNS Science Report 2013/45.
Smith, K., 2013. Environmental Hazards: Assessing Risk and Reducing Disaster. Routledge,New York, USA.
Smith, G.A., Fritz, W.J., 1989. Penrose conference report: volcanic influences on terrestrialsedimentation. Geol. Soc. Am. Bull. 17, 375–376.
Smithsonian Institution, 1999. Mt. Etna — Bulletin of the Global Volcanism Network, 24:11.
Smithsonian Institution, 2001. Nyiragongo — Bulletin of the Global Volcanism Network26:12.
Smithsonian Institution, 2002. Mayon — Bulletin of the Global Volcanism Network 27:04Smithsonian Institution, 2010. Shinmoe-dake— Bulletin of the Global Volcanism Network
35:12.Smithsonian Institution, 2011. Merapi — Bulletin of the Global Volcanism Network 36:05Sparks, R.S.J., Aspinall, W.P., Crosweller, H.S., Hincks, T.K., 2013. Risk and uncertainty as-
sessment of volcanic hazards. In: Rougier, J., Sparks, R.S.J., Hill, L. (Eds.), Risk and Un-certainty Assessment for Natural Hazards. Cambridge University Press, Cambridge, p.588.
Spence, R.J.S., Pomonis, A., Baxter, P.J., Coburn, A.W., White, M., Dayrit, M., 1996. Buildingdamage caused by the Mount Pinatubo eruption of June 15, 1991. In: Newhall, C.G.,Punongbayan, R. (Eds.), Fire and Mud: Eruptions and Lahars of Mount Pinatubo,Philippines. Philippine Institute of Volcanology and Seismology, Quezon City.
Spence, R.J.S., Baxter, P.J., Zuccaro, G., 2004a. Building vulnerability and human casualtyestimation for a pyroclastic flow: a model and its application to Vesuvius. J. Volcanol.Geotherm. Res. 133 (1), 321–343.
Spence, R.J.S., Zuccaro, G., Petrazzuoli, S., Baxter, P.J., 2004b. Resistance of buildings to py-roclastic flows: analytical and experimental studies and their application to Vesuvius.Nat. Hazards Rev. 5, 48–59.
Spence, R.J.S., Kelman, I., Baxter, P.J., Zuccaro, G., Petrazzuoli, S., 2005. Residential buildingand occupant vulnerability to tephra fall. Nat. Hazards Earth Syst. Sci. 5, 477–494.
Spence, R.J.S., Kelman, I., Brown, A., Toyos, G., Purser, D., Baxter, P.J., 2007. Residentialbuilding and occupant vulnerability to pyroclastic density currents in explosive erup-tions. Nat. Hazards Earth Syst. Sci. 7, 219–230.
Stewart, C., Johnston, D.M., Leonard, G., Horwell, C.J., Thordarson, T., Cronin, S., 2006. Con-tamination of water supplies by volcanic ashfall: a literature review and simple im-pact modelling. J. Volcanol. Geotherm. Res. 158, 296–306.

182 G. Wilson et al. / Journal of Volcanology and Geothermal Research 286 (2014) 148–182
Stewart, C., Pizzolon, L., Wilson, T.M., Leonard, G., Dewer, D., Johnston, D.M., Cronin, S.,2009a. Can volcanic ash poison water supplies? Integr. Environ. Assess. Manag. 5,1–4.
Stewart, C., Wilson, T.M., Leonard, G., Cronin, S., Johnston, D.M., Cole, J.W., 2009b. Volcanichazards and water shortages. In: Briggs, A.C. (Ed.), Water Shortages: Environmental,Economic and Social Impacts. Nova Publishers.
Sword-Daniels, V., Wardman, J., Stewart, C., Wilson, T.M., Johnston, D.M., Rossetto, T.,2011. Infrastructure impacts, management and adaptations to eruptions at VolcánTungurahua, Ecuador, 1999–2000. GNS Science Report 2011/24.
Sword-Daniels, V., Wilson, T.M., Sargeant, S., Rossetto, T., Twigg, J., Johnston, D.M.,Loughlin, S.C., Cole, P.D., 2014. Consequences of long-term volcanic activity for essen-tial services in Montserrat: challenges, adaptations and resilience. Geol. Soc. Lond.Mem. 39 (1), 471–488.
Turner, R., Paulik, R., Smart, G., Bind, J., Gray, S., Yang, E., Asora, L., Leiofi, M., Flay, R., 2013. Dam-age surveys following the Hobsonville Tornado in Auckland and Tropical Cyclone Evan inSamoa. 16th Australasian Wind Engineering Society Workshop, Brisbane, Australia
UNISDR, 2009. UNISDR Terminology on Disaster Risk Reduction, United Nations, Geneva,Switzerland.
UNISDR, 2013. From shared risk to shared value — the business case for disaster risk re-duction. Global Assessment Report on Disaster Risk Reduction. United Nations Officefor Disaster Risk Reduction (UNISDR), Geneva, Switzerland.
UNISDR, 2014. Annual report 2013. Final Report on 2012–2013 Biennium Work Pro-gramme, United Nations, Geneva, Switzerland.
Uzielli, M., Nadim, F., Lacasse, S., Kaynia, A.M., 2008. A conceptual framework forquantitative estimation of physical vulnerability to landslides. Eng. Geol. 102(3), 251–256.
Vaidogas, E.R., Juocevičius, V., 2008. Reliability of a timber structure exposed to fire: esti-mation using fragility function. Mechanika 73 (5), 35–42.
Valentine, G.A., 1998. Damage to structures by pyroclastic flows and surges, inferred fromnuclear weapons effects. J. Volcanol. Geotherm. Res. 87, 117–140.
Valentine, G.A., Fisher, R.V., 2000. Pyroclastic surges and blasts. In: Sigurdsson, H.,Houghton, B.F., McNutt, S.R., Rymer, H., Stix, J. (Eds.), Encyclopedia of Volcanoes.Elsevier Inc., San Diego, pp. 571–580.
Vallance, J.W., 2000. Lahars. In: Sigurdsson, H., Houghton, B.F., McNutt, S.R., Rymer, H.,Stix, J. (Eds.), Encyclopedia of Volcanoes. Elsevier Inc., San Diego, pp. 601–616.
Wadge, G., 2009. Assessing the pyroclastic flow hazards from dome collapse at SoufriereHills Volcano, Montserrat. In: Thordarson, T., Self, S., Larsen, G., Rowland, S.K.,Höskuldsson, Á. (Eds.), Studies in Volcanology: The Legacy of George Walker. Spec.Publ. IAVCEI, pp. 211–224.
Waitt, R.B., 2013. Lahar. In: Bobrowsky, P.T. (Ed.), Encyclopedia of Natural Hazards.Springer.
Wardman, J., Wilson, T.M., Bodger, P.S., Cole, J.W., Johnston, D.M., 2012a. Investigating theelectrical conductivity of volcanic ash and its effect on HV power systems. Phys.Chem. Earth A/B/C 45, 128–145.
Wardman, J., Wilson, T.M., Bodger, P.S., Cole, J.W., Stewart, C., 2012b. Potential impactsfrom tephra fall to electric power systems: a review and mitigation strategies. Bull.Volcanol. 74, 2221–2241.
Wardman, J., Sword-Daniels, V., Stewart, C., Wilson, T.M., 2012c. Impact assessment of theMay 2010 eruption of Pacaya volcano, Guatemala. GNS Science Report 2012/09.
Williams, R.S., 1997. Lava-cooling operations during the 1973 eruption of Eldfell volcano,Heimaey, Vestmannaeyjar, Iceland. US Geological Survey Open-file Report 97-724.
Williams, R.S., Moore, J.G., 2008. Man against volcano: The eruption on Heimaey,Vestmannaeyjar, Iceland. DIANE Publishing, (27 pp.).
Wilson, C.J.N., Houghton, B.F., 2000. Pyroclast transport and deposition. In: Sigurdsson, H.,Houghton, B.F., McNutt, S.R., Rymer, H., Stix, J. (Eds.), Encyclopedia of Volcanoes.Elsevier Inc., San Diego, pp. 545–554.
Wilson, T.M., Kaye, G., Stewart, C., Cole, J.W., 2007. Impacts of the 2006 eruption ofMerapivolcano, Indonesia, on agriculture and infrastructure. GNS Science Report.
Wilson, T.M., Daly, M., Johnston, D.M., 2009. Review of impacts of volcanic ash on electric-ity distribution systems, broadcasting and communication networks, Auckland Engi-neering Lifelines Group. Auckland Regional Council Technical Publication No. 051.
Wilson, T.M., Cole, J.W., Stewart, C., Cronin, S., Johnston, D.M., 2011. Ash storms: impactsof wind-remobilised volcanic ash on rural communities and agriculture following the1991 Hudson eruption, southern Patagonia, Chile. Bull. Volcanol. 73, 223–239.
Wilson, G., Wilson, T.M., Cole, J.W., Oze, C., 2012a. Vulnerability of laptop computers tovolcanic ash and gas. Nat. Hazards 63, 711–736.
Wilson, T.M., Stewart, C., Sword-Daniels, V., Leonard, G., Johnston, D.M., Cole, J.W.,Wardman, J., Wilson, G., Barnard, S., 2012b. Volcanic ash impacts on critical infra-structure. Phys. Chem. Earth 45, 5–23.
Wilson, T.M., Stewart, C., Bickerton, H., Baxter, P.J., Outes, V., Villarosa, G., Rovere, E., 2013.Impacts of the June 2011 Puyehue–Cordón Caulle volcanic complex eruption onurban infrastructure, agriculture and public health. GNS Science Report.
Wilson, T.M., Stewart, C., Wardman, J., Wilson, G., Johnston, D.M., Hill, D., Hampton, S.,Villemure, M., McBride, S., Leonard, G., Daly, M., Deligne, N.I., Roberts, L., 2014. Volca-nic ashfall preparedness poster series: a collaborative process for reducing the vul-nerability of critical infrastructure. J. Appl. Volcanol. 3.
Witham, C.S., Oppenheimer, C., Horwell, C.J., 2005. Volcanic ash-leachates: a review andrecommendations for sampling methods. J. Volcanol. Geotherm. Res. 141, 299–326.
Zuccaro, G., De Gregorio, D., 2013. Time and space dependency in impact damage evalu-ation of a sub-Plinian eruption at Mount Vesuvius. Nat. Hazards 68, 1399–1423.
Zuccaro, G., Ianniello, D., 2004. Interaction of pyroclastic flows with building structures inan urban settlement: a fluid-dynamic simulation impact model. J. Volcanol.Geotherm. Res. 133 (1), 345–352.
Zuccaro, G., Cacace, F., Spence, R.J.S., Baxter, P.J., 2008. Impact of explosive eruption sce-narios at Vesuvius. J. Volcanol. Geotherm. Res. 178, 416–453.