volume 1 district socio-economic profile and … · 3. gordonia, the kalahari and bushmanland the...
TRANSCRIPT

Arid Areas Report Volume 1: District Socio-economic Profile and Development Plans
THE ARID AREAS PROGRAMME
VOLUME 1
DISTRICT SOCIO-ECONOMIC PROFILE AND DEVELOPMENT PLANS
Compiled by:
Prof Doreen Atkinson Centre for Development Support
University of the Free State
November 2007

Arid Areas Report Volume 1: District Socio-economic Profile and Development Plans
CONTENTS II.. IInnttrroodduuccttiioonn .................................................................................................................................................................................................................................................................. 33 IIII.. GGeeooggrraapphhiicc oovveerrvviieeww.................................................................................................................................................................................................................................... 44 1. Namaqualand and Richtersveld .............................................................................................................. 5 2. The Karoo ................................................................................................................................................ 6 3. Gordonia, the Kalahari and Bushmanland ............................................................................................. 7 4. General characteristics of the arid areas ................................................................................................ 7 IIIIII.. TThhee WWeesstteerrnn ZZoonnee ((SSuuccccuulleenntt KKaarroooo)) ...................................................................................................................................................................... 1100 1. Namakwa District Municipality ........................................................................................................... 10
1.1 Karoo-Hoogland Municipality (Williston area).................................................................................................... 13 1.2 Khai Ma Municipality (Pofadder area) ................................................................................................................ 13 1.3 Hantam Local Municipality (Calvinia area) ........................................................................................................ 15 1.4 Kamiesberg LM (Kamieskroon area) ................................................................................................................. 16 1.5 Nama Khoi LM (Springbok area)........................................................................................................................ 17 1.6 Richtersveld LM (Port Nolloth area) ................................................................................................................... 18
2. Matzikama Local Municipality, West Coast District.......................................................................... 20 IIVV.. TThhee CCeennttrraall ZZoonnee ............................................................................................................................................................................................................................................ 2222 1. The Central Karoo District ................................................................................................................... 22
1.1 Beaufort West Local Municipality ....................................................................................................................... 26 1.2 Laingsburg Municipality ...................................................................................................................................... 27 1.3 Prince Albert Municipality ................................................................................................................................... 28
2. Cacadu District Municipality ............................................................................................................... 30 2.1 Sunday’s River Valley LM (Kirkwood) ................................................................................................................ 33 2.2 Baviaans LM (Willowmore) ................................................................................................................................. 34 2.3 Camdeboo LM (Graaff-Reinet) ........................................................................................................................... 35 2.4 Blue Crane Route LM (Somerset East) ............................................................................................................. 36 2.5 Ikwezi LM (Jansenville) ...................................................................................................................................... 40
3. Pixley ka Seme District......................................................................................................................... 41 3.1 Emthanjeni Local Municipality (De Aar) ............................................................................................................. 45 3.2 Umsobomvu Local Municipality (Colesberg) ..................................................................................................... 47 3.3 Ubuntu Local Municipality (Victoria West) ......................................................................................................... 48 3.4 Kareeberg Local Municipality (Carnarvon) ........................................................................................................ 49 3.5 Siyancuma Local Municipality (Douglas) ........................................................................................................... 50 3.6 Siyathemba Local Municipality (Prieska) ........................................................................................................... 51 3.7 Rhenosterberg Local Municipality (Petrusville) ................................................................................................. 52 3.8 Thembelihle Local Municipality (Hopetown) ...................................................................................................... 53
4. Oudtshoorn Local Municipality (Eden District) ................................................................................. 55 5. Kannaland Local Municipality (Eden District) ................................................................................... 57 6. Xhariep District ..................................................................................................................................... 59
6.1 Kopanong Municipality (Trompsburg) ................................................................................................................ 64 6.2 Letsemeng Municipality (Koffiefontein) .............................................................................................................. 66
VV.. TThhee EEaasstteerrnn ZZoonnee .......................................................................................................................................................................................................................................... 6688 1. Gariep Local Municipality (Ukhahlamba District) ............................................................................. 68 2. Inxuba Yethemba (Chris Hani District) ............................................................................................... 71 VVII.. TThhee NNoorrtthheerrnn ZZoonnee ...................................................................................................................................................................................................................................... 7733 1. Siyanda District ..................................................................................................................................... 73
1.1 !Kai !Garib Local Municipality (Keimoes) ........................................................................................................... 75 1.2 //Khara Hais Local Municipality (Upington) ........................................................................................................ 75 1.3 !Kheis Local Municipality (Groblershoop) .......................................................................................................... 77 1.4 Tsantsabane Local Municipality (Postmasburg) ................................................................................................ 78 1.5 Kgatelopele Local Municipality (Danielskuil) ..................................................................................................... 79 1.6 Mier Local Municipality ....................................................................................................................................... 80
2. Kalahari-Kgalagadi District .................................................................................................................. 81 2.1 Gamagara Local Municipality (Kathu) ................................................................................................................ 84 2.2 Ga-Segonyana Local Municipality ..................................................................................................................... 85 2.3 Moshaweng ......................................................................................................................................................... 86
3. Molopo Local Municipality (Pomfret)................................................................................................. 88 4. Kagisano Local Municipality (Ganyesa) ............................................................................................. 89 5. Greater Taung (Pudimoe, Taung)......................................................................................................... 91 CCoonncclluussiioonn...................................................................................................................................................................................................................................................................................... 9933

Arid Areas Report Volume 1: District Socio-economic Profile and Development Plans
I. Introduction The arid areas comprise a major part of South Africa’s land surface. These areas are the Karoo (including the Little Karoo), Namaqualand and Kalahari, and straddle five provinces in South Africa: Western Cape, Eastern Cape, Northern Cape, Free State, and North-West. They also extend into Botswana and Namibia. This volume contains a socio-economic profile of these areas. It is the first time that the arid components of South Africa are described in a way that highlights their similarities with one another. In most planning documents, such as Provincial Growth and Development Strategies, these areas are typically discussed in relation to non-arid areas, such as the coastal cities. Until now, this has blurred the focus on the arid areas. They are generally regarded as a hinterland, or even as an economic backwater. This report therefore intends to “foreground” the arid areas in their own right. It focuses on the five “core” District Municipalities of the arid areas, viz. Cacadu (Graaff-Reinet area of the Eastern Cape), Central Karoo (Beaufort West area of theWestern Cape), and three districts of the Northern Cape: Pixley ka Seme (De Aar area), Namakwa (Springbok area), Siyanda (Upington area), and Kgalagadi (Kuruman area). Of course, the arid areas do not dovetail neatly with these district boundaries. In addition, therefore, the profile covers several other Local Municipalities:
• Inxuba Yethemba (Cradock area, part of Chris Hani District in the Eastern Cape) • Gariep (Burgersdorp area, part of Ukhahlamba District in the Eastern Cape), • Kannaland (Ladismith area, part of Eden District in the Western Cape) • Oudtshoorn in the Western Cape (part of Eden District) • Matzikama (part of the West Coast District in the Western Cape) • Kopanong (Trompsburg area) and Letsemeng (Koffiefontein area) in the Free
State (both part of Xhariep district) • Molopo, Kagisano and Greater Taung in North-West Province.
The information contained in the profile is based on secondary sources, mainly Integrated Development Plans, supplemented by provincial publications in some of the provinces. In most cases, information is drawn from Census 2001. Information from Gaffney’s Local Government in South Africa, 2004-6 is extremely useful. Other secondary sources were also used. Unfortunately the result is that the data is somewhat uneven. A more in-depth and rigorous profile would require the use of a single data-base for all municipalities, so that comparable data can be provided. This is a task for the future. This volume first provides a geographic overview of the arid areas. It is divided into four major geographic “bands”:

Arid Areas Report Volume 1: District Socio-economic Profile and Development Plans
1. Firstly, we deal with the extreme westerly areas (Namakwa District Muncipality and Matzakama Local Municipality). These are also the most arid areas, and are likely to become more arid, due to climate change. These areas are generally regarded as the “succulent Karoo”.
2. Secondly, the “middle” band contains the Little Karoo in the south, the Central
Karoo DM, Pixley ka Seme DM and Cacadu DM, and the two Free State local municipalities in the north. This area is often regarded as the “Karoo proper”, technically referred to as the “Nama-Karoo”. The veld has a preponderance of Karoo bushes, rather than grassland, although in good seasons, the Nama-Karoo can appear rather grassy.
3. Thirdly, the eastern band consists of Inxuba Yethemba LM and Gariep DM in
the Eastern Cape. These areas are situated on the upper reaches of the escarpment, and have a more grassy character, as they shade into the “suurveld” areas of the Eastern Cape.
4. Finally, the northern band consists of Siyanda DM and Kgalagadi DM in the
Northern Cape, and the western parts of Bophirima DM in the North-West. The Kalahari Desert is an area characterised by sand dunes and expansive plains with thorn trees.
There are several reasons for this organisation of material. Firstly, it encourages thinking across provincial boundaries. Secondly, it is based primarily on climatic regions, which may be more useful in future, both to understand economic options. Thirdly, it would help us to classify the possible future impacts of climate change (the west is likely to get drier and the east may get wetter). Ideally, an international cross-border analysis of arid areas should include Namibia (to be linked to Namakwa District in South Africa) and Botswana (to be linked to Siyanda District). At this stage, the analysis is confined to the South African areas.
II. Geographic overview The sheer size of the arid areas has meant that it they have never been administered as a coherent entity, with its own specific needs. Before 2000, the arid areas was administered by rural Divisional Councils and urban Town Councils in the erstwhile Cape Province and Free State. Since 2000, the Karoo comprises four provinces and 10 District municipalities. It also includes 31 Local Municipalities: 7 in the Eastern Cape, 2 in the Free State, 14 in the Northern Cape, and 8 in the Eastern Cape. The Karoo shades into other arid areas, notably the Kalahari, Bushmanland, Namaqualand, and the Richtersveld. These areas are

Arid Areas Report Volume 1: District Socio-economic Profile and Development Plans
traversed by several jurisdictional boundaries, including municipal, provincial and national boundaries. In Botswana, the arid southern areas straddle four jurisdictions (Ghanzi, Kgalagadi, Ngwaketse and Kweneng); and in Namibia, it includes the two southern districts (Karas and Hardap), as well as the western part of Namibia. The Map shows the various components of the arid areas:
The arid areas in South and Southern Africa
1. Namaqualand and Richtersveld Namaqualand, along the western coast, consists of an area about 200 km from north to south. Namaqualand is rightly famous for its astonishing succulent plants, which create a “desert garden” filled with flowers during springtime. The Richtersveld is a harsh, stony desert, located north of Namaqualand, and straddles the Namibian border. North of that, the sandy Namib desert covers about 250 km from the Namibian coastline. This area contains the following towns:

Arid Areas Report Volume 1: District Socio-economic Profile and Development Plans
(1) Namaqualand: Vanrhynsdorp, Klawer and Lutzville in the south, Garies, Hondeklipbaai and Kamieskroon in the central part; and Springbok, O’kiep and Steinkopf in the north. (2) Richtersveld: Port Nolloth, Alexander Bay, Vioolsdrif.
2. The Karoo “Karoo” is an ancient Bushman word (the “San people”), meaning “dry place”. It is an area of level plains, crisscrossed by low and stony mountain ranges, with a vegetation consisting primarily of small shrubs interspersed by grass. The Karoo stretches about 600 km from Calvinia in the west to Cradock in the east, and also about 600 km from Marydale in the north to Calitzdorp in the south.There are at three main sub-regions: The Nama-Karoo (northern parts), the Klein-Karoo (southern parts) , and the False Karoo (in southern Free State). It straddles four provinces. These areas have different climatic features, which has led to different agricultural and population profiles. There are at least 66 towns which are located within the Karoo, or on its borders: (1) Nama Karoo: Northern Cape: Calvinia, Williston, Carnarvon, Vanwyksvlei, Vosburg, Prieska,
Hopetown, Britstown, De Aar, Victoria West, Fraserburg, Richmond, Colesberg, Orania, Phillipstown, Petrusville, Hutchinson, Douglas, Griquatown, Sutherland, Loxton, Williston, Hanover, Strydenburg, Marydale.
Eastern Cape: Noupoort, Middelburg, Graaff-Reinet, Nieu-Bethesda, Cradock,
Aberdeen, Steytlerville, Pearston, Somerset East (bordering on Midlands), Willowmore, Cookhouse, Venterstad, Hofmeyr, Steynsburg (bordering on Sneeuberg), Klipplaat
Western Cape: Beaufort West, Laingsburg, Matjiesfontein, Murraysburg, Prince
Alberg, Leeu-Gamka, Merweville, Tankwa-Karoo area (north of Tulbagh). (2) Klein-Karoo: Oudtshoorn, Uniondale, Ladismith, Calitzdorp, De Rust,
Oudtshoorn, Vanwyksdorp, Zoar, Haarlem. (3) False Karoo (Skynkaroo): Free State: Philippolis, Fauresmith, Luckhoff,
Koffiefontein, Oppermansgronde, Bethulie, Gariep Dam, Springfontein, Trompsburg, Edenburg

Arid Areas Report Volume 1: District Socio-economic Profile and Development Plans
3. Gordonia, the Kalahari and Bushmanland The Kalahari is famous for its red sand dunes, thorny bushveld, grassy plains, and many types of wildlife. Gordonia refers to the land alongside the Orange River, which is increasingly characterised by extensive vineyards, as well as the dry hinterland to the south. To the south, Bushmanland consists of vast open, hot, arid plains, with low-level shrubs, joining the Orange River in the north, where dates are cultivated.
(1) Kalahari: This is a vast area which stretches from Upington, north into the Mier area (Rietfontein, Andriesvale, and Askham), and east towards Kuruman and the rural areas of the south-western parts of the North-West Province.
(2) Gordonia: Upington, Keimoes, Kakamas, Groblershoop, Brandvlei (3) Bushmanland: Pofadder, Pella, Aggeneys.
4. General characteristics of the arid areas The arid areas are sparsely populated, and in some areas, the population density is less than 1 or 2 person per km2. This has contributed to their political insignificance, as the various provincial and national governments have invariably given more attention to their more populous regions. The economy is historically based on extensive sheep and goat farming. Irrigation agriculture is concentrated along the rivers, mainly the Orange River, the Fish River, the Sundays River and the Riet River. During the last fifty years, extensive stock farms have grown even larger, and shed a great deal of labour. Many of these unemployed farm workers have drifted to the towns, to join the ranks of the urban unemployed. The recent advent of game farming has contributed to this trend, although opportunities in agri-tourism and eco-tourism have created scope for new and more sophisticated types of employment. Most of the arid towns have grown in size, due to in-migration, and because of the South African social grant system (which encourages people to stay where they are). But the urban economy of the arid areas is very fragile. Typically, the business sector is small, and there is virtually no industrial base. There is an incipient informal sector in most towns, often linked to pension pay-out days. There is a major difference in social and spatial structure between the commercial farming areas and the traditional areas of the North-West Province. In the commercial farming areas (Karoo, Namaqualand, Bushmanland and most of the Kalahari, the spatial structure consists of small and medium-sized towns, surrounded by a hinterland of large commercial farms. Although these towns are fairly well provided with infrastructure, there are worrying aspects of its socio-economic profile:

Arid Areas Report Volume 1: District Socio-economic Profile and Development Plans
• Poverty levels are high, due to high levels of unemployment, and increasing rates of illness (HIV/AIDS and TB)
• Communal farming on municipal peri-urban land is creating environmental challenges
• A large proportion of income is derived from social grants, with social consequences that are not fully understood
• Local economies of small towns are characterised by weak multipliers, because a great deal of purchasing power is spent in the larger centres, or metropolitan areas situated outside these areas
• The influx of migrants from the farms to the towns, and the migration from the more densely populated areas in the Eastern Cape towards the Karoo, are creating immense pressures on the existing infrastructure
• Due to the arid nature of the area, surface and underground water supplies are insufficient to provide higher levels of infrastructure (such as waterborne sanitation), which creates grievances and resentment
• The conditions of life of remote settlements of farm workers tend to be poor, with low mobility, and difficult access to health, education, recreation and shopping amenities
• HIV/AIDS levels are reputed to be high, particularly on national transport routes, and mortality rates are already reflecting this
• There is an out-migration of skilled people, due to a lack of local economic opportunities.
• Increasing aridity, due to global warming, may lead to rising unemployment, declining underground water levels, and greater difficulties for commonage farmers.
Nevertheless, the arid areas have important economic and social assets: • Infrastructure in the towns is generally good, and represents a great deal of sunk
capital in housing, water, sanitation, roads and other infrastructure • The game industry is becoming an important foreign exchange earner in the area • Agricultural expertise is high, with skilled and experienced commercial farmers,
who are often eager to become involved in land reform, agricultural support and other initiatives
• Social services are generally good, and include clinics, schools, banks, post offices and retail facilities
• Some of the towns have developed significant tourism potential, with niche attractions and activities
• There is a growing phenomenon of “reverse migration”, whereby middle class city dwellers are moving to the rural areas, and this brings in new sources of capital, expertise and developmental initiative
• There are growing numbers of black and coloured commonage farmers, who represent a nucleus of new commercial farmers in the future.

Arid Areas Report Volume 1: District Socio-economic Profile and Development Plans
The spatial arrangement is very different in the traditional areas of North-West province. These areas consist of a multiplicity of little rural villages, mainly based on subsistence agriculture. There is a high degree of out-migration of the economically active population. However, even in these areas, some of the towns are becoming large and fairly modern, creating a significant disjunction between modernity and traditionalism. On the whole, the arid areas are characterised by certain systemic features:
• The economy of the arid areas is highly dependent on the primary sector (agriculture and mining) and therefore far more dependent on fluctuations in global markets. The advantage is that the agricultural activities are mainly of low intensity and based on livestock farming. This reality ensures that the economic output is limited in terms of scale yet far more stable than intensive cultivation and crop production.
• The secondary sector is underdeveloped. Only about 10% of the economic output is related to manufacturing, construction and electricity. The evidence suggests that it is increasingly difficult to manufacture mass goods in these remote locations. The main reason for this is the distance to markets. Yet, this does not mean that opportunities for niche market manufacturing do not exist.
Sections III, IV, V and VI will describe the four zones of the arid areas. The main focus is on these regions’ economic activities and potential. Infrastructural issues such as household water, sanitation, and electricity are not included; nor are social infrastructure such as clinics and schools. The report is primarily aimed at an understanding of the arid areas as an economic region, and this includes agriculture, tourism, manufacture and roads.

Arid Areas Report Volume 1: District Socio-economic Profile and Development Plans
III. The Western Zone (Succulent Karoo)
1. Namakwa District Municipality Namakwa District, headquartered in Springbok, runs from Alexander Bay in the northwest, along the West Coast, to Sutherland and Fraserburg in the south-east – a direct distance of approximately 700 km.1 This makes it the largest district municipality in South Africa (in terms of surface area – an area of 126 747km22). It occupies the entire south-western portion of the province as well as that part of the province which abuts on the Atlantic Ocean.Two national roads cross the district, viz. the NZ, connecting the Western Cape with Namibia, and the N14 connecting Springbok with Upington and Gauteng. The population density is less than one person per square kilometre. The main sub-districts which it encompasses are those of Namaqualand, and the Hantam to its south-east. The area is rich in mineral deposits and is considered to have substantial tourism potential.3 The marginal nature of the ecology has attracted considerable interest from environmentalists, and in particular, the Succulent Karoo Environmental Programme (SKEP). The District consists of the following local municipalities and towns:
Table 1: Local Municipalities and towns in Namakwa District
Municipality Towns Population4 % urban5 Hantam LM Calvinia, Nieuwoudtville,
Loeriesfontein 19 000 64.1
Kamiesberg LM Kamieskroon, Garies, Hondeklipbaai
11 000 56.7
Karoo-Hoogland LM Sutherland, Fraserburg, Williston 12 000 51.9 Khai-Ma LM Pofadder, Pella 9 000 46.1 Nama Khoi LM Springbok, Steinkopf, Okiep 45 000 36.2 Richtersveld LM Port Nolloth, Alexander Bay 12 000 60.4 DMA Rural area - Bushmanland 1 500 TOTAL 108 1116 48.1
Namakwa is very arid, and is populated on average by less than 1 person/km2.7 The population is largely urbanised:
1 Namakwa IDP, 2002, p. 11. 2 Gaffney’s Local Government in South Africa 2004-6, p. 865. 3 Gaffney’s pp. 865-866. 4 Namakwa Distriksmunisipaliteit, Samestelling van mini-groe en ontwikkelings berade se uitkomste, Konsep Verslag, p. 16. 5 Gaffney’s Local Government in South Africa 2004-6, p. 865. 6 Gaffney’s Local Government in South Africa 2004-6, p. 865.

Arid Areas Report Volume 1: District Socio-economic Profile and Development Plans
Table 2: Urban population, poverty, by District municipality in the Northern Cape8 District Municipality
Population % urban
% Proportion unemployed
%House-holds living in poverty
% with no schooling
Contribution to provincial GDP9
Namakwa (Springbok)
108 111 48.1 28.5 34.1 11.5 10%
Provincial trends
35.6 42% 19.2% 100 %
The population growth rate from 1996-2001 has been about 2% over five years, while Nama Khoi (Springbok area) has had a negative growth rate – possibly due to the decline of mining in the area.10 The growth rate is likely to decline in the next few years, suggesting a static population figure. There is a significant rate of out-migration, mainly by women, which is an unusual phenomenon. In 2001, approximately 9 400 people were unemployed, compared to 31 300 people who have jobs.11 Of the 31 300 people who were employed, almost a third (11 715) were in elementary occupations. The population is fairly highly urbanised in all local municipalities (61-83%), except in Kamiesberg (31%) and Nama Khoi (28%). In these municipalities, the development of communal farming is particularly important:12
Table 3: Urban and rural population, 200113
Local Municipality Urban population % urban Khai-Ma 6 168 69.1 Karoo-Hoogland 8 480 61.1 Hantam 15 316 71.6 Kamiesberg 3 137 31.7 Nama Khoi 15 438 28.8 Richtersveld 9 685 83.7
Agriculture in Namakwa consists of large extensive commercial and communal farms, producing primarily goats and sheep. Tourism is an increasingly important sector, and is based primarily on game reserves. These include the Ai-Ais Richtersveld Trans-frontier Park, boasting spectacular arid and desert scenery; the Skilpad Wildflower Reserve; the Goegap Nature Reserve; and the Orange River Mouth. The Richtersveld Community
7 Namakwa Distriksmunisipaliteit, Samestelling van mini-groe en ontwikkelings berade se uitkomste, Konsep Verslag, p. 16. 8 SA Institute of Race Relations, Fast Facts, February 2006. 9 Address by MEC for Finance and Economic Affairs, Economic Affairs budget vote, 22 June 2006. 10 Namakwa IDP, 2002, p. 19. 11 Namakwa IDP, 2002, p. 23. 12 Namakwa IDP, 2002, p. 17. 13 Namakwa IDP, 2002, p. 17.

Arid Areas Report Volume 1: District Socio-economic Profile and Development Plans
Biodiversity Conservation Project arose from a realization that the biodiversity resources of the area need to be preserved. Further south, the South African Large Telescope in Sutherland is becoming a major tourism drawcard.14 Mariculture and fishing will become an increasingly important industry. In terms of employment, Namakwa’s economic sectors were in order of prominence: (1) Agriculture/fishing, (2) mining, (3) community services, (4) trade/tourism, and (5) construction:
Table 4: Employment by sectors in Namakwa District
Economic sector TOTAL Agriculture; hunting, forestry and fishing 6876 Mining and quarrying 5605 Manufacturing 912 Electricity; gas and water supply 141 Construction 1254 Wholesale and retail trade; repairs, hotels and restaurants 14788 Transport, storage and communication 589 Financial intermediation; insurance; real estate and business services 1178 Community; social and personal services 4427 Private households 2790 Other and not adequately defined 3 Undetermined 1882
Especially in Namakwaland (Nama-Khoi and Richtersveld), a large number of households live under the minimum income level. These areas reflect a high incidence of unemployment. Calvinia also shows a large proportion of the population in the lowest income category.15 Namakwa DM included the following projects in its IDP:
• Creation of economically viable environmental projects, in association with the SKEP Programme (Succulent Karoo Environmental Programme)
• Establishment of tourism information centres to promote tourism • Creation of economically viable LED projects • Temporary job creation to alleviate poverty (80 jobs for period of 20 days). • Water pipeline from Orange River for livestock farmers • A full investigation into the economic potential of the entire DM area.
14 Gaffney’s Local Government in South Africa 2004-6, p. 866. 15 Namakwa IDP, 2002, p. 26.

Arid Areas Report Volume 1: District Socio-economic Profile and Development Plans
1.1 Karoo-Hoogland Municipality (Williston area)
Karoo-Hoogland LM consists of the towns of Sutherland, Williston and Fraserburg on the high plateau north of the Nuweveld Mountains. The headquarters are in Williston.
The population of Karoo-Hoogland is 10 512, and the municipal area is 27 985km2.
The main employment is in agriculture (1330 people), community/social/personal sector (417 people)., private households (411 people), and wholesale/retail (241 people).16
Sutherland in particular has seen exciting developments in recent years as a consequence of its SALT telescope and its general suitability for astronomical observation. The main economic base is sheep-farming. The municipality has a considerable comparative advantage in its ready accessibility from the Cape Town metropole. Sutherland has become nationally renowned for the severity of its winter temperatures. Tourism activity in Sutherland has increased significantly in the last few years.
Table 5: Employment status in Karoo-Hoogland Municipality
Population17 Employment status Employees 12 116 Employed 2934 Unemployed 1174 Not economically active 2375
Several job creation projects were included in the 2004 IDP:
• Kamamma Coffee Shop: Sutherland • Kamamma Coffee Shop: Fraserburg • Venus Susters: Kuilenburg • Screen Printing: Williston • Cultural Village: Fraserburg • Educational Material: Fraserburg • SKEP (Succulent Karoo Ecosystem Plan) – tour guides • Finalise a land reform strategy, and negotiate with province about implementation • Wool scouring plant • Tulip production project.
Khai Ma Municipality (Pofadder area) Based in Pofadder, Khai-Ma also embraces the towns of Pella, Onseepkans, and the mining settlement of Aggeneys. The municipality’s northern boundary is provided by the natural border the Orange River forms with Namibia. Fresh water mainly comes from 16 Gaffney’s Local Government in South Africa 2004-6, p. 866 17 Namakwa IDP, 2002, p. 17.

Arid Areas Report Volume 1: District Socio-economic Profile and Development Plans
Pelladrif, 50 km from Pofadder, as the local boreholes dried up in the late 1950s. The N14 connecting Pofadder with Springbok and Upington is the main travel artery through the municipality. The district has considerable tourism potential which is unfortunately impacted on by its very poor roads.18 The population is a total of 11 344, and the municipal area consists of 7 728 km2.19 The main form of employment sector is agriculture (1968 people), mining (473 people), community and personal services (370 people), trading (361 people) and construction (207 people).20
Table 6: Employment profile of Khai-Ma Municipality
Population21 Employment status Employees 9 335 Employed 3976 Unemployed 731 Not economically active 2789
Projects mentioned in the IDP include: 22
• Strategy to promote a sustainable agriculture project, including preparation of
25 hectares of irrigated land (30 jobs to be created) • Strategy to establish a fish breeding project at Onseepkans (14 jobs to be
created) • Strategy to establish a “crusher plant” at Pella (12 jobs), and to provide sand and
stone to the area, particularly for the Expanded Public Works Programme • Strategy to upgrade the caravan park in Pofadder, and to create 15 jobs • Strategy to establish a chicken farm (20 jobs) • Strategy to create a biodiversity-rich environmental area in Bushmanland, and
landcare project created with communal farmers • Pella food gardens (13 jobs) • Witbank agricultural development • Pofadder agricultural development • Landcare projects in Witbank, Hartbeesrivier, Pofadder, and Pella • Promotion of small miners association • Previous projects (completed): clothing project, coffin project, cultivation of
Hoodia, Pella Food Security Project.
18 Gaffney’s Local Government in South Africa 2004-6, p. 873.. 19 Gaffney’s Local Government in South Africa 2004-6, p. 873. 20 Gaffney’s Local Government in South Africa 2004-6, p. 873. 21 Namakwa IDP, 2002, p. 17. 22 IDP 2004, projects for 2005/6.

Arid Areas Report Volume 1: District Socio-economic Profile and Development Plans
Hantam Local Municipality (Calvinia area) Hantam municipality comprises the towns of Brandvlei, Calvinia, Loeriesfontein and Nieuwoudtville. The municipality is based in Calvinia which forms the heart of one of South Africa’s largest wool-producing districts. The area has no permanent rivers and securing sufficient water is a perennial challenge. Ironically enough the area has been known to suffer significant flood damage. The district is of especial interest to botanists and horticulturalists – Loeriesfontein alone has about 4 000 plant species. The Akkerendam Nature Reserve and the many historical buildings are just two of the variety of tourist attractions that make Hantam a popular stopover for passing travelers.23 Nieuwoudtville is an important site for the Succulent Karoo Environmental Programme (SKEP), due to its astonishing flower diversity. Hantam’s municipal area is 26 443 km2, and it has a total population of 19 814.24 Employment is concentrated in agriculture (1 807 people), followed by community and personal services (814), private households (658), and construction (239).
Table 7: Employment profile of Hantam Municipality
Population25 Employment status Employees 19 086 Employed 5227 Unemployed 1338 Not economically active 5494
Economic projects in the area include26:
• Flower bulb project (exports; job creation) in Nieuwoudtville • Training Centre in Calviania, for basic life skills, care of the elderly, catering,
creches • “Gips” production in Loeriesfontein • Abattoir in Calvinia • Low cost furniture, job creation • Stone mason’s project - Loeriesfontein, Brandvlei • Recreation resort in Calvinia, including empowerment of new tourism operators • Storm water project – temporary job creation • Holiday resort in Nieuwoudtville, including empowerment of new tourism
operators • Potato project in tunnels – Nieuwoudtville, Loeriesfontein • Tea processing – Nieuwoudtville
23 Gaffney’s Local Government in South Africa 2004-6, p. 867. 24 Gaffney’s Local Government in South Africa 2004-6, p. 867. 25 Namakwa IDP, 2002, p. 17. 26 IDP Review, 2005.

Arid Areas Report Volume 1: District Socio-economic Profile and Development Plans
• Expansion of commonage and development of emergent farmers – Nieuwoudtville, Calvinia, Loeriesfontein, Brandvlei
• Training tour guides – Nieuwoudtville • Business hive, for marketing of proteas and flowers – Nieuwoudtville • Sheds for hawkers – Calvinia • Business hive for coffins, shoe repairs, cheap furniture etc – Calvinia • Driving school – Calvinia • Wool processing – Calvinia • Cultivation and sale of olive trees – Calvinia • Wheat mills – Calvinia • Multi-purpose Community Centre in Calvinia • Salt production project – Loeriesfontein, Brandvlei • Hides and skins project – Loeriesfontein • Chicken project – Brandvlei.
Kamiesberg LM (Kamieskroon area) The Kamiesberg municipal area while embracing the towns of Hondeklipbaai, Garies, and Kamieskroon also includes a number of settlements including the evocatively named Platbakkies, Soebatsfontein and Spoegrivier. In the west the municipality borders on the Atlantic coastline. It is traversed by the busy N7 which links Springbok with Cape Town. Hondeklipbaai is used as a base by diamond dredgers but its growth as a tourism destination is constrained by its limited water supply. The historic missionary settlement of Leliefontein is found within Kamiesberg and the district is world renowned for the spectacle of its Namaqua daisies27. Kamiesberg’s surface area comprises 11 021 km2, and it has a population of 10 754.28 Its labour force is concentrated primarily in the mining sector (612 people), followed by agriculture and fishing (478), community and personal services (411), trade (219) and business (80).29
Table 8: Employment profile of Kamiesberg Municipality
Population30 Employment status Employees 11 031 Employed 2358 Unemployed 1108 Not economically active 3208
27 Gaffney’s Local Government in South Africa 2004-6, p. 870. 28 Gaffney’s Local Government in South Africa 2004-6, p. 870. 29 Gaffney’s Local Government in South Africa 2004-6, p. 869. 30 Namakwa IDP, 2002, p. 17.

Arid Areas Report Volume 1: District Socio-economic Profile and Development Plans
The IDP for 2005/6 mentioned the following projects:
• A Granite mine to promote local development • A wollestonite mine • A coast care project (30 temporary jobs) in Hondeklipbaai • A black mussels project (20 permanent jobs) at Hondeklipbaai • A perlemoen project in Hondeklipbaai (20 permanent jobs) • A MPRC (??) in Hondeklipbaai, to promote economic development • Tourism development in each town in Kamiesberg • SMME development throughout Kamiesberg • Bakery and catering project in Leliefontein • Telecentre in Leliefontein, managed as a sustainable enterprise • Olive farm • Lucern plantations at Garies and Nourivier • Goose feather project in Lepelsfontein and Leliefontein • Land reform projects for emergent farmers, capacity-building of 20 emergent
farmers, and rental of farm equipment. • Watermelon project for Chinese market • Wheat mill at Kamieskroon • Fresh water fish project at Nourivier • Leather tannery • Bamboo project at Hondeklipbaai • Essential oil project at Leliefontein
1.5 Nama Khoi LM (Springbok area)31 Nama Khoi comprises the heart of Namaqualand. It is headquartered in Springbok and includes the towns of Kleinsee, Concordia, Nababeep, O’okiep and Steinkopf as well as the Vioolsdrif border post with Namibia. It is traversed by the N7 linking Cape Town with Namibia and as such sees a good deal of passing freight and tourist traffic. The region had its economic origins in copper mining and is also rich in missionary and Anglo-Boer War historical sites. There are 4x4 routes which showcase the unique Namaqua landscapes. The annual flower season is a major tourist attraction, and the area has rich mineral deposits. The municipality has an area of 13 968 km2, with a population of 44 750.32 Employment is concentrated in mining (3 311 people), followed by community and social services (1 990), private households (1 071), retail (1 923), agriculture (817 people), construction (585), and business (566).33 31 Hersiene Geintegreerde Ontwikkelingsplan, Junie 2005. 32 Gaffney’s Local Government in South Africa 2004-6, p. 874. 33 Gaffney’s Local Government in South Africa 2004-6, p. 875.

Arid Areas Report Volume 1: District Socio-economic Profile and Development Plans
Table 9: Employment profile of Nama Khoi Municipality
Population34 Employment status Employees 44 836 Employed 11535 Unemployed 5754 Not economically active 12253
No LED projects were listed. However, the municipality aims to promote the tourism industry.
1.6 Richtersveld LM 35 (Port Nolloth area) The Richtersveld was named after the Rev Richter, a Rhenish missionary. The municipality encompasses the coastal towns of Port Nolloth (the municipal headquarters) and Alexander Bay, as well as settlements such as Lekkersing, Khubus and Eksteenfontein. Mining has been the economic mainstay of this area although it is currently in decline. Many tourists are attracted by the pristine purity of the unspoilt Richtersveld and the National Park receives some 5 000 tourists a year. The provision of water is a major problem and is a limiting factor on the development of Port Nolloth as a holiday destination36. The mining towns of Alexander Bay, Reuning and Baken are well developed, while the outlying rural towns (Khubus, Lekkersing, Eksteenfontein and Sanddrift) are widely dispersed and poorly developed. The municipality has a surface area of 8 877 km2, and a population of 10 124.37 The workforce is concentrated in the mining industry (1 154 people), followed by community and personal services (418), retail (369), private households (246), business (161), and construction (87).38 Mining employment is decreasing, and it is anticipated that the unemployment rate has reached 40%. A barrier to employment is the lack of skills and education.
Table 10: Employment profile of Richtersveld Municpality
Population39 Employment status Employees 11 764 Employed 2831 Unemployed 1558 Not economically active 2469
34 Namakwa IDP, 2002, p. 17. 35 IDP Draft Review, 2003 36 Gaffney’s Local Government in South Africa 2004-6, p 877-878 37 Gaffney’s Local Government in South Africa 2004-6, p. 877. 38 Gaffney’s Local Government in South Africa 2004-6, p. 877. 39 Namakwa IDP, 2002, p. 17.

Arid Areas Report Volume 1: District Socio-economic Profile and Development Plans
The IDP emphasises the need to diversify the local economy from mining and fishing. A LED strategy, with the support of GTZ/Transform, was developed for the municipality during 2002. The municipality would like to establish tourism facilities in Port Nolloth. The Richtersveld National Park receives more than 5 000 visitors a year. The municipality will employ a Development Officer (DO) that will assist the municipality and SMMEs. It will also establish a small business forum and a Business Association, which will assist in developing SMMEs. The municipality will promote research and market opportunities, and will make training available to businesses. It will also source assistance and funding.

Arid Areas Report Volume 1: District Socio-economic Profile and Development Plans
2. Matzikama Local Municipality, West Coast District Matzikama is the northern-most Local Municipality of the West Coast District Municipality. Its main towns are Vredendal (headquarters of the municipality), Vanrhynsdorp, Doringbaai, Strandfontein, Klawer and Lutzville. It has a flourishing agricultural sector, primarily based on grapes and tomatoes. Intensive agriculture is concentrated along the Olifants River; Strandfontein is a holiday resort; and Doringbaai has a flourishing crayfish industry. The municipality has a surface area of 5 372 km2.40 It has a population of about 50 000 (2001 figures), and had a population growth rate of 3.27% between 2001 and 2006, a higher rate compared to the 2.38% of the West Coast District.41 During 2001, almost 2000 people migrated to Matzikama, but this in-migration is expected to decline in future.42 The population is very young. Matzikama’s population is 51.7% urban.43 If the 10-year period between 1995 and 2004 is taken into account, then the growth rate was merely 1.3% per annum, almost half the district average of 2.4%.44 Recently, the economic growth rate has increased somewhat. The economic growth rate between 2003 and 2004 was 3.8%, which was lower than the West Coast rate of 4.3%.
Table 11: Employment status in Matzikama Local Municipality
Employment status Employed 18731 Unemployed 3507 Seasonal worker not working presently 22238
The unemployment rate in 2001 was 15.8%, higher than the district figure of 13.8%, but significantly lower than the national average of 33.8%.45 The number of unemployed in 2001 was 3 511.46 The number of people employed had increased from 14 940 in 1996 to 18 705 in 2001 (4.6% per annum), but the number of workseekers had increased at a
40 Gaffney’s Local Government in South Africa 2004-6, p. 1012. 41 Western Cape (2006), Socio-Economic Profile: West Coast District, p. 28. 42 Western Cape (2006), Socio-Economic Profile: West Coast District, p. 37. 43 Gaffney’s Local Government in South Africa 2004-6, p. 1005. 44 Western Cape (2006), Socio-Economic Profile: West Coast District, p. 31. 45 Gaffney’s Local Government in South Africa 2004-6, p. 1013. 46 Western Cape (2006), Socio-Economic Profile: West Coast District, p. 28.

Arid Areas Report Volume 1: District Socio-economic Profile and Development Plans
faster rate than the creation of jobs. There were 814 households with no income, which amounted to 5.6% of households. The most important economic sectors in 2004 were agriculture and fishing (18.3%), trade, catering and accommodation (17.7%), finance and business (11.7%), and government services (11.2%).47 This reflects the predominance of agriculture and tourism. Between 2000-2004, the trade and accommodation sector grew by 3.2%, but agriculture declined by -0.6%.48 Transport and communication registered the highest growth rate (5.3%), followed by community services (7.1%). Manufacture managed a respectable 3.4% growth. Employment is concentrated in agriculture and fishing (8 012 people), followed by trade (2 083), community and personal services (1 960), private households (1 188), mining (907), business (812), and construction (745).49 The decline in the agricultural growth rate is a matter for concern, because it is by far the major employer. In 2001, agriculture employed about 8 000 workers, compared to only 2 000 each in the next two sectors (Trade and community services).50 Furthermore, the high employment figure for agriculture conceals its seasonal nature, and agricultural work tends to be poorly paid. Poverty is severe in the municipality, with more than half of its households (54%) earning an income of less than R1 500 per month.51 During 2005, the average number of social grants paid was 568. The total value of the grants was R285 776 per month.52 The following projects have been identified in the latest IDP: 53 • Development of a formal trading area for informal traders • Development of informal abattoirs in Ebenhaezer, Avilla Park en Doringbaai • The Development of Beehive SMME centers and training of SMME owners in
conjunction with relevant provincial departments. • Increase in fishing quotas for small fishing concerns
47 Western Cape (2006), Socio-Economic Profile: West Coast District, p. 33. 48 Western Cape (2006), Socio-Economic Profile: West Coast District, p. 33. 49 Gaffney’s Local Government in South Africa 2004-6, p. 1012. 50 Western Cape (2006), Socio-Economic Profile: West Coast District, p. 39. 51 Gaffney’s Local Government in South Africa 2004-6, p. 1013. 52 Western Cape (2006), Socio-Economic Profile: West Coast District, p. 47. 53 Matzikama IDP 2005/6.

Arid Areas Report Volume 1: District Socio-economic Profile and Development Plans
IV. The Central Zone
1. The Central Karoo District The Western Cape’s economic growth rate has surpassed that of South Africa. In 2004, it was 5.3%, as compared to 4.5% for South Africa.54 However, the province lacks a “robust, innovative, middle layer of SMMEs to support broad-based economic growth, job creation and BBBEE”.55 The Provincial Government also believes that a sustained growth rate of above 6% is needed. The resource beneficiation sectors were identified to develop networks with global entities. The mobilisation of partnerships has enabled specialized research to establish opportunities in sectors such as agriculture, forestry, aquaculture, mining and associated value chains.56 The service sector – including tourism – has also been prioritised. This holds some significance for the Karoo. The population of the Central Karoo is conspicuously smaller than all the other district municipalities in the Western Cape Province. It is also relatively urbanised. It has the highest proportion of population unemployed and living in poverty – although, given its small population, the absolute numbers of unemployed and poor people would be much smaller than that of the other provinces. The Central Karoo also has the lowest level of education. The West Coast has a relatively lower degree of unemployment, but still has high levels of poverty. Table 1 shows that the Central Karoo DM has the highest proportion of unemployment in the province, although the actual number is much smaller than most of the other District Municipalities. It also has among the highest proportion of households living in poverty, and population with no schooling:
Table 12: Urban population, poverty, by District municipalities57 Population % urban %Proportion
unemployed %House-holds living in poverty
% with no schooling
Central Karoo 60484 72.5% 36.2% 27.3% 9.7% West Coast 282672 62.3% 13.8% 26.8% 5.7% Provincial trends
- - 26.1% 23.1% 3.6%
54 Department of Economic Development and Tourism, Annual Report 2005-6, p. 17. 55 Department of Economic Development and Tourism, Annual Report 2005-6, p. 18. 56 Department of Economic Development and Tourism, Annual Report 2005-6, p, p. 20. 57 Fast Facts, February 2006, South African Institute of Race Relations and www.statssa.gov.za

Arid Areas Report Volume 1: District Socio-economic Profile and Development Plans
Central Karoo consists of a main urban node at Beaufort West (population 37 107), as well as Prince Albert (10 512) and Laingsburg (6 681).58 The town of Murraysburg is located within a District Management Area (DMA). The Central Karoo was declared a presidential node in 2001, in terms of the Integrated Sustainable Rural Development Strategy. This strategy promotes co-operation between national, provincial and local governments. The strategy is driven by the Central Karoo District Municipality. Government spending within the district has increased dramatically because of this initiative.59 According to projections, the population of the Central Karoo is likely to experience negative migration (net out-migration) from 2005 onwards.60 However, a major and unanticipated change is likely to be the possible opening of a uranium mine east of Beaufort West, which will cause an influx of possibly hundreds of families. As a share of national and provincial GDP, the Central Karoo makes a very minor contribution:
Table 13: District contributions to Western Cape GDP, 200461
GDP2004 (R-million) Share of SA (%) Share of Western Cape (%)
South Africa 954019 - - Western Cape 138 941 14.56 - West Coast 5 530 0,58 3,98 Central Karoo 697 0,07 0,50
The economic contribution of the Central Karoo is very small, in comparison to the other District Municipalities in the Western Cape. The West Coast’s performance is more robust. Nevertheless, between 1995 and 2004, the Central Karoo averaged an annual growth rate of 4.2% - one of the highest in the province. In 2004, this growth rate reached 5.3%. Interestingly, two other Karoo towns out-performed Beaufort West. Between 1995-2004, Prince Albert’s annual growth rate was 7.8% per annum, while Laingsburg’s was 4.8%. Beaufort West achieved a growth rate of 3% over this period.62 The Central Karoo economy is made up of the following sectors:
58 Gaffney’s Local Government in South Africa 2004-6, p. 968. 59 Gaffney’s Local Government in South Africa 2004-6, p. 968. 60 Western Cape Provincial Treasury, Socio-Economic Profile: Central Karoo District 2006, p.11. 61 Western Cape Provincial Economic Review and Outlook 2006, (PERO) W Cape Treasury. Drawn
from J. Boulle, Jobs for Growth Mapping Study, for ASGISA, October 2006, p. 12. 62 Western Cape Provincial Treasury, Socio-Economic Profile: Central Karoo District 2006, p.4.

Arid Areas Report Volume 1: District Socio-economic Profile and Development Plans
Table 14: Economic sectors in the Central Karoo: Percentage contribution to Gross District Product63
Sector 1995 2004
Agriculture and fisheries 13.9 10.5 Mining 0.3 0.1 Manufacturing 7.5 9.1 Electrical and water 1.9 1.5 Construction 5.1 5.3 Wholesale and retail trade 14.7 17.2 Transport and communication 18.1 20.8 Finance and Business 11.3 18.4 Community services 7.0 5.3 Government 20.7 11.8
The largest share of the Gross District Product is made by Transport, followed by Trade, then Finance and Business. The share of general government as a proportion of Gross District Product has virtually halved – from 20% of GDP to about 11.5%. Agriculture and Community Services have declined, as a share of Gross District Product, while Manufacturing, Trade, Transport, and Finance have increased.
Table 15: Gross District Product in the Central Karoo64 Sector Gross District Product
(Rmillion) Contribution to Gross District Product per sector 2004
Average annual growth 1995-2004
Agriculture and fisheries 74.1 10.5 1.3 Mining 0.4 0.1 -11.2 Manufacturing 64.1 9.1 6.6 Electrical and water 10.8 1.5 1.6 Construction 37.4 5.3 4.7 Wholesale and retail trade 121. 17.2 6.1 Transport and communication
147.1 20.8 5.9
Finance and Business 129.7 18.4 10.0 Community services 37.4 5.3 1.1 Government 83 11.8 -2.1 Total 705.5 100 4.2 In particular, the following sectors performed well during 1995-2004: Finance and business (10%), Manufacturing (6.6%), Wholesale and Retail Trade, Catering and Accommodation (6.1%), Transport and communication (6.1%), and Construction
63 Western Cape Provincial Treasury, Socio-Economic Profile: Central Karoo District 2006, p.6. 64 Western Cape Provincial Treasury, Socio-Economic Profile: Central Karoo District 2006, p.7.

Arid Areas Report Volume 1: District Socio-economic Profile and Development Plans
(4.7%).65 The strong growth in Retail Trade and Accommodation reflects the importance of the N1 highway, which has led to growth in overnight sleeps and short stops. Agriculture performed poorly, at 1.3%, and so did Community and Social Services (1.1%). This is a cause for concern, as these sectors are labour absorptive. In 2004, Manufacturing only contributed 9.1% to Gross District Product. Within the manufacturing sector, the metals and machinery sub-sector is the largest (51.1% of manufacturing), followed by food and beverages (17.4%). But the relatively poor performance of Manufacturing is the main reason for the district’s low economic base. Yet the district has well-developed infrastructure, and is poised to be a distribution centre for road freight.66 This is reflected in the prominence of the Transport and Communications sector. Approximately 7000 vehicles pass through Beaufort West per day, and this doubles during peak holiday periods. In addition, there is a railway line that runs parallel to the N1 highway, and this railway is the lifeblood of towns such as Matjiesfontein, Laingsburg, Prince Albert, Leeu-Gamka and Nelspoort. Nevertheless, fruit farmers in Prince Albert and Laingsburg cite the lack of rapid public transport as the main obstacle in promoting exports. A sizable component of the population depends on social grants. An average of 863 people in the Central Karoo received social grants in 2005, with a total monthly value of R464 683. The bulk of these grants (52.8%) were pensions, followed by child support grants (21.2%).67 All the wards in Central Karoo fall on the list of the 50 most deprived districts in the PIMD (provincial index of multiple deprivation). As a percentage of provincial employment, the Central Karoo is very small. Employment in the West Coast is more substantial: Table 16: Employment by sector: West Coast and Central Karoo amongst the Employed Age 15-65
(2001)68
Sector Male Female Number of people employed
% of province
Agriculture, hunting, forestry and fishing
3,476 702 4,178 2%
Mining and Quarrying 3 3 6 0% Manufacturing 260 116 376 0% Electricity, gas and water supply 48 3 51 1% Construction 677 25 702 1% Wholesale and retail trade, repairs, hotels, restaurants
891 1,106 1997 1%
65 Western Cape Provincial Treasury, Socio-Economic Profile: Central Karoo District 2006, p.6 66 Western Cape Provincial Treasury, Socio-Economic Profile: Central Karoo District 2006, p.8. 67 Western Cape Provincial Treasury, Socio-Economic Profile: Central Karoo District 2006, p. 15. 68 From www.statsa.gov.za. Drawn from J. Boulle, Jobs for Growth Mapping Study, for ASGISA,
October 2006, p. 14.

Arid Areas Report Volume 1: District Socio-economic Profile and Development Plans
Transport, storage and communication 573 62 635 1% Financial intermediation, insurance, real estate and business services
320 317 637 0%
Community, social and personal services
1,121 1,291 2,412 1%
Private households 173 1,175 1348 1% Other not adequately defined 0 0 0%
In the Central Karoo, Beaufort West has the highest number of employed workers (about 7800), but this is still much below the 18 500 of Matzikama Local Municipality on the West Coast. Laingsburg has only about 1900 employed workers, and Price Albert has about 2500. The workforce in the Central Karoo is generally less skilled than the rest of the province:
Table 17: Skills levels of the unemployed (2001)69
Level of skill Central Karoo District Western Cape High skilled 14.2% 23.8% Skilled 42% 44.9% Low skilled 43.8% 31.9% TOTAL 100% 100%
1.1 Beaufort West Local Municipality Beaufort West is the main urban node of the Central Karoo district. It is strategically located on the N1 highway between Gauteng and Cape Town, as well as on the main railway route linking north and south. Beaufort West, together with settlements such as Merweville and Nelspoort, has a total population of 37 017. The municipality’s land surface covers 15 47 km2. 70 The workforce is primarily concentrated in the community and social sector (1612 people), followed by the agricultural sector (1440), trade (1299), private households (831), business (547), and transport (504). Beaufort West’s economy is becoming increasingly robust, with several new commercial investments.
69 StatsSA, Census 2001, in Western Cape Provincial Treasury, Socio-Economic Profile: Central Karoo District 2006, p. 15. 70 Gaffney’s Local Government in South Africa 2004-6, p. 970.

Arid Areas Report Volume 1: District Socio-economic Profile and Development Plans
Table 18: Employment in Beaufort West
Employment status Number of people Employed 7804 Unemployed 5016 Seasonal worker not working presently 151 Does not choose to work 473
The Western Cape government is increasingly positioning Beaufort West as a tourist gateway, particularly because of the growing profile of the nearby Karoo National Park. Economic development in Beaufort West includes a focus on: 71 • Hydroponics projects • Essential Oils project – no budget available • Revival of the Business Plaza at Kwa Mandlenkosi – in planning stage • Development of a Multi purpose Centre at R3, 645 000.
1.2 Laingsburg Municipality Laingsburg is situated on the N1 highway, south of Beaufort West. The municipality also includes Matjiesfontein. Lainsburg comprises 2485 km2, and has a population of 6681.72 Employment in Laingsburg is concentrated in the agriculture sector (895 people), followed by retail (335), community and personal services (285), and private households (119).73 Laingsburg’s economy is stagnant, and many young people move away, because of a lack of training facilities. Unemployment stands at 36%, and there is a high rate of dependency in households. Matjiesfontein is a notable tourism location, with typical Karoo architecture and receiving visitors by tourism trains. The Laingsburg Municipality wants to promote tourism by creating an exhibit about the 1981 Laingsburg flood disaster, and by promoting the Karoo Festival.
Table 19: Employment in Laingsburg
Employment status Number of people Employed 1939 Unemployed 692 Seasonal worker not working presently 151 Does not choose to work 84
71 Beaufort West IDP 2005/6 72 Gaffney’s Local Government in South Africa 2004-6, p. 972. 73 Gaffney’s Local Government in South Africa 2004-6, p. 972.

Arid Areas Report Volume 1: District Socio-economic Profile and Development Plans
The 2005/6 IDP identifies the following projects: 74 • Currently, construction is under way for an additional MPCC in the Laingsburg Local
Municipality. • Warehousing and Transfer Packaging project in planning phase • Railway Sleeper wood furniture production in planning phase • Pallet Crate and Dry Rack manufacturing production project in planning phase • Fruit Processing project in planning phase • Skin Tannery and Leather products manufacturing project in planning phase • Fountain Water bottling project in planning phase
1.3 Prince Albert Municipality Prince Albert is located at the foot of the Swartberg Mountain, and the jurisdiction includes the small settlements of Leeu-Gamka and Klaarstroom. The population of Prince Albert is about 10 500, and the municipal jurisdiction is 7 879 km2. Employment is concentrated in the agriculture sector (1205 people), followed by community and personal services (324), Trade (262), Construction (192), and Household sector (185).75 The unemployment rate is high (32%), and there is a high dependency ratio. Many young people migrate away to look for job opportunities.
Table 12: Employment status in Prince Albert
Employment status Number of people Employed 2496 Unemployed 1346 Seasonal worker not working presently 121 Does not choose to work 292
Prince Albert hosts three festivals every year: The German Oktoberfest and Flower Festival, the Agricultural Show, and the Olive Festival. The 2005/6 IDP identifies the following projects: 76
74 Lainsberg IDP 2005/6 75 Gaffney’s Local Government in South Africa 2004-6, p. 974. 76 Prince Albert IDP 2005/6

Arid Areas Report Volume 1: District Socio-economic Profile and Development Plans
• The Cold Storage facility projects in partnership with DBSA, DoL, Department of Agriculture, Agri-Western Cape, DWAF, Wesgro and Provincial Dept of Social Services at R1 200 000.
• Vegetable Food Gardens projects at a total budget of R580 000.

Arid Areas Report Volume 1: District Socio-economic Profile and Development Plans
2. Cacadu District Municipality The Karoo straddles three District Municipalities in the Eastern Cape. Cacadu DM is the most significant, as virtually all its jurisdiction can be regarded as arid or semi-arid. “Cacadu” is a Khoi word, describing the landscape as marked by semi-arid plains.77 Chris Hani DM and Ukhahlamba stretch into the Karoo in their western parts (because they have a large non-arid area, they are not fully highlighted in the table below):
Table 13: Urban population, poverty, by District municipalities78 District Municipality
Population % urban %Proportion unemployed
%Households living in poverty79
% with no schooling
Alfred Nzo Mount Ayliff
550401 5.0 68 79.9 23.3
O.R. Tambo Mthata
1676480 10.8 65.6 78.2 38.1
Chris Hani Queenstown
810303 30.8 58.9 68.3 29.7
Ukhahlamba Barkley east
341342 24.5 53.4 73.5 28.2
Amatole East London
11664254 43.0 57.6 61.0 20.4
Cacadu Port Elizabeth
388208 69.3 35.4 44.4 15.0
The Eastern Cape is one of the poorest provinces in South Africa. The unemployment rate (32%) is the third worse of the nine provinces, whereas the households under the poverty line of R800 per month are 44.5%, more than the national rate and second worse among nine provinces. The Human Development Index (HDI) is 0.64% worse than the national average. In this context, Cacadu DM fares fairly well, compared to other districts in the Eastern Cape. Interestingly, and unlike the Western Cape, the Karoo areas are regarded as the more developed and prosperous areas in the Eastern Cape, despite rising poverty in settlements and towns.80 The GDP per capita of the District is higher than the provincial average, and the unemployment rate is lower than the Metro’s (35% against the Metro’s 40%). There is evidence of above average economic growth in recent years.81
77 Gaffney’s Local Government in South Africa 2004-6, p. 366. 78 South African Institute of Race Relations, Fast Facts, February 2006. Table drawn from Mike Meyer, Eastern Cape Mapping Study, unpublished paper for ASGISA, 2006. 79 Households earning less than R1100 per month. 80 Melinda McCann (European Consultants Organisation): “District and Metro profile: Eastern Cape
Cacadu District (DC10) and Nelson Mandela Metropolitan Municipalities”, Eastern Cape Competitive Advantage Assessment and Training Project, n.d.
81 ECSECC, Cacadu: Socio-Economic Profile 2007, p. 6.

Arid Areas Report Volume 1: District Socio-economic Profile and Development Plans
The Eastern Cape is characterised by a number of dualisms: between the two urban industrial manufacturing centres and the poverty stricken and underdeveloped rural hinterland particularly in the former homeland areas of the Transkei and Ciskei; between a developed commercial farming sector and a floundering subsistence agricultural sector; and between concentrations of fairly well developed and efficient social and economic infrastructure in the western parts of the province and its virtual absence in the east.82 The arid areas of Cacadu consist of six local municipalities:
• Sunday’s River Valley LM: Kirkwood, Addo, Paterson • Baviaans LM: Willowmore, Steytlerville, • Camdeboo LM: Graaff-Reinet, Aberdeen • Blue Crane LM: Somerset East, Pearston • Ikwezi LM: Jansenville • Two rural District Management Areas.
Given that only about half of Cacadu DM falls in the arid areas, statistics for the District Municipality as a whole would be misleading. Nevertheless, some general features of Cacadu are worth noting83. It has an export-based economy, primarily tied to the agricultural sector. Farm output is transported to the Metro (Port Elizabeth) for processing and/or export. The District’s agricultural sector accounts for nearly 40% of the Province’s agricultural output – despite the fact that it is largely arid. The agricultural sector is the largest employer in the district, accounting for about 38% of all jobs. The district has shown strong real growth of Gross Value-Added over the period 1996-2001, but only 5 000 jobs were created.84 Nearly all the job creation was in the community services sector (government services). That means that job creation in some private sectors was offset by job losses in others. The agricultural sector showed real growth over the period, but a decline in jobs (presumably due to game farming). There was quite strong growth in manufacturing and jobs were maintained. Construction, trade and finance showed strong growth of real GVA and jobs. The growth of community services GVA was below the provincial average – significantly, because Cacadu is seen as a relatively privileged region.85 The extent of road surfacing is above the provincial norm, and the proximity to Port Elizabeth boosts the economic performance of the Cacadu District. It has above average access to health and educational services. Cacadu District has the most diversified economy in the province. Cacadu has the highest HDI ranking and the lowest HIV/AIDS rate of all the districts in the province.86
82 Eastern Cape PGDS, 2004-2014. 83 ECSECC, Cacadu: Socio-Economic Profile 2007, p. 6. 84 ECSECC, Cacadu: Socio-Economic Profile 2007, p. 8. 85 ECSECC, Cacadu: Socio-Economic Profile, 2007, p. 8. 86 Melinda McCann (European Consultants Organisation): “District and Metro profile: Eastern Cape
Cacadu District (DC10) and Nelson Mandela Metropolitan Municipalities”, Eastern Cape Competitive Advantage Assessment and Training Project, n.d.

Arid Areas Report Volume 1: District Socio-economic Profile and Development Plans
Table 14: GDP of Cacadu per sector87
Sectors Contribution to GDP
in 2000 (%) Share of total formal employment in 1999 (%)
Agriculture 27.7 41 Mining 3.1 0.1 Manufacturing 9.6 6.7 Electricity 3.0 0.5 Construction 3.2 5 Trade 10.7 7.6 Transport 5.4 1.6 Finance 9.1 3.5 Government and Community 28.2 23 Domestic work 11.5
The average annual economic growth rate for the Cacadu District between 1996 and 2002 was 2.4 percent, second in the Eastern Cape Province after that of the Nelson Mandela Metropolitan Municipality (3.7 percent per annum).88
In terms of GDP and employment contribution, Cacadu has a comparative advantage in Agriculture/Hunting and Construction.89 Much of Cacadu has good potential for sheep, mohair, game and dairy farming. Tourism and agro-processing have significant growth potential. Population density in Cacadu District Municipality is only 6.7 people per square km.90 Its land surface makes up 34.3% of the provincial area, but its population is only 6% of the provincial population.
Table 15: Economic profile of Cacadu District Municipality
Sector Male Female Total Agriculture; hunting, forestry and fishing 22329 8413 30742 Mining and quarrying 103 12 115 Manufacturing 3174 1458 4632 Electricity; gas and water supply 438 86 524 Construction 5236 269 5505 Wholesale and retail trade; repairs, hotels and restaurants 5904 5198 11102 Transport, storage and communication 1361 387 1748 Financial intermediation; insurance; real estate and business services 2086 1714 3800 Community; social and personal services 8057 7714 15771 Private households 2281 9469 11750
87 Mike Meyer, Jobs for Growth Mapping Project: Eastern Cape, unpublished report for ASGISA, 2006. 88 University of the Free State, “Agricultural Potential of Cacadu DM”, Draft version, n.d. 89 Melinda McCann (European Consultants Organisation): “District and Metro profile: Eastern Cape
Cacadu District (DC10) and Nelson Mandela Metropolitan Municipalities”, Eastern Cape Competitive Advantage Assessment and Training Project, n.d., p. 9.
90 Eastern Cape Department of Roads and Transport, Provincial Land Transport Framework, Final Draft, February 2007, p. 3.2.
Arid Areas Report Volume 1: District Socio-economic Profile and Development Plans
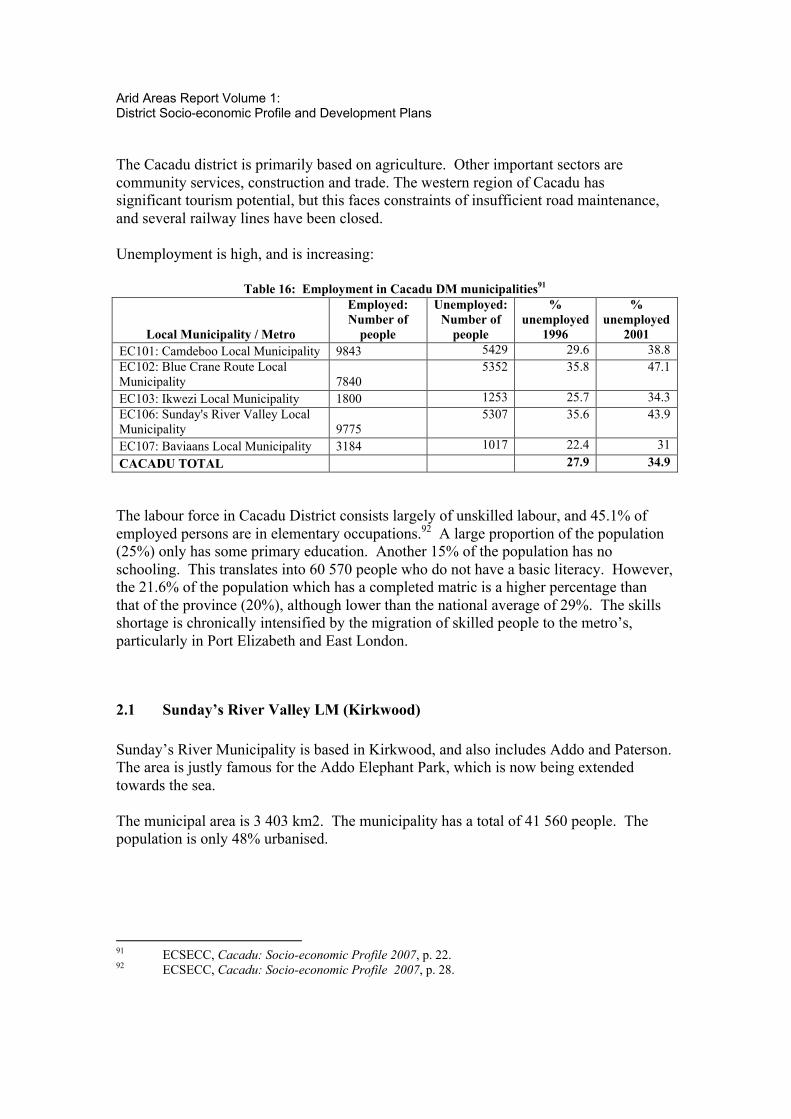
The Cacadu district is primarily based on agriculture. Other important sectors are community services, construction and trade. The western region of Cacadu has significant tourism potential, but this faces constraints of insufficient road maintenance, and several railway lines have been closed. Unemployment is high, and is increasing:
Table 16: Employment in Cacadu DM municipalities91
Local Municipality / Metro
Employed: Number of
people
Unemployed: Number of
people
% unemployed
1996
% unemployed
2001 EC101: Camdeboo Local Municipality 9843 5429 29.6 38.8 EC102: Blue Crane Route Local Municipality 7840
5352 35.8 47.1
EC103: Ikwezi Local Municipality 1800 1253 25.7 34.3 EC106: Sunday's River Valley Local Municipality 9775
5307 35.6 43.9
EC107: Baviaans Local Municipality 3184 1017 22.4 31 CACADU TOTAL 27.9 34.9 The labour force in Cacadu District consists largely of unskilled labour, and 45.1% of employed persons are in elementary occupations.92 A large proportion of the population (25%) only has some primary education. Another 15% of the population has no schooling. This translates into 60 570 people who do not have a basic literacy. However, the 21.6% of the population which has a completed matric is a higher percentage than that of the province (20%), although lower than the national average of 29%. The skills shortage is chronically intensified by the migration of skilled people to the metro’s, particularly in Port Elizabeth and East London.
2.1 Sunday’s River Valley LM (Kirkwood) Sunday’s River Municipality is based in Kirkwood, and also includes Addo and Paterson. The area is justly famous for the Addo Elephant Park, which is now being extended towards the sea. The municipal area is 3 403 km2. The municipality has a total of 41 560 people. The population is only 48% urbanised.
91 ECSECC, Cacadu: Socio-economic Profile 2007, p. 22. 92 ECSECC, Cacadu: Socio-economic Profile 2007, p. 28.

Arid Areas Report Volume 1: District Socio-economic Profile and Development Plans
The economy is based primarily on agriculture (4 942 jobs), followed by community and personal services (1 038 jobs), private households (932), trade (761), manufacturing (484), business (229), and construction (215).93 The Sunday’s River is an important irrigation and citrus farming region, with the town of Kirkwood the main focal point of the valley. The level of unemployment is about 40%.94 The expansion of conservation has led to a decline in employment. In various parts of the municipality, between 45% and 63% of the population have no income.95 The 2003/2004 revised IDP includes the following projects:96
• Put a framework and institutional structure for LED in place • Establish an LED forum • Identify job creation opportunities and possible areas of intervention • Improved and increased Council and community participation and responsibility
in the Addo park extension initiative • Prepare a policy to promote local labour initiatives • Formulate a business establishment incentive • Implement a business and unemployment data base • Access and apply for poverty alleviation grants and funds • Identify Council’s assets that can be used for job creation purposes • Establish and SMME support centre and facilitate development • Communication and marketing of Council’s LED initiatives and programme • Put a framework and structure in place to drive, promote, establish, and
strengthen the tourism structure • Initiate and implement small scale farming projects • Business development and job creation pilot projects • Process primary citrus products • Manufacture cartons for packaging • Manufacturing and maintenance of pallets • Brick making • Micro Enterprise craft centre • Truck stop initiative in Paterson • Refuse Recycling
2.2 Baviaans LM (Willowmore) The headquarters of Baviaans Muncipality is based in Willowmore, and also includes Steytlerville and other settlements such as Baroe and Studtis. Steytlerville has captured its civic history in a remarkable series of family crests that line the main street. 93 Gaffney’s Local Government in South Africa 2004-6, p. 386. 94 Gaffney’s Local Government in South Africa 2004-6, p. 387. 95 Gaffney’s Local Government in South Africa 2004-6, p. 387. 96 Sundays River Valley Revised IDP: 2003/2004

Arid Areas Report Volume 1: District Socio-economic Profile and Development Plans
The name “Baviaans” means “baboons”, a name given to the area by the early Voortrekkers.97 The municipal area comprises 7 489 km2, and consists of plains and lowlands, with low parallel hills and mountains running in an east-west direction. Vegetation is typical of the Karoo region, with low rainfall. The land is generally used for farming, conservation and tourism.98 The most significant project is the Baviaans mega-reserve, stretching from Willowmore in the west to Steytlerville in the east. Numerous farmers in the area have entered the tourist trade, with farm stays and eco-tourism ventures. The reserve is characterised by extraordinary rock formations and deep valleys. The population of Baviaans is 15 336. The population is 65% urban. Unemployment is extremely high, and it is estimated that only 20% of the population have jobs.99 The economy is primarily based on wool, ostrich and mohair, although tourism is a growing industry. The employment profile is based primarily on agriculture (1 546 people), followed by community and personal services (581), trade (304), private households (359) and construction (68).100 There is very little attention paid in the revised IDP 2003/2004 to economic development projects.101 However, the following projects are listed in the 2002 IDP:102
• Conduct research about maximising the contribution of the Baviaans Wilderness Reserve to the economic welfare of the rest of the municipliaty
• Conduct research about the provision of suitable land to small farmers and the creation of sustainable management of farming operations
• Compile a marketing plan for Baviaans Municipality • Establish a small business hive in Willowmore and Steytlerville • Develop of a tourism resort at Bakers Dam.
2.3 Camdeboo LM (Graaff-Reinet) Graaff-Reinet describes itself as “The gem of the Karoo”, and is truly an architectural paradise, with many classical Karoo buildings.
97 Gaffney’s Local Government in South Africa 2004-6, p. 368. 98 Gaffney’s Local Government in South Africa 2004-6, p. 368. 99 Gaffney’s Local Government in South Africa 2004-6, p. 368. 100 Gaffney’s Local Government in South Africa 2004-6, p. 368. 101 See Baviaans LM Revised IDP: 2003/2004 102 Baviaans LM IDP: 2002

Arid Areas Report Volume 1: District Socio-economic Profile and Development Plans
The municipality also includes Aberdeen to the south, a rustic town with beautiful buildings and tree-lined streets, and the idyllic village of New Bethesda in the Sneeuberg, with its famous Owl House. The tourist trade in this area is growing rapidly, and draws many foreign visitors. Graaff-Reinet’s Valley of Desolation is an iconic draw-card. Many Karoo farms now offer sophisticated overnight accommodation, as well as eco-tourism activities. A new venture is the agave processing plant, which produces tequila. “Camdeboo” is a Khoisan expression for “ green hollow” in the mountains, fed by a pool or river.103 The population of Camdeboo is 44 371. The municipality’s jurisdiction has an area of 6912 km2.104 The economy is fairly diverse. The working population is found primarily in the community/personal sector (2 109 people), as well as in the agricultural sector (1 962 people), private households (1 725), trade (1 590), construction (642), business (491), and manufacturing (446).105 The following LED projects were listed in the Camdeboo IDP:106
• Business advice centre - Cambedoo • Pottery and arts training centre - Cambedoo • Formulate a tourism development plan - Cambedoo • Establish a cultural village - Cambedoo • Establish an Ostrich show farm – Graaf Reinet • Production of fibber from Agave – Cambedoo • Job creation leaning of streets and river – Aberdeen and Graaf Reinet • Internal loans – Nieu-Bethesda
2.4 Blue Crane Route LM (Somerset East) Blue Crane Route LM is based in Somerset East, but also includes Pearston and Cookhouse. The area is a rich cattle and sheep rearing district. The western part of the municipality is Karoo, but east of Bruintjieshoogte, a much higher rainfall level prevails. The economy of Somerset East is buoyant, with a growing tourism industry, and increasing investment. Unemployment levels are high, and 44% of the population earn no income at all.107 The municipality has a spatial area of 9 471 km2. The population is 35 000. 103 Gaffney’s Local Government in South Africa 2004-6, p. 373. 104 Gaffney’s Local Government in South Africa 2004-6, p. 372. 105 Gaffney’s Local Government in South Africa 2004-6, p. 372. 106 Cambedoo LM IDP Review – 2005/2006 107 Gaffney’s Local Government in South Africa 2004-6, p. 371.

Arid Areas Report Volume 1: District Socio-economic Profile and Development Plans
Employment is concentrated in the agricultural sector (3 100 people), followed by community and personal services (1 212), private households (1208), trade (536), construction (316), manufacturing (311), and business (192).108 The following projects are listed in the IDP to stimulate economic development, investment, promote job creation and increase tourism:109
• Establish a development agency • Implement Fruit Growing Project • Compile skills database • Integrate and revise the LEDP of Pearston and Somerset East • Implement the LEDP • Introduce by-laws promoting SMME and investment • Continue dialogue to obtain/use vacant under-utilised State owned buildings for
craft centres • Identify and facilitate potential business initiatives • Job creation projects Bestershoek and Bosberg • Continuous dialogue with tourism/business sector • Prepare Marketing Strategy and Incentive Scheme • Promote Biltong Festival on a continuous basis • Lobby with hunting associations to attract foreign hunters and tourists • Dialogue with taxi organisations for Pearston route • Upgrade taxi rank • Upgrade library to computer centre
The Blue Crane Municipality has created a Section 21 company, called the Blue Crane Development Agency (BCDA). It is funded by the IDC. Its brief is to undertake macro projects to develop the area. The BCDA held a Karoo Development Workshop in August 2007, which discussed numerous investment possibilities. According to the IDP Master Plan for the Blue Crane Municipality, the sectors in Pearston that can see growth are agriculture, agriculture related industries and tourism. The idea is to develop a Macro Tourism Project for visitors to the Karoo that links with the development in Somerset East, Cookhouse and Graaff Reinet. The process is currently in the pre-feasibility phase, where unique ideas are being generated. BCDA has a site to develop a tourism centre and want to develop ideas for an indoor experience, outdoor experience and related activities of the proposed centre. The BCDA workshop focused on several aspects which can be promoted economically in the area: 1. Animal life 108 Gaffney’s Local Government in South Africa 2004-6, p. 370. 109 Blue Crane Route LM: IDP Review - 2002

Arid Areas Report Volume 1: District Socio-economic Profile and Development Plans
The area is not a significant area in terms of fauna. Nama Karoo fauna occurs also in Kalahari, all over Karoo and in the highlands. Typical animals include black eagle, grey winged franklin, springbok, steenbok, anteating chat, vervets, black shouldered kite, ground squirrels, dassies. Not so typical are baboons, rock monitors, buffalos, red hartebeest. Most animals are burrowers and or nocturnal. Unusual animals are the ground woodpecker, orange throated long claw, and otters. There are nay different species of birds e.g. larks, secretary bird, cori bustards, and kestrels. The discussion group decided to focus on springbok, meerkats, porcupine, otters, birds, and insects. Ideas included:
• Recreate springbok migrations. • Include sounds and details in indoor displays, • Create burrow system in hill to depict animal burrowers (meerkats, termites etc).
Use real koppie that can have an outside garden and display and inside burrowed out.
• Focus on insect displays e.g. close encounter with red romans (experiential aspect), promote the “Big Five” of insects.
• Build an indoor gogga trail. • Recreate locust swarms. • Falconry experience. • Reintroduce Cape Vultures (need a very big site but this is excellent area) • Experiential room to create birds’ eye view, bird sounds, stream with otter, etc.
springbok migration on a moving wall, cycle of life crawl through, • Interactive centre include webcams at nest and burrows. Have interactive
website to post sightings of animals in the area. • Part of reserve should include a focus on plains of the Camdeboo / Karoo, with
plains game. Night drives on donkey cart or non-motorised transport, or hikes. 2. Botany It is important to look at details, because the overall landscape bleak. “The best way to explore the Karoo is on your knees”. The sunrise and sunset offer better opportunities than mid-day. Ideas for investment include:
• Indoor garden / forest with lowered walkways - including insects, changes with seasons
• Indigenous nursery with potted plants for sale • Have display and field trips around edible or aromatic plants. • Us a koppie to develop sectors with aromatic, edible, succulent section,
insectivorous plants, dye plants (for fabric dyeing), fibre plants, and trees such as witgat, geel granaat and acacia Karoo.
• Nama Karoo botanical garden on the plains of the Camdeboo.

Arid Areas Report Volume 1: District Socio-economic Profile and Development Plans
• Displays should include stories about plants and their uses, about animals using plant for medicines, about survival strategies of plants in arid areas.
• Display could include time lapse photography of life cycles, response to drought, seasonal changes, plant successions.
• Include a Karoo Spa – where Karoo herbs used as an addition to the Somerset East Spa experience.
• Experiential room with climatic extremes to give idea of survival strategies needed.
• Focus on school groups and farmers for training sessions link to Boschberg (Somerset East ) education centre.
• Interactive website where people can post photographs of plants and their uses • Cave displays, together with a botanical garden outside the cave. 3. Cultural history The Khoisan stone age people, British, trek boers and Xhosa met in this area in many bloody conflicts. The result was the genocide of the Khoisan. The wagon route from the Cape to the East Coast passed here over Bruintjieshoogte. Slavery was also rife in this area. Between 1723–1783, there were more slaves than free men. This part of the Karoo is the centre where many of the cultures clashed. Ideas include:
• Establish a school of raconteurs, to tell oral history and stories of the history, of people and plants and people and animals in the area. Record life stories of locals. Perhaps a storytelling festival could be based here.
• Could have life stories of all the participants in the project on display. This would give a good idea of the diversity of the experiences of local s and would also personalize the contact with people at the centre who act as guides, waiters and other staff. It is important to do life stories before project starts.
• Interactive web site where people can post snippets of their history and of the history of the area. Could make a DVD of life stories.
• Could have a timeline display of history of area and its people including the 100 000 years.
4. Activities in general Ideas included:
• Accommodation could include a backpackers, 4-star and veld accommodation in the form of cave, trekboer grass hut or corbelled stone hut
• It would be important would have evening activities – restaurant for star gazing, night drives – to veld accommodation,
• Could develop an ox wagon that follows the trail over Bruintjieshoogte. • Hiking trails

Arid Areas Report Volume 1: District Socio-economic Profile and Development Plans
• Farm to farm walks or donkey cart trips • Crafts • The project could be marketed as part of the Karoo Heartland Tourism
Association; tour operators, speciality groups will be contacted directly. • A partnership with the Wilderness Foundation in order to develop the Centre
in a reserve will be pursued. • A central icon still needs to be found – something that denotes the plains of
the Camdeboo.
2.5 Ikwezi LM (Jansenville) Ikwezi includes Jansenville, on the banks of the Sunday’s River, as well as the remote railway town of Klipplaat. “Ikwezi” means “morning star” in isiXhosa.110 Ikwezi is situated in the “ noorsveld”, an area of the Karoo named for the spiky Euphorbia plants which is sometimes fed to sheep and goats in times of drought. The main products are wool and mohair. The Jansenville district is well knownfor its fine angora stud farms. The municipality comprises 4 296 km2, and has a population of 10 368. The population is 69% urban. The mainstay of the economy is agriculture (844 jobs), as well as community/personal activities (308 people), private households (289), trade (162), and construction (54). The following projects are listed in the Ikwezi IDP: 111
• Finalise Local Economic Development Plan 50,000 DEAE&T Community • Prepare funding applications and business plans for local economic plans • Brickmaking • Klipplaat poultry • 24-Hour petrol filling station (Jansenville) • Klipplaat filling station • Art gallery in Town Hall • Delportsrivier farm top-up • Delportsrivier farm upgrading – implement of infrastructure & livestock • Delportsrivier land acquisition • Klipplaat Bakery • Tourism Project Hotel • Shoe factory.
110 Gaffney’s Local Government in South Africa 2004-6, p. 374. 111 Ikwezi LM IDP Review: October 2003

Arid Areas Report Volume 1: District Socio-economic Profile and Development Plans
3. Pixley ka Seme District Pixley ka Seme is a vast area in the northern Karoo, bordered by the Orange River. This DM lies in the south-east of the Northern Cape province and shares its borders with three other provinces – the Free State to the north-east, the Eastern Cape to the south-east, and the Western Cape to the south-west. It has a total surface area of 102 727 km2, and comprises 28% of the land surface of the Northern Cape112. It comprises eight local municipalities:
Table 17: Municipalities and Towns of Pixley ka Seme District
Local Municipality Main towns Emthanjeni LM De Aar, Britstown, Hanover Kareeberg LM Carnarvon, Vosburg, Vanwyksvlei Renosterberg LM Philipstown, Petrusville Siyancuma LM Douglas, Griewastad, Campbell SiyaThemba LM Prieska, Marydale Thembelihle LM Hopetown, Strydenburg Ubuntu LM Victoria West, Loxton Umsobomvu LM Colesberg, Noupoort, Norval’s Pont District Management Area Rural area between Griewastad and Groblershoop
The headquarters of the municipality is based in De Aar. The area is traversed by six national routes, including the N1 and N12 (both of which link Gauteng with Cape Town); and the N9 and N10 link Namibia and Gauteng with Port Elizabeth. The railway network around De Aar is one of the largest in South Africa. Unemployment and poverty levels are high:
Table 18: Urban population, poverty, by District municipality in the Northern Cape113 District Municipality
Population % urban
% Proportion unemployed
%House-holds living in poverty
% with no schooling
Contribution to provincial GDP114
Pixley ka Seme (Karoo)
164 603 60.8 37 43.5 26.1 10 %
Provincial trends
35.6 42% 19.2% 100 %
112 Pixley ka Seme DM, District Growth and Development Strategy, 2007/8 to 2009/10, p. 6. 113 SA Institute of Race Relations, Fast Facts, February 2006. 114 Address by MEC for Finance and Economic Affairs, Economic Affairs budget vote, 22 June 2006.

Arid Areas Report Volume 1: District Socio-economic Profile and Development Plans
The population growth rate in Pixley ka Seme DM, between 1996-2001, was negative. Population declined from 176 293 in 1996 to 164 620 in 2001.115 Nevertheless, there was a growth in the number of households of 2.49% during this period. In 2005/6, there was a total of 31 726 indigent households in Pixley ka Seme District, which amounted to 42% of all households.116 This indicates the level of poverty in the district. Nevertheless, the HIV/AIDS prevalence rate is 14.4% in Pixley ka Seme District, well below the South African prevalence rate of 24.5%.117 Pixley ka Seme District has a total population of 164 651.118 The key strengths of Pixley ka Seme’s economy are community services, agriculture, transport and tourism. The towns function primarily as agricultural service centres. This area is the largest wool producer in the country and has a long history of sheep farming. Unfortunately most of the beneficiation is undertaken in the Eastern Cape.119 Most of the agricultural economy consists of extensive farming (sheep and goats), as well as a growing number of game farming operations. However, there is intensive agriculture along the Orange Riet Canal System, along the upper Orange River (Colesberg-Hopetown area), and along the middle Orange River area. Consequently, the following areas have been identified as developmental nodal points: Colesberg, De Aar, the Orange River (mainly irrigation farming and alluvial diamond mining), and the Gariep Dam (inter-provincial tourism marketing of the region).120 There is a growing trend towards game farming. Tourism in the district is strengthened by several government-owned projects, such as the Rolfontein Outdoor Wildnerness School, and the re-development of several resorts and facilities (the Wildebeest Kuil Rock Art Centre, the Boesmansgat Resort, the Douglas Holiday Resort, and Die Bos Resort in Prieska).121 Environmental parks and sites can be found at the following locations:122
• Carnarvon: Tortoise Reserve • Vanwyksvlei: Nature reserve • Vanderkloof: Rolfontein Nature Reserve • Campbell: Aloe Nature Reserve • Douglas: Confluence of the Vaal and Orange Rivers • Schmidtsdrift: New game ranch is being developed by DEAT • Prieska: Die Bos Nature Reserve
115 Pixley ka Seme DM, Spatial Development Framework (draft version), August 2007, p. 17. 116 Pixley ka Seme DM, Spatial Development Framework (draft version), August 2007, p. 20. 117 Pixley ka Seme DM, Spatial Development Framework (draft version), August 2007, p. 17. 118 Gaffney’s Local Government in South Africa 2004-6, p. 840. 119 Gaffney’s Local Government in South Africa 2004-6,. 840-841 120 Pixley ka Seme DM, Spatial Development Framework (draft version), August 2007, p. 11. 121 Pixley ka Seme DM, Spatial Development Framework (draft version), September 2007, p. 58. 122 Pixley ka Seme DM, Spatial Development Framework (draft version), September 2007
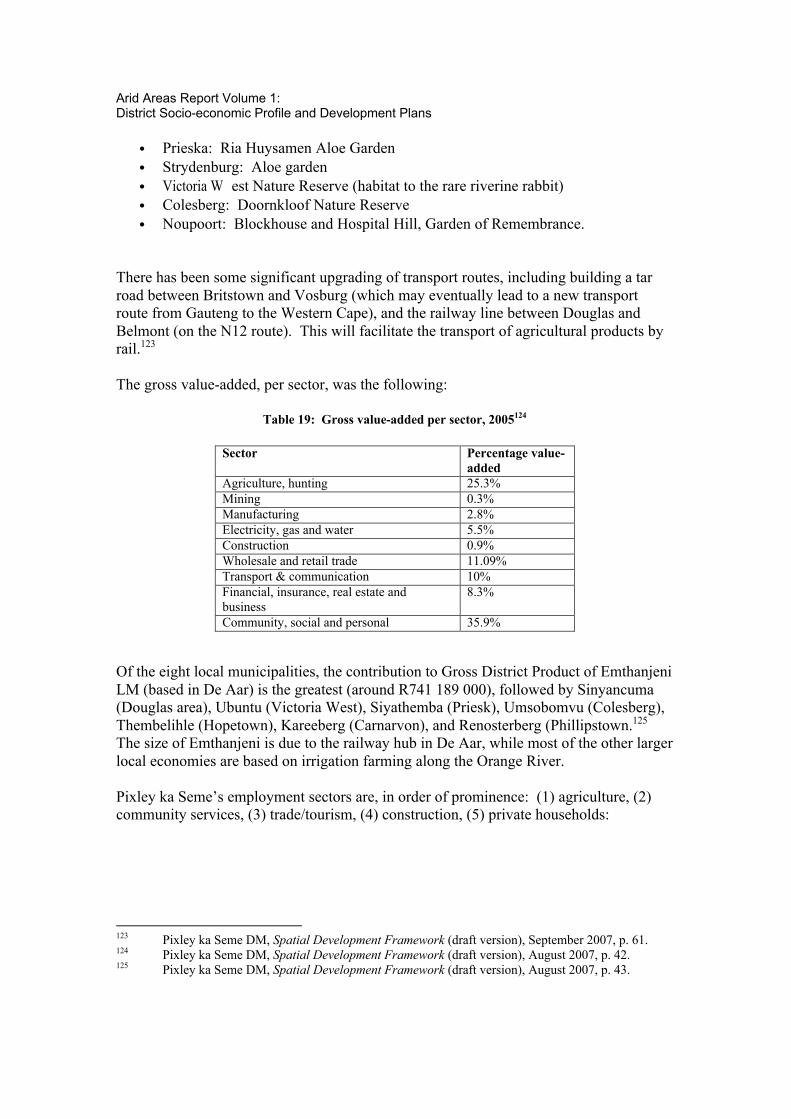
Arid Areas Report Volume 1: District Socio-economic Profile and Development Plans
• Prieska: Ria Huysamen Aloe Garden • Strydenburg: Aloe garden • Victoria W est Nature Reserve (habitat to the rare riverine rabbit) • Colesberg: Doornkloof Nature Reserve • Noupoort: Blockhouse and Hospital Hill, Garden of Remembrance.
There has been some significant upgrading of transport routes, including building a tar road between Britstown and Vosburg (which may eventually lead to a new transport route from Gauteng to the Western Cape), and the railway line between Douglas and Belmont (on the N12 route). This will facilitate the transport of agricultural products by rail.123 The gross value-added, per sector, was the following:
Table 19: Gross value-added per sector, 2005124
Sector Percentage value-added
Agriculture, hunting 25.3% Mining 0.3% Manufacturing 2.8% Electricity, gas and water 5.5% Construction 0.9% Wholesale and retail trade 11.09% Transport & communication 10% Financial, insurance, real estate and business
8.3%
Community, social and personal 35.9% Of the eight local municipalities, the contribution to Gross District Product of Emthanjeni LM (based in De Aar) is the greatest (around R741 189 000), followed by Sinyancuma (Douglas area), Ubuntu (Victoria West), Siyathemba (Priesk), Umsobomvu (Colesberg), Thembelihle (Hopetown), Kareeberg (Carnarvon), and Renosterberg (Phillipstown.125 The size of Emthanjeni is due to the railway hub in De Aar, while most of the other larger local economies are based on irrigation farming along the Orange River. Pixley ka Seme’s employment sectors are, in order of prominence: (1) agriculture, (2) community services, (3) trade/tourism, (4) construction, (5) private households: 123 Pixley ka Seme DM, Spatial Development Framework (draft version), September 2007, p. 61. 124 Pixley ka Seme DM, Spatial Development Framework (draft version), August 2007, p. 42. 125 Pixley ka Seme DM, Spatial Development Framework (draft version), August 2007, p. 43.

Arid Areas Report Volume 1: District Socio-economic Profile and Development Plans
Table 20: Employment by sector in Pixley ka Seme District
Sector Number of jobs Mining and quarrying 724 Manufacturing 1230 Electricity; gas and water supply 280 Construction 1456 Wholesale and retail trade; repairs, hotels and restaurants 4069 Transport, storage and communication 997 Financial intermediation; insurance; real estate and business services 1359 Community; social and personal services 6534 Private households 5525 Other and not adequately defined 6 Undetermined 2983
According to the Pixley ka Seme District Growth and Development Strategy126, there are several new economic initiatives being considered:
1. Diamonds in the Orange River 2. Tiger’s eye deposits (which are unique to the Northern Cape), conducive to
small-scale mining, including cutting, polishing and jewellery manufacturing 3. Uranium mining in a belt stretching from Loxton to Hutchinson, Hanover and
Colesberg 4. Salt pans between Hopetown and Brandvlei 5. Commercialisation of goats (32 goat co-operatives have been established) 6. Agro-processing: Wine cellars, tanning of skins and hides, frozen vegetables,
animal feeds, meat processing (biltong) and cold meats, vegetable juices, infants feed (from soya), cereals, nuts, bio-fuels and wool processing
7. New agricultural products: Soya beans, pistacios, fish farming 8. Transport sector: Rejuvenation of the De Aar railway junction, and
construction of a heliostat (concentrated solar power) 9. Land reform, including the provision of water rights to new irrigation farmers
under the Orange River Emerging Farmers Settlement Programme (OREFSP), and promoting extension services
10. Improved tele-communications, including fibre optic, broadband and wireless networks.
11. SMME development: Identification of projects and opportunities, funding, capacity-building (training and mentoring), marketing, networking, developing technology and innovation centres, hives and incubators
12. Revitalisation of the De Aar railway hub, in accordance with ASGISA and Transnet proposals to boost rail transport; this could include trailer manufacturing, supply of engineering inputs, and heavy equipment supplies.
126 Pixley ka Seme District Municipality, District Growth and Development Strategy, 2007/8 to
2012/13.

Arid Areas Report Volume 1: District Socio-economic Profile and Development Plans
13. Educational tourism (thematic products and routes), adventure tourism (4x4, hiking, hunting), and corporate tourism (conferences, team building and strategic getaways)
14. Promoting retail and wholesale development. The tourism sector in the district contributes 15.6% to the provincial district gross value-added.127 There is also huge untapped tourism potential. For example, there are San rock art sites and fossil sites in various locations128, and Boer war sites are also found at many sites.129 Several major initiatives are being undertaken, including the re-development of the Douglas Holiday Resort and Die Bos Resort in Prieska, and the Lake !Gariep initiative at the Gariep Dam.
3.1 Emthanjeni Local Municipality (De Aar) Emthanjeni Municipality is based in De Aar, and also includes Britstown and Hanover. “Emthanjeni” means “vein” – the underground water source on which the town depends.130 The municipality includes an area of 11 388 km2. It has a population of 35 549, which is 88% urbanised. Although the Smartt Syndicate Irrigation Scheme provides water to lucerne and wheat farmers, water might prove to be a limiting factor in De Aar’s growth. Already its 68 boreholes have to be supplemented with additional sources of supply.131 The economy of Emthanjeni is based on government services, although sheep farming, and the two main highways (N1 and N12), also contribute to the economy. The largest 127 Pixley ka Seme DM, Spatial Development Framework (draft version), August 2007, p. 58. 128 Pixley ka Seme DM, Spatial Development Framework (draft version), September 2007. These
sites are at: East of Britstown (farm Nooitgedacht) and west of De Aar; West of Vanwyksvlei and east of Carnarvon (farm Springbokoog); Petrusville (farm Kraaibosch); Philipstown (farms Kareepoort, Olievenfontein, Rooipoort, Somerius and Waschbank); Campbell: Khoisan Cliff Shelter; Douglas: About 3 000 rock engravings and petroglyphs spread over a large area of glacial pavement in the Riet River bed; Prieska (farms Kleindoring, Omdraaisvlei, Uitdraai and Wonderdraai); Prieska: Schumann Rock collection; Hopetown (farms Kareekloof and Sandbult); Richmond (fossil footprints and bat cave – Aulacephalodon 250 million years ago).
129 Pixley ka Seme DM, Spatial Development Framework (draft version), September 2007. These
include: De Aar: Garden of Remembrance, honoring British soldiers killed in the War; Carnarvon: Boer War Fort; Petrusville: Trenches and stone defences; Campbell: Fabersput Battlefield and Linksfontein; Prieska: Fort built by British, using tiger’s eye stones; memorial garden for British soldiers killed in the war; Hopetown: Battle for Belmont on N12 Battlefield Route; Hopetown: Concentration Camp Cemetery; Richmond: Anglo-Boer war graves at Deelfontein Station; Colesberg: Plateu Camp, Suffolk Hill, Grenadier Guard Rock, Memorial Hill and Military cemetery; Norvalspont: Prisoner-of-war camp and cemetery
130 Gaffney’s Local Government in South Africa 2004-6, p. 841. 131 Gaffney’s Local Government in South Africa 2004-6, 841.

Arid Areas Report Volume 1: District Socio-economic Profile and Development Plans
employment category is community and personal services (1 987 people), and thereafter private households (1 304 people), trade (1221), agriculture (1 046), transport (374), manufacturing (342) and construction (254).132 De Aar used to be a major railway hub. The railway sector has declined greatly during the last ten years, which has led to widespread unemployment. There are current attempts to rejuvenate the rail hub.
Table 21: Employment in Emthanjeni
Employment status Number of people Employed 7449 Unemployed 5169 Not economically active 9723
The IDP identifies the following economic projects:
• The development of Sedibeng cherry farm • Development of a filling station in Britstown • Development of arts and crafts stalls along the N1 at Hanover • Fruit and vegetable gardens • Community driven hawking – mobile farm shops for farm workers • Development of a training centre for the handicapped in Hanover • Dry cleaning project • Ostrich abattoir in De Aar • Lucerne project at sewerage site in De Aar • Developing existing quarry site in De Aar for brickmaking • Leather tannery and wool-washing works in De Aar • Khaki-bos oil project in De Aar • Chemical manufacturing (household) in De Aar • Chicken project at Bellary Farm (De Aar) • N10 ‘corridor development’ entailing servicing of business sites in Rantsig and
the creation of a ‘business cluster point’ • A Development Economic Summit to identify ‘nodal points for economic
development’ • Building of public chalets in De Aar • The manufacture of toilet paper and nappies • Upgrading of Britstown caravan park • Upgrading of Trappieskop hiking trail for tourists • Caravan park and nature reserve at Hanover • Establish Business Advice Centre in De Aar.133
132 Gaffney’s Local Government in South Africa 2004-6, p. 842. 133 Emthanjeni IDP Projects.

Arid Areas Report Volume 1: District Socio-economic Profile and Development Plans
Umsobomvu Local Municipality (Colesberg) Umsobomvu is headquartered at Colesberg, some 30km south of the Orange River, and includes the old railway town of Noupoort, and Norvalspont on the river itself. Colesberg, on the N1 linking Cape Town with Johannesburg, is a major stopover location for trucks and travelers and has numerous accommodation establishments. The town is rich in history and was distinguished by having an excellent information centre for tourists at its Kemper Museum. Colesberg has some tourism potential, because of its Karoo architecture, but its main street is somewhat blighted by the procession of heavy trucks and pantechnikons that drive through the town. Noupoort is situated on the main road to Port Elizabeth and suffered a serious decline with the demise of rail traffic.134 Umsobomvu’s land surface is 6 429 km2. Its population of 23 640 people is 77% urbanised.135 There is rapid population growth in Colesberg, and out-migration from Noupoort. Umsobomvu has a particularly high rate of HIV infection.136 The economy is largely based on sheep-farming. Agriculture provides the bulk of employment (1 083 jobs), followed by community and personal services (943 jobs), private households (611), construction (238), manufacturing (157), business (127), and transport (122).137
Table 22: Employment profile of Umsobomvu Municipality
Employment status Number of people Employed 4195 Unemployed 4521 Not economically active 5818
The IDP cites the following initiatives:
• Egg-farming in Noupoort • Fish-farming in Norvalspont • Feedlot and feed factory in Colesberg • Tannery in Colesberg • Chicken project • Canned meat project • Wool and craft project
134 Gaffney’s Local Government in South Africa 2004-6, p. 855-857. 135 Gaffney’s Local Government in South Africa 2004-6, p. 855. 136 Gaffney’s Local Government in South Africa 2004-6, p. 857. 137 Gaffney’s Local Government in South Africa 2004-6, p. 855.

Arid Areas Report Volume 1: District Socio-economic Profile and Development Plans
• Noupoort job creation by means of road construction138 Many of these projects do not however appear to have been budgeted for in the latest capital allocations.
Ubuntu Local Municipality (Victoria West) Ubuntu incorporates some 18 towns and settlements. Based in Victoria-West, its other main settlements are Richmond, Loxton, the railway town of Hutchinson, Richmond and Three Sisters where the road from Kimberley meets with the N1 national road. The area is favoured with considerable natural beauty and Karoo charm and the passage of the N1 through its boundaries ought to hold out opportunities for development. Victoria-West is a large agricultural centre with traditional Karoo and Victorian architecture, but it faces an uncertain water supply.139 “Ubuntu” is the Nguni name for “humanity”. The municipality has a surface area of 19 330 km2. Its population of 16 376 is only 21% urbanised, with the majority of its population living in remote Karoo settlements and on farms. The economy is highly based on agriculture, which provides 1 552 jobs, followed by community and personal services (704 jobs), private households (663), trade (337), construction (296) and business (104).140
Table 23: Employment profile of Ubuntu Municipality
Employment status Number of people Employed 4079 Unemployed 2112 Not economically active 3877
The municipality has engaged Stabilis Development (Pty) Ltd to compile an Integrated Economic Development Plan (funded by the DBSA). Projects identified thus far include:
• The rehabilitation of the commonage infrastructure • Garlic and vegetable processing at Loxton • Feasibility study for a wool factory • Determining the mining potential of the district • Researching the possibility of steam safaris • The Apollo (old cinema) development • Establish an art centre
138 Umsobomvu Reviewed IDP 139 Gaffney’s Local Government in South Africa 2004-6, pp. 853-855 140 Gaffney’s Local Government in South Africa 2004-6, p. 854.

Arid Areas Report Volume 1: District Socio-economic Profile and Development Plans
• Upgrade of a school to a training institute • Set up a flea market • Toilet-paper manufacture • Upgrading of the Horse Museum at Richmond • Compilation of a Tourism Development Plan141.
Kareeberg Local Municipality (Carnarvon) Kareeberg consists of the three towns of Van Wyksvlei, Vosburg and Carnarvon with the last mentioned being by far the most important.
Table 24: Employment profile of Kareeberg Municipality
Employment status Number of employees Employed 2246 Unemployed 1254 Not economically active 2164
Van Wyksvlei and Vosburg are disadvantaged by being connected to the outside world only by poor gravel roads. Kareeberg is a vast area, comprising 16 641 km2.142 The population of Kareeber is 9 486, and is 59% urbanised. The population is sparsely distributed – population density is roughly 0.66 per square km. Tourism attractions are limited, but hunting on the area’s game farms is popular.143 The economy is not well diversified, and small stock and game farming predominates. The workforce is concentrated in agriculture (723 people), followed by community and personal services (470), trade (218), business (71) and construction (70).144 Carnarvon is strategically located for the new Square Kilometer Array (SKA) Telescope Project – a state-of-the-art project which will be able to analyse the history of the universe. The site of the project is about 100 km from Carnarvon, and it is expected to have significant tourism consequences. The IDP makes provision for marketing tourism places of interest, the rich cultural heritage in the region, and the hunting trade. The IDP also proposes the east-west railway line running from Victoria West to Calvinia.145
141 Ubuntu IDP March 2005 142 Gaffney’s Local Government in South Africa 2004-6, p. 844. 143 Gaffney’s Local Government in South Africa, 2004-5, pp. 844-845 144 Gaffney’s Local Government in South Africa 2004-6, p. 845. 145 Kareeberg IDP, Capital Project List 2006/7.

Arid Areas Report Volume 1: District Socio-economic Profile and Development Plans
3.5 Siyancuma Local Municipality (Douglas) The Siyancuma region is rich in missionary, Boer War and Griqua history. “ Siyancuma” is a Xhosa word for “we are smiling”.146 It includes the towns of Douglas, Campbell, Griekwastad, and Belmont. The agricultural smallholdings of Bucklands are situated at the confluence of the Orange and Vaal Rivers – a massively overlooked opportunity for tourist development. While Siyancuma’s main towns have adequate road linkages with the Northern Cape’s capital, Kimberley, the smaller settlements are poorly linked to one another and the municipality may be regarded as being highly fragmented. Griekwastad, particularly, is strategically situated on the main road linking Kimberley and Upington.147 The development of the Douglas Holiday Resort, at the confluence of the Orange and Vaal Rivers, is being planned. Siyancuma’s land surface area is 9 285 km2. The population consists of 35 809 people, and the urbanisation rate is 40%. The majority of its population lives in rural areas, in settlements such as Belmont, Bucklands, Campbell, Schmidtsdrif, Plooysburg and Graspan.148 The backbone of the economy is based on cattle farming, paving stone quarrying and mining of diamonds, manganese and lime. The employment profile is therefore fairly diversified: Primarily agriculture (2 918 people employed), followed community and personal services (964), trade (593), mining (332), manufacturing (301), business (242), construction (240) and transport (199).149
Table 25: Employment in Siyancuma
Employment status Number of people Employed 8353 Unemployed 3212 Not economically active 10631
In its IDP the municipality aims to:
• Create one thousand new jobs by 2008 and increase the local growth rate to 3% • Implement a comprehensive LED strategy which entails: • An analysis of economic trends • A marketing plan for the municipality • A website • Cutting down on red-tape • Fostering links with investors
146 Gaffney’s Local Government in South Africa 2004-6, p 848. 147 Gaffney’s Local Government in South Africa 2004-6, p. 848-849. 148 Gaffney’s Local Government in South Africa 2004-6, p. 848. 149 Gaffney’s Local Government in South Africa 2004-6, p. 848.

Arid Areas Report Volume 1: District Socio-economic Profile and Development Plans
• A business database • Special support for local enterprises • Establishing a business advisory network • Promotion of community-based services • Establishing an LED unit • Developing an economic profile and strategy150.
3.6 Siyathemba Local Municipality (Prieska) Siyathemba municipality is based in Prieska and includes the settlements of Marydale, Draghoender, and Niekerkshoop. Prieska is on the N10 highway 123km north-west of Britstown and 164km north of Carnarvon on the R386. Prieska is pleasantly situated on the Doringberg hills, on the southern bank of the Orange River. It has easy access to the main railway line to Namibia, good tarred road connections to Upington, Kimberley and De Aar, two landing strips for light aircraft, and a number of inexpensive industrial stands some with rail siding facilities. The area is known for its high quality semi-precious stones.151 Siyathemba has a land surface area of 9 285 km2. Its population of 35 809 people is 69% urbanised.152 Prieska is known as “ the gem of the Northern Cape”, because of its fertile irrigated fields along the Orange River, and the pleasant urban architecture. Prieska has plenty of water and Eskom power. “Siyathemba” is a Xhosa word for “we believe”. Siyathemba’s economy is based on irrigation agriculture, as well as extensive commercial agriculture in its hinterland. There are some manufacturing enterprises, such as grain silos, a cotton boll mill, a bakery, furniture manufacture, and a tiger’s eye processing plant.153 Employment is fairly diversified across sectors: Mainly agriculture (1 007 jobs), followed by community and personal services (646), community and personal services (646), private households (559), trade (458), construction (181), and business (176).154
Table 26: Employment profile of Siyathemba
Employment status Number of people Employed 3572 Unemployed 2272 Not economically active 4745
150 Siyancuma Local Municipality, Draft IDP 2005-6. 151 Gaffney’s Local Government in South Africa 2004-6, p. 849-851 152 Gaffney’s Local Government in South Africa 2004-6, p. 850. 153 Gaffney’s Local Government in South Africa 2004-6, p. 850. 154 Gaffney’s Local Government in South Africa 2004-6, p 850.

Arid Areas Report Volume 1: District Socio-economic Profile and Development Plans
Siyathemba LM’s LED strategy is focused on developing the economic and natural resources of the area. Its goals are to promote agriculture, industries, marketing of the region, and creating a safe environment for business. The agricultural strategy includes providing for the land needs of PDIs, and empowering farm workers to access farmland. The municipality has appointed Stabilis Development (Pty) Ltd to develop a comprehensive Integrated Economic Development Plan for its area.
The following projects are contemplated:
• Upgrading of hawkers and taxi rank in Prieska • Address poverty by launching community food gardens • Developed the area called “Die Bos” to increase its Tourism potential - building
four new guest houses (2 in Prieska, one in Marydale, one in Niekerkshoop) • Establishing of Fish Farming projects. • Erection of Mineral Water bottling plant at Niekerkshoop • Diamond Development • A Tiger Eye mining development • Identify Agriculture Development Opportunities • Develop a BEE/SMME Strategy • Upgrade tourism info centre in Prieska. • Upgrading of Leibrandt Eiland and develop a view site at Wonderdraai. • Develop a marketing and communication strategy • Tannery and Leather Project in Prieska. • Develop Maize and Wheat processing plant in Prieska • Access to Land for Agriculture Purposes. • Set up a program to Improve Knowledge of the Natural and Cultural assets. • To encourage basic adult education program and provide distance learning
opportunities such as further education and training • Create an access strategy for the LED opportunities in Siyathemba.
Training and Literacy.
3.7 Rhenosterberg Local Municipality (Petrusville) Renosterberg encompasses Vanderkloof, Philipstown and Petrusville. Vanderkloof was the youngest municipality in the province and is situated on the Vanderkloof Dam making it a viable proposition for tourism development. As might be expected, water service levels are generally high giving this municipality an advantage over its southern neighbours. The municipality also stands to gain from the number of game park developments that are said to be in the pipeline for the stretch of the Orange River between the Vanderkloof and Gariep Dams.155
155 Gaffney’s Local Government in South Africa 2004-6, p 846-847.

Arid Areas Report Volume 1: District Socio-economic Profile and Development Plans
Rhenosterberg encompasses a spatial area of 5 180 km2, and the population total is 9 069. The population is 68% urbanised. There is consistent migration from the farms to the towns. The economy is not well diversified. Employment is concentrated in agriculture (795 people), followed by community and personal services (335), trade (164), construction (52), transport (35) and manufacturing (31).156
Table 27: Employment in Rhenosterberg
Employment status Number of people Employed 1837 Unemployed 1761 Not economically active 1945
The IDP identifies the following economic activities as priorities:
• Brick-making (a similar LED project in Philipstown collapsed) • Investigate the feasibility of converting Philipstown’s failed ‘beehive’ complex
into overnight accommodation units. • Promote the leisure activities of fishing and boating on the Vanderkloof Dam • The biggest tourism attraction is local hunting and ways should be found to
promote this further. • Better use of the dam’s fish resources • The production and marketing of wildlife by-products • Land will be made available at a minimal cost to attract start-up businesses.157
3.8 Thembelihle Local Municipality (Hopetown) Thembelihle incorporates Hopetown and Orania on the banks of the Orange River and Strydenburg to the south-west of Hopetown. Hopetown, where the municipality is based, is 120km south of Kimberley on the N12 highway. Orania is an interesting, and by all accounts extremely successful, experiment in ‘self determination’; it is the intended capital of the putative Afrikaner Volkstaat. “Thembelihle” means “good hope”.158 Hopetown is a centre of irrigation farming. The municipality has made little progress in exploiting its tourism potential. There is some white water rafting on the Orange River and Orania has been innovative in exploiting the possibilities held out by passing trade on the road linking Hopetown with Vanderkloof.159
156 Gaffney’s Local Government in South Africa 2004-6, p. 846. 157 Renosterberg IDP. 158 Gaffney’s Local Government in South Africa 2004-6, p. 851. 159 Gaffney’s Local Government in South Africa 2004-6, pp. 851-853

Arid Areas Report Volume 1: District Socio-economic Profile and Development Plans
The municipality has a surface area of 6 508 km2. Its population of 13 986 people is 71% urbanised. The economy is mainly based on agriculture (1 445 jobs), followed by private households (494 people), community and personal services (440 people), trade (367), manufacturing (166), business (153) and construction (125).160
Table 28: Employment profile in Thembelihle
Employment status Number of people Employed 3509 Unemployed 1114 Not economically active 4050
In its IDP the municipality aims to:
• Develop smallholdings along the Orange River for small-scale farming • Develop 2000ha of commonage for small-scale irrigation farming • Secure DBSA funding to perform an LED study • Upgrade the N12 highway where it passes through the town with improved
signage etc.161
160 Gaffney’s Local Government in South Africa 2004-6, p. 852. 161 Thembelihle Project Logframe 2006/7

Arid Areas Report Volume 1: District Socio-economic Profile and Development Plans
4. Oudtshoorn Local Municipality (Eden District) Oudtshoorn Local Municipality consists of three main towns: Oudtshoorn, de Rust and Dysselsdorp, as well as numerous small rural settlements. Oudtshoorn is located 60 km north of George, and 94 km north-east of Mossel Bay. The Local Municipality falls in the Little Karoo area, and should therefore be considered as a part of the arid areas of South Africa. The jurisdiction of Oudtshoorn Municipality comprises 3 435 km2. The population of 84 692 people is 83% urbanised.162 The population of Oudtshoorn Municipality is increasing, as is the number of urban and rural households:163
Table 29: Population and households in Kannaland Municipality, 1996 and 2001
1996 2001 Population 78 846 84 692 Households 15 734 18 125 Urban households 12 977 14 896 Rural households 2 757 3 229
Population growth in the period 1996-2001 was 7.14%. Urban population grew by 14.79%, and the rural population grew by 17.12%, which is a surprisingly large figure. Educational levels are fairly high. A fairly high percentage (30%) attended some primary education, while 38% completed some secondary education. Only 10% had no schooling. 12% had achieved Grade 12, while 4% of the population had some tertiary education.164 Oudtshoorn is a significant educational centre, with 15 primary schools and six secondary schools, a technical college, and satellite campuses of UNISA and Technikon SA. The economy is dependent on ostrich farming. The tourism industry is growing, albeit slowly, and centres on the Swartberg Summit Cableway, the Swartberg Game Reserve, the Cango Caves, and a wine route. The annual Klein Karoo National Arts Festival contributes to income generation.165 Oudtshoorn’s economy is fairly diversified. Community and personal services is the most important sector (5 028 jobs), followed by agriculture (3 875 jobs), trade (3 056), 162 Gaffney’s Local Government in South Africa 2004-6, p. 991. 163 Eden IDP Review, 2005, no page numbers. 164 Oudtshoorn Local Municipality, IDP, 2005/6, p. 8. 165 Gaffneys, Local Government in South Africa 2004-2006, p. 993.

Arid Areas Report Volume 1: District Socio-economic Profile and Development Plans
manufacturing (1 725), private households (1 677), construction (1052), business (1 032), and transport (481).166 While Oudtshoorn’s economy is fairly buoyant, unemployment still stands at 34%.167 In 2001, Oudtshoorn had 20 558 employed workers, 20 462 unemployed workers, and 446 seasonal workers.168 The main sector which contributed to the local economy is Social Services (government), at 24%, followed by agriculture at 19%. Other significant sectors are trade (15%), manufacturing (8%) and construction (6%).169 Employment by industry is as follows:
Table 30: Employment in Oudsthoorn Local Municipality, 2001170
Sector People employed Agriculture 3 875 Community/social/personal services 5 028 Construction 1 052 Electricity/gas/water 77 Financial/insurance/business 1 032 Manufacturing 1 725 Mining 25 Private households 1 677 Transport/communications 481 Undetermined 2 529 Wholesale/retail 3 056
166 Gaffneys, Local Government in South Africa 2004-2006, p. 992. 167 Oudtshoorn Local Municipality, IDP,2005/6, p. 8. 168 J. Boulle, Jobs for Growth Mapping Study, 2006, unpublished report for ASGISA, p. 17. 169 Oudtshoorn Local Municipality, IDP, 2005/6, p. 8. 170 Gaffneys, Local Government in South Africa 2004-2006, p. 991
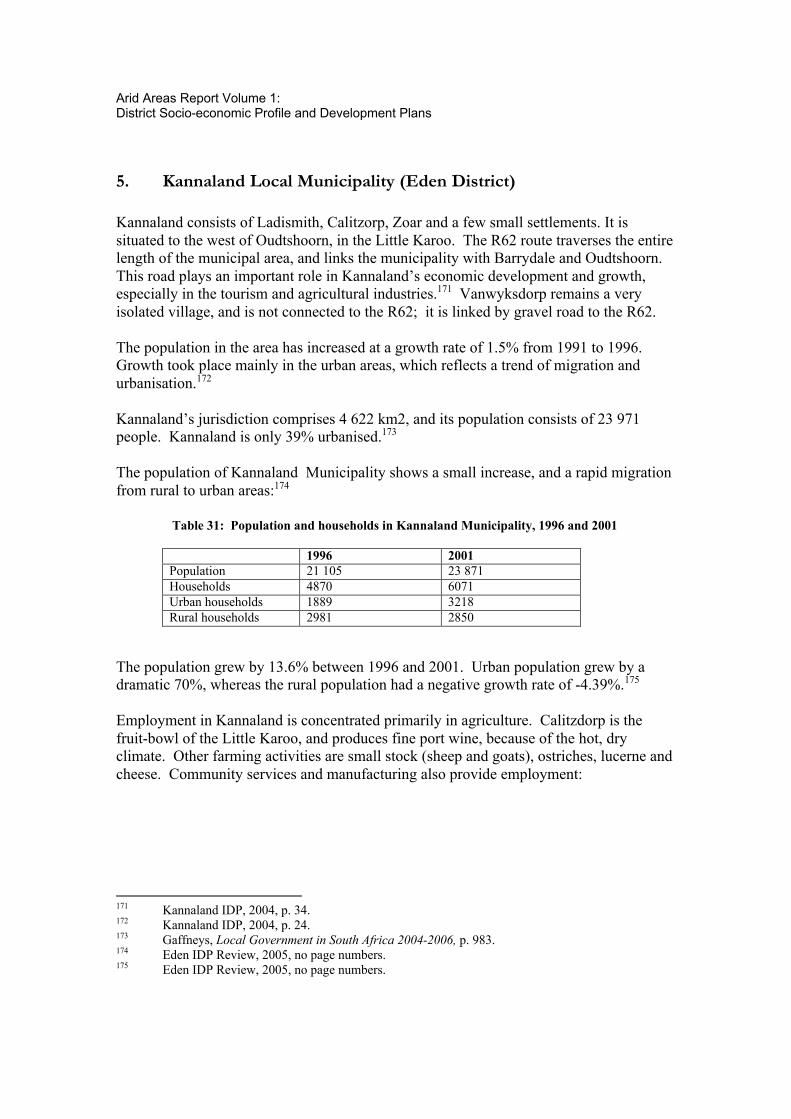
Arid Areas Report Volume 1: District Socio-economic Profile and Development Plans
5. Kannaland Local Municipality (Eden District) Kannaland consists of Ladismith, Calitzorp, Zoar and a few small settlements. It is situated to the west of Oudtshoorn, in the Little Karoo. The R62 route traverses the entire length of the municipal area, and links the municipality with Barrydale and Oudtshoorn. This road plays an important role in Kannaland’s economic development and growth, especially in the tourism and agricultural industries.171 Vanwyksdorp remains a very isolated village, and is not connected to the R62; it is linked by gravel road to the R62. The population in the area has increased at a growth rate of 1.5% from 1991 to 1996. Growth took place mainly in the urban areas, which reflects a trend of migration and urbanisation.172 Kannaland’s jurisdiction comprises 4 622 km2, and its population consists of 23 971 people. Kannaland is only 39% urbanised.173 The population of Kannaland Municipality shows a small increase, and a rapid migration from rural to urban areas:174
Table 31: Population and households in Kannaland Municipality, 1996 and 2001
1996 2001 Population 21 105 23 871 Households 4870 6071 Urban households 1889 3218 Rural households 2981 2850
The population grew by 13.6% between 1996 and 2001. Urban population grew by a dramatic 70%, whereas the rural population had a negative growth rate of -4.39%.175 Employment in Kannaland is concentrated primarily in agriculture. Calitzdorp is the fruit-bowl of the Little Karoo, and produces fine port wine, because of the hot, dry climate. Other farming activities are small stock (sheep and goats), ostriches, lucerne and cheese. Community services and manufacturing also provide employment:
171 Kannaland IDP, 2004, p. 34. 172 Kannaland IDP, 2004, p. 24. 173 Gaffneys, Local Government in South Africa 2004-2006, p. 983. 174 Eden IDP Review, 2005, no page numbers. 175 Eden IDP Review, 2005, no page numbers.

Arid Areas Report Volume 1: District Socio-economic Profile and Development Plans
Table 32: Employment in Kannaland Local Municipality, 2001176
Sector People employed Agriculture 3 364 Community/social/personal services 784 Construction 193 Electricity/gas/water 32 Financial/insurance/business 143 Manufacturing 457 Mining - Private households 345 Transport/communications 66 Undetermined 401 Wholesale/retail 522
Unemployment rates are as follows:177
• 17.2% in Ladismith • 23.9% in Calitzdorp • 32.9% in Zoar • 6.1% in Vanwyksdorp.
Income levels are generally low. In Ladismith, 65% of the population earns less than R1 500 per month; in Calitzdorp, it rises to 87 %.178
176 Gaffneys, Local Government in South Africa 2004-2006, p. 983. 177 Kannaland IDP, 2004, p. 28. 178 Kannaland IDP, 2004, p. 26.

Arid Areas Report Volume 1: District Socio-economic Profile and Development Plans
6. Xhariep District The Free State is divided into five districts. Xhariep District in the south is largely arid, and in particular, this includes two of the local municipalities – Letsemeng and Kopanong. These two municipalities are the two in the Free State with the lowest rainfall.179 The Xhariep District is an extensive farming area in the southern parts of the region and borders to the Eastern Cape Province. The area is also regarded as one of the most scenic areas in the country with a large tourism potential due to the unique topography, vegetation, wildlife and availability of water.
Table 33: Key indicators for Xhariep District180
District Municipality Population % urban
% Proportion unemployed
%House-holds living in poverty
% with no schooling
Xhariep 135 248 66.6 % 35.3% 50.0% 22.7% Provincial
trends 43.0% 49.1% 16 %
The Free State can be divided into the following settlement types: cities, regional towns, middle-order towns, small towns.181 The small towns have been growing at a rate of 8.9% per annum during the decade 1991-2001. Neither Xhariep District nor Kopanong and Letsemeng Local Municipalities have any settlements that can be classified as cities, regional towns or middle-order towns. All the settlements can thus be categorised as small towns. Nearly one–quarter of all the small towns in the Free State are located in Letsemeng / Kopanong and nearly 30% in Xhariep.
Table 34: Population growth per district in the Free State, 1996 and 2001182
District
1996 2001 Growth or decline in real
numbers Annual growth
rate, 1996 - 2001 N % N % Xhariep 123341 4.7 135245 5.0 11904 1.9 Free State 2633503 100 2706771 100 73268 0.6 South Africa 40583570 100 44819780 100 4236210 2.0
179 The average annual rainfall for Letsemeng is estimated at 458mm, and for Kopanong at 508mm. 180 South African Institute of Race Relations, Fast Facts, No. 2, February 2006. 181 It should be noted that this definition is Free State – specific and that national definitions exist which will probably result in more than 90% of all settlements in the Free State being classified as small towns. 182 Free State Provincial Government, Free State Growth and Development Strategy, Bloemfontein,
2006.

Arid Areas Report Volume 1: District Socio-economic Profile and Development Plans
Xhariep District had about 5% of the Free State’s population in 2001. This figure is somewhat higher than the percentage of 4.7% in 1996. The population growth rates in Xhariep, Letsemeng and Kopanong were higher than the rate for the Free State for the period 1996 - 2001. It is not clear what caused this increase – was it due to in-migration, return of migrants, or higher birth rates. Nevertheless, these increases in the rural populations were significantly smaller than in the urban areas. This can probably be ascribed to the fact that the agricultural economy is far less dependent on intensive agricultural practice than in the north of the province. Essentially, agricultural production was small in scale and low in intensity (except for Jacobsdal), but less vulnerable to price shifts and international competition. This significant increase in the urban population increased the pressure on municipalities to provide stands, housing and infrastructure in these smaller towns. What is more important is that the increase in people in the urban areas also increased the pressure on water sources and water management. This is an important aspect to bear in mind given the water scarcity in arid areas. The percentage of economic active people (those between 15 and 60 years of age) in Xhariep (57.7% in 1996 and 59.9% in 2001) is lower than the average in the Free State. This is probably an indication of the fact economic opportunities are limited and that a significant percentage of people are actually working elsewhere, leaving the children and aged in Xhariep. Xhariep has a large percentage of people in the 60+ category. Yet, this reality also suggests that the provision of services for elderly people might in fact be an appropriate economic development approach. In terms of the more middle class, these retired or semi-retired people can be attracted to these areas as the cost of living is lower than in larger urban areas. For the poor, an approach which enables the elderly to access old age pensions could be equally appropriate. The following table provides an overview of economic output, measured in terms of GVA (Gross Value-Added) per district, in the Free State.
Table 35: GVA of Xhariep District Municipality183
District
1996 2004 Annual growth rate, 1996 – 2004
GVA (000) %
GVA (000) %
Xhariep 2 159 926 6.6 1 650 082 2.8 Free State 32 774 594 100 58 449 305 100 0.7% South Africa 565 472 968 100 1 230 409 307 100 2.8%
183 Free State Provincial Government, Free State Growth and Development Strategy, Bloemfontein, 2006.

Arid Areas Report Volume 1: District Socio-economic Profile and Development Plans
In 1996 Xhariep contributed 6.6% to the economy of the Free State; by 2004 this proportional contribution had declined to 2.8%. As a proportion of the provincial economy, Xhariep’s economic contribution is dwindling.
Table 36: Percentage contribution of economic sectors in the Free State, Xhariep and Letsemeng / Kopanong, 1990, 1996 and 2004184
Economic Sectors Free State Letsemeng/Kopanong
1996 2005 1996 2005 Agriculture 6.0 5.0 14.4 13.5 Mining 14.4 11.2 15.9 20.6 Manufacturing 11.2 12.6 4.9 4.9 Electricity 3.7 3.3 4.0 4.2 Construction 2.1 1.7 2.3 2.1 Trade 12.3 12.8 14.7 12.4 Transport 8.2 9.7 8.6 8.6 Finance 15.3 18.0 12.1 11.7 Community services 26.7 25.6 23.2 22.2 Total 100.0 100.0 100.0 100.0
The proportional contribution of agriculture in the arid areas of the Free State was significantly larger than in other parts of the province. The proportional contribution of mining was also larger in Letsemeng / Kopanong than in the rest of the Free State. The Koffiefontein diamond mine closed down towards the end of 2005 but reopened in 2007 under a new owner. Yet, the levels of employment at the mine have now decreased considerably. The proportional contribution of manufacturing in the arid areas was markedly remarkably lower than in the rest of the Free State. To a large extent this reflects the difficulty of manufacturing in more remote areas as a result of transport costs. Construction in arid Free State was more or less on a par with the Free State as a whole; in fact, it had a slightly higher proportional contribution than the Free State itself. The same conclusion can be made in respect of electricity. The proportional contributions around trade did not differ much between the Free State and the arid areas. Yet, what is more significant in respect of the arid areas is the fact that the proportional contribution of trade declined considerably. Sectors in Xhariep which had a faster growth rate than the Free State were agriculture, mining, electricity, construction and transport. Sectors in Xhariep which experienced a slower growth rate than the Free State were manufacturing, wholesale and retail, finance and services.
184 Quantec database, 2007

Arid Areas Report Volume 1: District Socio-economic Profile and Development Plans
Table 37: Unemployment profile of Xhariep District Municipality185
District
1996 2004
People unemployed
% of total people
unemployed Unemployment
rate People
unemployed
% of total people
unemployed Unemployment
rate Xhariep 17 160 5.8 26.9 28 301 5.6 34.0
Free State 296 427 100.0 29.9 506 876 100.0 39.1 South Africa 4 627 824 33.9 7 382 156 40.4
The above table indicates that the unemployment rate in Xhariep (34%) was markedly lower than that of the Free State (39.1%). This is also confirmed by the fact that Xhariep had only 5.8% of the unemployed in the Free State compared with 6.6% of the total population. Thus, despite a decline in the overall economy in Xhariep, the district managed to maintain higher levels of access to formal employment and lower levels of unemployment.
Table 38 : A comparison of the proportional share of economic output and employment output per economic sector in the Free State, Xhariep and Letsemeng / Kopanong, 2005186
Economic Sectors Free Sate Xhariep Letsemeng/ Kopanong
Economic contribution
Employment contribution
Economic contribution
Employment contribution
Economic contribution
Employment contribution
Agriculture 5.0 18.3 14.9 40.9 13.5 26.2 Mining 11.2 21.7 16.1 5.6 20.6 1.3 Manufacturing 12.6 8.2 4.4 2.9 4.9 4.5 Electricity 3.3 0.5 3.7 0.7 4.2 1.1 Construction 1.7 3.7 2.1 2.5 2.1 3.4 Trade 12.8 9.5 11.4 8.8 12.4 11.9 Transport 9.7 2.4 13.5 1.1 8.6 1.6 Finance 18.0 5.1 10.8 4.5 11.7 6.1 Community services 25.6 30.5 23.2 33.0 22.2 43.9 Total 100.0 100.0 100.0 100.0 100.0 100.0 From the above table it is evident that:
• Agriculture’s ability to absorb labour is significant. It is even more so in the case of the arid areas of the Free State. For example, in Xhariep, agriculture contributed to 14.9% of the economy but to over 40.9% of the employment in the district. One should however acknowledge that these are usually relatively low–paid employment opportunities.
• The opposite is true of mining. The economic output of mining in Letsemeng / Kopanong was far more (20.6%) than the employment contribution of this sector
185 Free State Provincial Government, Free State Growth and Development Strategy, Bloemfontein, 2006. 186 Quantec database, 2007

Arid Areas Report Volume 1: District Socio-economic Profile and Development Plans
(1.3%). The mining sector has mechanised over the past two decades, and diamond mining (practiced in this area) is less dependent on low-skilled workers and easier to mechanise than, for example, the gold mines.
• The only other sector where the employment contribution was significantly greater than the economic contribution was in community services.
Although sectors which contribute extensively to employment creation are important, it should also be noted that these sectors are the unlikely to contribute to extensive economic growth – except if external factors, such as the availability of water, assist agriculture to become more intensive. Most of the economic sectors experienced a decline in employment. This is not only applicable to the arid areas, but a reflection of the situation in the Free State. The most significant declines have been experienced in the case of employment in mining where an annual decline of more than 10% has been recorded. Construction and transport also witnessed significant declines. Sectors which reflected an increase in employment are wholesale, finance and services. Of all the districts in the Free State, Xhariep District has the highest percentage of people with no schooling (17.5% in 2001) and also the lowest percentage of people with a post – Grade 12 certificate. Although there was an overall increase in the population with a post-Grade 12 certificates in the Free State, the percentage has remained static in Xhariep. This is probably simply an indication that the economy in Xhariep is declining. A more detailed understanding of poverty and development is also required. Table 20 provides an overview of the poverty profile per district.
Table 39: Income profile per district187
District
1996 2004
People living in poverty
% of people
living in poverty
in the FS
% of people living in
poverty of total
population
People living in poverty
% of people living in
poverty in the FS
% of people living in
poverty of total population
Xhariep 66515 6.3 36.1 98 590 5.9 49.5 Free State 1059881 100.0 28.6 1 672 119 -- 55.9
South Africa 17100720 40.5 23500962 49.7 The above table suggests that poverty levels in Xhariep, compared with the Free State, were less problematic. In 2004, the percentage for people living in poverty in Xhariep was 49.5% compared with 55.9% in the Free State. Yet, a significant increase in poverty was noted for Xhariep for the period 1996 – 2004. Two development corridors are also proposed, but very little detail is provided on what is meant by the concept and what it would entail in practice. The one runs in a north-south
187 Free State Provincial Government, Free State Growth and Development Strategy, Bloemfontein,
2006

Arid Areas Report Volume 1: District Socio-economic Profile and Development Plans
direction and links Bloemfontein, Trompsburg, Gariepdam and Colesberg with one another along the N1 route. The second development corridor runs in an easterly to westerly direction and links Zastron, Trompsburg, Jagersfontein, Koffiefontein and Jacobsdal with one another. In addition, two tourism routes were identified. The one is the Horizon Route linking Kimberley with Jacobsdal, Koffiefontein, Fauresmith and Jagersfontein and the second is the Xhariep Route along Gariepdam, Bethulie, Smithfield, Rouxville and Zastron The IDP also reveals the problems of the existing District Municipality. It highlights the need for strategic planning, building organisational capacity, the capacitating of the municipality at work and an emphasis on municipal financial viability.188 A number of economic objectives and strategies are suggested in the Xhariep IDP:
• To improve economic growth by at least a 10% increase annually by 2010. • To support local SMMEs • To facilitate the creation of jobs and employment to effect a 10% reduction in
current unemployment by 2008 • To contribute to the reduction of levels of poverty in the district. • To help to bring about a 5% increase in the contribution of the Tourism sector to
the district GGP by 2008. Although these targets are probably not achievable, they suggest significant aspirations.
6.1 Kopanong Municipality (Trompsburg) The municipality of Kopanong consists of the following towns: Trompsburg (the municipal headquarters), Edenburg, Philippolis, Fauresmith, Jagersfontein, Bethulie, Gariep Dam, Reddersfontein and Springfontein. The towns are small, with a population of between 3 000-8 000. Kopanong has a spatial area of 14 252 km2. Its population of 55 945 is 74% urbanised.189 Kopanong’s population has increased slightly between 1996-2001:
188 Xhariep District Municipality, Integrated Development Plan, 2006 to 2011, Trompsburg, 2006 189 Gaffneys, Local Government in South Africa 2004-2006, p. 492.

Arid Areas Report Volume 1: District Socio-economic Profile and Development Plans
Table 40: Population growth per district in the Free State, 1996 and 2001190
District
1996 2001 Annual growth
rate, 1996 - 2001 N % N % Xhariep 123341 4.7 135245 5.0 1.9 Kopanong 49905 1.8 55954 2.0 2.3 Free State 2633503 100 2706771 100 0.6 South Africa 40583570 100 44819780 100 2.0
The unemployment rate of Kopanong Municipality is 34%, and 40.2% of the population live in poverty. 191
Table 41: Employment in Kopanong, 2001
Employment Status Number of people Employed 12171 Unemployed 7409 Seasonal worker not working presently 277 Does not choose to work 1531
Agriculture is the backbone of the economy, but there is some growth in tourism. Agriculture provides 4 505 jobs, followed by private households (2 639), community and personal services (2 216 jobs), trade (948), construction (312), and transport (204).192 The Municipality has developed a broad strategic framework for local economic development. This framework is also used as the basis for the identification of a range of income generating projects at a local level and the identification and facilitation of investment opportunities in the Agricultural sector. The municipality also developed an incentive system for attracting industry and encouraging the industry to expand their operations.
Table 42: Planned projects in Kopanong Municipality193 Bethany settlement Agriculture: emerging farmers
Agriculture: intensive (irrigation) Fruit Irrigation schemes
Trompsburg Tourism: Information Agriculture: Agro-processing Agriculture: Special produce Mining: exploration
Tourism information centre Spring water, Beer brewery, wool spinning, Angora rabbits
190 Free State Provincial Government, Free State Growth and Development Strategy, Bloemfontein,
2006. 191 Free State Provincial Government, Free State Growth and Development Strategy, Bloemfontein,
2006 192 Gaffneys, Local Government in South Africa 2004-2006, p. 493. 193 Source: IDP Review Workshops (2005).

Arid Areas Report Volume 1: District Socio-economic Profile and Development Plans
Gariepdam Tourism: Information and Tourism: Attraction
Filling station, tourist information centre, Convention centre, Tri-district casino, Arts and crafts curio shops
Phillippolis Tourism: Information and attraction Tourist information centre Historic sites
Bethulie Agriculture: Special produce Fish farming Game farming
Reddersburg Agriculture: Emerging farmers Game farming Weigh bridge
6.2 Letsemeng Municipality (Koffiefontein) The municipality of Letsemeng consists of Koffiefontein (the municipal headquarters), Jacobsdal, Petrusburg, Luckhoff and Oppermansgronde. The size of these municipalities is significantly larger than the municipalities in the arid areas of the Northern Cape, Western Cape and Eastern Cape. 194 Letsemeng’s spatial area consists of 9 503 km2. Its population of 42 981 is 74% urbanised.195 Letsemeng’s population is growing at a rate of 2.9%, as the following table shows:
Table 43: Population growth per district in the Free State, 1996 and 2001196
District
1996 2001 Annual growth
rate, 1996 - 2001 N % N % Xhariep 123341 4.7 135245 5.0 1.9 Letsemeng 37201 1.4 42983 1.5 2.9 Free State 2633503 100 2706771 100 0.6 South Africa 40583570 100 44819780 100 2.0
Letsemeng borders on the Orange River, and there is significant irrigation farming along the Orange, Modder and Riet Rivers. In particular, Jacobsdal is an important producer of wine, sunflower, maize and wheat. Communal farming is undertaken on the periphery of all the towns, and there is a growing focus on land redistribution in Letsemeng. The government’s official land redistribution target of 30% may well be met by 2014. But the current decline in agriculture has reduced jobs for farm workers. 194 Free State Provincial Government, Free State Growth and Development Strategy, Bloemfontein,
2006 195 Gaffneys, Local Government in South Africa 2004-2006, p. 496. 196 Free State Provincial Government, Free State Growth and Development Strategy, Bloemfontein,
2006.

Arid Areas Report Volume 1: District Socio-economic Profile and Development Plans
Mining centres on Koffiefontein’s diamond mine. Petrusburg mines produce gravel, clay and salt. Letsemeng’s economy is based primarily on agriculture, with a lesser role for mining and tourism. The main employment sector is agriculture (4 304 people), followed by private households (2 090), community and personal services (1 212), mining (858), trade (780), construction (321) and business (295).
Table 44: Employment in Letsemeng, 2001
Employment Status Male Female Employed 7423 3635 Unemployed 2005 3109 Seasonal worker not working presently 151 250 Does not choose to work 363 751
The unemployment rate of Letsemeng Municipality is 35.7%, and 55.5% of the population live in poverty. 197 The municipality ensures job creation and poverty alleviation through economic development which will encourage investments and be supported by agricultural diversity, tourism development and local industry investment. The municipality encourage private initiative in sectors with possible economic growth and facilitate effective and relevant skills development of the labour market.
Table 45: Projects planned for Letsemeng Municipality198
Koffiefontein Mining: Exploration and processing Agriculture: Intensive (irrigation)
Diamond mining and cutting Irrigation scheme along Kalkfontein dam
Luckhoff Agriculture: Intensive (irrigation) Agriculture: Special produce Agriculture: Agro-processing
Irrigation schemes Leather tanning Abattoir
Oppermans Agriculture: Emerging farmers Agriculture: Special produce Agriculture: Intensive (irrigation)
Ostrich farming Grape and fruit farming
Jacobsdal Agriculture: Intensive (irrigation) Agriculture: Agro-processing
Grape farming Wine produce
Petrusburg Mining: Exploration and processing Agriculture: Agro-processing Agriculture: Intensive (irrigation)
Slate and salt mining Potato processing Potato farming
197 Gaffneys, Local Government in South Africa 2004-2006, p. 492. 198 Source: IDP Review Workshops (2005).

Arid Areas Report Volume 1: District Socio-economic Profile and Development Plans
V. The Eastern Zone
1. Gariep Local Municipality (Ukhahlamba District) Ukhahlamba District Municipality is the northern-most district of the Eastern Cape. Gariep LM is located in the westerly extreme of Ukhahlamba, and contains the towns of Venterstad, Burgersdorp and Steynsburg. These areas can be regarded as the most easterly extremes of the Karoo, and have a relatively high rainfall. Gariep LM is bordered by the Orange River and the Gariep Dam. There are three main centres - Burgersdorp, Steynsburg and Venterstad - surrounded by extensive commercial farmland with low population density. The area is characterised by large sheep, goat and game farms. Burgersdorp functions as the administrative and commercial centre. The commercial and economic base of Venterstad and Steynsburg have shown a steady decline over the last ten years, but there has been steady population growth.199 The municipality covers a spatial area of 8 344 km2. The population is 31 303, and is 73% urbanised.200 Gariep LM contains about 6485 households.201 The urban profile is as follows:
Table 46: Population in the Gariep LM (2000)
Town Population Percentage of municipal population Burgersdorp 13 301 41 % Venterstad 4 550 14 Steynsburg 6 510 20 Oviston 601 2 Rural 7 462 23 % TOTAL 32 424 100
Unemployment is high, and varies from 54.8% in Steynsburg to 41.2% in Venterstad and 34.3% in Burgersdorp.202 Informal employment is increasing, while formal employment has decreased substantially. 58% of households in Gariep LM have an income of less than R1 500 per month, indicating extreme poverty. However, compared with the other municipalities in
199 Gariep Integrated Development Plan, 2002, p. 11. 200 Gaffneys, Local Government in South Africa 2004-2006, p. 436. 201 Gariep Integrated Development Plan, 2002, p. 11. 202 Gariep Integrated Development Plan, 2002, p. 12.

Arid Areas Report Volume 1: District Socio-economic Profile and Development Plans
Ukhahlamba District, Gariep is the most affluent. (For example, in Elundini LM, 80.6% of the households earn less than R1 500 per month).203 Poverty levels are also indicated by the fact that 72.4% of households live below the minimum living level (MLL) in Burgersdorp; 62% in Steynsburg; and 60.2% in Venterstad.204 The employment profile for each magisterial district, is as follows:205
Table 47: Employment per sector (1999)
Sector Burgersdorp Steynsburg Venterstad Agriculture 34.9 43.9 28.4 Manufacturing 7.8 4 6.3 Construction 1.4 6.5 14.7 Trade 14.1 7 8.4 Transport 3.7 1 3.3 Finance 2.1 2.9 0.9 Community service (including government)
29.6 17.2 19.1
Households 6.4 17.4 18.9 Agriculture remains the main employer, followed by community services and government. The economy is weakly diversified, with very low figures for trade, manufacturing and construction. The following LED related projects are listed:206
• Establish irrigation infrastructure on the Venterstad commonage • Establish an appropriate economic development forum to be an advisory body
around economic development • Evaluate all existing community economic projects to determine their
sustainability prospects • Burgersdorp leather and felt making project • Burgersdorp brick making project • Burgersdorp rose cultivation project • Steynsburg poultry project • Steynsburg piggery project • Venterstad lucern cultivation project • Venterstad Fishing project • Venterstad hostel upgrading project • Provide input into all the District municipalities marketing initiatives • Undertake a skills audit of the unemployed
203 ECSECC, Ukhahlamba: Socio-economic Profile, 2007, p. 22. 204 Gariep Integrated Development Plan, 2002, p. 13. 205 Gariep Integrated Development Plan, 2002, p. 13. 206 Gariep LM IDP Review: 2003/2004

Arid Areas Report Volume 1: District Socio-economic Profile and Development Plans
• Prepare a business plan for the establishment of a SMME support center and training programme in Burgersdorp to provide mentoring, support and training facilities to the community of the municipality
• Develop a business plan (linked to the SMME support centre) for the establishment of a facility catering for youth development
• Development of Tourism resources at the Gariep Dam • Development of a “cultural”centre at Venterstad • Assist the Local Tourism Organisation to become more representative and to
function more effectively • Venterstad/Oviston – Tunnel festival • Venterstad/Oviston water sports and marathon • Venterstad/Oviston recreational centre • Burgersdorp 4x4 trails • Steynsburg festival • Gariep Complex programme • Support for income generating projects • Establishment of a development agency to support and assist in the economic
development of the area

Arid Areas Report Volume 1: District Socio-economic Profile and Development Plans
2. Inxuba Yethemba (Chris Hani District) The key towns of Inxuba Yethemba are Cradock and Middelburg. The economy is primarily based on extensive commercial livestock agriculture – mainly sheep and goats - which contrasts with the subsistence economy of the eastern part of the province. The municipality is traversed by two important highways – the N9 and N10 highways, which link Port Elizabeth to the Free State and Gauteng. The municipality has a spatial jurisdiction of 11046 km2. The population of 60 296 people is 76% urbanised.207 The population of Inxuba Yethemba Municipality is as follows:
Table 48: Population data: Inxuba Yethemba Local Municipality, 2001208
Racial group Population African 32 483 Coloured 21 111 Indian 41 White 6 661 TOTAL 60 296
The economy is highly concentrated in the agricultural sector. There is virtually no industrial activity.
Employment in Inxuba Yethemba is concentrated primarily in agriculture, followed by community services and private households:
Table 49: Employment in Inxuba Yethemba Local Municipality, 2001209
Sector People employed Agriculture 3 938 Community/social/personal services 2 847 Construction 544 Electricity/gas/water 56 Financial/insurance/business 600 Manufacturing 558 Mining 6 Private households 1 782 Transport/communications 292 Undetermined 666 Wholesale/retail 1 621
207 Gaffneys, Local Government in South Africa 2004-2006, p. 400. 208 Gaffneys, Local Government in South Africa 2004-2006, p. 401. 209 Gaffneys, Local Government in South Africa 2004-2006, p. 401.

Arid Areas Report Volume 1: District Socio-economic Profile and Development Plans
Poverty levels are high. In Inxuba Yethemba, 63% of the households earn less than R1 500 per month. Even though this is a very high figure, it is significantly lower than the eastern parts of the district.210 Economic development projects in the IDP include:211
• Improve Access to Trade Opportunities • Informal Hawkers Area in Town • Child Care Centers • Waste Recycling, Collections and Clean-Up • Community Vegetable Garden (Lingelihle & Lusaka) • Livestock Farming • Waste Recycling, Collections & Clean-Ups • Livestock Farming • Develop Tourism Villages and Upgrade Entrances to Town • Wood and Mohair Industry, From Raw Material to Manufacturing of Wool
Products • Crop Growing Tunnels and Normal Crop Growing • Aqua Farming • Clothing Manufacturing • Develop and Legalize Brick Making Activities • Poultry Farming and Food Growing • Develop Infrastructure for Tanneries • SMME Promotion.
210 ECSECC, Chris Hani Socio-Economic Profile 2007, p. 25. 211 Inxuba Yethemba LM IDP: 2002

Arid Areas Report Volume 1: District Socio-economic Profile and Development Plans
VI. The Northern Zone
1. Siyanda District Siyanda District Municipality is located in the Kalahari, and straddles the Orange River. Siyanda DM is based in Upington. Siyanda is largely made up of the old Gordonia and Kenhardt Divisional Councils. About half the length of its northern border is shared with Botswana, and most of its western border is shared with Namibia. This semi-arid, sparsely vegetated area nevertheless supports a huge diversity of game. Grapes are grown on the intensely irrigated banks of the Orange River. The area is characterised by extensive livestock farms in the arid areas, as well as intensive irrigation farming along the Orange River. The area is becoming a major exporter of table grapes and raisins. There is a growing tourism sector, primarily based on various national parks. Diamonds, iron, lime and salt are mined in the eastern pats of the district and are a major contributor to the district’s economy. Siyanda has internationally known game parks within its boundaries, namely the Aughrabies National Park and the Kgalagadi Transfrontier Park. Riemvasmaak is also being developed as a tourist destination.212 There is an international airport at Upington, mainly used for the export of agricultural products to overseas destinations.
Table 50: Municipalities and population in Siyanda District
Municipality Towns Population213, 2001 Kai !Garib Lm Keimoes, Kakamas, and villages along the Orange River, such
as Augrabies, Kanoneilan, Alheit 57 684
Kgatelopele LM Danielskuil, Lime Acres 15 447 Tsantsabane LM Postmasburg, Olifantshoek, Skeyfontein 31 013 //Khara Hais LM Upington, and villages such as Raaswater, Louisvale, Karos 73 785 !Kheis LM Groblershoop 16 027 Mier LM Rietfontein, Askham, Noenieput, Grootmier, Kleinmier 6 844 District Management Area
Rural area – Kalahari; Riemvasmaak; commercial farmland around Kenhardt
8 600
The IDP identified poverty and illiteracy as the greatest social problems. In 2000, approximately 60% of the inhabitants had an income below R800.214 The lack of literacy contributes to poor nutrition practices in poor households. There is a growing
212 Gaffneys, Local Government in South Africa 2004-2006, . 880-881 213 Siyanda District Municipality IDP, 2004, p. 4. 214 Siyanda District Municipality IDP, 2004, p. 11.

Arid Areas Report Volume 1: District Socio-economic Profile and Development Plans
phenomenon of seasonal workers from the North West Province, who work on the irrigation farms along the Orange River. Some of these workers may decide to migrate permanently, and consequently, the African population has increased from 44 600 in 1996 to 51 300 in 2001.215
Table 51: Urban population, poverty, by District municipality in the Northern Cape216 District Municipality
Population % urban
% Proportion unemployed
%House-holds living in poverty
% with no schooling
Contribution to provincial GDP217
Siyanda (Upington)
209 890 59.8 27 40.5 17.1 13 %
Provincial trends
35.6 42% 19.2% 100 %
Siyanda sectors in order of prominence: (1) agriculture, (2) community services, (3) trade/tourism, (4) manufacturing, (5) construction.
Table 52: Workforce per sector in Siyanda District218 Sector 1996 2001 Agriculture; hunting, forestry and fishing 19 100 24 921 Mining and quarrying 2 718 1 935 Manufacturing 2 014 2 904 Electricity; gas and water supply 625 304 Construction 3017 2 112 Wholesale and retail trade; repairs, hotels and restaurants 5 438 5 929 Transport, storage and communication 2 008 1 376 Financial intermediation; insurance; real estate and business services 2 010 2560 Community; social and personal services 9 046 7925 Private households 6 000 5092 Other and not adequately defined 5 069 4 135 Total 57 045 59 193
For the District Management Area (DMA), the following projects are suggested:
• Support quartz mine developers • Job creation project in Swartkopsdam (boerseep) • Job creation project in Riemvasmaak (catering) • Cultivation of lucerne in Kai !Garib area • Ostrich breeding project • Clean town project in Riemvasmaak
215 Siyanda District Municipality IDP, 2004, p. 12. 216 SA Institute of Race Relations, Fast Facts, February 2006. 217 Address by MEC for Finance and Economic Affairs, Economic Affairs budget vote, 22 June 2006. 218 Siyanda DM IDP, 2004, p. 13.

Arid Areas Report Volume 1: District Socio-economic Profile and Development Plans
• Phambili training programme for small contractors. • Provide small business hives.
1.1 !Kai !Garib Local Municipality (Keimoes) The municipality is based in Kakamas. The municipality incorporates a wide range of settlements and towns many of which are on the banks of the Orange River. Some of these are Alheit, Kakamas, Keimoes, Kenhardt and Riemvasmaak. The fertile Orange River valley supports vines, cotton and lucerne and the Orange River Wine Cellars are a favourite tourist feature. Kenhardt is some distance from the river but is “situated at the junction of nine roads radiating in every direction”. South Africa’s first hydro-electric power station came into operation here in 1912 and a number of the original waterwheels built by Cornish miners are still in operation in the several canals that are fed by the river.219 The spatial area of the municipality amounts to 6 879 km2. The population consists of 57 684 people, and the municipality is 33% urbanised.220 The economy is highly concentrated in the agricultural sector, which provides 15 214 jobs, followed by community and personal services (1 438), private households (1 084), trade (1 061), business (519), construction (462), and transport (167).
Table 53 : Employment profile of !Kai !Garib Municipality.
Employment status Number of people Employed 21599 Unemployed 4488 Not economically active 11307
The Renewed IDP of June 2005 makes provision for the following LED projects:
• A tourism development plan • A fig project • A lucerne project, including landcare and training for emergent farmers.
1.2 //Khara Hais Local Municipality (Upington)
219 Gaffneys, Local Government in South Africa 2004-2006,. 881-882. 220 Gaffneys, Local Government in South Africa 2004-2006, p. 881.

Arid Areas Report Volume 1: District Socio-economic Profile and Development Plans
The municipality is centred on Upington but includes a number of lesser settlements such as Raaswater, Karos, and Louisvale. The municipality has a jurisdiction of 3 170 km2. Its population of 73 785 is 78% urbanised.221 The economy is fairly diversified. The most prominent employment sector is community and personal services (4 163 people), followed by trade (3 364), agriculture (2 437), private households (1 817), business (1455), transport (875) and construction (873).222 The municipality has a substantial economic growth rate of between 3.2% and 4% per annum, with Upington being one of the economic growth points in the province. Only 15% of the population is unemployed. The high summer temperatures make the area a popular one with motor manufacturers who want to test their prototype models’ endurance in extreme conditions. The area was inhabited by the Koranna tribe before intensive agricultural activity turned Upington into a major centre. Upington is one of the Northern Cape’s economic growth points and its airport was recently accorded international status.223
Table 54: Employment profile of //Khara Hais Municipality
Employment status Number of employees Employed 18231 Unemployed 9877 Not economically active 19735
The following projects have already been undertaken:224
• The Municipality has purchased a new farm (Olyvenhoudtsdrift) for municipal commonage, for emergent farmers.
• Working for Water programmes are aimed at eradicating prosopis trees. The IDP lists the following as key strategies:
• Promoting manufacturing • Promoting government’s initiatives • Upgrading the CBD • Formalising the informal sector.
221 Gaffneys, Local Government in South Africa 2004-2006, p. 884. 222 Gaffneys, Local Government in South Africa 2004-2006, p. 884. 223 Gaffneys, Local Government in South Africa 2004-2006. 884-885 224 IDP Review, March 2005.

Arid Areas Report Volume 1: District Socio-economic Profile and Development Plans
1.3 !Kheis Local Municipality (Groblershoop) Situated in Groblershoop, !Kheis embraces a further eleven small settlements including Grootdrink, Skerpioenpunt, Wegdraai, Boegoeberg and Kleinbegin. The municipality has a spatial area of 8 954 km2. Its population of 16 027 is only 32% urbanised.225 Almost all economic development in the municipality is dependent on the Orange River, where table grapes are produced and exported. There are also two wine cellars in the area. A large part of the work is seasonal. Sheep farming also provides work for local people. The natural environment provides opportunities for ecotourism, especially along the Orange River, and for 4x4 routes. Boegoeberg owes its existence to the completion of the Boegoeberg dam and irrigation system in 1949. There are two wine cellars in the municipality though much of the work they generate is only seasonal. The climate is highly favourable for the drying of sultanas and this is anticipated to become a growth industry in the near future. Little has been done to take advantage of the tourism potential proffered by the Orange River although the Witsand Game Reserve with its famous roaring sands falls within the municipality.226 The labour force is primarily found in the agricultural sector (2 645 jobs), followed by trade (369), community and personal services (328), trade (369), manufacturing (171), construction (139) and business (75).227
Table 55: Employment profile of !Kheis Municipality
Employment status Number of people Employed 4477 Unemployed 1166 Not economically active 4149
The IDP Review identified the following projects:
• Making more land available for emergent farmers, improving infrastructure, providing training, and providing water rights
• Upgrading the marketplace in Groblershoop • Sugar packaging plant • Feasibility study of mining in the area • Development of an integrated tourism plan • Upgrading of Boegoeberg Resort • Tourism information shop and curio shop to promote local tourism, and
development of tourism accommodation. 225 Gaffneys, Local Government in South Africa 2004-2006, p. 886. 226 Gaffneys, Local Government in South Africa 2004-2006, pp. 885-887. 227 Gaffneys, Local Government in South Africa 2004-2006, p. 886.

Arid Areas Report Volume 1: District Socio-economic Profile and Development Plans
1.4 Tsantsabane Local Municipality (Postmasburg) Based in Postmasburg, the only other town of any substance in the municipality is Olifantshoek. The municipality has a jurisdiction of 5 415 km2, and its population of 31 013 is 84% urbanised.228 Approximately 70% of the economy is based on mining. The Finch Diamond Mine, one of the richest in the world, is located at Lime Acres, near Postmasburg. Iron and manganese are mined on a large scale. Agricultural activities consist mainly of sheep and goat farming, as well as some mixed cattle farming.229 The Defence Force’s Battle School at Lohatla provides some stimulation for an economy which is overwhelmingly dependent on mining. All of the roads leading to nearby regional towns are tarred and Postmasburg is connected via rail to Kimberley, Sishen and Hotazel. Tourism is poorly developed.230 The economy is fairly diversified. The main employment sector is community and personal services (1 592 jobs), followed by trade (845), mining (714), agriculture (513), manufacturing (469), business (357), and construction (349).231
Table 56 Employment profile of Tsantsabane Municipality
Employment status Number of people Employed 5299 Unemployed 3375 Not economically active 6649
The IDP makes provision for:
• the establishment of LED forums in all the wards • a small-scale diamond mine in Skeyfontein • polish manufacturing in Groenwater • re-opening of the chemical factory in Olifantshoek • a small-scale manganese mining and iron ore plant.
228 Gaffneys, Local Government in South Africa 2004-2006, p. 888. 229 Gaffneys, Local Government in South Africa 2004-2006, p. 890. 230 Gaffneys, Local Government in South Africa 2004-2006, pp. 888-890 231 Gaffneys, Local Government in South Africa 2004-2006, p. 889.

Arid Areas Report Volume 1: District Socio-economic Profile and Development Plans
1.5 Kgatelopele Local Municipality (Danielskuil) Kgatelopele’s main centre is Danielskuil but it also includes Lime Acres, Papkuil and Silver Streams. Danielskuil is 160km north-west of Kimberley and 84km south of Kuruman and is linked by tarred roads to both these centres as well as to Postmasburg. The municipality has a jurisdiction of 2277km2, and its population of 15 447 is 80% urbanised.232 The town has experienced steady growth due to the mining activity (diamonds and lime) in its immediate vicinity. The area is also known for extensive sheep and cattle farming but its tourism potential is regarded as being underdeveloped.233 Employment in the municipality is concentrated in the mining sector (1 061 jobs), followed by manufacturing (684), private households (500), agriculture (484), community and personal services (389), trade (338), and construction (269).234
Table 57: Employment profile of Kgatelopele Local Municipalty
Employment status Number of people Employed 3789 Unemployed 1709 Not economically active 4086
The IDP noted that five economic problems have to be addressed:
• Stimulation of the informal sector • Marketing and development of tourism potential • Formulation of a local employment policy. • Development of emergent farmers • Skills development.
The IDP identified the following LED projects:
• Creating an information centre for tourism, including the local mining companies and game farms
• Upgrading of the museum and other heritage sites • Marketing the area and its products • Skills development programmes, particularly among the youth • Extension of vegetable production.
232 Gaffneys, Local Government in South Africa 2004-2006, p. 882. 233 Gaffneys, Local Government in South Africa 2004-2006, pp. 882-883. 234 Gaffneys, Local Government in South Africa 2004-2006, p. 883.

Arid Areas Report Volume 1: District Socio-economic Profile and Development Plans
1.6 Mier Local Municipality Mier consists of Andriesvale, Askham, Noenieput, Rietfontein, Witdraai and Twee Rivieren. The headquarters of the municipality is at Rietfontein. The municipality is vast, and has a municipal area of 10 647 km2. The population is only 6 844, and is 65% urbanised.235 The area is water impoverished and depends on boreholes which tend to supply poor quality water. The shortage of water impacts on the development of the agricultural sector with water for livestock having to be transported by pipeline or even by road. Rietfontein (where the municipality is based) is only 75km north-west of Upington but the roads, where not tarred, are generally poor. Rietfontein also serves as a somewhat remote border post with Namibia. Eco-tourism and hunting takes place in the district.236 The economy of the area is based on sheep-farming, as well as cattle, donkeys, goats and game. The economy is virtually totally based on agriculture, which employs 342 people; this sector is followed by private households (202), trade (90), manufacturing (38), business (21) and transport (20).237
Table 58: Employment profile of Mier Municipality
Employment status Number of people Employed 1157 Unemployed 575 Not economically active 2182
According to the Siyanda DM, the exploration and development of mining, is contemplated, for which a sum of R2 382 000 will be secured from DBSA. Furthermore, several tourism-oriented projects are envisaged:
• Development of an integrated tourism plan • Upgrading of game farm facilities • Management programme for game farms • Upgrading of the Kleinmier complex • Management and operations of the arts and culture centres.
The Siyanda DM also provided for:
• a livestock improvement and landcare programme, • upgrading the abattoir in Rietfontein, • development of a meat production plant, and • cultivation of prickly pears.
235 Gaffneys, Local Government in South Africa 2004-2006, p. 886. 236 Gaffneys, Local Government in South Africa 2004-2006, pp. 887-888. 237 Gaffneys, Local Government in South Africa 2004-2006, p. 887.

Arid Areas Report Volume 1: District Socio-economic Profile and Development Plans
2. Kalahari-Kgalagadi District The Kgalagadi District Municipality is located in the extreme north-east of the Northern Cape, flanking the North West province, and is based in Kuruman. The Integrated Sustainable Rural Development Strategy (ISRDS) identified Kgalagadi DM as “a nodal point of delivery”. Possibly due to the DM’s fluid border with North West, Kgalagadi’s mayor was moved to observe that she sees Kgalagadi as “a place of invisible borders” – a place where borders are not an obstacle to development.238 There are three municipalities in Kgalagadi District:
• Gamagara LM: Kathu and Dibeng • Ga-Segonyana LM: Kuruman • Moshaweng LM: Kudumane and rural villages.
Table 59: Population, poverty and unemployment in Kgalagadi District239 District Municipality
Population % urban
%Proportion unemployed
%House-holds living in poverty
% with no schooling
Contribution to provincial GDP240
Kgalagadi (Kuruman)
176 909 19.8 41.9 57.1 24.6 24 %
Key sectors in order of prominence: (1) Mining, (2) social services, (3) agriculture, (4) trade/tourism, (5) manufacturing, (6) construction:
Table 60: Number of people employed in Kgalagadi District, 2001
Economic sector Number of people employed, 2001
Agriculture; hunting, forestry and fishing 2514 Mining and quarrying 3886 Manufacturing 1532 Electricity; gas and water supply 252 Construction 1241 Wholesale and retail trade; repairs, hotels and restaurants 3041 Transport, storage and communication 597 Financial intermediation; insurance; real estate and business services 1023
238 Gaffney’s Local Government in South Africa 2004-6, pp. 857-9. 239 SA Institute of Race Relations, Fast Facts, February 2006. 240 Address by MEC for Finance and Economic Affairs, Economic Affairs budget vote, 22 June 2006.

Arid Areas Report Volume 1: District Socio-economic Profile and Development Plans
Community; social and personal services 6035 Private households 2921 Other and not adequately defined 0 Undetermined 1237 Total 24279
Economic projects in the IDP include:
• The Farm Chakwane (LRAD) • The Farm Skoolplaas (LRAD) • Land redistribution at Vanzylsrus, and promotion of LED, including grazing,
community-based eco-tourism and game farming • Kgalagadi Integrated Energy Centre: Establishment of sustainable SMMEs
within the energy sector; centre owned by a community co-operative • Kgalagadi Dipudi Enterprises: In 5 areas, establish 5 boer goat production units • Livestock improvement and Landcare project: Establish primary cattle growers,
improve beef production, provision of infrastructure (fencing, water, handling facilities)
• Development of the Kuruman Eye • Upgrading of Billy Duvenhage Game Park • Moffatt Mission Imiprovement • Expand the functions of KDA (?) to serve as a business support centre • Kgalagadi Cultivation project in Manyeding and Deben • Devil’s claw project in Kgalagadi • Poultry and abattoir project • Development of a food security feasibility study • Upgrade and develop tourism infrastructure (Wonderwerk Caves) • Assistance to small-scale miners • Integrated vegetable cluster, particularly for female producers • Integrated poultry and broiler cluster, particularly for female producers • Batlharos Multi-purpose centre.
The following projects have been identified for the ISRDP node (only the projects related to job creation and enterprises are listed):241
Table 61: ISRDP (rural node) projects in Kgalagadi DM
Project Objectives Beneficiaries Actual and potential Stakeholders
Land reform Provide infrastructure on municipal land for commonage farmers
Emergent farmers Dept Land Affairs Dept of Agriculture Land Bank DWAF
241 http://www.dplg.gov.za/isrdp.

Arid Areas Report Volume 1: District Socio-economic Profile and Development Plans
Environmental management
Rehabilitation of Asbestos areas Improve health conditions Job creation Skills development
Dept Minerals and Energy Kgalagadi DM DEAT Dept Public Works
ICT Project Telephone services Access to ICT Access to govt information Bridging the digital divide
Telkom Dept of Culture GCIS Universal Service Agency Sentec
Disaster management
Reduce occurrence of veld fires Livestock and wildlife protection
Kgalagadi DM DPLG Dept of Agriculture DEAT
Water projects Access to clean potable water Skills development Job creation
MIG
One stop service One stop service 53 temporary jobs SMMEs involved in construction Access to govt information and services
Dept of Local Govt (NW)
Kgalagadi Dipudi Enterprise
Economic development Landcare International trade Leather production Skills development
62 goat producers Dipudi market created
ARC DoA Kgalagadi DM Office of Premier (NW)
Kgalagadi Human Resource Foundation
Develop skills 18 bursary allocations
Kgalagadi DM Office of Premier (N Cape) Eskom Mining Houses
Energy co-operatives
Integrated energy centre Alternative energy Skills development SMME development
Unemployed people in 8 villages unified in co-oepratives 13 permanent staff 36 paraffin vendors identified
DTI/Ntsika Sasol PASASA KDM NDA Total Gaz Dept Labour Eskom
Poultry and abattoir
Provide jobs Training
45 women and 5 men Land Bank
Livestock improvement
Promote emergent farmers and LED Skills development
21 female land owners
DoA Dept Labour Office of President Kgalagadi DM DWAF Dept Land Affairs Traditional authority

Arid Areas Report Volume 1: District Socio-economic Profile and Development Plans
2.1 Gamagara Local Municipality (Kathu) Gamagara LM consists of four towns, each with a distinctive history and character of its own. These are Kathu, Dibeng, Dingleton and Sishen. Kathu’s origins lie with Iscor’s iron-ore ventures in the Kalahari and it boasts one of the five largest open-cast iron-ore mining operations in the world. The planning of Kathu saw a number of contemporary town-planning theories being put into practice and it would be interesting to know what lessons have been learnt from these innovations over the years. Sishen “was planned to serve solely as a high-density residential area for mineworkers, without families or any social structure” and is still regarded as having been pivotal to the development of the Gamagara area. Kathu’s strength lies in its connectedness by rail and road to all the major centres in southern Africa. It also has an airport with a tarmac runway.242 Gamagara’s jurisdiction consists of 2 395 km2. Its population of 16 176 is 90% urbanised.243 Mining contributes the bulk of employment in the area, and provides 1 977 jobs; this is followed by private households (793), manufacturing (589), community and personal services (750), trade (542), business (266) and construction (265).244
Table 62: Census 2001 by municipalities, official employment status and gender245
Employment status Number of people Employed 6942 Unemployed 2575 Not economically active 5929
Economic development projects in the IDP include:
• Upgrading and developing tourism products (externally sourced funding) • Brickmaking project (R250 000 budgeted) • Skills development for youth and small contractors (externally sourced
funding) • Developing an LED strategy (externally sourced funding) • Kgalagadi Dipudi Enterprise (externally sourced funding) • Tourism information centre • Tourism marketing strategy • Composting site (will be aimed at job creation).
242 Gaffney’s Local Government in South Africa 2004-6, p. 859-861. 243 Gaffney’s Local Government in South Africa 2004-6, p. 859. 244 Gaffney’s Local Government in South Africa 2004-6, p. 859. 245 Census 2001.

Arid Areas Report Volume 1: District Socio-economic Profile and Development Plans
2.2 Ga-Segonyana Local Municipality Ga-Segonyana is centred on Kuruman and was a “cross-border municipality”. Minerals mined in the area include manganese, iron and tiger’s eye and the region has lately developed into one of South Africa’s premier hunting areas. An oasis in every sense of the word, Kuruman is endowed with a permanent and abundant supply of water from a perennial fountain (the Eye) which daily emits some 20-million litres of water. The town of Mothibastad was created in 1960 when blacks were removed from Kuruman in terms of apartheid legislation.246 The labour profile is fairly diversified. The most important employment sector is community and personal services (3 161 jobs), followed by trade (1 752 jobs), private households (1 245), mining (748), manufacturing (598), agriculture (555), business (544), and construction (451).247 The spatial jurisdiction of the municipality amounts to 4 106 km2. The population of 70 391 is only 24% urbanised.
Table 63: Employment profile of Ga-Segonyana Municipality
Employment status Number of people Employed 10195 Unemployed 14941 Seasonal worker not working presently 275 Does not choose to work 3215
The following projects are listed in the IDP:
• At least 10 roads to be upgraded and tarred, with MIG funding, municipal capital, District Municipal funding, and Extended Public Works Programme
• Capacity-building: LED policy and procurement policy (MSIG funding) • Capacity-building and Business management for SMMEs (municipal funding) • Small-scale farming (estimated R2 million - not funded) • Small-scale mining at Gamopedi area (estimated R800 000 - not funded) • Agricultural gardens and food security (estimated R1 million, from municipal
capital) • Bakeries, under the auspices of an NGO (R350 000, from Lotto) • Abattoir for poultry (cost not estimated) • Brickmaking (cost not estimated) • Sewing project (cost not estimated) • Coffin manufacturing (cost not estimated)
246 Gaffney’s Local Government in South Africa 2004-6, pp. 861-863. 247 Gaffney’s Local Government in South Africa 2004-6, p. 861.

Arid Areas Report Volume 1: District Socio-economic Profile and Development Plans
• Multi-purpose centre in Ward 3 (estimated cost R300 000, from municipal capital)
• Multi-purpose centre in Bankhara Bodulong (R1,5 million, from Lotto and private capital)
• Learnership centre at Batlharos Development Centre (R2 million, from Samancor Founcation and Department of Education of the North West)
• Skills Development Centre at Mothibistad (R500 000, from DM funding • Skills Development Centre at Matlharos (R350 000), from DM funding. • Developing a formal hawkers area (R300 000 from municipal capital) • Upgrading the taxi rank in Kuruman (R300 000 from municipal capital and DM
funding)
2.3 Moshaweng Moshaweng consists of 154 villages and settlements covering an area of 8 600 square kilometres. It appears to have no major centre and is extremely underdeveloped (eg. the road network is rudimentary). Most of these settlements had their origins in apartheid removals from the surrounding areas, predominantly in the Northern Cape.248 It has been identified as a node under the ISRDP programme. Moshaweng’s jurisdiction consists of 8 604 km2. The population is 84 104, and is 100% rural. The most prominent employment sector is community and personal services (1 348), followed by agriculture (558 people); mining (445), trade (396), private households (306), construction (273), and transport (110).249
Table 64: Employment profile of Moshaweng Municipality
Employment status Number of people Employed 4449 Unemployed 6422 Seasonal worker not working presently 10871 Does not choose to work 4746
Kgalagadi DM has completed a Local Economic Regeneration Study for the Kgalagadi area, and this will guide LED. This study includes:
• Strategy to develop tourism in Bothithong villages • Manyeding agricultural cultivation project • Moshaweng Integrated Energy Centre, and creation of SMMEs in the energy
sector 248 Gaffney’s Local Government in South Africa 2004-6, pp. 863-864. 249 Gaffney’s Local Government in South Africa 2004-6,p. 853.

Arid Areas Report Volume 1: District Socio-economic Profile and Development Plans
• Kgalagadi Dipudi Enterprises – 5 boer goat production units • Livestock improvement and infrastructure, for beef production • Devil’s claw conservation project • Establish a 4x4 route across Moshaweng for income generation • Establish co-operatives • Leather tannery project • Brick making project • Bakery

Arid Areas Report Volume 1: District Socio-economic Profile and Development Plans
3. Molopo Local Municipality (Pomfret) The three western municipalities of Bophirima District are included in this survey of the arid areas. Bophirima’s headquarters are based at Vryburg. Molopo Local Municipality is part of Bophirima District Municipality in the North-West Province. The headquarters are based at Pomfret. The municipality contains the small towns of Bray, Senlac, Terra Firma, Vergelee and Vorstershoop. Most are rural service centres. There are also large rarms. The major rural land uses in Molopo are small mines, tourist facilities, isolated industrial activities, intensive agriculture (small livestock and crops), and game hunting.250 Molopo’s jurisdiction consists of 11 227 km2. Its population of 11 689 is 100% rural. It has the lowest population density in Bophirima District.251 The population is 90% African, and nearly three-quarters are under 34 years of age. This places a large burden on social services. The employment profile is strongly concentrated in agriculture (1 404 jobs), followed by private households (1 234), community and personal services (284), business (245) and trade (133).252
Table 65: Employment profile of Molopo Local Municipality
Employment status Number of people Employment status Employed 3570 Unemployed 329 Seasonal worker not working presently 50 Does not choose to work 667
250 Gaffney’s Local Government in South Africa 2004-6, p. 917. 251 Gaffney’s Local Government in South Africa 2004-6, p. 917. 252 Gaffney’s Local Government in South Africa 2004-6, p. 916.

Arid Areas Report Volume 1: District Socio-economic Profile and Development Plans
4. Kagisano Local Municipality (Ganyesa) The Kagisano Local Municipality is approximately 14 690 km2 in extent (30.95% of the total area of the Bophirima District Municipal Area), with an estimated population of 111 397 people (23.19% of the total population of the Bophirima District Municipal Area).253 Kagisano is 100% rural. The towns of Morokweng and Ganyesa are the main local nodes. The towns of Heuningvlei and Louwna represent supportive local nodes. The towns are rural in nature and are surrounded by vast rural areas. The towns comprise of settlements with a residential character and are surrounded by very low-density, scattered rural settlements and villages. More than half (53.44%) of the population in the Kagisano Local Municipal Area are females. The larger portion of the population (54.59%) of the Kagisano Local Municipal Area is in the school-going age group (0 to 19 years of age). Poverty is widespread, with 87.5% of the households living below the subsistence line (R1 600 per month). This is the highest level of poverty in Bophirima District. Various economic projects have been launched to address poverty issues. These include poultry projects, cattle projects, vegetable gardens, brick-making projects, and game farms.254 Kagisano’s jurisdiction consists of 10 278 km2. Its population of 96 385 is 100% rural.255 The most important employment sector is agriculture (4 246 people), followed by community and personal services (2 185), private households (986), trade (640), mining (348) and construction (248).256
Table 66: Employment profile of Kagisano Municipality
Employment status Number of people Employed 8903 Unemployed 7642 Seasonal worker not working presently 16545 Does not choose to work 4859
253 Peter Ewang, North West Mapping Study, unpublished report for ASGISA, 2006, p. 70. 254 Gaffney’s Local Government in South Africa 2004-6, p. 911. 255 Gaffney’s Local Government in South Africa 2004-6,p. 910. 256 Gaffney’s Local Government in South Africa 2004-6, p. 911.

Arid Areas Report Volume 1: District Socio-economic Profile and Development Plans
Table 67: Economically active population per District municipality257
Local Municipality
Youth (15-34 years) Non-Youth (35-59 years)
Male Female Total Male Female Total Kagisano Local Municipality
13246 15318 28 564 7787 9920 17707
257 www.statssa.gov.za

Arid Areas Report Volume 1: District Socio-economic Profile and Development Plans
5. Greater Taung (Pudimoe, Taung) Greater Taung Municipality is situated within the southern portion of the Bophirima District Council, within the North West Province. The area is about 5648,9km2, which represents about 11,8% of the area covered by the Bophirima District Municipality. The main entities comprising the area are Reivilo/Boipelo, Pudimoe, and the traditional areas. The population consists of 182 164 people, and this is 95% rural.258
At present 94 villages are situated within Greater Taung Municipality’s area of jurisdiction. These villages are randomly dispersed subsistence villages. The total population of the area is estimated at 184 355. 259 Female headed households are dominant within the area. The area has a high population density. There is a huge concentration of young people within the area. Additional job opportunities are needed to cater for these future job seekers. The area has a high household size, compared with the Bophirima District. The poverty rate, combined with the low household income and number of unemployed people, highlights the need for additional employment opportunities.260 The towns and villages provide a service to the surrounding rural communities. The towns within the area offers a range of commercial facilities, light industrial area for small industries, social services (hospital, clinics and churches), primary and secondary schools, as well administrative functions, including local government offices, police services and post offices. Other activities include the Pering Lead Mine and recreational / tourist facilities, such as the Taung Sun Hotel and Taung Dam. Cattle and mixed livestock farming are of the most prominent economic activities within the study area, while intensive irrigation cropping is being found within Taung/Pudimoe. Refer to the attached Map for the location of the major land uses.
The N18, linking Vryburg with Kimberley, crosses the study area. Another tarred road is the P25/1 between Taung and Reivilo. The remainder of the road system consists of mainly gravel roads. The area is served by the railway line between Vryburg and Jan Kempdorp, with Taung Station hosting the lead concentrate, transfer facility for Pering Mine. An existing airstrip near the town of Reivilo gives air access into the district. No surfaced airstrips are available. The predominant employment sector is community and social services (4 385 people), followed by trade (1 639), private households (1 638), agriculture (1 574), mining (1 044), construction (684), business (449), and manufacturing (436).261
258 Gaffney’s Local Government in South Africa 2004-6, p. 907. 259 Peter Ewang, North West Mapping Study, unpublished report for ASGISA, 2006, p. 67. 260 Peter Ewang, North West Mapping Study, unpublished report for ASGISA, 2006, p. 67. 261 Gaffney’s Local Government in South Africa 2004-6, p. 909.

Arid Areas Report Volume 1: District Socio-economic Profile and Development Plans
Table 68: Employment profile in Taung Municipality
Employment status Number of people Employed 13111 Unemployed 24566 Seasonal worker not working presently 37677 Does not choose to work 7632

Arid Areas Report Volume 1: District Socio-economic Profile and Development Plans
Conclusion A significant distinction should be drawn between those areas where extensive commercial farms exist (the erstwhile “white South Africa” in the apartheid era), and the communal areas of the northern Kalahari. The communal areas are now within both the North West and Northern Cape jurisdictions. In particular, the Kgalagadi District has the challenge of managing commercial and communal areas. The difference is not only in the type of farming, but also the concentration of population. The communal areas are much more densely populated, and the population is more evenly dispersed throughout rural villages. Also, in the communal areas, the rural component of the population is extremely large – in some cases up to 100%. In the commercial farming areas, the towns are growing, while the population of the farmlands is decreasing. A common feature of all arid municipalities is their significantly large spatial jurisdictions, demarcated in this way because of their low population. Another common feature is the prominence of agriculture as a form of employment. However, in some cases, it is superseded by mining or trade.

Arid Areas Report Volume 1: District Socio-economic Profile and Development Plans