volume 24 number 9 - september 2000 ( 271kb)
TRANSCRIPT

EditorialCreutzfeldt-Jakob disease surveillance -
Australia at the crossroads?
Creutzfeldt-Jakob disease (CJD) is one of a small
number of human neurodegenerative trans-
missible spongiform encephalopathies (TSEs)
which affect people mainly in the 50 to 75 year age
range, with a peak incidence in about the mid-
sixties. The annual incidence of CJD is approx-
imately one case per million population, and is
invariably fatal, usually within a year of onset of
symptoms. It usually begins with memory loss,
followed by rapidly progressing dementia, loss of
coordination, slurred speech and myoclonus, and -
in the final stages - akinetic mutism, coma and
death. A definitive diagnosis can only be made by
histopathological examination of brain tissue, and
only in rare cases is a diagnosis confirmed
ante-mortem. Other related human TSEs include
variant CJD (vCJD), Gerstmann-Sträussler-
Sheinker disease (GSS), fatal familial insomnia
(FFI), sporadic fatal insomnia and kuru.
It is believed TSEs are caused by the accumulation
of an aberrant isoform of a normal cellular protein
called a prion (PrP). About 85 per cent of cases of
CJD are regarded as sporadic, and are initiated by
a rare stochastic change in the secondary structure
of one or a few molecules of protein to form the
abnormal structure. The aberrant isoform of the
PrP is thought to act as a template, causing the
normal conformers to switch to the abnormal
shape, in a cascade effect. Almost 10 per cent of
cases of CJD occur in persons with a family history
of the disorder, and the pattern of disease
transmission is consistent with an autosomal
dominant gene mutation. In most of these families,
mutations are found in the gene for the PrP gene. In
a very small proportion of patients, CJD is
attributable to iatrogenic transmission through
neurosurgery or implantation of stereotactic EEG
electrodes, or to the administration of cadaver-
derived pituitary hormones, or to the use of dura
mater or corneal grafts.1-6
Case control studies
have also reported a weak association between
surgical treatment and the occurrence of CJD,7,8
although there have been no confirmed reports of
surgical transmission of CJD other than through
neurosurgical procedures.
In 1986, bovine spongiform encephalopathy (BSE)
was first identified in cattle in the United Kingdom
(UK). This disease is characterised by appre-
hension, aggression and ataxia, with pathological
brain lesions similar to those seen in human TSEs.
Variant CJD (vCJD) was first reported from the UK
in 1996, and to date (28 September 2000) 73
confirmed cases have been reported to the UK
National CJD Surveillance Unit.9
Patients with this
condition are typically much younger than those
with classical CJD (cCJD), and prominent features
include neuropsychiatric and behavioural
disorders, and abnormal sensory perceptions. The
ContentsEditorial Creutzfeldt-Jakob disease surveillance - Australia at the crossroads? 265
Deferral of blood donation from people who have been in the United Kingdom between 1980 and 1996 267
Drafts for Comment 267
Letter to the Editor 268
Correspondence 268
Surveillance of antibiotic resistance in Neisseria gonorrhoeae in the WHO Western Pacific Region, 1999 269
The WHO Western Pacific Region Gonococcal Antimicrobial Surveillance Programme
Subscription changes 271
An outbreak of multi-resistant Shigella sonnei in a long-stay geriatric nursing centre 272
Brad McCall, Russell Stafford, Sarah Cherian, et al
New publications 275
Cont’d next page
ISSN 0725-3141
Volume 24
Number 9
September 2000

course of the illness is generally longer than that of cCJD,
but is invariably fatal. Spongiform changes seen in the brain
resemble those of kuru more closely than those seen in
cCJD. There is now convincing evidence that the vCJD
epidemic in the UK has been caused by the consumption of
foods contaminated with the BSE agent.10-13
BSE has never
been recorded from Australia, and Commonwealth and
State agricultural authorities carry out an active surveillance
program.
Although iatrogenic transmission of cCJD has been
documented, there is no clinical or epidemiological evidence
that the disease is transmissible by blood or blood products.
There is, however, concern over the possibility that vCJD
may be transmissible by this route, and that circulating
lymphocytes may play a role in the pathogenesis of the
disease. The recent report of experimental transmission of
BSE between sheep by this route14
is thus of concern. Steps
have been taken in the UK to minimise this theoretical risk by
undertaking leukodepletion of the blood supply and sourcing
all plasma from non-European countries. In contrast to
cCJD, the vCJD PrP has been found in the lymphoreticular
tissue of all cases of vCJD studied, and in the appendix of an
asymptomatic person who developed symptoms of vCJD 8
months later.15
Surveillance of human TSEs is conducted by the Australian
CJD Registry, which is funded by the Commonwealth
Government and is located in the Department of Pathology
at The University of Melbourne. CJD is not notifiable, and
accurate case ascertainment is largely dependent on
voluntary reporting by medical practitioners. Mailouts are
posted to neurologists and pathologists semi-annually in an
effort to prompt notification of recent or prospective cases.
Other methods include searches of death certificates, and
review and follow-up of teaching hospital medical records.
Given the unusual presentation of vCJD (with neuro-
psychiatric and behavioural changes presenting early in the
course of the disease) and the possibility that the vCJD prion
may be transmissible through blood, the question arises as
to whether current methods of case ascertainment are
adequate to detect vCJD ante-mortem, and to protect public
health. vCJD has never been recorded in Australia and,
based on the UK experience and the rarity of the disease, it
is possible that a patient may not be seen by a practitioner
with a high index of suspicion early in the course of the
illness. A symptomatic or asymptomatic blood donor could
continue to donate blood for some time before the diagnosis
is considered. Should vCJD be transmissible through the
blood supply, there is a clear potential for iatrogenic
transmission in this manner. It is for this reason that those
visiting Britain for 6 months or more between 1980 and 1996
cannot donate blood in a number of countries (including
Australia) and on 30 August 2000 the Canadian authorities,
following the second report of vCJD in France,16
have
directed that those visiting France for 6 months or more
during that period cannot do so either.17
The time has now
come for enhanced surveillance in Australia of all human
TSEs.
Lance Sanders
Principal Scientist, Surveillance and Management Section,
Population Health Division, Department of Health and Aged
Care, Canberra, ACT.
References
1. Duffy P, Wolf J, Collins G, DeVoe AG, Streeten B, Cowen D.Letter: Possible person-to-person transmission of Creutzfeldt-Jakob disease. N Engl J Med 1974;290:692-693.
2. Will RG, Matthews WB. Evidence for case-to-case transmissionof Creutzfeldt-Jakob disease. J Neurol Neurosurg Psychiatry1982;45:235-238.
3. Thadani V, Penar PL, Partington J et al. Creutzfeldt-Jakobdisease probably acquired from a cadaveric dura mater graft.Case report. J Neurosurg 1988;69:766-769.
4. Fradkin JE, Schonberger LB, Mills JL et al. Creutzfeldt-Jakobdisease in pituitary hormone recipients in the United States.JAMA 1991;265:880-884.
5. Esmonde T, Lueck CJ, Symon L, Duchen LW, Will RG.Creutzfeldt-Jakob disease and lyophilised dura mater grafts:report of two cases. J Neurol Neurosurg Psychiatry 1993;56:999-1000.
6. Centers for Disease Control and Prevention. Creutzfeldt-Jakobdisease associated with cadaveric dura mater grafts – Japan,January 1979 - May 1996. MMWR Morb Mortal Wkly Rep1997:46:1066-1069.
7. Collins S, Law MG, Fletcher A, Boyd A, Kaldor J, Masters CL.Surgical treatment and risk of sporadic Creutzfeldt-Jakobdisease: a case-control study. Lancet 1999;353:693-697.
8. Kondo K, Kuriowa Y. A case control study of Creutzfeldt-Jakobdisease: association with physical injuries. Ann Neurol 1982;11:377-381.
9. United Kingdom Department of Health.www.doh.gov.uk/cjd/stats/sept00.htm.
10. Lasmézas CI, Deslys JP, Demaimay R et al. BSE transmissionto macaques. Nature 1996;381:743-744.
11. Collinge J, Sidle KC, Meads J, Ironside J, Hill AF. Molecularanalysis of prion strain variation and the aetiology of ‘newvariant’ CJD. Nature 1996;383:685-690.
12. Hill AF, Desbruslais M, Joiner S et al. The same prion straincauses vCJD and BSE. Nature 1997;389:448-450.
13. Bruce ME, Will RG, Ironside JW et al. Transmissions to miceindicate that ‘new variant’ CJD is caused by the BSE agent.Nature 1997;389:498-501.
14. Houston F, Foster J D, Chong A et al. Transmission of BSE byblood transfusion in sheep. Lancet 2000;356:999.
15. Hilton DA, Fathers E, Edwards P, Ironside JW, Zajicek J. Prionimmunoreactivity in appendix before clinical onset of variantCreutzfeldt-Jakob disease. Lancet 1998;352:703-704.
16. Oppenheim C, Brandel JP, Hauw JJ, Deslys JP, Fontaine B.MRI and the second French case of vCJD. Lancet 2000;356:253-254.
17. Health Canada. Directive D2000-01.www.hc-sc.gc.ca/hpb-dgps/therapeut/zfiles/english/btox/directiv/d2000-01_0830_e.pdf.
Editorial
Contents, continued
Vaccine preventable diseases and vaccination coverage in Australia, 1993-1998 276
Peter McIntyre, Janaki Amin, Heather Gidding, et al
New Publications, continued 277
Communicable Diseases Surveillance 278
Bulletin Board 293
Overseas briefs 294

Editorial
Deferral of blood donation from peoplewho have been in the United Kingdom
between 1980 and 1996Australian Health Ministers have collectively agreed to defer, for an indefinite period, blood donations from Australians
who have lived or travelled in the United Kingdom for a cumulative period of 6 months or more between 1980 and 1996.
The announcement was made on 21 September 2000 and has attracted considerable media attention.
The period between 1980 and 1996 coincided with the epidemic of Bovine Spongiform Encephalopathy (BSE) in the
United Kingdom. Consumption of meat infected with the BSE agent is thought to be the cause of variant
Creutzfeldt-Jacob disease (vCJD) which was first reported in the UK in 1996.
There have been no cases of vCJD in Australia and no cases of vCJD associated with blood transfusion reported
anywhere in the world. However, in light of recent evidence that BSE may be experimentally transferred by blood in
sheep, the Donor Deferral Working Party recommended to Australian Health Ministers that, as a precautionary
measure, action be taken to defer donors who may have been exposed to BSE when living or travelling in the UK.
This action is in line with other countries such as the USA, Canada and New Zealand. As in these other countries, the
deferral policy will be phased in over a period of 3 months, to avoid jeopardising the availability of blood through the
sudden loss of up to 30,000 donors.
A Fact Sheet providing answers to commonly asked questions is available on the Internet at:
www.health.gov.au/issues.htm. Copies of the Fact Sheet are also available to the general public via the free-call
National Blood Information Line on telephone 1800 351 000.
Blood donors who would like more information should call the Australian Red Cross Blood Donor Information Line on
telephone 131 495. Anyone, who is considering withdrawing as a donor in response to the reports in the media, is
asked to contact their local Australian Red Cross Blood Service to discuss the issue before taking this step. The
Australian Red Cross Blood Service will be writing to all blood donors shortly to provide them with more information.
Drafts for CommentDraft Australian/New Zealand Standard for comment.
Safety in laboratories, Part 3: Microbiology.
DR00254. Revision of AS/NZS 2243.3:1995.
Free electronic version � via ‘Document type = Drafts; Document number = DR00254’� at:
<http://www.standards.com.au/catalogue/amendments/search.asp>
Closing date for comment: 31 October 2000.
UK Food Standards Agency Draft Report on BSE Controls review
This draft report has been available for comment since 5 September on <htpp://www.bsereview.org.uk> from which
there is a link to register to receive updates, FSA BSE digests (!) etc and a link to a <your_say.htm> site enabling
one to comment to FSA on the draft report.
Global Strategy for Containment of Antimicrobial Resistance - Draft WHO/CDS/CSR/DRS/2000.1-DRAFT
The text of the draft is available from <http://www.who.int/emc/globalstrategy/strategy.htm>
Executive Summary (48k)
Part A Introduction & Background (56k)
Part B Appropriate Antimicrobial Use and Emerging Resistance: Issues & Interventions (210k)
Part C Implementation of the Global Strategy (85k)
Part D References & Part E Annexes (185k)
WHO welcomes comments on this draft. Please send them directly to <[email protected]> indicating: Section, page
number and paragraph. The deadline for receipt of comments is 13 November 2000.

Letters to the Editor
Letter to the Editor
Immunisation coverage estimates
Peter McIntyre, Brynley Hull
National Centre for Immunisation Research and
Surveillance of Vaccine Preventable Diseases, Royal
Alexandra Hospital for Children, Westmead, NSW.
To the Editor: Dr Selvey’s concerns1
regarding our article
demonstrating that earlier Australian Childhood
Immunisation Register (ACIR) coverage estimates
should be adjusted upwards based on ACIR data alone2
highlight the importance of local knowledge in interpreting
ACIR data. This has been recognised in the recent ACIR
evaluation, resulting in the new recommendation that
reports from each jurisdiction be made to each meeting of
the ACIR management committee. Although our paper
did not discuss in detail the differences among
jurisdictions, it did reference an earlier paper which
covered this more extensively.3
The recent report on
vaccine preventable diseases and vaccination coverage4
discusses interpretation of ACIR estimates, with
particular attention to those for the Northern Territory, in
some detail.
Dr Selvey’s letter mentions three apparent anomalies.
The first was the finding that jurisdictions with the longest
lag times from encounter date to receipt at the Health
Insurance Commission (HIC) (Queensland and the
Northern Territory) had the lowest increase in coverage
due to late notifications, which was felt to be
counter-intuitive. This observation is a tribute to Dr
Selvey’s careful reading of the Tables, and would have
escaped many readers as it did the authors. As stated in
the paper, long lag times occur in Queensland and the
Northern Territory because data are entered locally
before transmission to the HIC, rather than sent directly
to the HIC by providers. We suspect that this means data
are checked more rigorously before transmission
(reducing errors) and that there is a longer period for
receipt of notifications, both of which would tend to reduce
late notifications.
The second and third anomalies pointed out by Dr Selvey
(a small decrease in MMR coverage and differences
between immunisation history forms and late
notifications) relate only to the Northern Territory. We
agree that the explanation for this is likely to be the high
interstate migration of Northern Territory families. This
effect is much more evident in the Northern Territory
because of its relatively small population, making this a
much higher proportion compared with other jurisdictions.
Finally, Dr Selvey’s letter has provided a helpful and
comprehensive update on progress in adapting and
improving the ACIR to provide maximum utility in the
Northern Territory. Although it is important for readers of
Commun Dis Intell to be aware of these issues, which
probably apply to comparable populations in rural and
remote areas of Australia, we do not believe that they
invalidate the core message of our paper. This was to
emphasise again that immunisation coverage estimates
from the ACIR are minimum estimates and that even
based on the ACIR itself, as opposed to other data
sources, should be revised upwards. In the case of the
Northern Territory, this effect is dwarfed by the other
initiatives and issues referred to by Dr Selvey. Our
updated coverage figures were also able to demonstrate
the impact of catch-up immunisation which is not captured
by the regular cohort-based ACIR quarterly reports. We
believe that these conclusions apply generally across
Australia, and that periodic re-examination of ACIR
coverage estimates in addition to routine reporting is
informative, although the impact of immunisation history
forms should lessen over time.
References
1. Selvey C. Immunisation coverage estimates. Letter.Commun Dis Intell 2000;24:260.
2. Hull BP, McIntyre PB. A re-evaluation of immunisationcoverage estimates from the Australian ChildhoodImmunisation Register. Commun Dis Intell 2000;24:161-164.
3. Hull BP, McIntyre PB, Heath TC, Sayer GP. Measuringimmunisation coverage in Australia. A review of theAustralian Childhood Immunisation Register. Aust FamPhysician 1999; 28: 55-60.
4. McIntyre PB, Amin J, Gidding H et al. Vaccine preventablediseases and vaccination coverage in Australia, 1993-98Commun Dis Intell 2000;24 Suppl (June):54-57.
CorrespondenceLetters to the Editor should be brief and submitted by e-mail to: [email protected]. Authors should adhere to the
CDI instructions for authors (Commun Dis Intell 2000;24:5-6). Letters may be subject to editing.
References should be restricted to material published or in press and be limited in number. Names, initials, contact
telephone and facsimile numbers, and affiliation of all authors should be supplied.

Surveillance of antibiotic resistance inNeisseria gonorrhoeae in the WHO
Western Pacific Region, 1999The WHO Western Pacific Region Gonococcal Antimicrobial Surveillance Programme
1
AbstractA long-term programme of surveillance of antimicrobial resistance in Neisseria gonorrhoeae isolated in the World
Health Organization’s Western Pacific Region Gonococcal Antimicrobial Surveillance Programme ((WHO WPR
GASP) continued in 1999. Over 10,000 gonococci were examined in 18 focal centres. Resistance to the quinolones
and penicillins was already high in many parts of the Western Pacific Region and increased further in most centres,
the exceptions being a number of Pacific Island States. Although resistance to the later generation cephalosporins
was absent, and that to spectinomycin infrequent, options for effective treatment of gonorrhoea in the Western
Pacific Region continue to be limited. Commun Dis Intell 2000;24:269-271.
Keywords: surveillance, Neisseria gonorrhoeae, antimicrobial resistance, gonorrhoea, antibiotics, quinolones, penicillins,spectinomycin, cephalosporins
Introduction
Neisseria gonorrhoeae is, with Haemophilus ducreyi, one of
the few aetiological bacterial agents of sexually transmitted
infection (STI) where antimicrobial resistance (AMR)
seriously compromises disease control. Additionally AMR in
gonococci, by preventing effective treatment of individuals,
increases the rate of complications and morbidity assoc-
iated with gonococcal disease. One further deleterious
consequence of gonorrhoea is the amplification of the rate of
transmission of HIV that occurs in its presence. However,
effective treatment of gonorrhoea removes this effect. It is
therefore important to ensure that gonococcal disease is
properly treated, and this in turn depends to a significant
degree on having relevant data on AMR patterns to guide
selection of treatment regimens.
AMR in gonococci may arise and spread rapidly. The World
Health Organization (WHO) Western Pacific Region (WPR)
includes countries with high rates of STIs and where
different forms of AMR have arisen in the past. Gonococci
resistant to the penicillins, spectinomycin and, more
recently, the quinolone antibiotics had their origins in
countries in the WPR. The potential for spread of AMR
gonococci beyond regional confines is also well established
so that disease acquired in one setting may present in
another. There are thus multiple reasons to ascertain the
prevalence and distribution of AMR in gonococci and modify
treatment regimens accordingly. The WHO WPR
Gonococcal Antimicrobial Surveillance Programme (GASP)
has monitored AMR in gonococci in the region since 1992
and results have been published in Communicable
Diseases Intelligence.1,2
This communication provides an
analysis of surveillance of AMR in N. gonorrhoeae in 18
countries in the WHO WPR in 1999.
Methods
The methods used by the WHO WPR GASP were published
in 19973
and provide full details of the source of isolates,
sample populations, laboratory test methods and quality
assurance programs used to generate data. These methods
were unaltered in 1999. Most isolates were collected from
symptomatic STD clinic patients. As a guide to the
interpretation of the following data, a WHO expert
committee has recommended that treatment regimens be
altered once resistance to a particular antibiotic reaches 5
per cent.4
Results and discussion
About 10,600 gonococcal isolates were examined in 18
participating countries (listed in the acknowledgments) in
1999.
Penicillins
Resistance to the penicillins remained widespread by both
chromosomal and plasmid-mediated mechanisms. Table 1
provides details of chromosomally mediated resistance in
N. gonorrhoeae (CMRNG), penicillinase-producing N. gon-
orrhoeae (PPNG) and/or total penicillin resistance in 18
WPR countries in 1999. Very high rates of all penicillin
resistance (CMRNG + PPNG) were recorded in Korea
(95%), the Philippines (94%), China (88%), Hong Kong SAR
(73%), Brunei (67%), Vietnam (66%), Singapore (56%) and
Mongolia (48%). Resistance to the penicillins in these
countries in 1999 approximated that found in 1998. Of
interest were the low rates of penicillin resistance found in
some Pacific Island States. The Solomon Islands and
Vanuatu had no penicillin resistant strains in 1999 and in
New Caledonia (4%), Fiji (4.8%) and Tonga (5%,) rates
were considerably lower than those observed in other parts
of the region. The exception to this observation was Papua
New Guinea where penicillin resistance was of the order of
59 per cent, equally distributable between PPNG and
Article
1. Corresponding author: Associate Professor John W Tapsall, WHO Collaborating Centre for STD and HIV, Department of Microbiology, The Prince ofWales Hospital, Randwick, NSW, Australia 2031. Telephone: + 61 2 9382 9079. Fax + 61 2 9398 4275. E-mail: [email protected]

CMRNG. The other participants submitting data in 1999
(Australia, Japan, Malaysia and New Zealand) had rates of
penicillin resistance between 8 and 38 per cent.
Quinolones
Resistance to the quinolone antibiotics has become a major
problem in parts of the WPR in recent years and this
situation deteriorated further in 1999. Data from 15 WPR
countries are shown in Table 2 and allow division of
quinolone-resistant strains (QRNG) into ‘less susceptible’
and ‘resistant’ categories on the basis of minimal inhibitory
concentration (MIC) determinations.3
Twelve of 15 WPR
countries detected QRNG in 1999. High proportions of
QRNG were detected in Hong Kong, China, Japan and the
Philippines, maintaining a situation observed in previous
reports. In Hong Kong the percentage of ‘resistant’ QRNG
increased from about 50 per cent in 1998 to about 66 per
cent in 1999. A similar shift to higher MICs in Japan saw the
proportion of ‘resistant’ QRNG there increase from 3 per
cent in 19982
to about 23 per cent in 1999. The proportion of
QRNG also increased significantly in Vietnam in 1999 to
about 50 per cent from 17 per cent in 1998. Most of the
QRNG in Vietnam were in the higher MIC range. Singapore
recorded an increase in resistant strains from 7 per cent in
1998 to 17 per cent in 1999. In both Korea and Australia
there were increases in the percentage of QRNG in the less
susceptible range. In Korea these increased from about 50
per cent to 71 per cent and in Australia from 2 per cent to 14
per cent as a result of spread of QRNG in homosexually
active males. Mongolia reported QRNG data for the first time
and about one third of isolates exhibited some form of
quinolone resistance; 25 per cent of them had high level
resistance. About 17 per cent of strains from Brunei, 3.5 per
cent from New Zealand and 1.8 per cent from Papua New
Guinea were QRNG. No QRNG were found in Malaysia,
New Caledonia or the Solomon Islands in 1999.
Article
Table 1. Penicillin sensitivity of strains of Neisseria gonorrhoeae isolated in 18 countries in the WHO WPR1
in1999
Country No. tested
PPNG2
CMRNG3
All penicillin- resistant
No. % No. % No. %
Australia 3,658 269 7.4 525 14.3 794 21.7
Brunei 64 43 67.0
China 571 127 21.5 338 57.1 465 88.6
Fiji 860 17 1.9 24 2.8 41 4.7
Hong Kong SAR 2,482 233 9.4 1,576 63.5 1,809 72.9
Japan 246 3 1.2 36 14.8 39 16.0
Korea 86 72 84.0 10 12.0 82 95.0
Malaysia 54 13/44 29.0 5 9.3 18 38.3
Mongolia 56 10 17.8 17 30.4 27 48.2
New Caledonia 53 2 3.8
New Zealand 638 18 2.8 34 5.3 52 8.1
Papua New Guinea 343 73/253 28.8 103 30.0 58.8
Philippines 313 294 94.0 0 0.0 294 94.0
Singapore 768 399 51.9 31 4.0 430 55.9
Solomon Islands 21 0 0.0 0 0.0 0 0.0
Tonga 39 1 2.5 1 2.5 2 5.0
Vanuatu 129 0 0.0 0 0.0 0 0.0
Vietnam 194 99 51.0 28 14.4 127 65.5
1. World Health Organization: Western Pacific Region.
2. PPNG = penicillinase-producing N. gonorrhoeae.
3. CMRNG = chromosomally mediated resistance in N. gonorrhoeae.
Table 2. Quinolone resistance in strains of Neisseriagonorrhoeae isolated in 15 countries in theWHO WPR
1in 1999
CountryNo.
tested
Lesssusceptible Resistant
No. % No. %
Australia 3658 500 13.7 128 3.5
Brunei 53 4 7.5 5 9.4
China 591 131 22.1 332 52.8
Hong Kong SAR 2482 697 28.1 1653 66.6
Japan 246 80 32.5 56 22.8
Korea 86 61 71.0 14 16.0
Malaysia 54 0 0.0 0 0.0
Mongolia 56 5 8.9 14 25.0
New Caledonia 53 0 0.0 0 0.0
New Zealand 638 8 1.3 14 2.2
Papua New Guinea 343 1 0.3 5 1.5
Philippines 313 8 2.5 191 61.0
Singapore 768 37 4.8 131 17.0
Solomon Islands 21 0 0.0 0 0.0
Vietnam 194 27 13.9 69 35.6
1. World Health Organization: Western Pacific Region.

Cephalosporins
There were no isolates resistant to the third generation
cephalosporin agents reported in the WPR GASP survey
that examined about 7,250 gonococci from 16 of the
participating countries.
Spectinomycin
Only two isolates, one each in Malaysia and Papua New
Guinea were resistant to spectinomycin amongst about
7,250 gonococci examined in 16 of the participating
countries in 1999. Only very occasional strains resistant to
this injectable antibiotic have been found in recent WPR
surveys.
Tetracyclines
Although tetracyclines are not a recommended treatment for
gonorrhoea, these agents are widely used and readily
available in the WPR. One particular type of resistance is
common in parts of the WPR; this is plasmid-mediated and
gives rise to high-level tetracycline resistant N. gonorrhoeae
(TRNG). About 6,900 gonococci were examined for
high-level tetracycline resistance in 12 of the WPR countries
in 1999 (Table 3). TRNG were again prominent in Malaysia,
Singapore, Vietnam and the Solomon Islands with TRNG
rates between 40 and 74 per cent. Rates below 10 per cent
were seen in Australia, New Zealand and the Philippines.
The TRNG rate increased in China from around 3 per cent in
1998 to nearly 15 per cent in 1999. A similar rate was
observed in Papua New Guinea. TRNG were not detected in
isolates from Korea, Mongolia and Tonga.
The data recorded in 1999 continue trends noted over
several years. Resistance to the penicillins remains
widespread, although some island States have low rates of
resistance. The effectiveness of the quinolone group of
antibiotics continues to decrease and their use in many
countries should be discontinued because of the levels of
resistance present. However, although alternative therapies
are available, their cost limits their use in some settings.
Acknowledgments
The following members of the WHO Western Pacific Region
Gonococcal Antimicrobial Surveillance Programme
supplied data in 1999 for the WPR GASP:
Members of the Australian gonococcal surveillance program
throughout Australia; Nora’Alia Rahim, Brunei; Ye
Shunzhang and Su Xiaohong, Nanjing, China; Sainimere
Bavoro, Suva, Fiji; K M Kam, Hong Kong; Toshiro Kuroki,
Yokohama and Masatoshi Tanaka, Fukuoka, Japan; K Lee
and Y Chong, Seoul, Korea; Rohani Yasin Malaysia;
Erdenechimeg Lkhamsuren, Ulaanbaatar, Mongolia;
B Garin, Noumea, New Caledonia; M Brett, Wellington and
M Brokenshire, Auckland, New Zealand; M V Hombhanje,
Port Moresby, Papua New Guinea; C C Carlos, Manila,
Philippines; Cecilia Ngan and A E Ling, Singapore; A Darcy,
Solomon Islands; Ane Tone Ika, Nuku’alofa, Tonga; H Taleo
Vanuatu; Le Thi Phuong, Hanoi, Vietnam.
References
1. WHO Western Pacific Region Gonococcal SurveillanceProgramme. World Health Organization Western PacificRegion Gonococcal surveillance, 1992 annual report. CommunDis Intell 1994;18:61-63.
2. The WHO Western Pacific Gonococcal AntimicrobialSurveillance Programme. Surveillance of antibiotic resistancein Neisseria gonorrhoeae in the WHO Western Pacific Region,1998. Commun Dis Intell 2000;24:1-4.
3. WHO Western Pacific Region Gonococcal AntimicrobialSurveillance Programme. Surveillance of antibioticsusceptibility of Neisseria gonorrhoeae in the WHO WesternPacific Region 1992-4. Genitourin Med 1997;73:355-361.
4. Anonymous. Management of sexually transmitted diseases.World Health Organization 1997. Document WHO/GPA/TEM94.1 Rev.1 p 37.
Article
Table 3. High-level tetracycline resistance in strainsof Neisseria gonorrhoeae isolated in 12countries in the WHO WPR
1in 1999.
CountryNo.
TestedNo.
TRNG2
% TRNG
Australia 3,658 288 7.8
China 591 86 14.5
Korea 86 0 0.0
Malaysia 54 32 59.0
Mongolia 27 0 0.0
Papua New Guinea 343 54 15.7
New Zealand 638 8 1.3
Philippines 313 16 5.1
Singapore 768 566 73.7
Solomon Islands 21 12 57.0
Tonga 39 0 0.0
Vietnam 195 79 40.5
1. World Health Organization: Western Pacific Region.
2. TRNG = tetracycline-resistant N. gonorrhoeae.
Subscription changesPlease note that as of September 2000 there has been a change regarding subscriptions to Communicable Diseases
Intelligence. All new subscriptions and changes of address details should now be addressed to:
CDI Mailing
Surveillance and Management Section
Department of Health and Aged Care
GPO Box 9848 (MDP 6)
CANBERRA ACT 2601
They can also be sent by E-mail to [email protected] or facsimile to: (02) 6289 7791.

An outbreak of multi-resistant Shigellasonnei in a long-stay geriatric nursing
centreBrad McCall,
1Russell Stafford,
1Sarah Cherian,
1Karen Heel,
1Helen Smith,
2Nick Corones,
3Sharon Gilmore
3
AbstractAn outbreak of Shigella sonnei infection in a long-stay nursing centre was detected during routine surveillance of
notifications in July 1999. Subsequent investigations identified 13 cases of multi-resistant S. sonnei infection
affecting nine staff, three community members associated with the centre and one resident of the centre. Each
isolate of S. sonnei was genetically indistinguishable. The outbreak investigation identified contact with residents
with vomiting and diarrhoea as a significant risk factor for infection amongst staff providing nursing care. This
association, and the duration of the outbreak over several months, suggests that transmission was most likely
person-to-person. This outbreak demonstrates the importance of infection control policies and hygiene measures in
long-stay nursing facilities. Commun Dis Intell 2000;24:272-275.
Keywords: shigellosis, infection control, nursing home, multi-resistant, gastroenteritis, enteric precautions
Introduction
Shigella spp. are a leading cause of bacillary dysentery
worldwide and a major cause of diarrhoeal disease in
developing countries.1
In Australia, most Shigella boydii and
Shigella dysenteriae infections are acquired overseas, while
Shigella flexneri infection occurs predominantly in
indigenous populations. Shigella sonnei infection is usually
locally acquired (John Bates, Queensland Health Scientific
Services, personal communication).
In July 1999 routine surveillance of disease notifications by
the Brisbane Southside Public Health Unit (BSPHU)
detected a cluster of multi-resistant Shigella sonnei
infections involving six adult females in the Brisbane South/
South Coast area. All six isolates demonstrated the same
antibiotic resistance pattern. Preliminary investigations
identified these cases as part of an outbreak of diarrhoeal
disease associated with a long-stay nursing centre. This
paper describes the epidemiological, microbiological and
environmental features of the outbreak investigation.
Methods
Preliminary investigation
All six female cases were administered a standard question-
naire regarding their demographic details, occupations,
symptoms, food history, travel and other potential
exposures. These preliminary interviews found five of the six
cases to be nursing staff from the same long-stay nursing
centre. The sixth case acquired her infection whilst travelling
overseas. An outbreak investigation was commenced to
determine the source of infection and the vehicle of trans-
mission, and to introduce control measures to prevent
further spread of the disease.
Epidemiology
The epidemiological study involved a descriptive study of
residents of the nursing centre, and an analytical study
(retrospective cohort) of the staff. A retrospective review
was also conducted of all cases of S. sonnei notified to the
BSPHU in 1999.
(i) Descriptive
Epidemiological investigations were commenced on 26 July
1999. The nursing centre had two wings and the nurse
managers of each provided information about nursing home
residents. Demographic and clinical data for the 4-week
study period (28 June to 26 July 1999) were abstracted from
the medical records of each resident. Information on food
history was collected from the nurse managers because of
the residents’ age and potential for poor recall. Faecal
specimens were requested from any resident who had a
history of gastrointestinal illness during the 4-week study
period.
(ii) Cohort Study
To collect information from all staff members covering the
study period, a retrospective cohort study was conducted
using a specific self-administered questionnaire. This
included demographic information, occupational duties,
movements and workplace location, symptoms, pathology
requested and other clinical details among ill staff. A case
was defined as any staff member who had an illness
characterised by diarrhoea, vomiting or abdominal pain and
had laboratory confirmed S. sonnei in their stool since
28 June 1999.
Univariate and stratified analyses of the data were
conducted using Epi Info v6.04b.2
Relative risks with 95 per
Article
1. Brisbane Southside Public Health Unit, Coopers Plains, Queensland.
2. Public Health Microbiology, Queensland Health Scientific Services, Coopers Plains, Queensland.
3. South Coast Public Health Unit, Southport, Queensland.
Corresponding author: Dr Brad McCall, Brisbane Southside Public Health Unit, PO Box 333, Archerfield, Queensland, Australia, 4108. Telephone:(07) 3000 9148. Fax: (07) 3000 9130. E-mail: [email protected].

cent confidence intervals were calculated. Significance of
associations between exposure and illness were deter-
mined using Chi-square and Fischer’s exact tests.
Microbiology
All staff were asked to provide a faecal specimen for
microscopy, culture and sensitivity testing. Staff of the
Public Health Microbiology Laboratory, Queensland Health
Scientific Services, examined clinical isolates. S. sonnei
strains were biochemically identified using the API 20E strip
(bioMerieux Australia Pty Ltd) and biotyped using the
Pasteur Institute methods.3
All Shigella isolates from this outbreak were tested for
antibiotic sensitivity using the Vitek Gram-negative
sensitivity card (bioMerieux Australia Pty Ltd). The isolates
were compared for susceptibility to ampicillin, cephalothin,
cefotaxime, ciprofloxacin, trimethoprim-sulfamethoxazole,
amoxicillin-clavulanate, chloramphenicol and gentamicin.
The isolates were also compared with other community-
derived isolates using Pulsed Field Gel Electrophoresis
(PFGE).
Environmental
Staff from the BSPHU and South Coast Public Health Unit
inspected food preparation and handling, and laundry and
toilet facilities at the nursing centre. Environmental swabs
taken of the kitchen preparation surfaces and communal
handtowels were examined for Shigella. Standard enteric
precautions, including hand washing, disposal of contamin-
ated materials and disinfection methods were reviewed with
staff.
Results
Epidemiology
The retrospective review of notified cases identified two
cases with onset in April 1999 with a similar sensitivity
pattern to those cases involved in the nursing centre
outbreak in July. These cases occurred in siblings aged 3
and 8 years. The mother of these two children was a staff
member of the nursing centre. She had symptoms of
abdominal pain and diarrhoea 1 week before her children,
but no specimens were requested at the time.
During the outbreak investigation a subsequent case of
S. sonnei was notified to the BSPHU. This case occurred in
a 9 year old male who was a family member of a friend of a
staff member.
Descriptive
The nursing centre contained 81 residents (age range 50 to
100 years) living in two wings, 43 in Wing A and 38 in
Wing B. During the study period 13 residents had developed
symptoms of gastrointestinal illness, seven from wing A and
six from wing B. Following the commencement of the
investigation, faecal specimens were collected from these
13 residents, only one of whom was symptomatic. S. sonnei
infection was detected in one resident from Wing B.
Cohort Study
Questionnaires were completed by 71/75 staff (95%
response rate). Three non-responders were on recreational
leave and one was on unrelated sick leave during the study
period. Median age of staff was 45 years, with a range from
19 to 60 years. There were 68 female and three male staff -
39 Assistants In Nursing (AIN) (55%), 12 Registered Nurses
(RN) (17%), nine domestic kitchen staff (13%), three
cleaners (4%), two laundry staff, two diversional therapists,
one physiotherapist, one cook, one handyman and one
secretary. Fifty-four staff (76%) handled food in the course
of their duties. Of these, 44 were involved in the feeding of
residents and 10 were involved in preparation of food. One
of the nine domestic kitchen staff was symptomatic towards
the end of the outbreak, but stool culture was negative.
Thirteen staff, including the five cases originally identified,
gave a history of gastrointestinal illness during the study
period. Eight of these and one asymptomatic staff member
were confirmed with S. sonnei infection. All nine positive
staff were female, eight AIN and one RN. The median age of
those infected was 38.5 years (range 19 to 56 years).
Symptoms among the eight symptomatic staff with
confirmed S. sonnei infection included diarrhoea (100%),
fever (87.5%), abdominal cramps (87.5%), vomiting (75%),
nausea (62.5%) and blood in stools (37.5%). Their dates of
onset are shown in the Figure. The median duration of
illness was 7 days (range 2 to 16 days). Seven of the eight
consulted a medical practitioner and three required
hospitalisation for 1 to 4 days. Four were treated with
antibiotics, two with ciprofloxacin and two with norfloxacin.
In the 3 days before their illness only two of the nine staff
with confirmed Shigella infection had consumed food
prepared in the nursing home kitchen.
Staff employed as AIN were almost seven times more likely
to be infected with S. sonnei than all other staff in the nursing
centre (Relative Risk 6.6, 95% Confidence Interval 0.9-49.8,
P = 0.04). RN were 40 per cent less likely to be infected than
other staff members but this was not significant (RR 0.61,
95% CI 0.08-4.47, P=1.0). No other staff were associated
with infection. Furthermore, there was no association
between occupational duties requiring food handling and
S. sonnei infection.
Staff who worked in wing B only during the first 3 weeks of
this outbreak were at a significantly higher risk of infection
than other staff (RR 3.4, 95% CI 1.0-11.4, P = 0.05). During
this study period, staff who had person-to-person contact
(providing nursing care) with any nursing home residents
who had been ill with diarrhoea and vomiting were at
significantly higher risk of S. sonnei infection than other staff
Article
0
1
2
3
4
5
26/0
4
03/0
5
10/0
5
17/0
5
24/0
5
31/0
5
07/0
6
14/0
6
21/0
6
28/0
6
05/0
7
12/0
7
19/0
7
26/0
7
02/0
8
Week beginning
Nu
mb
er
of
ca
se
s
Community cases
Staff
Residents
Figure. Laboratory-confirmed Shigella sonneicases of illness, 1999, by date of onset

(RR undefined, 95% CI undefined, P = 0.02). Similarly staff
whose duties involved cleaning faeces and vomitus from ill
residents were also at significantly higher risk (RR
undefined, 95% CI undefined, P = 0.008).
Microbiology
S. sonnei was detected in nine staff members (attack rate
13%), one resident and three community members
associated with the centre. All S. sonnei isolates associated
with this outbreak had the API profile number 1104112, and
were biotype ‘a’. Antibiotic sensitivity testing revealed that
all were uniformly resistant to ampicillin, amoxycillin-
clavulanate and trimethoprim-sulfamethoxazole, and were
uniformly sensitive to ciprofloxacin, cefotaxime and
gentamicin. Pulsed Field Gel Electrophoresis using 11
outbreak isolates, including one of the initial community
cases and the most recent community case, confirmed that
the isolates were genetically indistinguishable. Comparison
of two outbreak isolates with six unrelated community
isolates showed that the outbreak isolates were different
from other circulating strains of S. sonnei.
Environmental
No Shigella isolates were obtained from any of the
environmental swabs or the communal handtowels. Advice
was provided concerning several minor aspects relating to
food handling and hygiene.
Discussion
Few outbreaks of shigellosis in long-stay nursing centres
have been reported. In one, nine patients and three staff had
positive stool cultures for S. sonnei.4
The source of infection
in the index case, a long-stay patient with few outside
contacts, was not found. In another outbreak, six patients
and one staff member had confirmed S. sonnei infection.5
A
factor in that outbreak was gastrointestinal illness in two staff
members 5 and 8 days respectively before the first patients
showed symptoms. These staff had continued to work
despite their illnesses.
This is the first outbreak of multi-resistant S. sonnei in a
long-stay nursing centre described in Australia. The index
case of this outbreak could not be reliably determined.
However, the detection of identical isolates several months
apart in community members associated with the centre, but
different from other community isolates, suggests that the
outbreak was sustained over a period of months (Figure).
Factors playing a role in this might include staff continuing to
work despite illness and the use of communal handtowels
throughout the centre. Both aspects were addressed during
the outbreak investigation.
In this outbreak no source or vehicle of transmission was
identified, and food did not appear to be involved. Evidence
suggested that the mode of transmission was person-
to-person, facilitated by lack of attention to basic infection
control practices and enteric precautions while cleaning
patients who were symptomatic. The significant association
between S. sonnei infection and AIN � but not other
occupations � supports this hypothesis because the AIN are
the principal carers involved in showering and cleaning
residents and clearing up vomitus and faeces. Use of gloves
was part of the centre’s infection control policy. Although
available, their use was not evident during the first
inspection of the centre. Public health advice included
instruction in infection control procedures such as hand
washing, disinfection, use of gloves, soap dispensers, paper
towels and enteric precautions. Exclusion of ill staff (until
recovered) and food handlers (for 48 hours after their first
normal stool), and restriction of staff movement between
wards, was recommended.6
No further cases were reported
after these interventions.
This outbreak differs from others described in the literature
because of the high proportion of staff involved. However,
we cannot exclude the possibility of more widespread
infection in residents because only 1/13 symptomatic
residents had stool specimens collected while symptomatic.
The increased risk among staff (especially in Wing B) of
S. sonnei infection through person-to-person contact with ill
residents also suggests that there may have been more
cases among residents than were identified during the
investigation. According to the nurse managers, diarrhoea
(frequent loose stools) was common among the patients
because of laxative use. It is possible that the outbreak was
propagated by a combination of residents with diarrhoea
and inadequate hygiene measures, resulting in staff
becoming infected.
Antibiotic sensitivity, plasmid profile and PFGE are useful
methods to characterise and compare S. sonnei isolates
from sporadic and outbreak situations.7,8
One advantage of
PFGE is the relative stability of the patterns over time,
allowing identification of outbreak strains despite loss (or
acquisition) of plasmids. Consequently, PFGE is being used
more often for subtyping of S. sonnei from clusters or
outbreaks.1,9,10
In this investigation the biochemical profile,
antibiograms, biotype and PFGE were identical for all
isolates. PFGE also demonstrated that the outbreak
subtype was distinct from sporadic community S. sonnei
isolates detected elsewhere in Queensland independent of
this outbreak.
Long-stay nursing centres present an environment in which
outbreaks of enteric disease can have significant health
consequences for staff and residents. The occurrence of
this outbreak demonstrates the important role of public
health interventions and regular attention to infection control
policy and practice � including fundamental matters such as
hygiene and exclusion of ill staff. It is to be hoped that the
long-stay nursing care industry heeds the messages
learned from this outbreak.
Acknowledgments
Staff of Brisbane Southside and South Coast Public Health
Units, Queensland Health; Lyn Caldwell, Microbiology
Department, Mater Misericordiae Public Hospital, South
Brisbane; Dr John Sheridan; John Bates and staff, Public
Health Microbiology Laboratory, Queensland Health
Scientific Services. Data from NEPSS at the Microbiological
Diagnostic Unit, The University of Melbourne.
References
1. Soebel J, Cameron DN, Ismail J et al. A prolonged outbreak ofShigella sonnei infections in traditionally observant Jewishcommunities in North America caused by a molecularly distinctbacterial subtype. J Infect Dis 1998;177:1405-1409.
2. Dean AG, Dean JA, Coulombier D et al. Epi Info, version 6.04b:a word processing, database, and statistics system forepidemiology on microcomputers (computer program). Atlanta,Georgia: Centers for Disease Control and Prevention, 1997.
Article

3. Marranzano M, Giammanco G, d’Hauteville H, Sansonetti P.Epidemiological markers of Shigella sonnei infections:R-plasmid fingerprinting, phage-typing and biotyping. Ann InstPasteur Microbiol 1985;136A:339-345.
4. Hunter PR, Hutchings PG. Outbreak of Shigella sonneidysentery on a long-stay psychogeriatric ward. J Hosp Infect1987;10:73-76.
5. Horan MA, Gulati RS, Fox RA, Glew E, Ganguli L, Kaeney M.Outbreak of Shigella sonnei dysentery on a geriatricassessment ward. J Hosp Infect 1984;5:210-212.
6. Working Party of the PHLS Salmonella Committee. Theprevention of human transmission of gastrointestinal infections,infestations, and bacterial intoxications. A guide for publichealth physicians and environmental health officers in Englandand Wales. Commun Dis Rep CDR Rev 1995;5:R158-R172.
7. Maguire HC, Seng C, Chambers S et al. Shigella outbreak in aschool associated with eating canteen food andperson-to-person spread. Commun Dis Public Health1998;1:279-280.
8. Brian MJ, Van R, Townsend I, Murray BE, Cleary TG, PickeringLK. Evaluation of the molecular epidemiology of an outbreak ofmultiply resistant Shigella sonnei in a day care center by usingpulsed-field gel electrophoresis and plasmid DNA analysis. JClin Microbiol 1993;31:2152-2156.
9. Centers for Disease Control. Outbreaks of Shigella sonneiinfection associated with eating fresh parsley - United Statesand Canada, July-August 1998. MMWR Morb Mortal Wkly Rep1999;48:285-289.
10. Adams C, Torvaldsen S, Watson T, Roberts C. Investigation ofan outbreak of Shigella sonnei at a Perth restaurant. WACommun Dis Bull 1997;7(3):9-10.
Article
New publications
Overcoming Antimicrobial Resistance
World Health Organization Report on Infectious Diseases 2000. 67pp.
Electronic version at: www.who.int/infectious-disease-report/2000/index.html
Table of Contents
Preface: Our Window of Opportunity is Closing
Chapter 1: A World Without Antibiotics
Chapter 2: The Discovery of Antimicrobials
Chapter 3: Factors Contributing to Resistance
Chapter 4: The Big Guns of Resistance
Chapter 5: Call to Action
Epilogue
National Hepatitis C Strategy 1999-2000 to 2003-2004
Commonwealth Department of Health and Aged Care. Canberra: Commonwealth of Australia, 2000. 76pp.
<http://www.health.gov.au/pubhlth/publicat/document/metadata/hepc_strat9900_0304.htm>
<http://www.health.gov.au/pubhlth/publicat/document/hepc_strat9900_0304.pdf>
Changes and Challenges. National Hepatitis HIV/AIDS Strategy 1999-2000to 2003-2004
Commonwealth Department of Health and Aged Care. Canberra: Commonwealth of Australia, 2000. 50pp.
<http://www.health.gov.au/pubhlth/publicat/document/metadata/hivstrat_4.htm>
<http://www.health.gov.au/pubhlth/publicat/document/hivstrat_4.pdf>
Hepatitis C: Informing Australia’s National Response
Commonwealth Department of Health and Aged Care ed. Canberra: Commonwealth of Australia, 2000. 185pp.
<http://www.health.gov.au/pubhlth/publicat/document/metadata/hepc_informing.htm>
<http://www.health.gov.au/pubhlth/publicat/document/hepc_informing.pdf>
HIV/AIDS, Hepatitis C and Sexually Transmissible Infections in AustraliaAnnual Surveillance Report 2000
National Centre in HIV Epidemiology and Clinical Research (ed). Sydney: National Centre in HIV Epidemiology and
Clinical Research, The University of New South Wales. 2000:96pp.
Electronic version at: <http://www.med.unsw.edu.au/nchecr>

Vaccine preventable diseases and vaccinationcoverage in Australia, 1993-19981
Peter McIntyre, Janaki Amin, Heather Gidding, Brynley Hull, Siranda Torvaldsen, Andrew Tucker,
Fiona Turnbull, Margaret Burgess,
The National Centre for Immunisation Research and Surveillance of Vaccine Preventable Diseases (NCIRS)
Introduction
Since the introduction of childhood vaccination for diphtheria
in 1932 and the widespread use of vaccines to prevent
tetanus, pertussis (whooping cough) and poliomyelitis in the
1950s, deaths in Australia from vaccine preventable
diseases (VPDs) have declined by more than 99 per cent. It
is important, however, that the downward trend in morbidity
and mortality from VPDs is maintained and carefully
monitored, and that changes are interpreted in relation to
vaccination coverage.
This report aimed to bring together information from three
national sources of routinely collected data on the morbidity
and mortality from VPDs during the period 1993–1998 for
the eight diseases then on the routine childhood vaccination
schedule, and for four other diseases potentially
preventable by childhood vaccination. It also examined
vaccination coverage for the same period.
Methods
Data were sourced from the National Notifiable Diseases
Surveillance System (NNDSS) (notifications), the Australian
Institute of Health and Welfare (AIHW) National Hospital
Morbidity Database (hospitalisation data), and the Aust-
ralian Bureau of Statistics (ABS) Causes of Death Collection
(deaths). Vaccination coverage was calculated using data
from the Australian Childhood Immunisation Register
(ACIR). All data sources were expected to have some
limitations, the most important being under-reporting for
notifications and vaccination encounters, and coding errors
in the hospital morbidity data. For each disease, trends over
time, measures of severe morbidity and mortality, and age,
sex, and geographical distributions were reported, together
with a discussion of these data.
Overview of results
Notifications for the eight diseases covered by the routine
schedule declined by 42 per cent, from an average of 11,537
cases each year in 1993–1997 to 6700 in 1998. Hospital-
isations fell by 12 per cent, from an average of 1745 per year
to 1536 in 1997/1998, while deaths remained unchanged at
7 each year over the period of review (Table). Tetanus
caused 1 or 2 of the deaths each year. Of the 7 deaths in
1997, 6 were in infants during a major outbreak of pertussis.
Pertussis caused the most notifications, hospitalisations
and deaths during the review period. While most of these
were in children, 46 per cent of the notifications and 13 per
cent of the hospitalisations for pertussis occurred in persons
aged 15 years or more. There were notable declines in the
numbers of notifications of invasive Haemophilus influenzae
type b (Hib) disease in children under 5 years of age (77%),
measles (87%) and rubella (75%). There were no notifi-
cations of diphtheria or poliomyelitis.
Vaccination coverage � estimated using ACIR data �increased during the review period. Coverage for the first
three doses of diphtheria, tetanus, pertussis and Hib
Summary report
1. Commun Dis Intell 2000;24 Suppl (June):1-83.
Table. Notifications, hospitalisations and deaths from diseases preventable by vaccines on the currentchildhood vaccination schedule, Australia, 1993–1998.*
Disease
Notifications Hospitalisations Deaths
Average per year1993-1997 1998
Average per yearJuly 93-June 97 1997/98
Average per year1993-1996 1997
Diphtheria 0 0 5 0 0 0
Hib (aged <5 yrs) 103†
24 129 80 3 0
Measles 2,418 313 517 156 2 0
Mumps 116‡
181 55 51 1 0
Pertussis 5,887 5,413 910 1,165 0 6
Polio 0 0 4§
2§
0 0
Rubella 3,006†
762 99 48 0 0
Tetanus 8 7 28 34 2 1
Total 11,537#
6,700 1,745#
1,536 7#
7
* Notifications where the month of onset was between January 1993 and December 1998; hospitalisations where the month of admission was between 1July 1993 and 30 June 1998; deaths where the date of death was recorded between 1993 and 1997.
†Not all States/Territories were reporting in all years (see Appendix 2 of report for details).
‡Only the ACT, NSW and Victoria reported mumps notifications for the entire period. For these States/Territories the average number of mumpsnotifications per year from 1993 through 1997 was 78 and there were 96 notifications in 1998.
§Principal diagnosis only (see page 27 of report for comment).
#Average per year for the total does not equal the sum of that for each disease, due to rounding.

vaccines, assessed at 1 year of age, increased from 75 per
cent to 85 per cent, while coverage for measles-mumps-
rubella (MMR) vaccine, assessed at 2 years of age,
increased from 83 per cent to 86 per cent. It is likely that
these data underestimated coverage by 5 to 10 per cent,
and that the increase in coverage partly reflected better
reporting to the ACIR by providers.
Comment
This is the first comprehensive report on VPDs and
vaccination coverage in Australia using multiple data
sources. It provides a valuable baseline for ongoing
measurement of trends and the impact of interventions. The
striking features were the low rates of VPDs in 1998.
Notable are the marked decline in Hib disease, following the
introduction of routine Hib vaccination in 1993, and in both
measles and rubella due to the introduction of the second
dose of MMR vaccine in 1994 and the Measles Control
Campaign in 1998. Compared with deaths prior to the
introduction of routine Hib vaccination, Hib deaths in
children under the age of 5 years fell by 83 per cent,
suggesting that Hib vaccine prevented 62 deaths in this age
group between 1993 and 1997. The ongoing morbidity and
mortality from pertussis indicates the need for additional
interventions aimed at controlling spread of this infection in
both children and adults.
Want more information?
Data giving historical comparisons of deaths from diseases
commonly vaccinated against in Australia 1926-97 are
found in Table 2 of the full report. The burden of morbidity
and mortality from vaccine preventable diseases in Australia
are found in Table 14 of the full report.
Copies of the report can be obtained from:
The Publications Officer
Publications Unit (MDP 129)
Department of Health and Aged Care
GPO Box 9848
Canberra, ACT
Australia 2601
Or by calling the toll free telephone number: 1800 020 103
ext 8654.
This publication is also available at:
http://www.health.gov.au/pubhlth/publicat/document/cdi/
vpd93_98.htm.
Summary report
New Publications, continued
Guidelines for the control of measles outbreaks in Australia – July 2000
This revision1
of the 1996 National Health and Medical Research Council report Measles: Guidelines for the Control of
Outbreaks in Australia was undertaken by a working group of the Measles Elimination Advisory Committee (MEAC)
which was established in 1997. Australia’s move from the ‘outbreak control’ phase to the ‘elimination’ phase of measles
elimination precipitated the revision. This shift in strategy involves altering the vaccination schedule, improving
surveillance systems and the response to outbreaks, and reducing the susceptibility of at-risk age groups. The
guidelines are intended for use primarily by public health officers in State and Territory health departments. However,
selected aspects of the guidelines are recommended for use by institutions and health-care facilities that, and
professionals who, might be affected by measles. These include child-care facilities, schools, technical colleges,
universities, prisons, diagnostic and public health laboratories, general practitioners, paediatricians, physicians and
pathologists.
Let’s Work Together to Beat Measles
This publication2
reports on Australia’s Measles Control Campaign. Steps to eliminate measles in Australia commenced
in 1998 with the implementation of the ’Immunise Australia: Seven Point Plan’. The Measles Control Campaign was
conducted by the Commonwealth in conjunction with the States and Territories. The campaign has resulted in a
significant increase in levels of protection against measles among children of preschool and primary school age. The
report describes the reasons behind the campaign, progress on elimination strategies and the results to date, and future
strategies for measles elimination.
Both publications depict different aspects of measles elimination and each supplements the other. Copies can be
obtained from:
The Publications Officer
Publications Unit (MDP 129)
Population Health Division publications
Department of Health and Aged Care
GPO Box 9848
CANBERRA ACT 2601
AUSTRALIA
or Toll free telephone number: 1800 020 103, ext 8654 or E-mail: [email protected]
1. Measles Elimination Advisory Committee. Guidelines for the control of measles outbreaks in Australia. Commun Dis Intell2000;Technical Report Series No 5.
2. Commonwealth Department of Health and Aged Care. Let’s work together to beat measles. Canberra: Commonwealth ofAustralia, 2000.

Communicable Diseases Surveillance
Presentation of NNDSS data
In the March 2000 issue an additional summary table was introduced. Table 1 presents 'date of notification' data, which is a
composite of three components: (i) the true onset date from a clinician, if available, (ii) the date the laboratory test was
ordered, or (iii) the date reported to the public health unit. Table 2 presents the crude incidence of diseases by State or
Territory for the current reporting month. Table 3 presents data by report date for information only. In Table 3 the report date
is the date the public health unit received the report.
Table 1 now includes the following summary columns: total current month 2000 data; the totals for previous month 2000 and
corresponding month 1999; a 5 year mean which is calculated using previous, corresponding and following month data for
the previous 5 years (Morb Mortal Wkly Rep, 2000:49;139-146); year to date (YTD) figures; the mean for the year to date
figures for the previous 5 years; and the ratio of the current month to the mean of the last 5 years.
Highlights for August, 2000
Communicable Disease Surveillance Highlights report on data from various sources, including the National NotifiableDiseases Surveillance System (NNDSS) and several disease specific surveillance systems that provide regular reports toCommunicable Diseases Intelligence. These national data collections are complemented by intelligence provided by Stateand Territory communicable disease epidemiologists and/or data managers who have recently formed a Data ManagementNetwork. This additional information has enabled the reporting of more informative highlights each month.
The NNDSS is conducted under the auspices of the Communicable Diseases Network Australia New Zealand and the CDIVirology and Serology Laboratory Reporting Scheme (LabVISE) is a sentinel surveillance scheme. In this report, data fromthe NNDSS are referred to as ‘notifications’ or ‘cases’, whereas those from ASPREN are referred to as ‘consultations’ or‘encounters’ while data from the LabVISE scheme are referred to as ‘laboratory reports’.
Three types of data are included in National Influenza Surveillance, 2000. These are sentinel general practitionersurveillance conducted by the Australian Sentinel Practice Research Network (ASPREN), the Department of HumanServices (Victoria), the Department of Health (New South Wales) and the Tropical Influenza Surveillance Scheme, TerritoryHealth Services (Northern Territory); laboratory surveillance data from the Communicable Diseases Intelligence Virologyand Serology Laboratory Reporting Scheme (LabVISE); and the World Health Organization Collaborating Centre forInfluenza Reference and Research; and absenteeism surveillance conducted by Australia Post. Data from ASPREN arereferred to as 'consultations' or 'encounters'. For further information about these schemes, see Commun Dis Intell2000;24:9-10.
In August 2000 the number of reports of some diseases has
increased compared with their 5 year mean; these include
incident hepatitis B (1.6), incident hepatitis C (2.2),
chlamydial infection (1.5), malaria (1.5), legionellosis (1.5)
and meningococcal infection (1.3).
Typhoid
There were four notifications of typhoid in August 2000 with
three cases in New South Wales (29 year-old male, 29 year
old female and a 36 year old male) and one case in Victoria
(15 year old male).
Vaccine preventable diseases
All vaccine preventable diseases except mumps and
pertussis had fewer reports this month than for the 5 year
mean. The increase in the notification rate (1.1/100,000
population) for mumps was due to an increase in Western
Australia (2.6/100,000 population) and New South Wales
(1.9/100,000 population). The increase in the notification
rate (34.6/100,000 population) (Figure 1) for pertussis was,
as last month, due to an increase in the Australian Capital
Territory (130.2/100,000 population) and New South Wales
(64.6/100,000 population). Measles cases continued to be
at their lowest level since the national notification system
began (Figure 2). Of the two cases in August 2000, one
Communicable diseases surveillance Highlights for August, 2000
0
50
100
150
Jan
1991
Jan
1992
Jan
1993
Jan
1994
Jan
1995
Jan
1996
Jan
1997
Jan
1998
Jan
1999
Jan
2000Notification
rate
per
100,0
00
popula
tion
Australia
NSW
ACT
Figure 1. Notification rate of pertussis, New SouthWales, Australian Capital Territory andAustralia, 1 January 1991 to 31 August2000, by month of notification
each was reported in New South Wales (28 year-old male)
and Western Australia (1 year-old female).
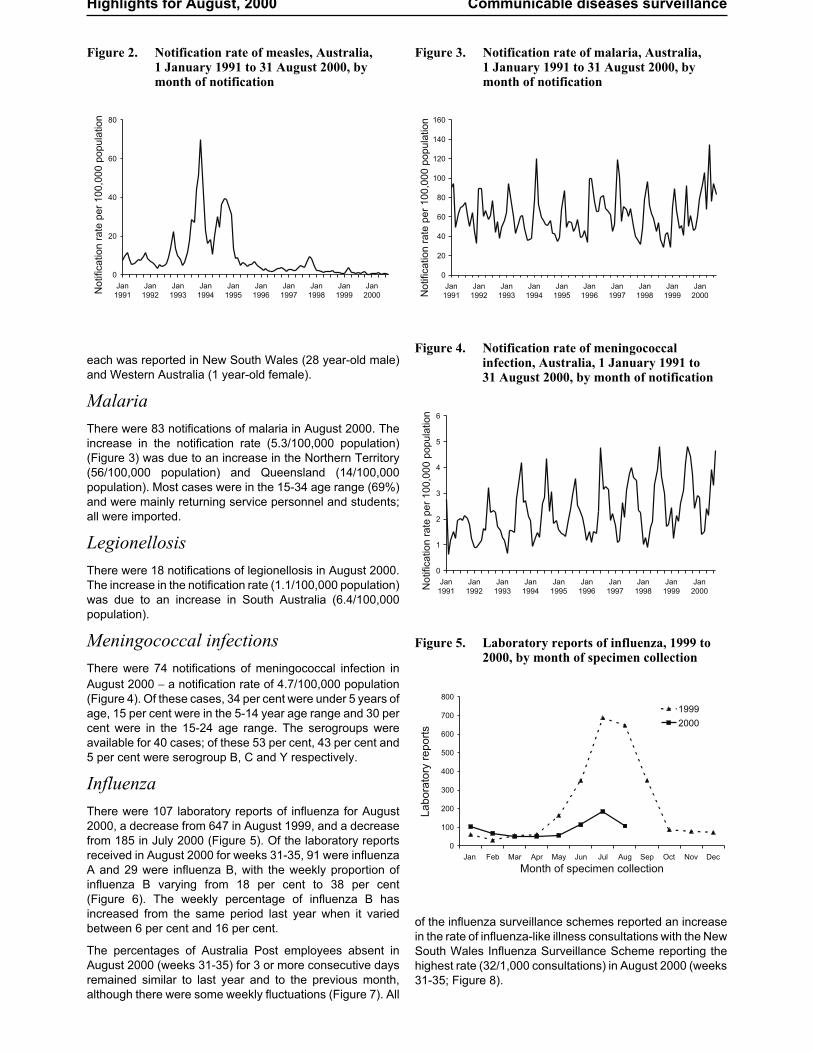
Malaria
There were 83 notifications of malaria in August 2000. The
increase in the notification rate (5.3/100,000 population)
(Figure 3) was due to an increase in the Northern Territory
(56/100,000 population) and Queensland (14/100,000
population). Most cases were in the 15-34 age range (69%)
and were mainly returning service personnel and students;
all were imported.
Legionellosis
There were 18 notifications of legionellosis in August 2000.
The increase in the notification rate (1.1/100,000 population)
was due to an increase in South Australia (6.4/100,000
population).
Meningococcal infections
There were 74 notifications of meningococcal infection in
August 2000 � a notification rate of 4.7/100,000 population
(Figure 4). Of these cases, 34 per cent were under 5 years of
age, 15 per cent were in the 5-14 year age range and 30 per
cent were in the 15-24 age range. The serogroups were
available for 40 cases; of these 53 per cent, 43 per cent and
5 per cent were serogroup B, C and Y respectively.
Influenza
There were 107 laboratory reports of influenza for August
2000, a decrease from 647 in August 1999, and a decrease
from 185 in July 2000 (Figure 5). Of the laboratory reports
received in August 2000 for weeks 31-35, 91 were influenza
A and 29 were influenza B, with the weekly proportion of
influenza B varying from 18 per cent to 38 per cent
(Figure 6). The weekly percentage of influenza B has
increased from the same period last year when it varied
between 6 per cent and 16 per cent.
The percentages of Australia Post employees absent in
August 2000 (weeks 31-35) for 3 or more consecutive days
remained similar to last year and to the previous month,
although there were some weekly fluctuations (Figure 7). All
of the influenza surveillance schemes reported an increase
in the rate of influenza-like illness consultations with the New
South Wales Influenza Surveillance Scheme reporting the
highest rate (32/1,000 consultations) in August 2000 (weeks
31-35; Figure 8).
Highlights for August, 2000 Communicable diseases surveillance
0
20
40
60
80
Jan
1991
Jan
1992
Jan
1993
Jan
1994
Jan
1995
Jan
1996
Jan
1997
Jan
1998
Jan
1999
Jan
2000Notification
rate
per
100,0
00
popula
tion
Figure 2. Notification rate of measles, Australia,1 January 1991 to 31 August 2000, bymonth of notification
0
20
40
60
80
100
120
140
160
Jan
1991
Jan
1992
Jan
1993
Jan
1994
Jan
1995
Jan
1996
Jan
1997
Jan
1998
Jan
1999
Jan
2000Notification
rate
per
100,0
00
popula
tion
Figure 3. Notification rate of malaria, Australia,1 January 1991 to 31 August 2000, bymonth of notification
0
1
2
3
4
5
6
Jan
1991
Jan
1992
Jan
1993
Jan
1994
Jan
1995
Jan
1996
Jan
1997
Jan
1998
Jan
1999
Jan
2000Notification
rate
per
100,0
00
popula
tion
Figure 4. Notification rate of meningococcalinfection, Australia, 1 January 1991 to31 August 2000, by month of notification
0
100
200
300
400
500
600
700
800
Jan Feb Mar Apr May Jun Jul Aug Sep Oct Nov Dec
Month of specimen collection
La
bo
rato
ryre
po
rts
1999
2000
Figure 5. Laboratory reports of influenza, 1999 to2000, by month of specimen collection

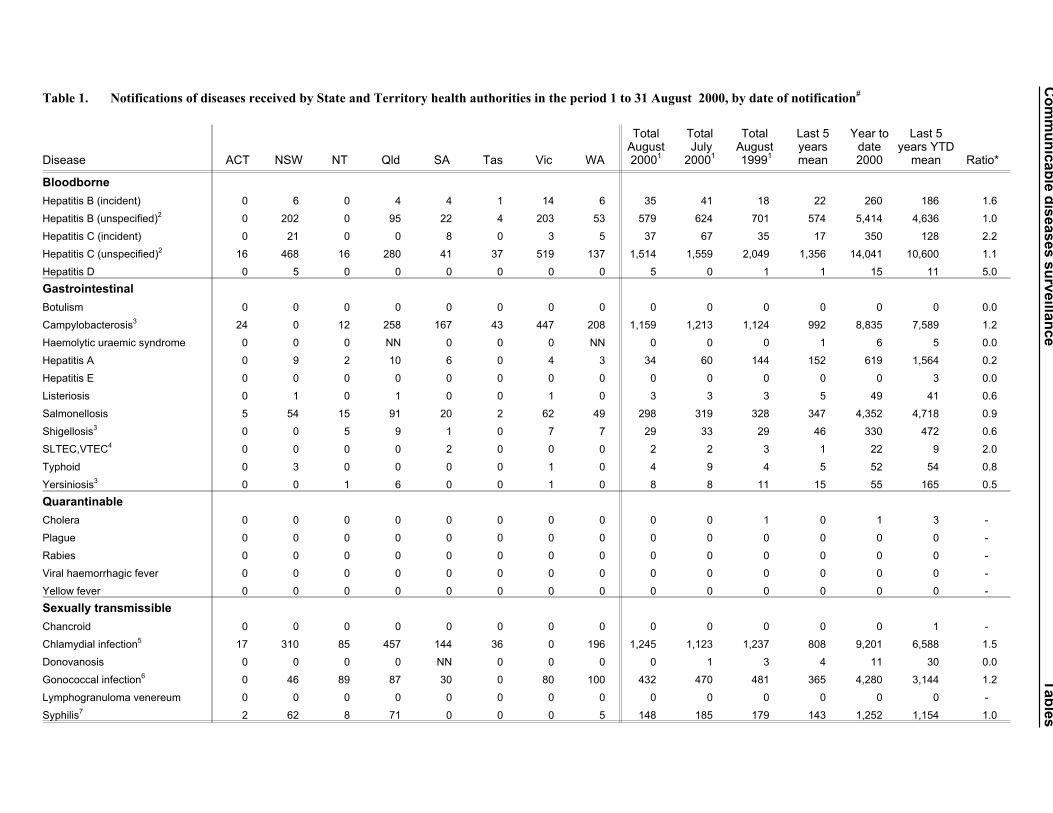
Tables
There were 6,499 notifications to the National Notifiable Diseases Surveillance System (NNDSS) with a notification date in
August 2000 (Table 1). The crude incidence of diseases per 100,000 population for each State or Territory (Table 2) was
included for the first time in the August issue of Commun Dis Intell. Data by date of report for August 2000, are included in
this issue of Commun Dis Intell (Table 3). Figure 9 illustrates, for selected diseases, the ratio of their August 2000 totals to
the mean of their July to September levels for 1995 to1999.
There were 899 reports received by the CDI Virology and Serology Laboratory Reporting Scheme (LabVISE) in the
reporting period, 1 to 31 August 2000 (Tables 4 and 5).
The Australian Sentinel Practice Research Network (ASPREN) data for weeks 31 to 34, ending 27 August 2000, are
included in this issue of Commun Dis Intell (Table 6).
Communicable diseases surveillance Tables
0.0
0.2
0.4
0.6
0.8
1.0
1.2
1 4 7 10 13 16 19 22 25 28 31 34 37 40 43 46 49 52
Weeks
Absente
es
(%)
2000
1999
Figure 7. Absenteeism rates in Australia Post, 1999and 2000 to 31 August
0
20
40
60
80
100
120
140
36 39 42 45 48 51 2 5 8 11 14 17 20 23 26 29 32 35
Week of specimen collection
La
bo
rato
ryre
po
rts
Influenza B
Influenza A
Sep Oct Nov Dec Jan Feb Mar Apr May Jun Jul Aug
Figure 6. Laboratory reports of influenza, Australia,week 36 1999 to week 35 2000, by week ofspecimen collection
0
5
10
15
20
25
30
35
36 39 42 45 48 51 2 5 8 11 14 17 20 23 26 29 32 35
Weeks
ASPREN
NSW
NT
Vic
Sep Oct Nov Dec Jan Feb Mar Apr May Jun Jul Aug
Report
sper
1,0
00
consultations
Figure 8. Sentinel general practitioner influenza consultation rates, week 36 1999 to week 35 2000, by scheme

Editorial note: Readers are reminded to use the ratios published with some caution (Figure 9, Table 1). As indicated in
footnote 1 to Tables 1-3, totals comprise data from all States and Territories and are subject to retrospective revision. The
July notification data shown in the last issue of Commun Dis Intell are those for reports received by States and Territories
and sent to the NCDC by 10 August 2000. The July notification data shown for comparison with the August data in this
September issue of Commun Dis Intell are those for all reports received and sent to NCDC as of 12 September 2000 when
the August (and updated and revised July) notification data were extracted from the database. In view of the differences in
the July data reported in this and the previous issue of Commun Dis Intell it is evident that a substantial number of July
notifications have been submitted subsequent to the data extraction date for the August issue. These notifications have
been included in the July comparison figures and the year-to-date figures in the September issue.
Tables Communicable diseases surveillance
0 0.5 1 1.5 2 2.5
Hepatitis B (incident)
Hepatitis C (incident)
Campylobacterosis
Hepatitis A
Salmonellosis
Shigellosis
Chlamydial infection
Gonococcal infection
Mumps
Pertussis
Rubella
Malaria
Ross River virus
infection
Q Fever
Legionellosis
Meningococcal
infection
Ratio2
Figure 9. Selected1
diseases from the National Notifiable Diseases Surveillance System, comparison ofprovisional totals for the period 1 to 31 August 2000 with historical data
2
1. Selected diseases are chosen each calendar month according to current activity.
2. Ratio of current month total to mean of July to September data for the previous five years.
Co
mm
un
icab
led
iseases
su
rveilla
nce
Tab
les
Table 1. Notifications of diseases received by State and Territory health authorities in the period 1 to 31 August 2000, by date of notification#
Disease ACT NSW NT Qld SA Tas Vic WA
TotalAugust2000
1
TotalJuly
20001
TotalAugust1999
1
Last 5yearsmean
Year todate2000
Last 5years YTD
mean Ratio*
Bloodborne
Hepatitis B (incident) 0 6 0 4 4 1 14 6 35 41 18 22 260 186 1.6
Hepatitis B (unspecified)2
0 202 0 95 22 4 203 53 579 624 701 574 5,414 4,636 1.0
Hepatitis C (incident) 0 21 0 0 8 0 3 5 37 67 35 17 350 128 2.2
Hepatitis C (unspecified)2
16 468 16 280 41 37 519 137 1,514 1,559 2,049 1,356 14,041 10,600 1.1
Hepatitis D 0 5 0 0 0 0 0 0 5 0 1 1 15 11 5.0
Gastrointestinal
Botulism 0 0 0 0 0 0 0 0 0 0 0 0 0 0 0.0
Campylobacterosis3
24 0 12 258 167 43 447 208 1,159 1,213 1,124 992 8,835 7,589 1.2
Haemolytic uraemic syndrome 0 0 0 NN 0 0 0 NN 0 0 0 1 6 5 0.0
Hepatitis A 0 9 2 10 6 0 4 3 34 60 144 152 619 1,564 0.2
Hepatitis E 0 0 0 0 0 0 0 0 0 0 0 0 0 3 0.0
Listeriosis 0 1 0 1 0 0 1 0 3 3 3 5 49 41 0.6
Salmonellosis 5 54 15 91 20 2 62 49 298 319 328 347 4,352 4,718 0.9
Shigellosis3
0 0 5 9 1 0 7 7 29 33 29 46 330 472 0.6
SLTEC,VTEC4
0 0 0 0 2 0 0 0 2 2 3 1 22 9 2.0
Typhoid 0 3 0 0 0 0 1 0 4 9 4 5 52 54 0.8
Yersiniosis3
0 0 1 6 0 0 1 0 8 8 11 15 55 165 0.5
Quarantinable
Cholera 0 0 0 0 0 0 0 0 0 0 1 0 1 3 -
Plague 0 0 0 0 0 0 0 0 0 0 0 0 0 0 -
Rabies 0 0 0 0 0 0 0 0 0 0 0 0 0 0 -
Viral haemorrhagic fever 0 0 0 0 0 0 0 0 0 0 0 0 0 0 -
Yellow fever 0 0 0 0 0 0 0 0 0 0 0 0 0 0 -
Sexually transmissible
Chancroid 0 0 0 0 0 0 0 0 0 0 0 0 0 1 -
Chlamydial infection5
17 310 85 457 144 36 0 196 1,245 1,123 1,237 808 9,201 6,588 1.5
Donovanosis 0 0 0 0 NN 0 0 0 0 1 3 4 11 30 0.0
Gonococcal infection6
0 46 89 87 30 0 80 100 432 470 481 365 4,280 3,144 1.2
Lymphogranuloma venereum 0 0 0 0 0 0 0 0 0 0 0 0 0 0 -
Syphilis7
2 62 8 71 0 0 0 5 148 185 179 143 1,252 1,154 1.0

Tab
les
Co
mm
un
icab
led
iseases
su
rveilla
nce
Disease ACT NSW NT Qld SA Tas Vic WA
TotalAugust2000
1
TotalJuly
20001
TotalAugust1999
1
Last 5yearsmean
Year todate2000
Last 5years YTD
mean Ratio*
Vaccine preventable
Diphtheria 0 0 0 0 0 0 0 0 0 0 0 0 0 0 -
Haemophilus influenzae type b 0 1 0 2 1 0 0 0 4 3 3 4 16 35 1.0
Measles 0 1 0 0 0 0 0 1 2 12 10 47 76 395 0.0
Mumps 0 10 0 0 1 0 3 4 18 26 18 15 154 115 1.2
Pertussis 34 345 1 43 48 2 70 4 547 620 430 481 3,194 3,275 1.1
Poliomyelitis 0 0 0 0 0 0 0 0 0 0 0 0 0 0 -
Rubella8
0 16 0 2 0 0 9 1 28 23 49 167 148 948 0.2
Tetanus 0 0 0 0 0 0 0 0 0 0 0 0 5 3 -
Vectorborne
Arbovirus infection NEC 0 0 0 0 0 0 2 0 2 1 0 2 63 43 1.0
Barmah Forest virus infection 0 13 1 23 0 0 0 0 37 33 29 33 415 552 1.1
Dengue 0 0 0 1 0 0 0 0 1 3 8 7 197 116 0.1
Malaria 1 14 9 41 4 0 10 4 83 94 50 56 734 542 1.5
Ross River virus infection 0 12 4 34 0 0 3 2 55 88 94 75 3,588 4,395 0.7
Zoonoses
Brucellosis 0 0 0 5 0 0 0 0 5 0 10 4 12 22 1.3
Hydatid infection 0 NN 0 0 0 0 2 1 3 0 3 4 17 27 0.8
Leptospirosis 0 0 0 7 0 0 0 0 7 11 8 12 160 135 0.6
Ornithosis 0 NN 0 NN 2 0 2 0 4 6 6 5 51 49 0.8
Q fever 0 14 0 20 3 0 1 2 40 39 36 45 337 351 0.9
Other
Legionellosis 0 4 0 4 8 0 0 2 18 18 13 12 361 138 1.5
Leprosy 0 0 0 0 0 0 0 0 0 0 0 1 3 5 0.0
Meningococcal infection 1 26 0 7 6 3 21 10 74 52 76 59 351 292 1.3
Tuberculosis 1 8 1 3 0 0 20 6 39 73 87 88 576 684 0.4
Total 101 1,651 249 1,561 518 128 1,485 806 6,499 6,819 7,281 5,971 59,603 53,224
1. Totals comprise data from all States and Territories. Cumulative figures are subject to retrospective revision sothere may be discrepancies between the number of new notifications and the increment in the cumulative figurefrom the previous period.
2. Unspecified numbers should be interpreted with some caution as the magnitude may be a reflection of thenumbers of tests being carried out.
3. Not reported for NSW because it is only notifiable as ‘foodborne disease’ or ‘gastroenteritis in an institution’.
4. Infections with Shiga-like toxin (verotoxin) producing E. coli (SLTEC/VTEC).
5. WA: genital only.
6. NT, Qld, SA , Vic and WA: includes gonococcal neonatal ophthalmia.
7. Includes congenital syphilis.
8. Includes congenital rubella
# Date of notification = a composite of three components: (i) the true onset date from a clinician, ifavailable, (ii) the date the laboratory test was ordered, or (iii) the date reported to the public health unit.
NN Not Notifiable.
NEC Not Elsewhere Classified.
- Elsewhere Classified.
* Ratio = ratio of current month total to mean of last 5 years calculated as described above.
Table 1 (continued). Notifications of diseases received by State and Territory health authorities in the period 1 to 31 August 2000, by date of notification#

Communicable diseases surveillance Tables
State or Territory
AustraliaDisease1
ACT NSW NT Qld SA Tas Vic WA
Bloodborne
Hepatitis B (incident) 0.0 1.1 0.0 1.4 3.2 2.6 3.6 3.9 2.2
Hepatitis B (unspecified)2
0.0 37.8 0.0 32.5 17.7 10.2 51.7 34.2 36.6
Hepatitis C (incident) 0.0 3.9 0.0 - 6.4 0.0 0.8 3.2 2.3
Hepatitis C (unspecified)2
61.3 87.6 99.5 95.7 33.0 94.4 132.2 88.3 95.8
Hepatitis D 0.0 0.9 0.0 0.0 0.0 0.0 0.0 0.0 0.3
Gastrointestinal 0.0 0.0 0.0 0.0 0.0 0.0 0.0 0.0 0.0
Botulism 0.0 0.0 0.0 0.0 0.0 0.0 0.0 0.0 0.0
Campylobacterosis3
91.9 - 74.7 88.1 134.2 109.7 113.8 134.1 73.3
Haemolytic uraemic syndrome 0.0 0.0 0.0 0.0 0.0 0.0 0.0 0.0 0.0
Hepatitis A 0.0 1.7 12.4 3.4 4.8 0.0 1.0 1.9 2.2
Hepatitis E 0.0 0.0 0.0 0.0 0.0 0.0 0.0 0.0 0.0
Listeriosis 0.0 0.2 0.0 0.3 0.0 0.0 0.3 0.0 0.2
Salmonellosis 19.1 10.1 93.3 31.1 16.1 5.1 15.8 31.6 18.9
Shigellosis3
0.0 - 31.1 3.1 0.8 0.0 1.8 4.5 1.8
SLTEC,VTEC4
0.0 0.0 0.0 NN 1.6 0.0 0.0 NN 0.1
Typhoid 0.0 0.6 0.0 0.0 0.0 0.0 0.3 0.0 0.3
Yersiniosis3
0.0 - 6.2 2.0 0.0 0.0 0.3 0.0 0.5
Quarantinable
Cholera 0.0 0.0 0.0 0.0 0.0 0.0 0.0 0.0 0.0
Plague 0.0 0.0 0.0 0.0 0.0 0.0 0.0 0.0 0.0
Rabies 0.0 0.0 0.0 0.0 0.0 0.0 0.0 0.0 0.0
Viral haemorrhagic fever 0.0 0.0 0.0 0.0 0.0 0.0 0.0 0.0 0.0
Yellow fever 0.0 0.0 0.0 0.0 0.0 0.0 0.0 0.0 0.0
Sexually transmissible
Chancroid 0.0 0.0 0.0 0.0 0.0 0.0 0.0 0.0 0.0
Chlamydial infection5
65.1 58.0 528.8 156.1 115.7 91.9 0.0 126.4 78.8
Donovanosis 0.0 0.0 0.0 0.0 NN 0.0 0.0 0.0 0.0
Gonococcal infection6
0.0 8.6 553.7 29.7 24.1 0.0 20.4 64.5 27.3
Lymphogranuloma venereum 0.0 0.0 0.0 0.0 0.0 0.0 0.0 0.0 0.0
Syphilis7
7.7 11.6 49.8 24.3 0.0 0.0 0.0 3.2 9.4
Vaccine preventable
Diphtheria 0.0 0.0 0.0 0.0 0.0 0.0 0.0 0.0 0.0
Haemophilus influenzae type b 0.0 0.2 0.0 0.7 0.8 0.0 0.0 0.0 0.3
Measles 0.0 0.2 0.0 0.0 0.0 0.0 0.0 0.6 0.1
Mumps 0.0 1.9 0.0 0.0 0.8 0.0 0.8 2.6 1.1
Pertussis 130.2 64.6 6.2 14.7 38.6 5.1 17.8 2.6 34.6
Poliomyelitis 0.0 0.0 0.0 0.0 0.0 0.0 0.0 0.0 0.0
Rubella8
0.0 3.0 0.0 0.7 0.0 0.0 2.3 0.6 1.8
Tetanus 0.0 0.0 0.0 0.0 0.0 0.0 0.0 0.0 0.0
Vectorborne
Arbovirus infection NEC 0.0 0.0 0.0 0.0 0.0 0.0 0.5 0.0 0.1
Barmah Forest virus infection 0.0 2.4 6.2 7.9 0.0 0.0 0.0 0.0 2.3
Dengue 0.0 0.0 0.0 0.3 0.0 0.0 0.0 0.0 0.1
Malaria 3.8 2.6 56.0 14.0 3.2 0.0 2.5 2.6 5.3
Ross River virus infection 0.0 2.2 24.9 11.6 0.0 0.0 0.8 1.3 3.5
Table 2. Crude incidence of diseases by State or Territory, 1 to 31 August 2000. (Rate per 100,000 population)

Tables Communicable diseases surveillance
State or Territory
AustraliaDisease1
ACT NSW NT Qld SA Tas Vic WA
Zoonoses
Brucellosis 0.0 0.0 0.0 1.7 0.0 0.0 0.0 0.0 0.3
Hydatid infection 0.0 NN 0.0 0.0 0.0 0.0 0.5 0.6 0.2
Leptospirosis 0.0 0.0 0.0 2.4 0.0 0.0 0.0 0.0 0.4
Ornithosis 0.0 NN 0.0 NN 1.6 0.0 0.5 0.0 0.3
Q fever 0.0 2.6 0.0 6.8 2.4 0.0 0.3 1.3 2.5
Other
Legionellosis 0.0 0.7 0.0 1.4 6.4 0.0 0.0 1.3 1.1
Leprosy 0.0 0.0 0.0 0.0 0.0 0.0 0.0 0.0 0.0
Meningococcal infection 3.8 4.9 0.0 2.4 4.8 7.7 5.3 6.4 4.7
Tuberculosis 3.8 1.5 6.2 1.0 0.0 0.0 5.1 3.9 2.5
Total 386.8 309.0 1549.1 533.3 416.3 326.6 378.2 519.7 411.2
1. Totals comprise data from all States and Territories. Cumulative figures are subject to retrospective revision so there may be discrepancies between thenumber of new notifications and the increment in the cumulative figure from the previous period.
2. Unspecified numbers should be interpreted with some caution as the magnitude may be a reflection of the numbers of tests being carried out.
3. Not reported for NSW because it is only notifiable as ‘foodborne disease’ or ‘gastroenteritis in an institution’.
4. Infections with Shiga-like toxin (verotoxin) producing E. coli (SLTEC/VTEC).
5. WA: genital only.
6. NT, Qld, SA , Vic and WA: includes gonococcal neonatal ophthalmia.
7. Includes congenital syphilis.
8. Includes congenital rubella.
NN Not Notifiable.
NEC Not Elsewhere Classified.
- Elsewhere Classified.
Table 2 (continued). Crude incidence of diseases by State or Territory, 1 to 31 August 2000. (Rate per 100,000population)

Communicable diseases surveillance Tables
State or Territory Totalthis
period
Year todatetotalDisease
1ACT NSW NT Qld SA Tas Vic WA
Bloodborne
Hepatitis B (incident) 0 6 0 4 6 1 13 8 38 267
Hepatitis B (unspecified)2
5 263 0 102 25 6 203 68 672 5,568
Hepatitis C (incident) 0 37 0 - 16 1 3 7 64 366
Hepatitis C (unspecified)2
22 563 27 293 62 36 519 170 1,692 14,328
Hepatitis D 0 3 0 0 0 0 0 0 3 13
Gastrointestinal
Botulism 0 0 0 0 0 0 0 0 0 0
Campylobacterosis3
22 - 14 337 173 43 452 220 1,261 8,925
Haemolytic uraemic syndrome 0 NN 0 0 0 0 0 NN 0 6
Hepatitis A 0 14 1 7 6 0 3 8 39 649
Hepatitis E 0 0 0 0 0 0 0 0 0 0
Listeriosis 0 1 0 0 0 0 0 0 1 48
Salmonellosis 6 59 16 89 18 2 78 57 325 4,503
Shigellosis3
0 - 6 9 1 0 8 8 32 337
SLTEC,VTEC4
0 0 0 0 1 0 0 0 1 24
Typhoid 0 3 0 0 0 0 2 0 5 56
Yersiniosis3
0 - 1 8 0 0 1 0 10 57
Quarantinable
Cholera 0 0 0 0 0 0 0 0 0 1
Plague 0 0 0 0 0 0 0 0 0 0
Rabies 0 0 0 0 0 0 0 0 0 0
Viral haemorrhagic fever 0 0 0 0 0 0 0 0 0 0
Yellow fever 0 0 0 0 0 0 0 0 0 0
Sexually transmissible
Chancroid 0 0 0 0 0 0 0 0 0 0
Chlamydial infection5
17 349 106 475 152 29 0 216 1,344 9,242
Donovanosis 0 0 0 0 NN 0 0 0 0 12
Gonococcal infection6
1 65 125 89 31 1 79 118 509 4,327
Lymphogranuloma venereum 0 0 0 0 0 0 0 0 0 0
Syphilis7
3 76 27 83 1 1 0 8 199 1,301
Vaccine preventable
Diphtheria 0 0 0 0 0 0 0 0 0 0
Haemophilus influenzae type b 0 2 0 2 1 0 0 0 5 17
Measles 0 1 0 1 0 0 3 1 6 79
Mumps 0 13 0 0 1 0 4 3 21 156
Pertussis 53 596 0 45 75 3 83 8 863 3,316
Poliomyelitis 0 0 0 0 0 0 0 0 0 0
Rubella8
1 15 0 1 0 0 4 2 23 143
Tetanus 0 0 0 0 0 0 0 0 0 6
Vectorborne
Arbovirus infection NEC 0 0 1 0 0 0 2 0 3 64
Barmah Forest virus infection 0 15 1 28 0 0 0 0 44 429
Dengue 0 1 2 0 1 0 0 0 4 218
Malaria 1 17 21 38 7 0 10 1 95 737
Ross River virus infection 0 18 6 28 2 1 4 10 69 3,789
Table 3. Notifications of diseases received by State and Territory health authorities in the period1 to 31 August 2000, by date of report*

Tables Communicable diseases surveillance
State or Territory Totalthis
period
Year todatetotalDisease
1ACT NSW NT Qld SA Tas Vic WA
Zoonoses
Brucellosis 0 0 0 4 0 0 0 0 4 12
Hydatid infection 0 NN 0 0 0 0 2 1 3 17
Leptospirosis 0 3 0 11 0 0 0 0 14 165
Ornithosis 0 NN 1 NN 2 0 3 1 7 60
Q fever 0 15 0 42 5 0 1 3 66 358
Other
Legionellosis 0 5 0 3 8 0 4 2 22 363
Leprosy 0 0 0 0 0 0 0 0 0 4
Meningococcal infection 0 25 1 5 6 3 20 12 72 351
Tuberculosis 1 25 5 12 0 0 24 13 80 666
Total 132 2,190 361 1,716 600 127 1,525 945 7,596 60,980
1. Totals comprise data from all States and Territories. Cumulative figures are subject to retrospective revision so there may be discrepancies between thenumber of new notifications and the increment in the cumulative figure from the previous period.
2. Unspecified numbers should be interpreted with some caution as the magnitude may be a reflection of the numbers of tests being carried out.
3. Not reported for NSW because it is only notifiable as ‘foodborne disease’ or ‘gastroenteritis in an institution’.
4. Infections with Shiga-like toxin (verotoxin) producing E. coli (SLTEC/VTEC).
5. WA: genital only.
6. NT, Qld, SA , Vic and WA: includes gonococcal neonatal ophthalmia.
7. Includes congenital syphilis.
8. Includes congenital rubella.
* Date of report is the date the public health unit received the report.
NN Not Notifiable.
NEC Not Elsewhere Classified.
- Elsewhere Classified.
Table 3 (continued). Notifications of diseases received by State and Territory health authorities in the period1 to 31 August 2000, by date of report*
Table 4. Virology and serology laboratory reports by contributing laboratories for the reporting period1 to 31 August 2000
1
State or Territory Laboratory This periodTotal thisperiod
2
Australian Capital Territory The Canberra Hospital - -
New South Wales Institute of Clinical Pathology & Medical Research, Westmead 221 249
New Children's Hospital, Westmead - -
New South Wales Repatriation General Hospital, Concord - -
Royal Prince Alfred Hospital, Camperdown 29 34
South West Area Pathology Service, Liverpool - -
Queensland Queensland Medical Laboratory, West End 138 -
Townsville General Hospital - -
South Australia Institute of Medical and Veterinary Science, Adelaide - -
Tasmania Northern Tasmanian Pathology Service, Launceston 26 29
Royal Hobart Hospital, Hobart - -
Victoria Monash Medical Centre, Melbourne - -
Royal Children's Hospital, Melbourne 182 167
Victorian Infectious Diseases Reference Laboratory, Fairfield 56 87
Western Australia PathCentre Virology, Perth - -
Princess Margaret Hospital, Perth 225 154
Western Diagnostic Pathology 22 19
Total 899 739
1. The complete list of laboratories reporting for the 12 months, January to December 2000, will appear in every report from January 2000 regardless ofwhether reports were received in this reporting period. Reports are not always received from all laboratories.
2. Total reports include both reports for the current period and outstanding reports to date.
- Nil reports

Communicable diseases surveillance Tables
State or Territory1
Thisperiod2000
Thisperiod1999
Year todate
20003
Year todate1999ACT NSW NT Qld SA Tas Vic WA
Measles, mumps, rubella
Measles virus - 1 - - - - 3 - 4 2 33 135
Hepatitis viruses
Hepatitis A virus - - 1 1 - - - - 2 61 110 357
Arboviruses
Ross River virus - - - 2 - - - - 2 149 1,091 1,368
Barmah Forest virus - - 1 6 - - 1 - 8 13 117 164
Adenoviruses
Adenovirus not typed/pending - 12 - - - - 10 8 30 112 655 733
Herpes viruses
Cytomegalovirus 2 11 - 3 - 2 15 8 41 162 732 885
Varicella-zoster virus - 5 - 9 - 1 6 3 24 292 867 1,408
Epstein-Barr virus - 1 1 16 - - 5 15 38 402 1,351 2,066
Other DNA viruses
Parvovirus - - - - - - 5 - 5 80 207 407
Picornavirus family
Echovirus type 7 - 2 - - - - - - 2 30 1
Poliovirus type 3
(uncharacterised) - 2 - - - - - - 2 1 5 6
Rhinovirus (all types) - 6 - - - - - - 6 45 251 276
Enterovirus not typed/pending - - - - 1 - 3 - 4 99 581 557
Ortho/paramyxoviruses
Influenza A virus 5 41 - 2 - - 20 14 82 568 557 1,822
Influenza B virus - 10 - 1 - - 12 2 25 75 177 201
Parainfluenza virus type 1 - - - - - - - 3 3 4 212 34
Parainfluenza virus type 2 - - - - - - - 3 3 4 27 98
Parainfluenza virus type 3 1 2 - - - - 2 12 17 127 146 451
Respiratory syncytial virus 1 22 - 8 - 17 44 140 232 724 2,299 2,711
Rotavirus - 92 - - 1 3 24 34 154 494 698 1,338
Other
Chlamydia trachomatis not typed 2 28 4 27 - 5 3 2 71 725 2,031 3,123
Chlamydia psittaci - - - - - - 2 - 2 4 59 58
Chlamydia species - 2 - - - - - - 2 14 8 31
Mycoplasma pneumoniae - 6 1 14 - - 13 2 36 226 391 992
Coxiella burnetii (Q fever) - - - 3 - - - - 3 43 45 234
Streptococcus group A - 1 - 1 - - 14 - 16 132 235 413
Brucella species - - - 1 - - - - 1 3 5 9
Bordetella pertussis - 8 - 2 - - 47 - 57 209 374 914
Legionella pneumophila - - - - - - 3 - 3 29 15
Leptospira species - - - 1 - - - - 1 8 36 70
Treponema pallidum - 1 9 13 - - - - 23 305 485 814
Total 11 253 17 110 2 28 232 246 899 5,083 13,844 21,691
1. State or Territory of postcode, if reported, otherwise State or Territory of reporting laboratory.
2. From January 2000 data presented are for reports with report dates in the current period. Previously reports included all data received in that period.
3. Totals comprise data from all laboratories. Cumulative figures are subject to retrospective revision, so there may be discrepancies between the number ofnew notifications and the increment in the cumulative figure from the previous period.
- No data received this period.
Table 5. Virology and serology laboratory reports by State or Territory1
for the reporting period1 to 31 August 2000, and total reports for the year
2

The NNDSS is conducted under the auspices of the Communicable Diseases Network Australia New Zealand. The system
coordinates the national surveillance of close to 50 communicable diseases or disease groups endorsed by the National
Health and Medical Research Council (NHMRC). Notifications of these diseases are made to State and Territory health
authorities under the provisions of their respective public health legislations. De-identified core unit data are supplied
fortnightly for collation, analysis and dissemination. For further information, see Commun Dis Intell 2000;24:6-7.
LabVISE is a sentinel reporting scheme. Currently 17 laboratories contribute data on the laboratory identification of viruses
and other organisms. This number may change throughout the year. Data are collated and published in Commun Dis Intell
monthly. These data should be interpreted with caution as the number and type of reports received is subject to a number of
biases. For further information, see Commun Dis Intell 2000;24:10.
ASPREN currently comprises about 120 general practitioners from throughout the country, not all of whom report each
week. Between 7,000 and 8,000 consultations are reported each week, with special attention to 14 conditions chosen for
sentinel surveillance in 2000. Commun Dis Intell reports the consultation rates for five of these. For further information,
including case definitions, see Commun Dis Intell 2000;24:7-8.
Additional Reports
Gonococcal surveillance
John Tapsall, The Prince of Wales Hospital, Randwick,
NSW, 2031 for the Australian Gonococcal Surveillance
Programme.
The Australian Gonococcal Surveillance Programme
(AGSP) reference laboratories in the various States and
Territories report data on sensitivity to an agreed ‘core’
group of antimicrobial agents quarterly. The antibiotics
currently routinely surveyed are penicillin, ceftriaxone,
ciprofloxacin and spectinomycin, all of which are
administered as single dose regimens and currently used in
Australia to treat gonorrhoea. When in vitro resistance to a
recommended agent is demonstrated in 5 per cent or more
of isolates from a general population, it is usual to remove
that agent from the list of recommended treatment (Anon.
Management of sexually transmitted diseases. World Health
Organization 1997; Document WHO/GPA/TEM94.1 Rev.1 p
37). Additional data are also provided on other antibiotics
from time to time. At present all laboratories also test
isolates for the presence of high level (plasmid-mediated)
resistance to the tetracyclines, known as TRNG.
Tetracyclines are however not a recommended therapy for
gonorrhoea in Australia. Comparability of data is achieved
by means of a standardised system of testing and a
program-specific quality assurance process. Because of the
substantial geographic differences in susceptibility patterns
in Australia, regional as well as aggregated data are
presented.
Reporting period 1 April to 30 June 2000
The AGSP laboratories examined a total of 970 isolates in
this quarter, little different from the 950 available in this
period in 1999. About 34 per cent of this total was from New
South Wales, 22 per cent from Victoria, 16 per cent from
Queensland, 14 per cent from the Northern Territory, 11 per
cent from Western Australia and 2.7 per cent from South
Australia. Isolates from other centres were few.
Penicillins
Figure 10 shows the proportions of gonococci fully sensitive
(MIC � 0.03 mg/L), less sensitive (MIC 0.06 to 0.5 mg/L),
relatively resistant to penicillins (MIC � 1 mg/L) or else
penicillinase-producing Neisseria gonorrhoeae (PPNG)
aggregated for Australia and by State or Territory. A high
proportion of PPNG and relatively resistant strains fail to
respond to treatment with penicillins (penicillin, amoxycillin,
ampicillin) and early generation cephalosporins.
Additional Reports Communicable diseases surveillance
Table 6. Australian Sentinel Practice Research Network reports, weeks 31 to 34, 2000
Week number 31 32 33 34
Week ending on 6 August 2000 13 August 2000 20 August 2000 27 August 2000
Doctors reporting 63 62 64 60
Total encounters 7,882 7,574 7,813 7,774
Condition Reports
Rate per1,000
encounters Reports
Rate per1,000
encounters Reports
Rate per1,000
encounters Reports
Rate per1,000
encounters
Influenza 68 8.6 67 8.8 86 11.0 144 18.5
Chickenpox 9 1.1 9 1.2 10 1.3 12 1.5
Gastroenteritis 66 8.4 65 8.6 72 9.2 68 8.7
Gastroenteritis with stool culture 17 2.2 16 2.1 8 1.0 10 1.3
ADT immunisations 34 4.3 28 3.7 31 4.0 23 3.0

About 17 per cent of all isolates were penicillin-resistant by
one or more mechanisms – 7.6 per cent by penicillinase
production and 9.3 per cent by chromosomal mechanisms
(CMRNG). The penicillin-resistant isolates comprised about
28 per cent of all isolates in Queensland and about 20 per
cent of all gonococci in New South Wales and South
Australia, while 16 per cent of gonococci in Victoria and 13
per cent in Western Australia were penicillin-resistant. In the
Northern Territory only a single isolate out of 137 examined
was penicillin-resistant.
The number of PPNG isolated in Australia (74) increased
slightly in this quarter compared with the corresponding
period in 1999 (65). The highest proportion of PPNG was
found in isolates from Queensland (18%), Western Australia
(11%), Victoria (8%) and South Australia (8%), whereas the
number (15) and proportion (4.5%) of PPNG in New South
Wales continued to decrease. No PPNG were present in the
Northern Territory. Acquisition data on PPNG indicated local
infection with these strains was occurring throughout
Australia. South-East Asian countries remained the main
source of external acquisition.
More isolates were resistant to the penicillins by separate
chromosomal mechanisms (91). These CMRNG were
especially prominent in New South Wales where 54 such
isolates were detected. Queensland (15) and Victoria (16)
were also prominent sources of CMRNG. Only one strain of
this type was isolated in the Northern Territory.
Ceftriaxone and spectinomycin
Most isolates in Australia were again susceptible to these
injectable agents. A small number of strains exhibited
decreased ceftriaxone susceptibility.
Quinolone antibiotics
Quinolone-resistant N. gonorrhoeae (QRNG) are defined as
those isolates with an MIC to ciprofloxacin equal to or
greater than 0.06 mg/L. QRNG are further subdivided into
less sensitive (ciprofloxacin MICs 0.06 to 0.5 mg/L) or
resistant (MIC � 1 mg/L) groups. The distribution of QRNG in
Australia in this quarter is shown in Figure 11.
For Australia as a whole the total number (183) and
proportion (18.8%) of all N. gonorrhoeae isolates that were
QRNG were again high and very similar to numbers and
proportions seen in the corresponding quarter of 1999 (194
isolates, 20%). It was in the June quarter of 1999 that the
numbers of QRNG increased substantially. In the current
quarter the QRNG were widely dispersed and were present
in all centres except the Northern Territory. High rates were
maintained in New South Wales (27%) and Victoria (25%)
and together these regions accounted for three-quarters of
the QRNG isolated. QRNG were prominent also in South
Australia (23% of isolates there), Queensland (14%) and
Western Australian (13%). A single QRNG was detected in
Tasmania.
Thirty-two of the New South Wales, 13 of the Victorian and
all of the 21 Queensland QRNG isolates exhibited high level
resistance (MIC ciprofloxacin � 1 mg/L) and higher level
QRNG were also seen in South Australia, Tasmania and
Western Australia. Local acquisition became increasingly
prominent and MICs ranged up to 16 mg/L. However, about
60 per cent of the QRNG were in the ‘less sensitive’ MIC
range 0.06 to 0.5 mg/L and were found almost exclusively in
males. Again the bulk of this group of isolates (96 of 110)
was found in New South Wales and Victoria and infections
with them were mostly locally acquired. Gonococci acquired
overseas were from such diverse sources as the United
Kingdom, Denmark, Ireland, Indonesia, the Philippines,
Papua New Guinea, Taiwan, China, Thailand and Vietnam.
High level tetracycline resistance (TRNG)
The number (79) and proportion (8.1%) of TRNG detected
were higher than for the second quarter of 1999 (58; 6%).
TRNG represented 22 per cent of isolates from Queensland,
13 per cent from Western Australia, and 5.5 per cent from
New South Wales and Victoria. No TRNG were detected in
South Australia, Tasmania or the Northern Territory.
Communicable diseases surveillance Additional Reports
0
20
40
60
80
100
120
NSW Vic Qld NT WA SA Aus
Pe
rce
nt
PPNG
RR
LS
FS
Figure 10. Gonococci isolated in Australia, 1 April to30 June 2000, by penicillin-susceptibilityand by region
FS fully sensitive to penicillin, MIC � 0.03 mg/L
LS less sensitive to penicillin, MIC 0.06 to 0.5 mg/L
RR relatively resistant to penicillin, MIC � = 1 mg/L
PPNG penicillinase-producing Neisseria gonorrhoeae
* includes Tasmania and the Australian Capital Territory
0
5
10
15
20
25
30
NSW Vic Qld NT WA SA Aus
Per
cent
All QRNG
LS QRNG
R QRNG
Figure 11. Quinolone-resistance of N. Gonorrhoeae,Australia, 1 April to 30 June 2000, byregion
LS QRNG = less sensitive quinolone-resistant N. gonorrhoeae(Ciprofloxacin MICs 0.06 to 0.5 mg/L)
R QRNG = fully resistant quinolone-resistant N. Gonorrhoeae(Ciprofloxacin MICs ³ 1 mg/L)
* includes Tasmania and the Australian Capital Territory

Australian encephalitis: SentinelChicken Surveillance Programme
Sentinel chicken flocks are used to monitor flavivirus activity
in Australia. The main viruses of concern are Murray Valley
encephalitis (MVE) and Kunjin which cause the potentially
fatal disease Australian encephalitis in humans. Currently
29 flocks are maintained in the north of Western Australia,
seven in the Northern Territory, nine in New South Wales
and ten in Victoria. The flocks in Western Australia and the
Northern Territory are tested year round but those in New
South Wales and Victoria are tested only from November to
March, during the main risk season.
Results are coordinated by the Arbovirus Laboratory in
Perth and reported bimonthly. For more information see
Commun Dis Intell 2000;24:8-9.
A K Broom,1
J S Mackenzie,2
L Melville,3
D W Smith,4
PI Whelan5
1. Department of Microbiology, The University of Western Australia
2. Department of Microbiology, The University of Queensland
3. Berrimah Agricultural Research Centre, Northern Territory
4. PathCentre, Western Australia
5. Department of Health and Community Services, Northern Territory
July/August 2000
Sentinel chicken serology was carried out for 27 of the 29
flocks in Western Australia in July and August 2000. Murray
Valley encephalitis (MVE) activity was still detected in the
Kimberley, Pilbara, Gascoyne and Midwest in these months,
although the numbers of seroconversions have decreased.
The extension of MVE virus activity this far into the dry
season has not been observed in previous years. The
number of chickens positive for flavivirus antibodies by
ELISA at each site and the identity of the infecting virus(es)
are shown in Table 7. A number of the later seroconversions
have not yet been confirmed.
MVE virus antibodies were detected in chickens in the
Murchison and Midwest regions of Western Australia for the
first time this year. This is the furthest south the virus has
ever been detected. A serological survey of domestic
chickens located in these regions and areas further south
and east, was carried out in August to determine the limit of
MVE virus activity in Western Australia in 2000. The results
will be published in a later edition of Commun Dis Intell. To
date 11 cases of Australian encephalitis caused by MVE
virus have been confirmed from Western Australia. In
addition there have been several cases of non-encephalitic
disease caused by Kunjin virus reported from Western
Australia.
Serum samples from six of the seven Northern Territory
sentinel chicken flocks were tested in our laboratory in July
and August 2000. One new seroconversion to MVE virus
was detected in July east of Darwin at Beatrice Hill Farm.
Several media warnings have been issued by the Northern
Territory Health Department and to date there have been
four cases of Australian encephalitis caused by MVE virus
and one case of Kunjin encephalitis confirmed from central
Australia (Northern Territory and South Australia).
Additional Reports Communicable diseases surveillance
Table 7. Flavivirus seroconversions in Western Australian sentinel chicken flocks in July and August 2000
Location*
July 2000 August 2000
Region MVEMVE/KUN KUN FLAVI MVE KUN FLAVI
Kimberley Kalumburu 1 1
Wyndham 1#
Kununurra 1
Fitzroy Crossing 1 1
Derby** 1 1 1 2
Lombadina 1 1
Bidjadanga 1 2
Pilbara South Hedland 1
Harding Dam** 2 1 1
Pannawonica 5
Tom Price 1
Paraburdoo 1 1
Onslow 1 3
Gascoyne Carnarvon 3 2
Midwest Dongara 4 1
* The location of most chicken flocks are illustrated in Commun Dis Intell 2000;24:8-9.
** Two flocks of 12 chickens at these sites,#
This result has not yet been confirmed,
MVE Antibodies to Murray Valley encephalitis virus detected by ELISA.
KUN Antibodies to Kunjin virus detected by ELISA.
FLAVI Antibodies to flavivirus detected by ELISA.

HIV and AIDS Surveillance
National surveillance for HIV disease is coordinated by the
National Centre in HIV Epidemiology and Clinical Research
(NCHECR), in collaboration with State and Territory health
authorities and the Commonwealth of Australia. Cases of
HIV infection are notified to the National HIV Database on
the first occasion of diagnosis in Australia, by either the
diagnosing laboratory (Australian Capital Territory, New
South Wales, Tasmania, Victoria) or by a combination of
laboratory and doctor sources (Northern Territory,
Queensland, South Australia, Western Australia). Cases of
AIDS are notified through the State and Territory health
authorities to the National AIDS Registry. Diagnoses of both
HIV infection and AIDS are notified with the person's date of
birth and name code, to minimise duplicate notifications
while maintaining confidentiality.
Tabulations of diagnoses of HIV infection and AIDS are
based on data available three months after the end of the
reporting interval indicated, to allow for reporting delay and
to incorporate newly available information. More detailed
information on diagnoses of HIV infection and AIDS is
published in the quarterly Australian HIV Surveillance
Report, and annually in HIV/AIDS and related diseases in
Australia Annual Surveillance Report. The reports are
available from the National Centre in HIV Epidemiology and
Clinical Research, 376 Victoria Street, Darlinghurst NSW
2010. Internet: http://www.med.unsw.edu.au/nchecr.
Telephone: (02) 9332 4648. Facsimile: (02) 9332 1837.
HIV and AIDS diagnoses and deaths following AIDS
reported for 1 to 30 April 2000, as reported to 31 July 2000,
are included in this issue of Commun Dis Intell (Tables 8 and
9).
Communicable diseases surveillance Additional Reports
Table 8. New diagnoses of HIV infection, new diagnoses of AIDS and deaths following AIDS occurring inthe period 1 to 30 April 2000, by sex and State or Territory of diagnosis
ACT NSW NT Qld SA Tas Vic WA
Totals for Australia
Thisperiod2000
Thisperiod1999
Year todate2000
Year todate1999
HIV diagnoses Female 1 2 0 1 0 0 3 0 7 5 27 23
Male 0 17 0 6 1 0 12 1 37 56 217 218
Sex not reported 0 0 0 0 0 0 0 0 0 0 0 0
Total1
1 19 0 7 1 0 15 1 44 61 245 241
AIDS diagnoses Female 0 0 0 0 0 0 0 0 0 0 7 5
Male 0 1 0 1 0 0 1 0 3 17 52 51
Total1
0 1 0 1 0 0 1 0 3 17 59 56
AIDS deaths Female 0 0 0 0 0 0 0 0 0 1 3 1
Male 0 2 0 2 0 0 1 0 5 4 25 40
Total1
0 2 0 2 0 0 1 0 5 5 28 42
1. Persons whose sex was reported as transgender are included in the totals.
Table 9. Cumulative diagnoses of HIV infection, AIDS and deaths following AIDS since the introduction ofHIV antibody testing to 31 July 2000, by sex and State or Territory
State or Territory
AustraliaACT NSW NT Qld SA Tas Vic WA
HIV diagnoses Female 27 609 11 156 61 5 217 118 1,204
Male 223 11,025 110 2,009 680 78 3,919 922 18,966
Sex not reported 0 247 0 0 0 0 24 0 271
Total1
250 11,901 121 2,172 741 83 4,174 1,044 20,486
AIDS diagnoses Female 9 188 1 48 25 3 70 26 370
Male 86 4,651 35 828 347 44 1,630 354 7,975
Total1
95 4,851 36 878 372 47 1,708 382 8,369
AIDS deaths Female 4 113 0 32 15 2 49 16 231
Male 66 3,175 24 569 231 29 1,275 248 5,617
Total1
70 3,296 24 603 246 31 1,330 265 5,865
1. Persons whose sex was reported as transgender are included in the totals.
Bulletin board
Bulletin BoardAustralian Institute of Environmental Health
27th National Conference and Workshop
15-19 October 2000
Hotel Sofitel Reef Casino, Cairns, Queensland
Phone: 07 3000 2299
Email: [email protected]
Website: PacCon2000.com
VTEC 2000
4th International Symposium and Workshop on
'Shiga Toxin (Verocytotoxin) - Producing
Escherichia coli Infections
29 October-2 November 2000
Kyoto, Japan
Phone: +81 3 3423 4180
Fax: +81 3 3423 4108
Email: [email protected]
The NSW Infection Control Association
23rd Annual Conference
2-3 November 2000
Civic Hall, Newcastle, New South Wales
Phone: 02 4921 8777
Fax: 02 4921 8778
Email: [email protected]
Early bird registration 29 September 2000
Public Health Association of Australia
32nd Annual Conference
26-29 November 2000
National Convention Centre, Canberra
Phone: 02 6285 2373
Fax: 02 6282 5438
Email: [email protected]
Website:
http://www.phaa.net.au/conf/annual/regbroch.htm
Australian Epidemiology Association
2000 Annual Scientific Meeting
The Future of Epidemiology
29 November to 1 December 2000
TBA
Canberra
Contact: Bob Douglas
Email: [email protected]
Emerging Disease Conference
Challenges of Emerging Illness in Urban Environments
11-12 December 2000
The New York Academy of Medicine, NY, USA
Contact: Patricia Doyle
Fax: 212 987 4735
Email: [email protected]
Website: http://www.nyam.org
Master of Applied Epidemiology
3rd MAE Conference
Charting new directions: cutting-edge issues in applied
epidemiology
1-2 April 2001
Hyatt Hotel, Canberra, Australian Capital Territory
Phone: 02 6249 2790
Fax: 02 6249 0740
Email MAE(DC): [email protected]
Email MAE(IH): [email protected]
The Communicable Diseases Network
Australia New Zealand (CDNANZ)
Communicable Diseases Control Conference 2001
2-3 April 2001
Hyatt Hotel, Canberra, Australian Capital Territory
Phone: +61 2 6251 0675
Fax: +61 2 6251 0672
Email: [email protected]
Website:
http://www.health.gov.au/pubhlth/cdi/cdconf.htm
Institute for Microbiology of Medical Faculty
of Masaryk University & St Anna's Faculty Hospital
10th Tomasek Days
Annual conference of young microbiologists
6-8 June 2001
Brno, Czechia
Contact: Ondrej Zahradnicek
Phone: ++420 5 4318309
Fax: ++420 5 4318308
Email: [email protected]
Website: www.med.muni.cz/zahrad/strtomda.htm
Winter Symposium for Emergency Medicine/
Outpatient Parenteral Therapy
23-27 June 2001(tentative)
Peppers Fairmont Resort, Leura, New South Wales
Phone: 02 9956 8333
Fax: 02 9956 5154
Email: [email protected]
The Australian Society for Microbiology
Annual Scientific Meeting
30 September - 6 October 2001
Burswood Resort and Convention Centre
Burswood, Perth
Phone: +61 3 9867 8699
Fax: +61 3 9867 8722
Email: [email protected]
Website: http://www.cbsm.uwa.edu.au/ASM2001/
The Communicable Diseases Intelligence Bulletin Board is provided as a service to readers. Every effort has been made
to provide accurate information, but readers are advised to contact the relevant organisation for confirmation of details.
Information about the availability of resources is included when space allows. Inclusion of a resource on the Bulletin
Board does not imply endorsement of the resource by either the Communicable Diseases Network Australia New
Zealand or the Commonwealth Department of Health and Aged Care.
Contributions to the Bulletin Board are invited from those organisations with forthcoming events relevant to
communicable disease control.
Overseas briefsProMED-mail
This material has been summarised from information
provided by ProMED-mail (http://www.promedmail.org).
A link to this site can be found under ‘Other Australian
and international communicable diseases sites’ on the
Communicable Diseases Australia homepage.
Salmonella, birds – New Zealand
Contributed 29 September 2000 by Merren, Ihug
Newsroom, Nga Mihi.
The investigation into the current outbreak of Salmonella
has been helped by the public reporting 79 sightings of dead
birds to the Ministry of Agriculture and Forestry (MAF). MAF
earlier made an appeal for help in the investigation into an
outbreak of Salmonella in sparrows which is suspected to be
linked to an increase of reported cases in humans.
Last week the Canterbury Medical Officer of Health, Dr Mel
Brieseman, said 37 human cases of the disease have been
notified in the past 10 weeks. Most cases, including the
death of a 70 year old Christchurch man, involved a strain
not normally seen in humans, called type 160, the same
strain killing sparrows in Canterbury, Marlborough,
Manawatu and Waikato. There have since been sightings of
dead birds in other areas from Northland to the West Coast,
with groups of up to 400 dead birds being reported, though
most sighting are still confined to Canterbury.
The MAF program coordinator, Roger Poland, said they had
not yet identified one particular strain of Salmonella as
causing all of the deaths so it was too early to determine if it
was spreading throughout the country. The health
authorities are currently carrying out tests to establish links
to the sparrow deaths, as well as investigating a number of
cases of salmonellosis in humans.
Editorial note: the Salmonella involved (confirmed in two
cases of sparrows) is Typhimurium phage type 160. Apart
from sparrows, deaths in other small birds (waxeyes and
riflemen) have been reported. During August and
September there have been 15 confirmed cases involving
rabbits, dogs cats, ducks, quail, deer, horses, cattle and
cockatoos. See: www.maf.govt.nz/MAFnet/280900sal.htm.
Update on respiratory illness amongpassengers on the Fair Princess cruise
Contributed 21 September 2000 by Dr Jeremy McAnulty,
Manager, Communicable Diseases Surveillance and
Control Unit, NSW Health Department, Sydney.
This is a summary of NSW Health’s investigation of the
outbreak of flu-like illness on the Fair Princess in early
September 2000. Available evidence indicates that the
cause of the outbreak was likely to be influenza.
On Thursday 7 September 2000, NSW Health received a
report from P&O that a person from the Fair Princess cruise
ship had been diagnosed with Legionnaires’ disease. The
ship had left Sydney for a routine cruise on 28 August 2000
bound for Noumea and other islands. Five people had been
taken off the ship with illness in Noumea. One of the patients
subsequently died. Two others were diagnosed by doctors
in Noumea with Legionnaires’ disease.
The ship was due to arrive back in Sydney on Saturday 9
September 2000.
NSW Health immediately assembled a team to investigate
this problem. Doctors in Noumea were asked to send
additional specimens to Sydney for further testing. In the
meantime, NSW Health provided information for the ship’s
passengers and crew, and organised for a team of five
experts in epidemiology (including two doctors) and
environmental health officers to meet the ship 10 hours
before it docked in Sydney. (The ship docked at 3:30 am on
Sunday 10 September 2000.)
The team undertook an investigation on board the ship that
included a review of medical records, and a study of some
50 passengers who had attended the ship’s clinic because
of flu-like illness and a study of 50 other passengers and 50
crew members as comparison groups. Throat, urine and
blood samples were collected from most of these
passengers. The team also evaluated any environmental
risks on board. Interviews with passengers and crew
indicate that there was a peak in onset of illness about 2-3
days into the cruise from Sydney.
When the ship disembarked in Sydney, seven passengers
were taken to hospital, some of whom had chest infections.
All have since been discharged. Subsequently, we have had
reports that eight other passengers with chest infections
were admitted to hospital. One of these has died (of heart
disease), six others have been discharged and one remains
in hospital.
The investigation by NSW Health is continuing. The
environmental evaluation of the ship found no likely source
of Legionnaires’ disease. All water samples taken on board
the ship have been negative for the bacteria that causes
Legionnaires’ disease. As an added precaution, the ship’s
water supply was disinfected.
So far no person who was on the ship has tested positive for
Legionnaires’ disease from NSW Health tests. However, a
significant number of passengers and some crew have
tested positive for influenza virus. Further tests are being
undertaken in the two persons initially thought to have
Legionnaires’ disease. Due to the nature of these and other
tests, results are unlikely to be finalised for some weeks.
The evidence indicates that Legionnaires’ disease is not the
cause of the outbreak of illness among the passengers. The
most likely explanation is influenza (the flu) brought onto the
ship by people boarding in Sydney. Influenza is caused by a
virus that is easily passed from person-to-person (rather
than from the environment) by coughing and sneezing.
Older persons, and people with other underlying medical
conditions (especially of the chest or heart or immune
system) are at increased risk of severe complications such
as pneumonia or heart failure if they catch influenza. There
was a high proportion of these people on the ship. Influenza
has been common in many parts of Australia in August and
September.
Overseas briefs

Pro-MED comment. ProMED-mail would like to thank Dr
McAnulty for his rapid response to our RFI (Request for
Information) on the above mentioned outbreak. Additional
newswires had carried the title of a Legionnaires’ disease
outbreak as he stated in this very comprehensive report. In
addition there had been extensive newswire coverage of
concerns regarding influenza activity during the Olympics
for the 2 weeks preceding the onset. As Dr McAnulty has
pointed out in his report, August and September have been
months with significant influenza activity noted in Australia.
Unless there are additional findings different from those
mentioned above, this thread is now closed.
BSE cases down but CJD on increase: UK
Contributed 27 September 2000 by M. Cosgriff: abstracted
from The Independent (26 September)
The BSE epidemic is starting to drop off in line with
scientists’ predictions, a Government report stated
yesterday. But the number of known cases of 'variant' CJD,
(vCJD) the human form of the disease, has increased to 74.
The Ministry of Agriculture, Fisheries and Food (MAFF)
study comes a day after the department played down fears
up to eight more cows may have contracted BSE because of
inadequate measures to eradicate it. The progress report
outlined the measures taken to protect public health in the 6
months from December 1999. It stated BSE cases have
already shown a dramatic decline and the situation was due
to improve further in the future.
On average about 30 new cases were being found each
month, compared to 1000 a month at the height of the
epidemic in 1993. The number of infected cattle in 1999 was
30.5 percent lower than the same period in 1998. Almost
two-thirds of herds with breeding cattle have never had a
case of BSE.
However, 63 people had died of vCJD by the end of June
2000, with three provisional victims who had already died
and a further seven still alive but believed to have the
disease. On Sunday, the Government said there was no
new outbreak of BSE. There was only one confirmed case of
BSE in July, a spokesman said.
Editorial note: as of 28 September there have been 73
confirmed cases: see Editorial, this issue.
Hand, foot & mouth disease: Singapore
Contributed 3 October 2000 by Dr Muruga Vadivale:
abstracted from the Straits Times (Byline: Salma Khalik)
Hand, foot and mouth disease has landed 19 children in
hospital, with the total number of cases reported rising to
363 as of yesterday (2 October 2000). None of the children
is seriously ill, although 2 are in intensive care, said Dr Phua
Kong Boo, Head of the Paediatrics Department at KK
Women’s and Children’s Hospital (KKH), where most of the
children are located. One is the 5 year old brother of the two
toddlers who died on 30 Sep 2000. He is not in danger but is
being kept in intensive care as a precaution. The other is a 1
year old child whose breathing is faster than normal.
The National University Hospital (NUH) has set up an
isolation ward for children suffering from this highly
contagious disease. (All child-care centres have been
closed, and as a further precaution play areas, wading pools
and library programs for young children were closed
yesterday). There have been 363 reported cases of hand,
foot and mouth disease since 12 September 2000, and a
total of four toddlers diagnosed with the disease died last
month. Speaking at a press conference yesterday, Health
Minister Lim Hng Kiang noted that between seven and 11
young children in Singapore die of viral infection of the lungs
every year. But it was unusual for four to die within a month,
he said. Mr Lim said that as well as trying to identify the virus
locally, samples had been sent to the Centers for Disease
Control and Prevention in Atlanta, USA.
Prevalence of Enterovirus 71 in Korea
Contributed by Kisoon Kim Department of Virology, NIH,
Korea (edited)
This year several isolations of Enterovirus type 71 (EV71)
have been made from patients diagnosed with hand, foot &
mouth disease (HFMD) and/or aseptic meningitis in the
mainland of Korea. Clinical samples taken from such
patients have been processed and inoculated onto RD,
BGM and Vero cells. RT-PCR assays were also performed
(in parallel) to detect the presence of viral nucleic acid in the
original samples and in cell culture supernatants, whether a
cytopathic effect was observed or not.
The National Institute of Health of Korea has sponsored an
investigation to establish whether EV71 infection is reaching
epidemic proportions. Because there are no data available
on the past prevalence of EV71 in Korea, it is difficult at this
stage of the investigation to define whether there is an
epidemic or not. Fortunately, so far there have been no fatal
cases attributable to EV71 infection in Korea. Genomic
subtyping and neutralising tests are in progress.
Rift Valley Fever in Saudi Arabia: Update
Contributed by Shamsudeen Fagbo: abstracted from Arab
News
The English language daily Arab News reported today
(Monday 2 October 2000) that Rift Valley fever has been
reported in the Eastern region of the country with two people
contracting the disease in the town of Ahsa. According to
health authorities, a total of 52 fatalities have occurred with
the number of recorded cases now up to 223 since the
disease was first reported in the southern port town of Jizan
close to the Yemeni border about 3 weeks ago. The Arab
News daily also reported that the Yemeni Health Minister put
the total number of Rift Valley fever related deaths in Yemen
to be 31 as at Wednesday while cases were reported as 117
individuals.
World Health Organization
This material has been summarised from information
on the World Health Organization Internet site. A link to
this site can be found under ‘Other Australian and
international communicable diseases sites’ on the
Communicable Diseases Australia homepage.
Cholera
Federated States of Micronesia - update
As of 21 August 2000, the public health authorities of
Pohnpei State reported a total of 2,689 cases and 15 deaths
from the cholera outbreak they first reported on 17 April
2000. Vibrio cholerae biotype El Tor serotype Ogawa has
been identified.
Overseas briefs
The public health authorities of the Federated States of
Micronesia, with the support of WHO and the Secretariat of
the Pacific Community (SPC), have decided to implement a
cholera vaccination campaign in the unaffected islands,
using the live oral CVD-103HgR vaccine. Several clinical
studies have shown that one oral dose of this vaccine
provides 70-90 per cent protective immunity after only 7
days.
Although the outbreak is still ongoing, it is limited to Pohnpei
island. However, the cholera vaccination campaign is a
preventive measure to contain the spread of cholera to other
areas. This cholera vaccine campaign does not replace the
usual recommendations for safe water, appropriate
sanitation and environmental measures, but is rather a
complementary tool to contain the cholera outbreak in this
specific situation.
Afghanistan
An outbreak of cholera with onset in August 2000 has been
reported in the southern, western and northern regions (in
the provinces of Kandahar, Badghis and Jawzjan – including
Saripul – respectively). To date, 1,604 cases and 19 deaths
have been reported. All the samples tested are Vibrio
cholerae O1 Ogawa, sensitive to doxycycline and
tetracycline. Sensitivity to co-trimoxazole has not yet been
tested. The Ministry of Health is responding to the outbreak
together with WHO and Médecins sans frontières.
A plan of action has been drawn up to include the provision
of essential supplies for case management of cholera and
strengthening surveillance of epidemic-prone diseases.
WHO is seeking to mobilise funds for its implementation.
Yellow fever: Liberia - update
As of 6 September 2000, a total of 102 suspected cases of
yellow fever was reported by the Ministry of Health, Liberia.
No confirmed cases had occurred outside Grand Cape
Mount County, on the border with Sierra Leone nor in other
parts of the country, including Monrovia.
WHO provided 180,000 doses of yellow fever vaccine and
autodestruct syringes to the Liberian Ministry of Health. On 5
September 2000, WHO, working with NGOs in the area,
began a campaign to vaccinate 150,000 people in the region
at risk. The plan was to have vaccinated 60,000 people by
10 September 2000. WHO will provide additional doses of
vaccine to conduct ‘catch up’ campaigns for non-immune
populations outside the affected area.
Acute febrile illness: USA
The Centers for Disease Control and Prevention (CDC)
have reported preliminary findings of 37 cases of acute
febrile illness. Symptoms include high fever, chills,
headache and myalgia. Twelve cases have been
hospitalised and specimens from two of these have tested
positive for leptospirosis.
The cases were in a group of 155 United States-based
athletes who participated in the Eco-Challenge Sabah 2000
Expedition Race held during 20 August to 3 September in
Sarawak, Malaysia. Also participating were 39 four-person
teams from more than 20 other countries.
CDC has issued an advisory about the suspected
leptospirosis outbreak associated with this event to alert
United States-based participants and health care workers.
WHO is working with the relevant national authorities to
notify the other participants.
Leptospirosis
France
Four cases of leptospirosis associated with the
Eco-Challenge sports event have now been reported in
France. Of the four cases reported, one has been
laboratory- confirmed. WHO is collaborating in case-finding
activities.
Canada
As of 21 September 2000, six suspected cases of
leptospirosis associated with the Eco-Challenge sports
event have been reported in Canada. Two of the six
suspected cases have been laboratory-confirmed. WHO is
collaborating in case-finding activities.
West Nile fever: Israel
As of 19 September, the Ministry of Heath in Israel has
reported 151 cases of West Nile fever with 76 cases
hospitalised and 12 deaths. The Ministry of Health is
implementing control measures which include air and
ground spraying the affected areas with insecticides, with
particular attention to animal houses, ponds and mosquito
breeding areas.
Overseas briefs
Editor: Angela Merianos
Associate Editor: Jenny Thomson
Deputy Editor: Ian Griffith
Editorial and Production Staff
Alison Milton, Margo Eyeson-Annan, Ming Lin
Editorial Advisory Board
Charles Watson (Chair), Mary Beers, Margaret Burgess,
Scott Cameron, John Kaldor, Margery Kennett, Cathy Mead
Website
http://www.health.gov.au/pubhlth/cdi/cdihtml.htm
Contributions
Contributions covering any aspects of communicable diseases areinvited. All contributions are subject to the normal refereeingprocess. Instructions to authors can be found in Commun DisIntell 2000;24:5.
Copyright
� Commonwealth of Australia 2000
This work is copyright. Apart from any use as permitted under theCopyright Act 1968, no part may be reproduced by any processwithout prior written permission from the Commonwealth availablefrom AusInfo. Requests and inquires concerning reproduction andrights should be addressed to the Manager, Legislative Services,AusInfo, GPO Box 1920, Canberra ACT 2601.
Subscriptions and Contacts
Communicable Diseases Intelligence is produced every month bythe National Centre for Disease Control, Department of Health andAged Care, GPO Box 9848, Canberra, ACT, 2601;Fax: (02) 6289 7791, Phone: (02) 6289 8245;email: [email protected].
This journal is indexed by Index Medicus and Medline.
Opinions expressed in Communicable Diseases Intelligence arethose of the authors and not necessarily those of the Department ofHealth and Aged Care or the Communicable Diseases NetworkAustralia New Zealand. Data may be subject to revision.