volume 3 2017 september the first - society of petroleum
TRANSCRIPT

V o l u m e 3 2 0 1 7 S e p t e m b e r
www.spe.no SPE Norway magazine
The First
To gather members To share knowledge
Vo
lum
e 3
20
17
Se
pte
mb
er
Th
e e
lec
tro
nic
ve
rsio
n i
s a
vail
ab
le o
n t
he
pa
ge
of
you
r s
ec
tio
n w
eb
sit
e.
P icture b y V ita K alashnikova. S tuguf l å ten br idge, Nor way
Artificial Intelligence in Oil&Gas from BCG
AGR MultiClient Studies in Barents Sea
Improving Exploration with Paradise Machine Learning
TGT Innovative Solution for Formation Flow
Improve Intervention Efficiency with Visuray’s X-Ray Diagnostics

V o l u m e 3 2 0 1 7 S e p t e m b e r
Inside this issue www.spe.no
From SPE First editors
Innovative technology and digital transformation are buzz words that domi-
nate our industry as we move into new season of the SPE community.
Technical solutions and automated processes are however as good as we
people learn to be good at using them. In order to achieve results from new
innovations, we need to collaborate and communicate with each other.
Luckily there are technologies in place which help us find ways how to
better share information between various disciplines and how to make daily
communication more efficient.
The collaboration between the Board of Directors in Norwegian SPE com-
munity has also improved a lot during the recent years. We think and
breathe alike having the interests of our members as priority. The feedback
from the recent visit of the SPE President, mrs Janeen Judah, was very pos-
itive and highlighted outcomes of this continuous collaboration. To remind,
the SPE community has chosen to form a Norway Council which is man-
aged by mr Igor Orlov and which assembles monthly to discuss the topics
relevant to daily managing of the community.
SPE The First magazine serves the role of being the largest source for
news, events and technical content to the SPE community in Norway. It’s
published quarterly and distributed electronically and in print to all our
members. So if you have a story or innovation you would like to share with
others in our industry, remember to send it to the editorial team of the mag-
azine.
Wishing you a colourful autumn,
Maria Djomia
On behalf of SPE The First editorial team
News from SPE Norway sections 4
Technical Articles
Artificial Intelligence
Artificial Intelligence: The Ultimate Disrupting Force for Oil and Gas Companies by Daniel Schlecht, Philipp A. Gerbert and Sylvain Santamarta; co-authors: Rohit Singh and Karen Schelb, BCG
8
Exploration
AGR develops MultiClient studies in Barents Sea prior to 24th Concession Round by Erik Lorange, AGR’s Exploration Manager
12
Significant Advancements in Seismic Reservoir Characterization with Machine Learning by Rocky Roden and Patricia Santogrossi, Geophysical Insights
14
Well Performance
OPTISIM – Innovative Solution to Obtain Formation Flow Profile From Fiber Optics – DTS and DAS by Sergey Aristov and Rita-Michel Greiss, TGT Oilfield Services
20
Improving Intervention Efficiency with Downhole X-ray Diagnostics by Melissa Spannuth, PhD, Senior Physicist, Visuray
24
Editorial content
SPE Oslo
SPE Stavanger
SPE Bergen
SPE Northern Norway
SPE Trondheim
The First is SPE Norway Regional
publication and is distributed to a multidisci-
pline audience. Circulation: 200 printed
copies, 4,500 electronic copies
The electronic version of this Issue and previ-
ous Issues are available on SPE Norway
websites.
The editorial team takes no responsibility
for accuracy or content of the articles
provided. Technical articles, professional
overviews and SPE section news have no
editorial fee. The editors are working on
voluntary basis.
If you would like to support production of our
magazine by publishing commercial information
about your product/company, please contact
editorial team.
Editors: Vita V Kalashnikova [email protected]
Maria Djomina [email protected]
Maria Djomina
Communications Manager, AGR
Would you like to join the editorial team? Please contact the editors.
Vita Kalashnikova QI Geophysicist,
PSS-Geo AS
SPE The First Editorial team:
The First
V o l u m e 3 2 0 1 7 S e p t e m b e r
An interest in geology shapes the background of Karl Ludvig
Heskestad, the Society of Petroleum Engineers’ regional director for
the North Sea Region. The Norwegian has strong connections to the
natural landscape and as a reservoir engineer understands the com-
plexities of exploration and production activity in locations as diverse
as the Norwegian Continental Shelf and the Barents Sea.
Karl Ludvig has moved into a business development role with a com-
pany that epitomises the collaborative, forward thinking approach
required in a lower cost base oil and gas industry. Aker BP was
formed out of established players Det norske oljeselskap and BP Nor-
ge.
As the voice of the North Sea on the SPE board of directors, Karl
Ludvig is looking forward to the flagship home show that is SPE Off-
shore Europe 2017. He believes a lot has changed on both sides of the
North Sea over the last two years but knows that now is a time to con-
tinue sharing advice and forward planning.
He explained his belief that Norway is slightly ahead of the UK in
terms of emerging from the downturn, but said there are signs of a
positive future for both areas. He said: “Phones are beginning to ring
again and activity is picking up. I have been impressed with the way
vendors have done their bit to reduce their costs and I know operators
have appreciated that and are working closer with the supply chain. It
has been a difficult time with small margins, but there is optimism.
“I hope SPE Offshore Europe will be a chance to communicate what is
actually happening in the North Sea. There has been a rise in activity
and I know the Norwegian Government is expecting a certain number
of final investment decisions to be submitted with high capex esti-
mates. If Norway is picking up, then I expect the green shoots to ap-
pear in the UK too.”
In Karl Ludvig’s day job with Aker BP he has witnessed the benefits
of being a smaller, nimble operator with strong financial and opera-
tional backing. The firm has had an aggressive mergers and acquisi-
tions policy from its outset, gaining production assets to offset a large
capex programme. One of its big developments, Ivar Aasen came
onstream in December last year and the partnership in the massive
Johan Sverdrup field is reaping rewards too. The focus is evidenced by
the share price which rose from $5 to $19 in a year in a low oil price
scenario.
“I think it is important for us to continue to optimise efficiencies so
that when the oil price does rise that the value gain for vendors and
operators can be satisfyingly high. New discoveries are also adding to
the positivity, and I hope there will be a chance to discuss these further
at OE.
“The North Sea is still very highly valued globally, but there are other
exciting discoveries and prospects regionally, for example off the west
coast of Ireland and in the Barents Sea. With the OGA highlighting 30
billion barrels remaining in the UKCS and the Norwegian Petroleum
Directorate forecasting 90 billion barrels there are many years left for
our industry in this region.”
SPE Offshore Europe is a chance
to discuss the new North Sea
Karl Ludvig Heskestad SPE Regional Director North Sea 2016 - 2019
Business Development at Aker BP
The First
This article was first published by Big Partnership agency on behalf of SPE
International in the light of upcoming
Offshore Europe gathering in Aberdeen
V o l u m e 3 2 0 1 7 S e p t e m b e r
News from
Page 4 SPE Norway — News
Get Involved, Get Informed, and Get Ahead as
a SPE Young Professional! Are you looking for new ways to get and stay active in the E&P industry? Or maybe you are an industry newcomer and want to learn how to get ahead? If so, SPE's Young Professional programs will help you. SPE offers you the oppor-tunity to connect with practicing industry professionals; swap advice through the eMentoring and Ambassador Lecture Pro-grams; and learn about the latest industry advances. You can even be nominated for awards, all by being an active SPE YP mem-ber.
Event Calendar Board member Chairman Board member Treasurer
SPE Stavanger Young Professional has newly elected a new board!
Karl Johnny Hersvik (Oilman of the Year, CEO at Aker BP)
SPE Stavanger honored Karl Johnny Hersvik with the Oilman of the Year 2017 award at the annual Dance & BBQ Dinner June 16th. The award was given to Karl Johnny Hersvik (CEO, Aker BP), whom through his work and elected positions has contributed in bridging the gap between academia and the Norwegian petroleum industry. His colleagues describe him as visionary, curious, re-sponsible, predictable and involved - similar to AkerBP’s own cor-porate values. As a leader of Aker BP, Mr. Hersvik has through innovation and in challenging times, developed “Det Norske Oljeselskap” into a Nor-wegian, independent and competitive upstream business with its own successful strategy on the Norwegian Continental Shelf. This has resulted in several well executed transactions involving Det Norske, Marathon Oil and BP Norway. With both fields in produc-tion and under development, and a staff highly competent in pe-troleum production, assumptions are in place to expect good re-sults from Aker BP. The Aker BP operated field Ivar Aasen was delivered well within budget and time during very challenging times. Mr. Hersvik assumed the position as CEO of Aker BP Mai 2014, after leaving the position as head of research in Statoil. Before joining Statoil in 1998, he was actively involved in founding sever-al IT businesses. He has held several leading positions within Norsk Hydro and StatoilHydro.
Øystein Årsheim (Young Engineer of the Year, Reservoir Engineer at Shell)
The SPE Stavanger Young Engineer of the year is given to SPE members who are under the age of 35 and have been nominated by their peers in relation to their achievement and contributions to the petroleum industry. Øystein is 28 years old and has a degree from NTNU in Trond-heim. He is a member of SPE and the local board at NPF Young and currently holds a position as reservoir Engineer at Shell, working with the Ormen Lange field. The award is related to his contribu-tions to better understanding the subsurface uncertainties at the Ormen Lange field.
Milad Khatibi (PhD - Philosophiae Doctor) His current PhD research involves laser measurement and well-bore fluid dynamics. After working as a mechanical engineer at a methanol plant in Iran, Milad started his master degree at NTNU in 2011 and his doctorate degree at UiS in 2014. He is an interme-diate level learner of Norwegian at the high school Bryne. Working as a PhD student at the university for the last three years, Milad possesses the rare combination of being a comprehensive and innovative researcher working on advanced equipment, while at the same time mastering numerical modeling, required theory and general duties as a PhD student. Milad is also very helpful to his fellow students.
Iris Kam Sok Yee (MSc - Master of Science Petroleum Engineering)
Iris came to Stavanger in 2015 and started her two years of petro-leum engineering master studies with a drilling specialization. Before arriving in Norway, Iris worked as mechanical engineer for four years on developing production packers and other tools at Halliburton in Singapore and Texas. Earlier she had an internship as a procurement assistant at ExxonMobil. Iris is a top A-student while at the same time working with IRIS as part of the Visual Arena project and with the university as a petro-leum engineering graduate teaching assistant. In her master level research she investigated how nanoparticles can be used to better design drilling and completion fluids. Iris receives strong recom-mendations from petroleum engineering faculty members.
Sindre Langås Forsetløkken (BSc - Bachelor of Science Petroleum Engineering) Sindre was part of the famous SPE PetroBowl team of 2016, earn-ing the European championship for the Stavanger chapter! For the last three years he worked part time at the university as a mathe-matics and natural sciences mentor to inspire young people to choose this as a career. His student exchange semester took place in North Dakota and he has worked in India as an intern. He has achieved all A grades in his university course work.
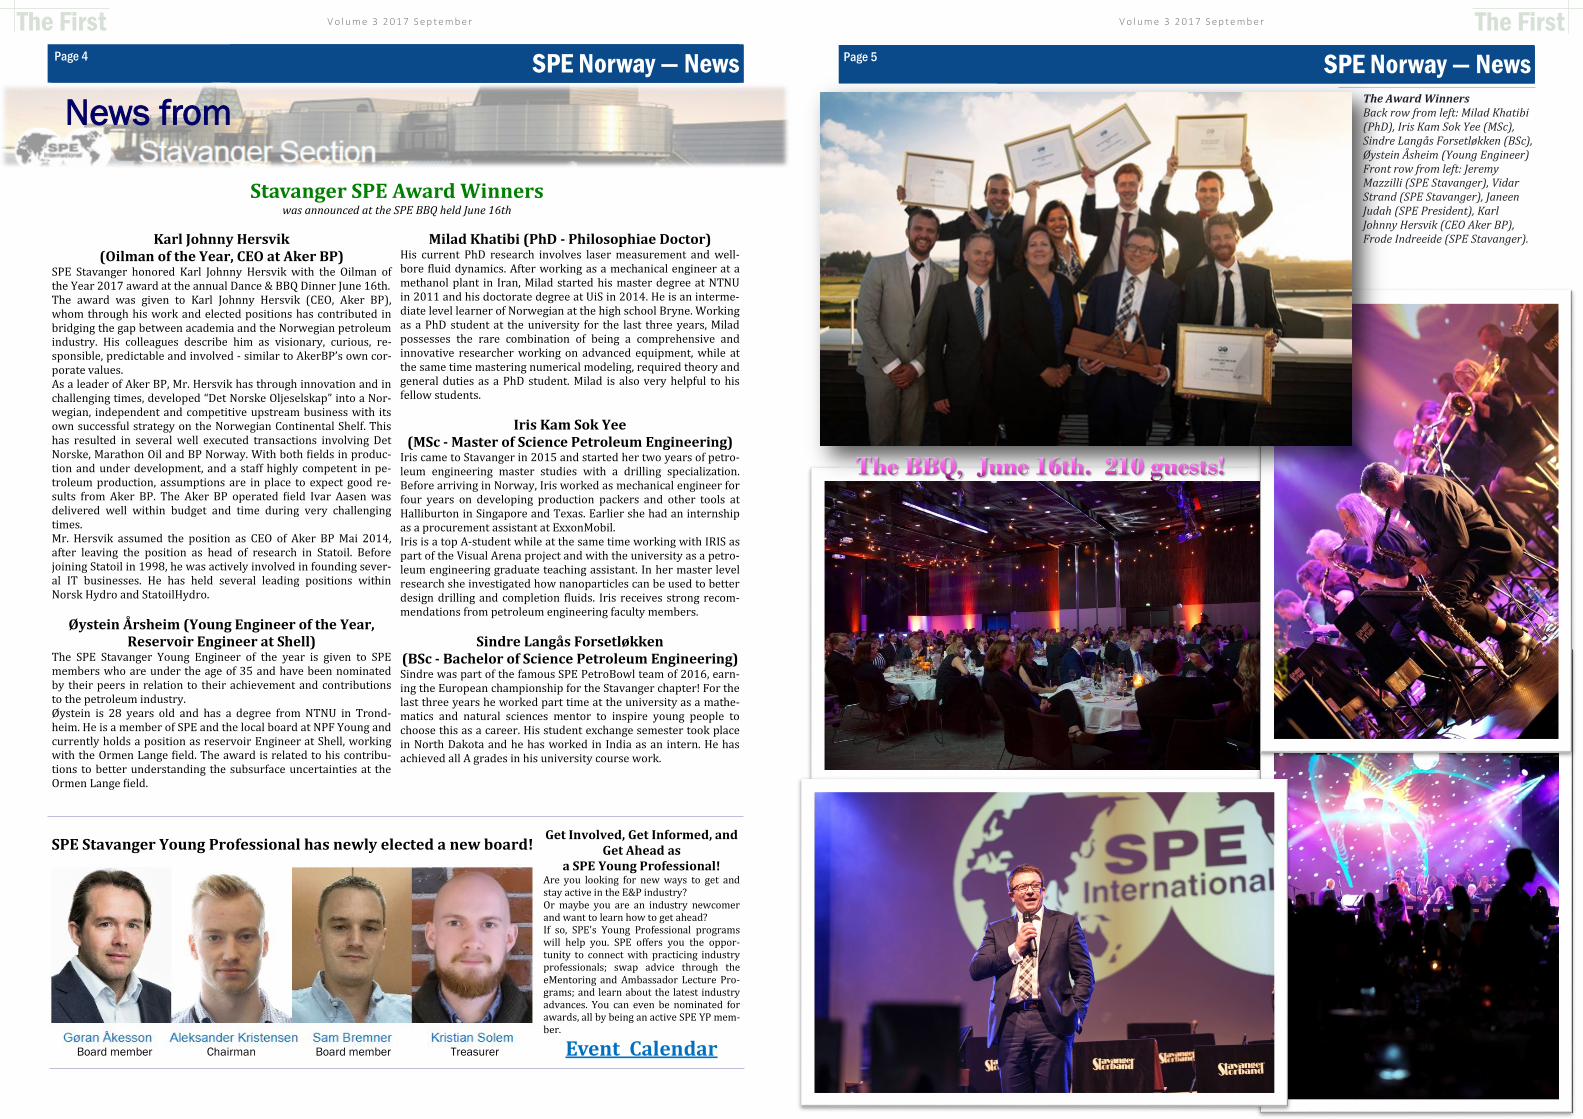
Stavanger SPE Award Winners was announced at the SPE BBQ held June 16th
The First
V o l u m e 3 2 0 1 7 S e p t e m b e r The First Page 5 SPE Norway — News
The Award Winners Back row from left: Milad Khatibi (PhD), Iris Kam Sok Yee (MSc), Sindre Langås Forsetløkken (BSc), Øystein Åsheim (Young Engineer) Front row from left: Jeremy Mazzilli (SPE Stavanger), Vidar Strand (SPE Stavanger), Janeen Judah (SPE President), Karl Johnny Hersvik (CEO Aker BP), Frode Indreeide (SPE Stavanger).

V o l u m e 3 2 0 1 7 S e p t e m b e r
SPE Bergen Section welcomed the summer with the most popular event of the year – sailing with Statsraad Lehmkuhl. The evening started with presentation from Wintershall and ended with nearly 200 oil & gas professionals on board what is likely to be Nor-way’s most beautiful ship. We look forward to a busy autumn with many events already confirmed and encourage the companies across Norway to contact us regarding possibility to present at our TechNights.
SPE BERGEN SECTION EVENT CALENDAR
October: TechNight – Completions November: TechNight – Focus on Fluids & Cement
& Yearly Lutefisk dinner
News from SPE Bergen Section
News from SPE Oslo Section
Sept. 6 2017 SPE Oslo Kick off event!
50 Years of The Oil Industry in Norway
Speaker
Ingvil Smines Tybring‐Gjedde, State Secretary from the Olje- og energidepartement (Ministry of Petroleum and Energy).
Society of Petroleum Engineers (SPE) Oslo Section would like to invite you for Season 2017-2018 Kick-off Dinner Meeting to take place at Hotel Continental on Sept. 6 2017 starting at 17:30.
Sept. 7 2017 5 pm Social event and Petro Quiz!
Register now
Register here
Page 6 SPE Norway — News
The First
V o l u m e 3 2 0 1 7 S e p t e m b e r
V o l u m e 3 2 0 1 7 S e p t e m b e r The First
Page 8 SPE Norway — Oil&Gas and Artificial Intelligence
Artificial Intelligence: The Ultimate Disrupting
Force for Oil and Gas Companies
by Daniel Schlecht, Philipp A. Gerbert and Sylvain Santamarta; co-authors: Rohit Singh and Karen Schelb
THE BOSTON CONSULTING GROUP
Daniel Schlecht Partner and Managing
Director, Düsseldorf [email protected]
Artificial intelligence (AI) has exploded onto the
scene in recent years, promising to change every-
thing from how we live to the ways companies
work, create value, and serve consumers. While
the causes of this explosion—increasing pro-
cessing and storage power, abundant data availa-
bility, and AI algorithmic advancements—are well
known, the effects are not. Few organizations are
"AI-ready."
In a joint study to be published in September,
"Reshaping Business with Artificial Intelligence,"
BCG and MIT Sloan Management Review analyze
the state of AI today and in the future in 21 indus-
tries. While very few companies have made great
strides today, BCG expects a strong impact in the
next two to five years. In addition, the upcoming
BCG report "A Practitioner’s Guide to Artificial
Intelligence" will discuss cross-industry use cases
that can spur competitive advantage and value
creation.
In the O&G industry, several AI applications have
already emerged. Other industries have also made
advances that can be transferred to O&G. In this
article, we examine the AI use case landscape
specifically for O&G.
Upstream
AI will enable companies to optimize field devel-
opment from exploration to production. O&G
companies have been using advanced data pro-
cessing and simulation technology for many years.
These tools are now being augmented by machine
learning and AI techniques. Recently, companies
have started to experiment with autonomous un-
derwater drones, which are seeing rapid innova-
tion, similar to aerial drones. AI-enabled vehicles
will bring a wide range of opportunities to the
offshore O&G industry such as seabed surveys,
metocean data gathering, oil spill detection, in-
spection, and underwater intervention. Compared
to today's solutions, performance will be at a much
higher level of precision and cost will just be a
fraction of what we are seeing today.
In exploration, for example, AI can help to support
better and faster interpretation of seismic data to
identify hydrocarbon deposits. AI is also expected
to help engineering firms and operators make bet-
ter and faster design choices, integrating a broad
set of parameters and involving a large number of
companies. AI can effectively revolutionize pro-
ject delivery by challenging the sequential project
maturation process used by industry players today.
In drilling, AI can help to identify the best loca-
tions and optimize drilling operations. AI will
likely play a valuable role in real-time modeling
and prediction of drill bit and drill string perfor-
mance. Overall, and also impacted by factors out-
side drilling, productivity improvements of AI-
enabled processes can generate significant value
for O&G companies.
In the mining industry, AI is already being used to
help automate machinery and vehicles and mini-
mize health and security hazards for autonomous
operations. The ultimate goal in O&G is an un-
manned oil platform.
We expect AI systems to play a key role in im-
proving health, safety, and environmental (HSE)
performance by minimizing direct interaction of
humans with heavy equipment and by using image
recognition systems to reduce hazardous situa-
tions. In addition, AI can help to ensure that the
industry can leverage the experience of an aging
workforce. For example, national-language pro-
cessing systems can help catalog and mine the
knowledge embedded in, for example, workers'
notebooks, e-mails, and conversations.
Based on BCG client experience, operations opti-
mization and predictive maintenance hold great
potential. O&G companies and suppliers have
already started to implement self-learning algo-
rithms to improve optimization. They are also
continuously integrating sensor and system data
with predictive tools to improve real-time decision
-making. Operation centers with AI capabilities
can monitor operations, offer advice to engineers,
and send alerts in case of identified risks. AI is
also increasingly automating root cause failure
analyses as self-learning AI systems move from
description to prediction to prescription. As a re-
sult, engineers will have to spend less time on
administrative or data-related work and can focus
on value creation.
O&G companies can save millions of dollars by,
for example, using AI to minimize unplanned
downtime and production loss. According to Sloan
Management Review, a medium-sized liquefied
natural gas facility has an average of five down
days a year, with an implied production loss of
$125 million to $150 million. For an offshore
platform, downtime losses can average $7 million
per day. Especially in times of low energy prices,
any reduction in operating costs is critical.
Philipp A. Gerbert Senior Partner and Managing
Director, Munich [email protected]
Sylvain Santamarta Partner and Managing
Director, Oslo [email protected]
V o l u m e 3 2 0 1 7 S e p t e m b e r
Midstream
Companies can use AI to optimize transport
operations including pipeline and secondary
logistics. For example, AI will help to im-
prove maintenance and inspection intervals of
pipelines by analyzing and predicting the level
of corrosion in combination with environmen-
tal and operational information. Technologies
such as AI-powered surveillance drones can
be used to gather the pipeline data needed for
such analyses.
Downstream
In O&G trading, analytics technologies and
AI are increasing the liquidity and availability
of data and information and enabling advance-
ments in pre-trade, trade, and post-trade activ-
ities. This is putting pressure on established
O&G trading capabilities. Self-learning algo-
rithms can absorb and analyze data far more
thoroughly than humans and fundamentally
transform O&G trading. Companies that do
not enable their trading with AI are at risk.
For a cross-industry perspective, BCG has
published the study "Attack of the Algo-
rithms: Value Chain Disruption in Commodi-
ty Trading."
AI is becoming increasingly important for
refineries in downstream operations, especial-
ly in predictive maintenance. Machine learn-
ing helps to identify the causes of failures and
unplanned outages, and suggests measures to
extend machinery lifetime and load. It can
also improve and optimize scheduled opera-
tion cycles. Even when only little or incom-
plete information is available, O&G compa-
nies can unlock multimillion dollar savings
through these measures.
In the retail business, AI is improving custom-
er service and customer interaction. Chatbots
are available around the clock to answer com-
mon customer questions. Natural language
processing has not yet been perfected but
increasingly offers a human-like interaction.
Virtual assistants can incorporate context-
related information such as product or cus-
tomer data to personalize answers or recom-
mendations. These tools have the potential to
increase customer satisfaction and cross-
selling while reducing churn.
Data and AI building blocks
Regardless of how AI is used along the O&G
value chain, it will be critical for companies to
generate, capture, and clean contextual data
and to give data a new meaning and new mo-
mentum. O&G companies can enable self-
learning systems and create new insights and
automation beyond human capabilities by
leveraging large amounts of data which often
already exist. This requires some effort and
foresight since data sets are often in incompat-
ible formats, unstructured, or incomplete and
thus have to be cleaned and prepared for AI
use. More generally, operators will already
need to establish a clear data strategy today to
systematically and efficiently leverage the
power of large amounts of data generated by
their operations.
In addition, different "building blocks" are
essential for all AI systems. The upcoming
BCG report "AI in Business: A Practitioner's
Guide" further elaborates on the essential
components of AI. They are more advanced
than a single algorithm but not operational by
themselves. All O&G AI use cases are based
on single or sets of building blocks. The basic
functionality of these blocks is often available
in the market but needs to be tailored to indi-
vidual needs.
Machine vision is the classification and track-
ing of real-world objects based on visual and
other signals, such as pictures and videos.
Speech recognition is the transformation of
auditory signals into text. Siri or Alexa are
consumer examples, while Nuance's Pow-
erScribe for radiologists is a commercial ex-
ample.
Natural language processing (NLP) is the
interpretation of text. NLP is used to recog-
nize spam, fake news, and sentiments such as
happiness, sadness, and aggression.
Information processing covers methodologies
to derive information from unstructured text
and provide answers to queries.
The First
Page 9 SPE Norway — Oil&Gas and Artificial Intelligence
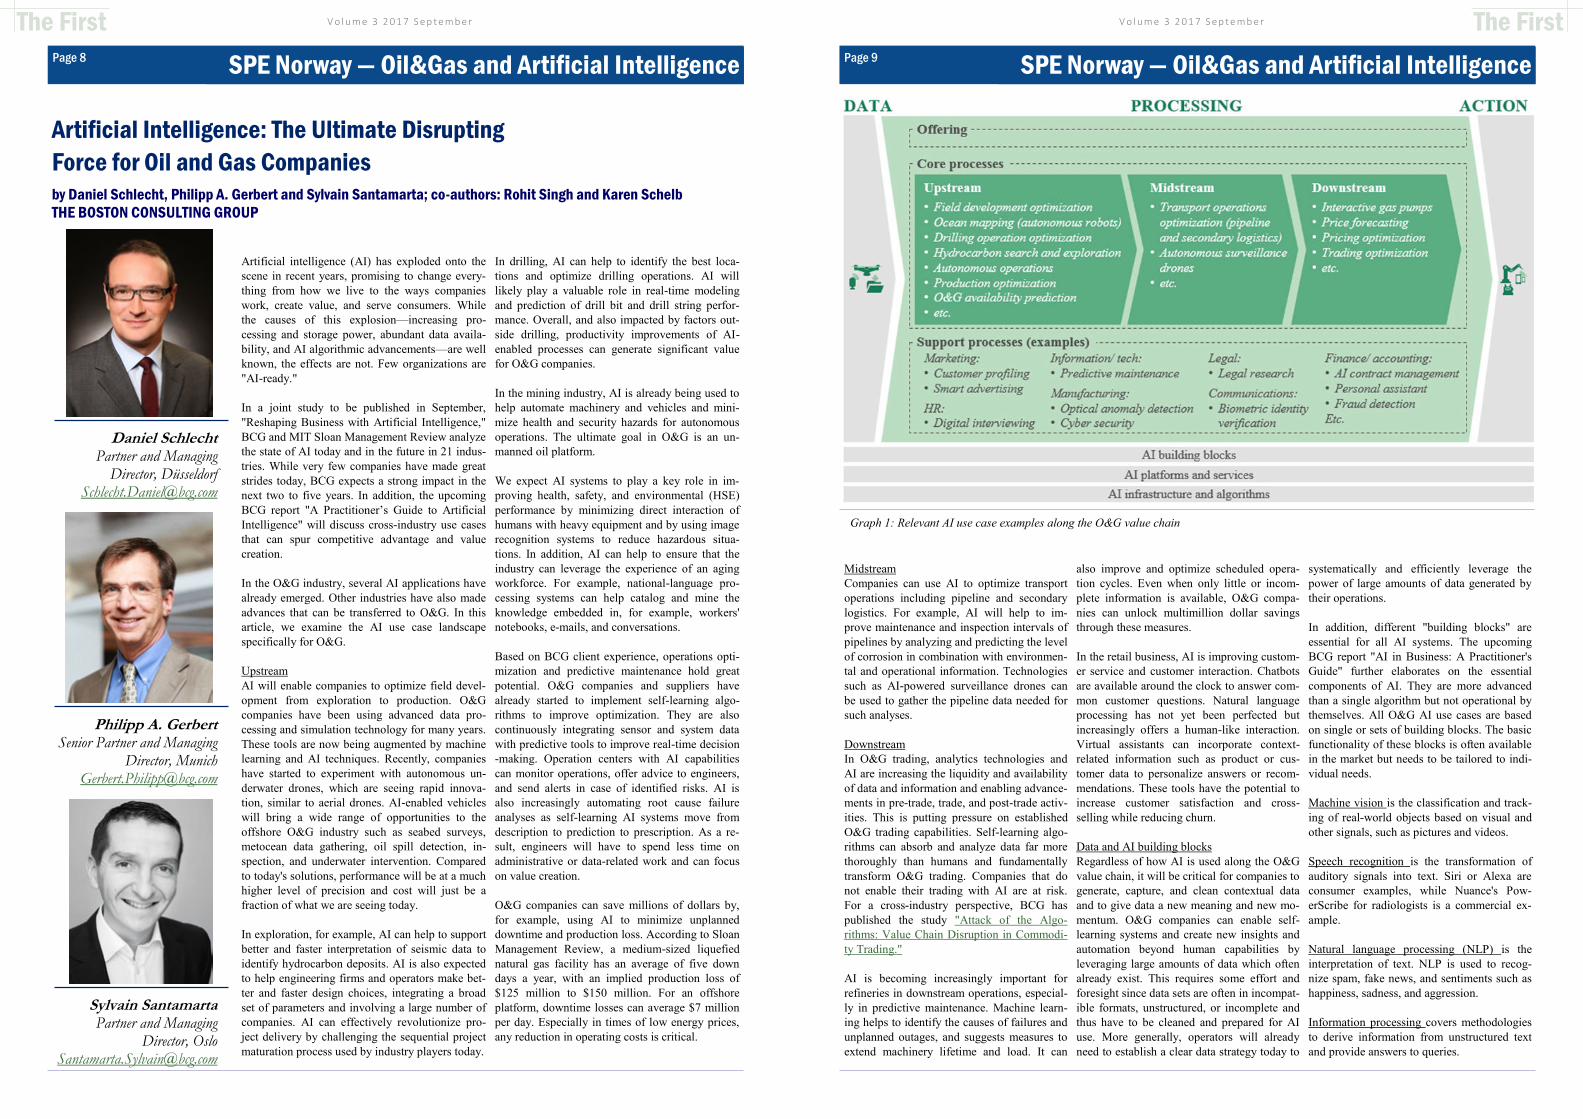
Graph 1: Relevant AI use case examples along the O&G value chain
V o l u m e 3 2 0 1 7 S e p t e m b e r
Learning from data is essentially machine
learning. It is the ability to predict values or
classify information based on historic data and
refers to the application of machine learning
to new data. Anomaly detection used by cyber
-security systems is an example of learning
from data.
Planning and exploring agents are methods
that identify the best sequence of actions to
achieve a goal, such as self-driving cars navi-
gating autonomously to their target destina-
tion.
Image generation creates images based on
models. It is the inverse of machine vision and
can be used to complete images that have no
background or transfer oil paintings to photo
images.
Speech generation covers both text generation
from data and the synthesis of speech and
text. Chatbots and Alexa are examples com-
monly used today.
Handling and control refers to interaction of
robots with real-world objects, such as robots
autonomously picking up and delivering items
within a warehouse without human interac-
tion.
Navigating and movement describes robots
moving through difficult, unstructured envi-
ronments on legs, such as robots climbing
stairs or mastering sidewalks. A second, inde-
pendent task is that of navigation and localiza-
tion.
Getting engaged in AI means that O&G exec-
utives have to think beyond individual use
cases and across different dimensions, since
the business implications and requirements of
AI span the entire organization. Four lenses
are especially helpful: customer needs, tech-
nological advancements, data sources, and
(decomposition of) processes. The BCG re-
port "Competing in the Age of Artificial Intel-
ligence" discusses the question of how busi-
ness leaders can harness AI to take advantage
of the specific strengths of man and machine.
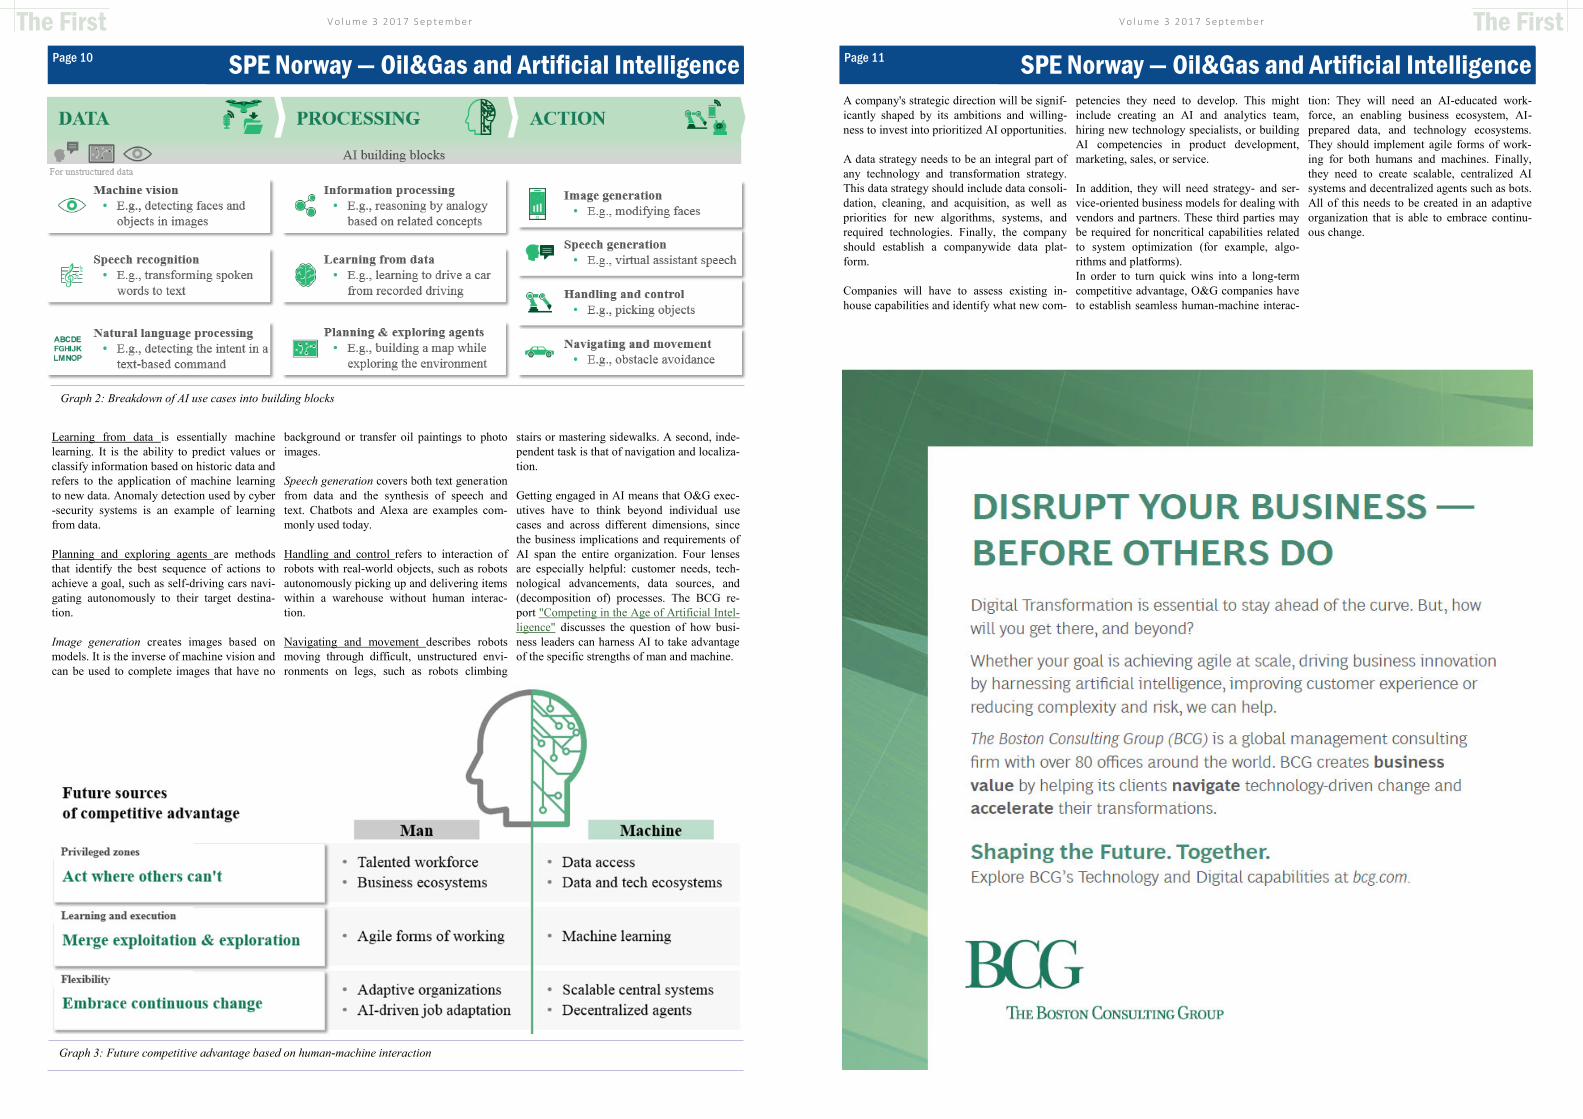
Graph 2: Breakdown of AI use cases into building blocks
The First
Page 10 SPE Norway — Oil&Gas and Artificial Intelligence
Graph 3: Future competitive advantage based on human-machine interaction
V o l u m e 3 2 0 1 7 S e p t e m b e r
A company's strategic direction will be signif-
icantly shaped by its ambitions and willing-
ness to invest into prioritized AI opportunities.
A data strategy needs to be an integral part of
any technology and transformation strategy.
This data strategy should include data consoli-
dation, cleaning, and acquisition, as well as
priorities for new algorithms, systems, and
required technologies. Finally, the company
should establish a companywide data plat-
form.
Companies will have to assess existing in-
house capabilities and identify what new com-
petencies they need to develop. This might
include creating an AI and analytics team,
hiring new technology specialists, or building
AI competencies in product development,
marketing, sales, or service.
In addition, they will need strategy- and ser-
vice-oriented business models for dealing with
vendors and partners. These third parties may
be required for noncritical capabilities related
to system optimization (for example, algo-
rithms and platforms).
In order to turn quick wins into a long-term
competitive advantage, O&G companies have
to establish seamless human-machine interac-
tion: They will need an AI-educated work-
force, an enabling business ecosystem, AI-
prepared data, and technology ecosystems.
They should implement agile forms of work-
ing for both humans and machines. Finally,
they need to create scalable, centralized AI
systems and decentralized agents such as bots.
All of this needs to be created in an adaptive
organization that is able to embrace continu-
ous change.
The First
Page 11 SPE Norway — Oil&Gas and Artificial Intelligence
V o l u m e 3 2 0 1 7 S e p t e m b e r
AGR’s MultiClient studies provide an entry
tool for its clients to obtain a significant
amount of interpreted key horizons and well
data, supported by a complete public 2D and
3D seismic database on which to make sound
planning and investment decisions.
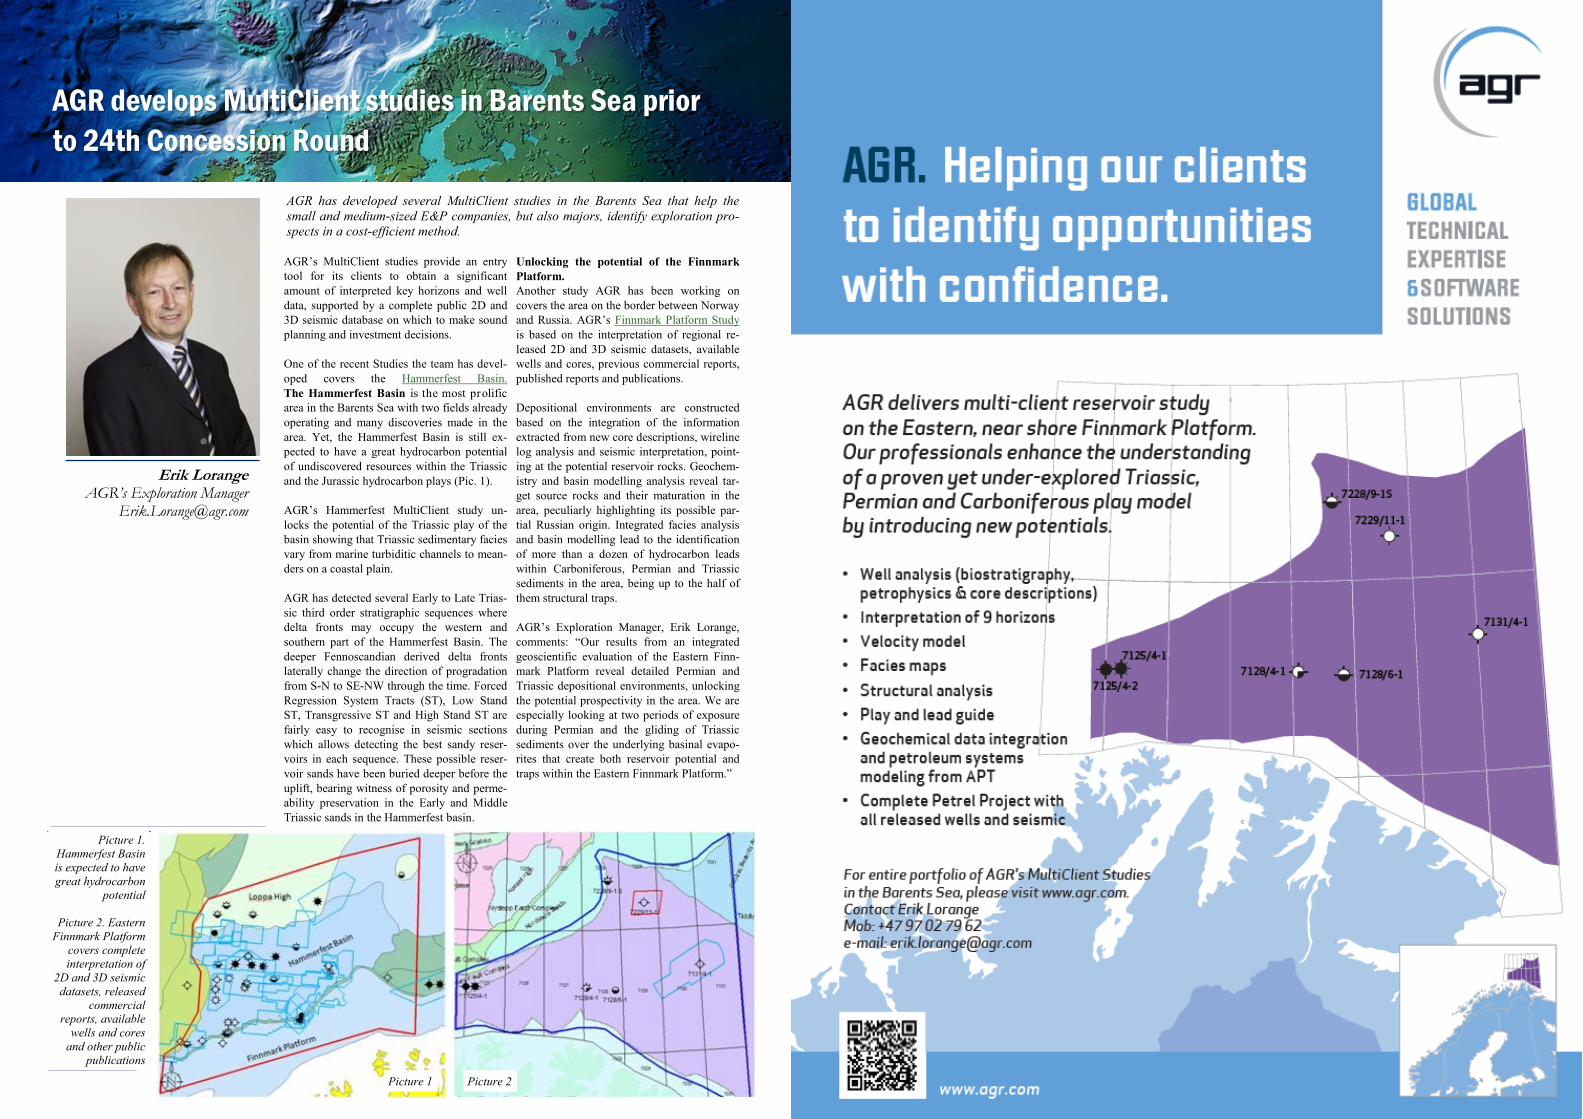
One of the recent Studies the team has devel-
oped covers the Hammerfest Basin.
The Hammerfest Basin is the most prolific
area in the Barents Sea with two fields already
operating and many discoveries made in the
area. Yet, the Hammerfest Basin is still ex-
pected to have a great hydrocarbon potential
of undiscovered resources within the Triassic
and the Jurassic hydrocarbon plays (Pic. 1).
AGR’s Hammerfest MultiClient study un-
locks the potential of the Triassic play of the
basin showing that Triassic sedimentary facies
vary from marine turbiditic channels to mean-
ders on a coastal plain.
AGR has detected several Early to Late Trias-
sic third order stratigraphic sequences where
delta fronts may occupy the western and
southern part of the Hammerfest Basin. The
deeper Fennoscandian derived delta fronts
laterally change the direction of progradation
from S-N to SE-NW through the time. Forced
Regression System Tracts (ST), Low Stand
ST, Transgressive ST and High Stand ST are
fairly easy to recognise in seismic sections
which allows detecting the best sandy reser-
voirs in each sequence. These possible reser-
voir sands have been buried deeper before the
uplift, bearing witness of porosity and perme-
ability preservation in the Early and Middle
Triassic sands in the Hammerfest basin.
Unlocking the potential of the Finnmark
Platform.
Another study AGR has been working on
covers the area on the border between Norway
and Russia. AGR’s Finnmark Platform Study
is based on the interpretation of regional re-
leased 2D and 3D seismic datasets, available
wells and cores, previous commercial reports,
published reports and publications.
Depositional environments are constructed
based on the integration of the information
extracted from new core descriptions, wireline
log analysis and seismic interpretation, point-
ing at the potential reservoir rocks. Geochem-
istry and basin modelling analysis reveal tar-
get source rocks and their maturation in the
area, peculiarly highlighting its possible par-
tial Russian origin. Integrated facies analysis
and basin modelling lead to the identification
of more than a dozen of hydrocarbon leads
within Carboniferous, Permian and Triassic
sediments in the area, being up to the half of
them structural traps.
AGR’s Exploration Manager, Erik Lorange,
comments: “Our results from an integrated
geoscientific evaluation of the Eastern Finn-
mark Platform reveal detailed Permian and
Triassic depositional environments, unlocking
the potential prospectivity in the area. We are
especially looking at two periods of exposure
during Permian and the gliding of Triassic
sediments over the underlying basinal evapo-
rites that create both reservoir potential and
traps within the Eastern Finnmark Platform.”
Erik Lorange AGR’s Exploration Manager
Picture 1.
Hammerfest Basin
is expected to have
great hydrocarbon
potential
Picture 2. Eastern
Finnmark Platform
covers complete
interpretation of
2D and 3D seismic
datasets, released
commercial
reports, available
wells and cores
and other public
publications
AGR develops MultiClient studies in Barents Sea prior
to 24th Concession Round
AGR has developed several MultiClient studies in the Barents Sea that help the
small and medium-sized E&P companies, but also majors, identify exploration pro-
spects in a cost-efficient method.
Picture 1 Picture 2
V o l u m e 3 2 0 1 7 S e p t e m b e r

V o l u m e 3 2 0 1 7 S e p t e m b e r
Machine Learning Methodology
Taking advantage of today’s computing technolo-
gy, visualization techniques, and an understanding
of machine learning on seismic data, Self-
Organizing Maps (SOMs) (Kohonen, 2001), effi-
ciently distills multiple seismic attributes into
classification and probability volumes (Smith and
Taner, 2010). When applied on a multi-attribute
seismic sample basis, SOM is a powerful non-
linear cluster analysis and pattern recognition ma-
chine learning approach that helps interpreters
identify patterns in their data that can relate to
inherent geologic characteristics and different
aspects of their data. SOM analysis, which is an
unsupervised neural network application, when
properly applied has been able to reveal both thin
beds and DHIs in appropriate geologic settings.
Figure 1 illustrates a single seismic amplitude
trace and seven different seismic attributes com-
puted from the amplitude data. All of these traces
are displayed in a wiggle-trace variable area for-
mat. This display represents 100 ms vertically and
each horizontal scale line represents a sample (4
ms). Each of these attributes are at different scales
and in some cases vastly different scales. It is
evident from this Figure that each of the attributes
measure a different component of the total acous-
tic energy at every sample. SOM identifies clus-
ters where different combinations of attributes
congregate to reveal significant information about
The First
Page 14 SPE Norway — Exploration
Significant Advancements in Seismic Reservoir Characterization
with Machine Learning by Rocky Roden and Patricia Santogrossi, Geophysical Insights
Rocky Roden Consulting Geophysicist,
Geophysical Insights
Patricia Santogrossi Sr. Geoscientist,
Geophysical Insights
The application of machine learning to classify seismic attributes at single sample resolu-
tion is producing results that reveal more reservoir characterization information than is
available from traditional interpretation methods. Two consequences of applying machine
learning with several appropriately chosen seismic attributes include the discrimination of
thin beds that are below conventional seismic tuning and the identification of Direct Hydro-
carbon Indicators (DHIs). These capabilities enable a higher resolution interpretation of
reservoirs and stratigraphy. An explanation of the machine learning methodology and its
application to thin beds and DHIs is described briefly in this paper.
Figure 1. Wiggle-trace variable area display format of a 100 ms window of seismic data with the
amplitude trace and seven associated traces of attributes. Each attribute trace is at a different scale
and each horizontal scale line is separated by the sample interval of 4 ms. If all these traces were
employed in a SOM analysis, each red circle along a timing line indicates samples that would be
input as a multi-attribute sample
For information on the Paradise®
multi-attribute analysis software
contact PSS-Geo in Norway at
+4797567452 or
email [email protected]
V o l u m e 3 2 0 1 7 S e p t e m b e r
the natural groupings that are difficult to view
any other way. The self-organizing property
of SOM identifies and classifies natural clus-
ters.
The SOM machine learning process is graph-
ically presented in Figure 2. How large an
area to select is dependent on the size of the
geologic feature to be interpreted. For thin
beds and DHIs, usually a relatively thin zone
of 50-250 ms around the anomalies is selected
over a reasonable areal extent to provide suffi-
cient data points for the SOM analysis. The
selection of the seismic attributes is usually
based on principal component analysis (PCA)
and an interpreter’s knowledge of appropriate
attributes for the area. Experience with SOM
analysis has indicated that six to ten instanta-
neous seismic attributes are usually selected
for thin beds and DHIs, depending on the
geologic setting and data quality. In Figure 2
ten attributes are employed and all the data
points from every sample from these attributes
in the zone to be analyzed are placed in attrib-
ute space where they are normalized to put on
the same scale. The SOM process employs
cooperative and competitive learning tech-
niques to identify the natural patterns or clus-
ters in the data. Each pattern is identified by a
neuron that sorts through the data in attribute
space during the SOM training process of self
-organization. In Figure 2 after training is
completed, 64 winning neurons have identi-
fied 64 patterns or clusters in attribute space
with an 8X8 neuron network. The SOM re-
sults are nonlinearly mapped back to a neuron
topology map (2D colormap) where interpret-
ers can select the winning neurons from the
2D colormap and identify in the 3D volume
where the patterns and clusters occur for thin
beds and DHIs.
In addition to the resultant classification vol-
ume, a probability volume is also generated
which is a measure of the Euclidean distance
from a data point to its associated winning
neuron in attribute space (Roden et al., 2015).
The winning neuron identifies a specific clus-
ter or pattern. It has been discovered that a
low classification probability corresponds to
areas that are quite anomalous as opposed to
high probability zones that relate to regional
and common events in the data. Low proba-
bility anomalies identified by the SOM pro-
cess are quite often associated with DHI char-
acteristics.
Discriminating Thin Beds
The conventionally accepted definition of the
tuning thickness (vertical resolution) is a bed
that is ¼ wavelength in thickness, for which
reflections from its upper and lower surfaces
interfere and interference is constructive
where the interface contrasts are of opposite
polarity, often resulting in an exceptionally
strong reflection (Sheriff, 2002). Several
authors have described approaches to measure
below tuning or thin beds usually employing
various scaling techniques of amplitude or
inversion data (Meckel and Nath, 1977;
Neidell and Poggiagliolmi, 1977; Schramm et
al., 1977; Brown et al., 1986; and Connolly,
2007). However, these various techniques to
determine thin beds have limitations and re-
quire assumptions that may not be met con-
sistently (Simm, 2009). The application of
SOM machine learning utilizing a multi-
attribute classification has enabled the identi-
fication of thin beds and stratigraphy below
tuning in a systematic and consistent manner
as represented in the following case study.
The Eagle Ford Shale is a well-known uncon-
ventional resource play in Texas. Operators
in this play must account for changing stratig-
raphy and facies to properly locate horizontal
wells for optimum perforation intervals. The
Eagle Ford stratigraphy is often associated
with thin beds and facies well below conven-
tional seismic resolution that change both
vertically and laterally. This Eagle Ford case
study contains 216 mi² (560 km²) of enhanced
3D PSTM data processed at a 2 ms sample
interval. Conventional vertical resolution
(tuning thickness) is 100-150 feet (30-45 me-
ters) depending on the location within the
Eagle Ford unit. In this study, over 300 wells
were available for correlation including 23
type logs, 249 horizontal borehole montages,
The First
Page 15 SPE Norway — Exploration
Figure 2. Display of SOM workflow where selected volume and data points from ten associated seismic attributes are input into Attribute
Space. These data points are scaled and analyzed by the SOM process to identify 64 patterns by associated winning neurons. These neurons
are nonlinearly mapped back to a 2D colormap where interpreters identify neurons and visually view the location of the patterns in the 3D
survey
V o l u m e 3 2 0 1 7 S e p t e m b e r
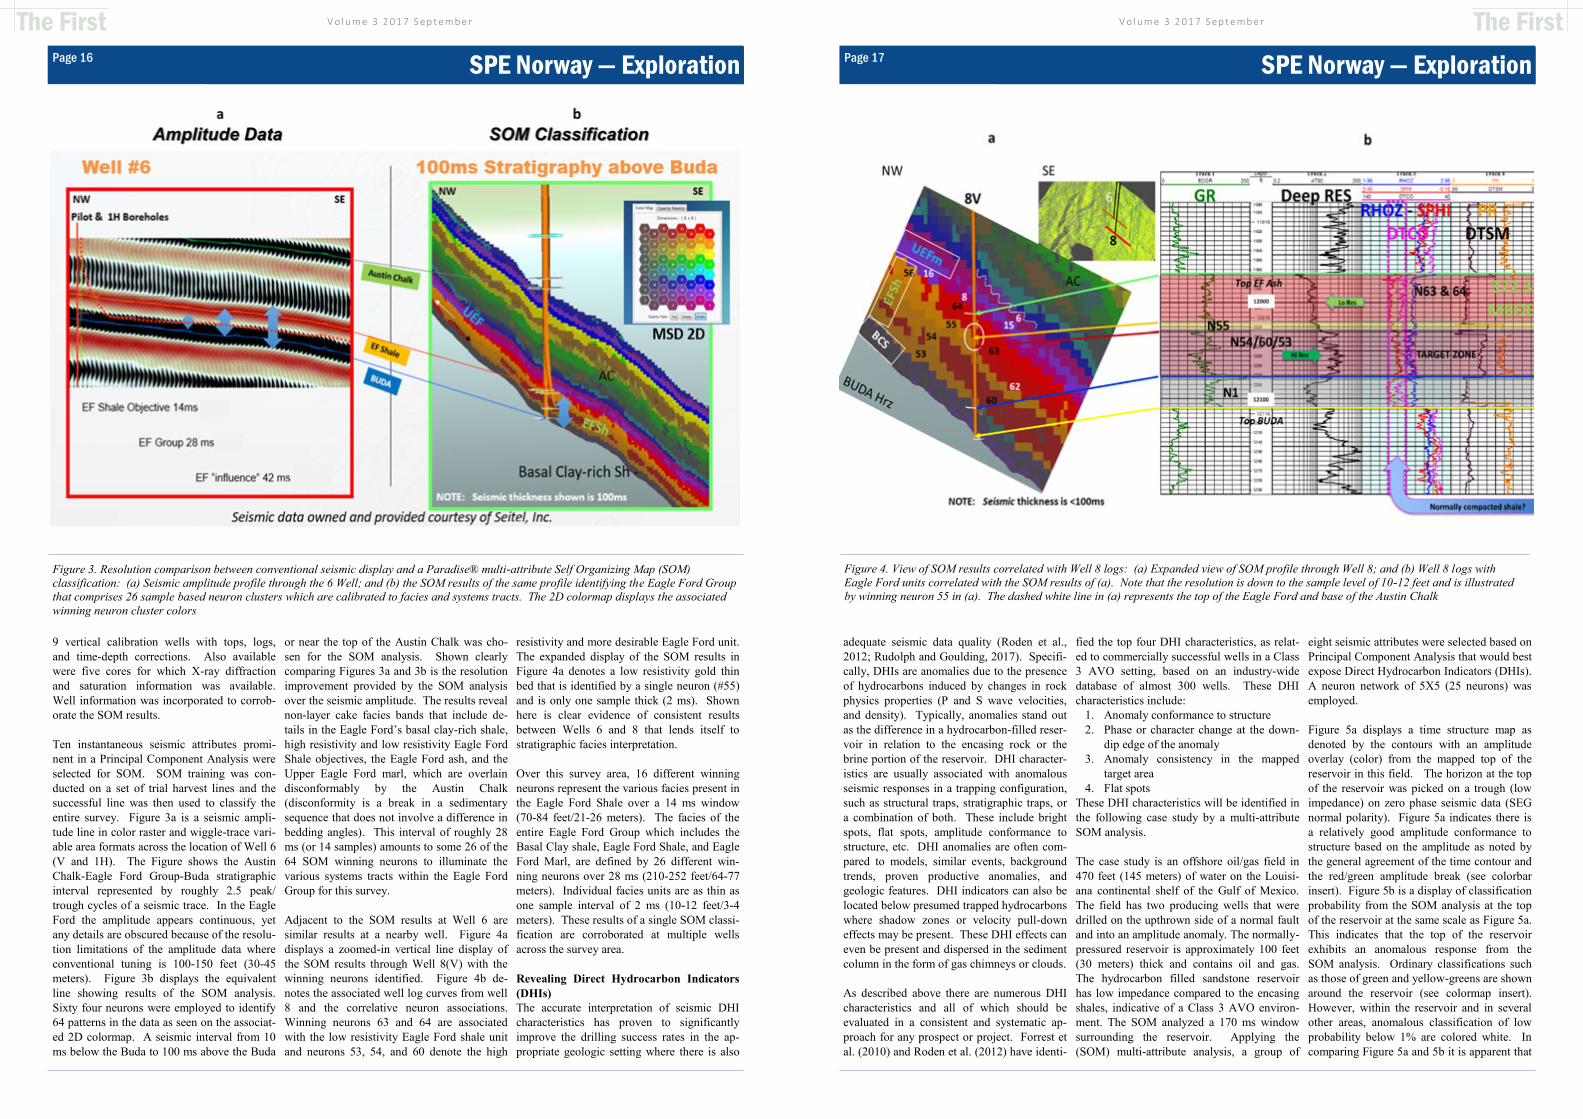
9 vertical calibration wells with tops, logs,
and time-depth corrections. Also available
were five cores for which X-ray diffraction
and saturation information was available.
Well information was incorporated to corrob-
orate the SOM results.
Ten instantaneous seismic attributes promi-
nent in a Principal Component Analysis were
selected for SOM. SOM training was con-
ducted on a set of trial harvest lines and the
successful line was then used to classify the
entire survey. Figure 3a is a seismic ampli-
tude line in color raster and wiggle-trace vari-
able area formats across the location of Well 6
(V and 1H). The Figure shows the Austin
Chalk-Eagle Ford Group-Buda stratigraphic
interval represented by roughly 2.5 peak/
trough cycles of a seismic trace. In the Eagle
Ford the amplitude appears continuous, yet
any details are obscured because of the resolu-
tion limitations of the amplitude data where
conventional tuning is 100-150 feet (30-45
meters). Figure 3b displays the equivalent
line showing results of the SOM analysis.
Sixty four neurons were employed to identify
64 patterns in the data as seen on the associat-
ed 2D colormap. A seismic interval from 10
ms below the Buda to 100 ms above the Buda
or near the top of the Austin Chalk was cho-
sen for the SOM analysis. Shown clearly
comparing Figures 3a and 3b is the resolution
improvement provided by the SOM analysis
over the seismic amplitude. The results reveal
non-layer cake facies bands that include de-
tails in the Eagle Ford’s basal clay-rich shale,
high resistivity and low resistivity Eagle Ford
Shale objectives, the Eagle Ford ash, and the
Upper Eagle Ford marl, which are overlain
disconformably by the Austin Chalk
(disconformity is a break in a sedimentary
sequence that does not involve a difference in
bedding angles). This interval of roughly 28
ms (or 14 samples) amounts to some 26 of the
64 SOM winning neurons to illuminate the
various systems tracts within the Eagle Ford
Group for this survey.
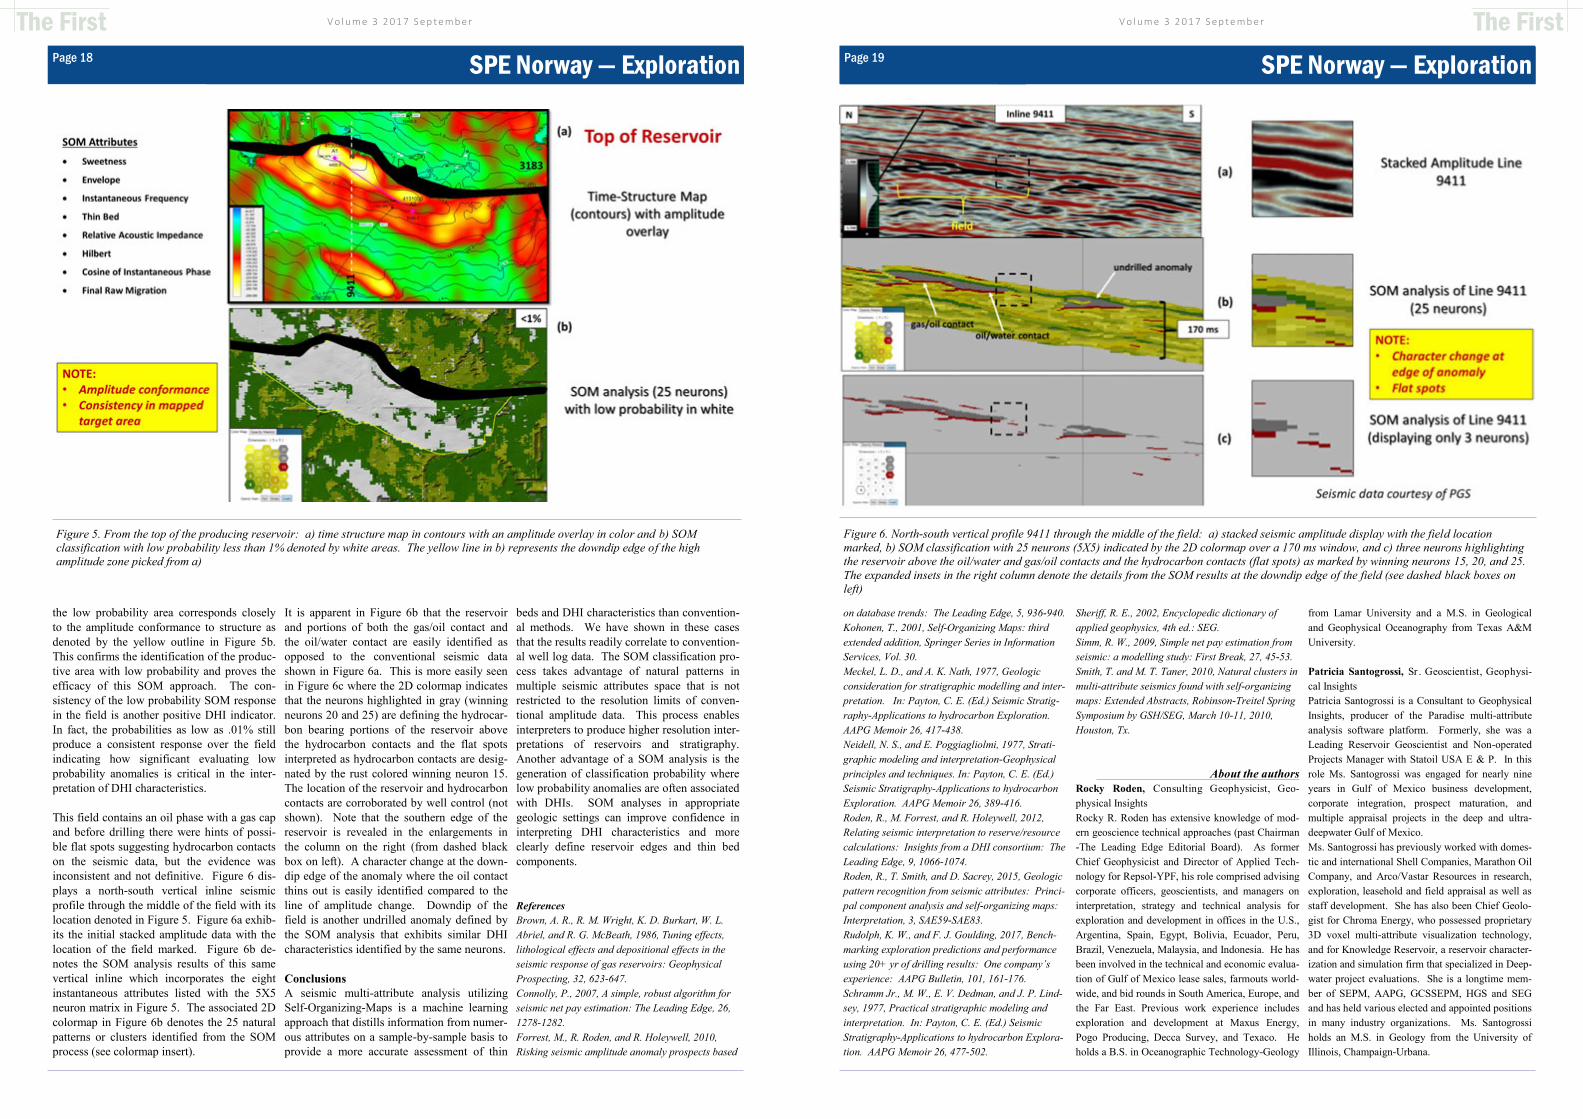
Adjacent to the SOM results at Well 6 are
similar results at a nearby well. Figure 4a
displays a zoomed-in vertical line display of
the SOM results through Well 8(V) with the
winning neurons identified. Figure 4b de-
notes the associated well log curves from well
8 and the correlative neuron associations.
Winning neurons 63 and 64 are associated
with the low resistivity Eagle Ford shale unit
and neurons 53, 54, and 60 denote the high
resistivity and more desirable Eagle Ford unit.
The expanded display of the SOM results in
Figure 4a denotes a low resistivity gold thin
bed that is identified by a single neuron (#55)
and is only one sample thick (2 ms). Shown
here is clear evidence of consistent results
between Wells 6 and 8 that lends itself to
stratigraphic facies interpretation.
Over this survey area, 16 different winning
neurons represent the various facies present in
the Eagle Ford Shale over a 14 ms window
(70-84 feet/21-26 meters). The facies of the
entire Eagle Ford Group which includes the
Basal Clay shale, Eagle Ford Shale, and Eagle
Ford Marl, are defined by 26 different win-
ning neurons over 28 ms (210-252 feet/64-77
meters). Individual facies units are as thin as
one sample interval of 2 ms (10-12 feet/3-4
meters). These results of a single SOM classi-
fication are corroborated at multiple wells
across the survey area.
Revealing Direct Hydrocarbon Indicators
(DHIs)
The accurate interpretation of seismic DHI
characteristics has proven to significantly
improve the drilling success rates in the ap-
propriate geologic setting where there is also
The First
Page 16 SPE Norway — Exploration
Figure 3. Resolution comparison between conventional seismic display and a Paradise® multi-attribute Self Organizing Map (SOM)
classification: (a) Seismic amplitude profile through the 6 Well; and (b) the SOM results of the same profile identifying the Eagle Ford Group
that comprises 26 sample based neuron clusters which are calibrated to facies and systems tracts. The 2D colormap displays the associated
winning neuron cluster colors
V o l u m e 3 2 0 1 7 S e p t e m b e r
adequate seismic data quality (Roden et al.,
2012; Rudolph and Goulding, 2017). Specifi-
cally, DHIs are anomalies due to the presence
of hydrocarbons induced by changes in rock
physics properties (P and S wave velocities,
and density). Typically, anomalies stand out
as the difference in a hydrocarbon-filled reser-
voir in relation to the encasing rock or the
brine portion of the reservoir. DHI character-
istics are usually associated with anomalous
seismic responses in a trapping configuration,
such as structural traps, stratigraphic traps, or
a combination of both. These include bright
spots, flat spots, amplitude conformance to
structure, etc. DHI anomalies are often com-
pared to models, similar events, background
trends, proven productive anomalies, and
geologic features. DHI indicators can also be
located below presumed trapped hydrocarbons
where shadow zones or velocity pull-down
effects may be present. These DHI effects can
even be present and dispersed in the sediment
column in the form of gas chimneys or clouds.
As described above there are numerous DHI
characteristics and all of which should be
evaluated in a consistent and systematic ap-
proach for any prospect or project. Forrest et
al. (2010) and Roden et al. (2012) have identi-
fied the top four DHI characteristics, as relat-
ed to commercially successful wells in a Class
3 AVO setting, based on an industry-wide
database of almost 300 wells. These DHI
characteristics include:
1. Anomaly conformance to structure
2. Phase or character change at the down-
dip edge of the anomaly
3. Anomaly consistency in the mapped
target area
4. Flat spots
These DHI characteristics will be identified in
the following case study by a multi-attribute
SOM analysis.
The case study is an offshore oil/gas field in
470 feet (145 meters) of water on the Louisi-
ana continental shelf of the Gulf of Mexico.
The field has two producing wells that were
drilled on the upthrown side of a normal fault
and into an amplitude anomaly. The normally-
pressured reservoir is approximately 100 feet
(30 meters) thick and contains oil and gas.
The hydrocarbon filled sandstone reservoir
has low impedance compared to the encasing
shales, indicative of a Class 3 AVO environ-
ment. The SOM analyzed a 170 ms window
surrounding the reservoir. Applying the
(SOM) multi-attribute analysis, a group of
eight seismic attributes were selected based on
Principal Component Analysis that would best
expose Direct Hydrocarbon Indicators (DHIs).
A neuron network of 5X5 (25 neurons) was
employed.
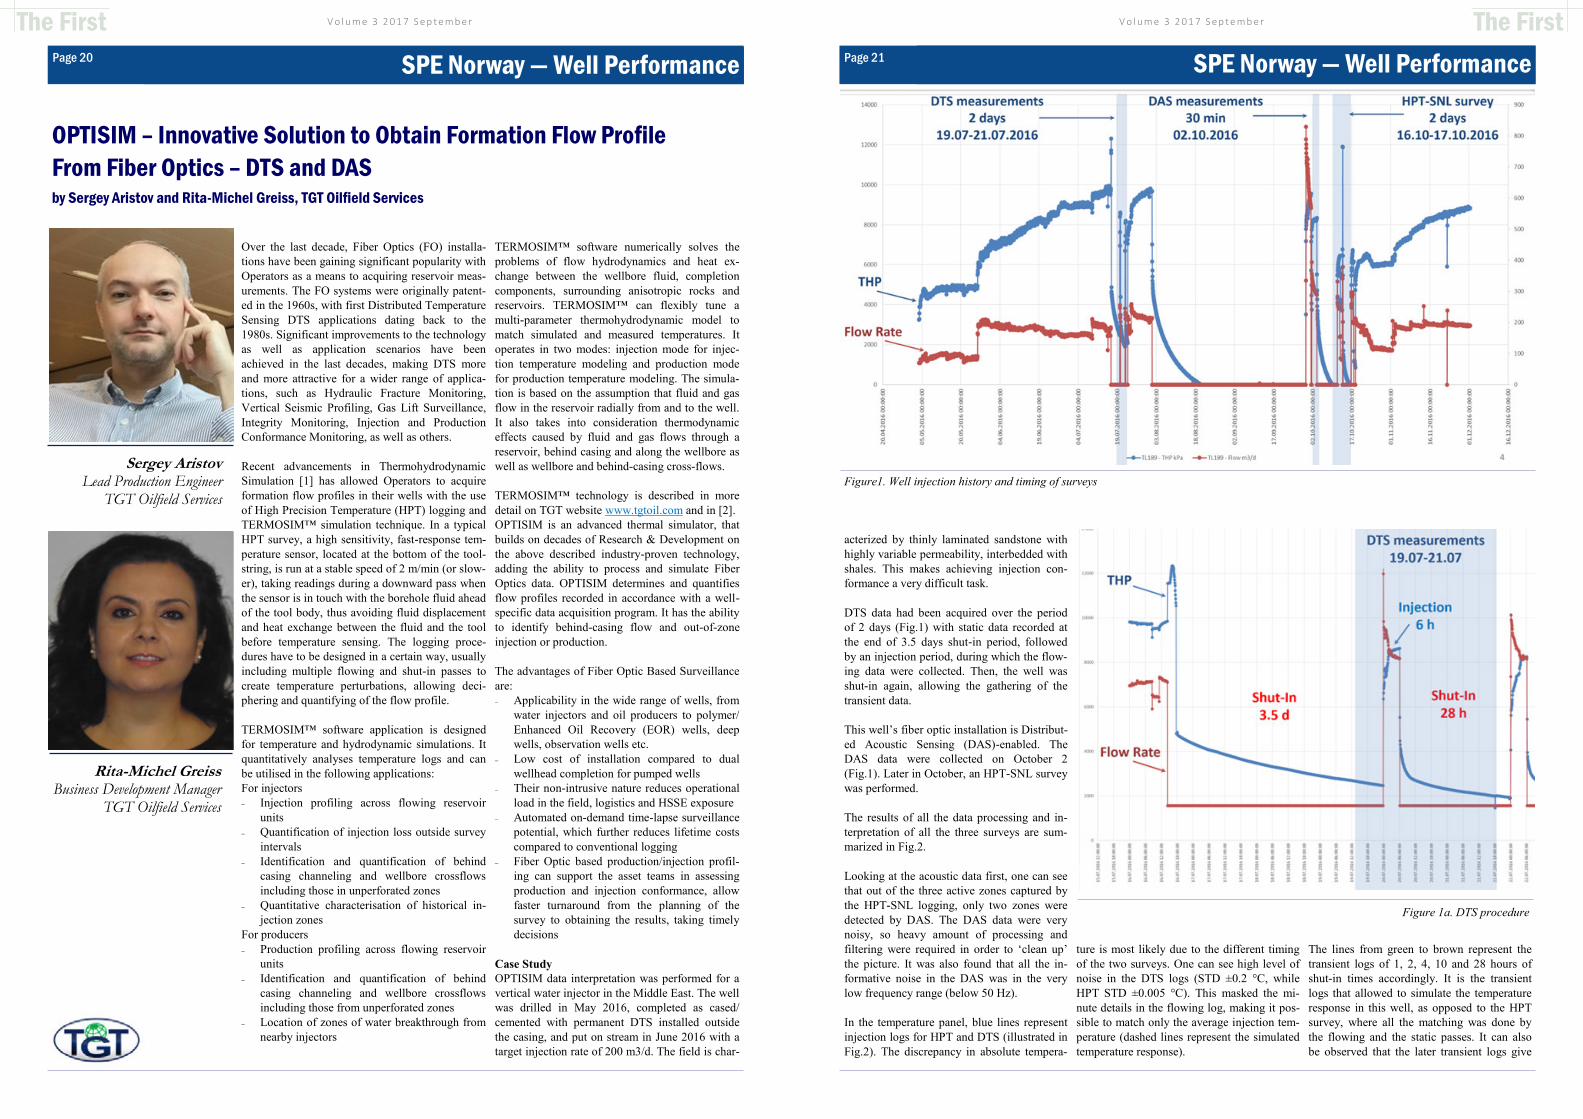
Figure 5a displays a time structure map as
denoted by the contours with an amplitude
overlay (color) from the mapped top of the
reservoir in this field. The horizon at the top
of the reservoir was picked on a trough (low
impedance) on zero phase seismic data (SEG
normal polarity). Figure 5a indicates there is
a relatively good amplitude conformance to
structure based on the amplitude as noted by
the general agreement of the time contour and
the red/green amplitude break (see colorbar
insert). Figure 5b is a display of classification
probability from the SOM analysis at the top
of the reservoir at the same scale as Figure 5a.
This indicates that the top of the reservoir
exhibits an anomalous response from the
SOM analysis. Ordinary classifications such
as those of green and yellow-greens are shown
around the reservoir (see colormap insert).
However, within the reservoir and in several
other areas, anomalous classification of low
probability below 1% are colored white. In
comparing Figure 5a and 5b it is apparent that
The First
Page 17 SPE Norway — Exploration
Figure 4. View of SOM results correlated with Well 8 logs: (a) Expanded view of SOM profile through Well 8; and (b) Well 8 logs with
Eagle Ford units correlated with the SOM results of (a). Note that the resolution is down to the sample level of 10-12 feet and is illustrated
by winning neuron 55 in (a). The dashed white line in (a) represents the top of the Eagle Ford and base of the Austin Chalk
V o l u m e 3 2 0 1 7 S e p t e m b e r
the low probability area corresponds closely
to the amplitude conformance to structure as
denoted by the yellow outline in Figure 5b.
This confirms the identification of the produc-
tive area with low probability and proves the
efficacy of this SOM approach. The con-
sistency of the low probability SOM response
in the field is another positive DHI indicator.
In fact, the probabilities as low as .01% still
produce a consistent response over the field
indicating how significant evaluating low
probability anomalies is critical in the inter-
pretation of DHI characteristics.
This field contains an oil phase with a gas cap
and before drilling there were hints of possi-
ble flat spots suggesting hydrocarbon contacts
on the seismic data, but the evidence was
inconsistent and not definitive. Figure 6 dis-
plays a north-south vertical inline seismic
profile through the middle of the field with its
location denoted in Figure 5. Figure 6a exhib-
its the initial stacked amplitude data with the
location of the field marked. Figure 6b de-
notes the SOM analysis results of this same
vertical inline which incorporates the eight
instantaneous attributes listed with the 5X5
neuron matrix in Figure 5. The associated 2D
colormap in Figure 6b denotes the 25 natural
patterns or clusters identified from the SOM
process (see colormap insert).
It is apparent in Figure 6b that the reservoir
and portions of both the gas/oil contact and
the oil/water contact are easily identified as
opposed to the conventional seismic data
shown in Figure 6a. This is more easily seen
in Figure 6c where the 2D colormap indicates
that the neurons highlighted in gray (winning
neurons 20 and 25) are defining the hydrocar-
bon bearing portions of the reservoir above
the hydrocarbon contacts and the flat spots
interpreted as hydrocarbon contacts are desig-
nated by the rust colored winning neuron 15.
The location of the reservoir and hydrocarbon
contacts are corroborated by well control (not
shown). Note that the southern edge of the
reservoir is revealed in the enlargements in
the column on the right (from dashed black
box on left). A character change at the down-
dip edge of the anomaly where the oil contact
thins out is easily identified compared to the
line of amplitude change. Downdip of the
field is another undrilled anomaly defined by
the SOM analysis that exhibits similar DHI
characteristics identified by the same neurons.
Conclusions
A seismic multi-attribute analysis utilizing
Self-Organizing-Maps is a machine learning
approach that distills information from numer-
ous attributes on a sample-by-sample basis to
provide a more accurate assessment of thin
beds and DHI characteristics than convention-
al methods. We have shown in these cases
that the results readily correlate to convention-
al well log data. The SOM classification pro-
cess takes advantage of natural patterns in
multiple seismic attributes space that is not
restricted to the resolution limits of conven-
tional amplitude data. This process enables
interpreters to produce higher resolution inter-
pretations of reservoirs and stratigraphy.
Another advantage of a SOM analysis is the
generation of classification probability where
low probability anomalies are often associated
with DHIs. SOM analyses in appropriate
geologic settings can improve confidence in
interpreting DHI characteristics and more
clearly define reservoir edges and thin bed
components.
References
Brown, A. R., R. M. Wright, K. D. Burkart, W. L.
Abriel, and R. G. McBeath, 1986, Tuning effects,
lithological effects and depositional effects in the
seismic response of gas reservoirs: Geophysical
Prospecting, 32, 623-647.
Connolly, P., 2007, A simple, robust algorithm for
seismic net pay estimation: The Leading Edge, 26,
1278-1282.
Forrest, M., R. Roden, and R. Holeywell, 2010,
Risking seismic amplitude anomaly prospects based
The First
Page 18 SPE Norway — Exploration
Figure 5. From the top of the producing reservoir: a) time structure map in contours with an amplitude overlay in color and b) SOM
classification with low probability less than 1% denoted by white areas. The yellow line in b) represents the downdip edge of the high
amplitude zone picked from a)
V o l u m e 3 2 0 1 7 S e p t e m b e r
on database trends: The Leading Edge, 5, 936-940.
Kohonen, T., 2001, Self-Organizing Maps: third
extended addition, Springer Series in Information
Services, Vol. 30.
Meckel, L. D., and A. K. Nath, 1977, Geologic
consideration for stratigraphic modelling and inter-
pretation. In: Payton, C. E. (Ed.) Seismic Stratig-
raphy-Applications to hydrocarbon Exploration.
AAPG Memoir 26, 417-438.
Neidell, N. S., and E. Poggiagliolmi, 1977, Strati-
graphic modeling and interpretation-Geophysical
principles and techniques. In: Payton, C. E. (Ed.)
Seismic Stratigraphy-Applications to hydrocarbon
Exploration. AAPG Memoir 26, 389-416.
Roden, R., M. Forrest, and R. Holeywell, 2012,
Relating seismic interpretation to reserve/resource
calculations: Insights from a DHI consortium: The
Leading Edge, 9, 1066-1074.
Roden, R., T. Smith, and D. Sacrey, 2015, Geologic
pattern recognition from seismic attributes: Princi-
pal component analysis and self-organizing maps:
Interpretation, 3, SAE59-SAE83.
Rudolph, K. W., and F. J. Goulding, 2017, Bench-
marking exploration predictions and performance
using 20+ yr of drilling results: One company’s
experience: AAPG Bulletin, 101, 161-176.
Schramm Jr., M. W., E. V. Dedman, and J. P. Lind-
sey, 1977, Practical stratigraphic modeling and
interpretation. In: Payton, C. E. (Ed.) Seismic
Stratigraphy-Applications to hydrocarbon Explora-
tion. AAPG Memoir 26, 477-502.
Sheriff, R. E., 2002, Encyclopedic dictionary of
applied geophysics, 4th ed.: SEG.
Simm, R. W., 2009, Simple net pay estimation from
seismic: a modelling study: First Break, 27, 45-53.
Smith, T. and M. T. Taner, 2010, Natural clusters in
multi-attribute seismics found with self-organizing
maps: Extended Abstracts, Robinson-Treitel Spring
Symposium by GSH/SEG, March 10-11, 2010,
Houston, Tx.
About the authors
Rocky Roden, Consulting Geophysicist, Geo-
physical Insights
Rocky R. Roden has extensive knowledge of mod-
ern geoscience technical approaches (past Chairman
-The Leading Edge Editorial Board). As former
Chief Geophysicist and Director of Applied Tech-
nology for Repsol-YPF, his role comprised advising
corporate officers, geoscientists, and managers on
interpretation, strategy and technical analysis for
exploration and development in offices in the U.S.,
Argentina, Spain, Egypt, Bolivia, Ecuador, Peru,
Brazil, Venezuela, Malaysia, and Indonesia. He has
been involved in the technical and economic evalua-
tion of Gulf of Mexico lease sales, farmouts world-
wide, and bid rounds in South America, Europe, and
the Far East. Previous work experience includes
exploration and development at Maxus Energy,
Pogo Producing, Decca Survey, and Texaco. He
holds a B.S. in Oceanographic Technology-Geology
from Lamar University and a M.S. in Geological
and Geophysical Oceanography from Texas A&M
University.
Patricia Santogrossi, Sr . Geoscientist, Geophysi-
cal Insights
Patricia Santogrossi is a Consultant to Geophysical
Insights, producer of the Paradise multi-attribute
analysis software platform. Formerly, she was a
Leading Reservoir Geoscientist and Non-operated
Projects Manager with Statoil USA E & P. In this
role Ms. Santogrossi was engaged for nearly nine
years in Gulf of Mexico business development,
corporate integration, prospect maturation, and
multiple appraisal projects in the deep and ultra-
deepwater Gulf of Mexico.
Ms. Santogrossi has previously worked with domes-
tic and international Shell Companies, Marathon Oil
Company, and Arco/Vastar Resources in research,
exploration, leasehold and field appraisal as well as
staff development. She has also been Chief Geolo-
gist for Chroma Energy, who possessed proprietary
3D voxel multi-attribute visualization technology,
and for Knowledge Reservoir, a reservoir character-
ization and simulation firm that specialized in Deep-
water project evaluations. She is a longtime mem-
ber of SEPM, AAPG, GCSSEPM, HGS and SEG
and has held various elected and appointed positions
in many industry organizations. Ms. Santogrossi
holds an M.S. in Geology from the University of
Illinois, Champaign-Urbana.
The First
Page 19 SPE Norway — Exploration
Figure 6. North-south vertical profile 9411 through the middle of the field: a) stacked seismic amplitude display with the field location
marked, b) SOM classification with 25 neurons (5X5) indicated by the 2D colormap over a 170 ms window, and c) three neurons highlighting
the reservoir above the oil/water and gas/oil contacts and the hydrocarbon contacts (flat spots) as marked by winning neurons 15, 20, and 25.
The expanded insets in the right column denote the details from the SOM results at the downdip edge of the field (see dashed black boxes on
left)
V o l u m e 3 2 0 1 7 S e p t e m b e r
Over the last decade, Fiber Optics (FO) installa-
tions have been gaining significant popularity with
Operators as a means to acquiring reservoir meas-
urements. The FO systems were originally patent-
ed in the 1960s, with first Distributed Temperature
Sensing DTS applications dating back to the
1980s. Significant improvements to the technology
as well as application scenarios have been
achieved in the last decades, making DTS more
and more attractive for a wider range of applica-
tions, such as Hydraulic Fracture Monitoring,
Vertical Seismic Profiling, Gas Lift Surveillance,
Integrity Monitoring, Injection and Production
Conformance Monitoring, as well as others.
Recent advancements in Thermohydrodynamic
Simulation [1] has allowed Operators to acquire
formation flow profiles in their wells with the use
of High Precision Temperature (HPT) logging and
TERMOSIM™ simulation technique. In a typical
HPT survey, a high sensitivity, fast-response tem-
perature sensor, located at the bottom of the tool-
string, is run at a stable speed of 2 m/min (or slow-
er), taking readings during a downward pass when
the sensor is in touch with the borehole fluid ahead
of the tool body, thus avoiding fluid displacement
and heat exchange between the fluid and the tool
before temperature sensing. The logging proce-
dures have to be designed in a certain way, usually
including multiple flowing and shut-in passes to
create temperature perturbations, allowing deci-
phering and quantifying of the flow profile.
TERMOSIM™ software application is designed
for temperature and hydrodynamic simulations. It
quantitatively analyses temperature logs and can
be utilised in the following applications:
For injectors
Injection profiling across flowing reservoir
units
Quantification of injection loss outside survey
intervals
Identification and quantification of behind
casing channeling and wellbore crossflows
including those in unperforated zones
Quantitative characterisation of historical in-
jection zones
For producers
Production profiling across flowing reservoir
units
Identification and quantification of behind
casing channeling and wellbore crossflows
including those from unperforated zones
Location of zones of water breakthrough from
nearby injectors
TERMOSIM™ software numerically solves the
problems of flow hydrodynamics and heat ex-
change between the wellbore fluid, completion
components, surrounding anisotropic rocks and
reservoirs. TERMOSIM™ can flexibly tune a
multi-parameter thermohydrodynamic model to
match simulated and measured temperatures. It
operates in two modes: injection mode for injec-
tion temperature modeling and production mode
for production temperature modeling. The simula-
tion is based on the assumption that fluid and gas
flow in the reservoir radially from and to the well.
It also takes into consideration thermodynamic
effects caused by fluid and gas flows through a
reservoir, behind casing and along the wellbore as
well as wellbore and behind-casing cross-flows.
TERMOSIM™ technology is described in more
detail on TGT website www.tgtoil.com and in [2].
OPTISIM is an advanced thermal simulator, that
builds on decades of Research & Development on
the above described industry-proven technology,
adding the ability to process and simulate Fiber
Optics data. OPTISIM determines and quantifies
flow profiles recorded in accordance with a well-
specific data acquisition program. It has the ability
to identify behind-casing flow and out-of-zone
injection or production.
The advantages of Fiber Optic Based Surveillance
are:
Applicability in the wide range of wells, from
water injectors and oil producers to polymer/
Enhanced Oil Recovery (EOR) wells, deep
wells, observation wells etc.
Low cost of installation compared to dual
wellhead completion for pumped wells
Their non-intrusive nature reduces operational
load in the field, logistics and HSSE exposure
Automated on-demand time-lapse surveillance
potential, which further reduces lifetime costs
compared to conventional logging
Fiber Optic based production/injection profil-
ing can support the asset teams in assessing
production and injection conformance, allow
faster turnaround from the planning of the
survey to obtaining the results, taking timely
decisions
Case Study
OPTISIM data interpretation was performed for a
vertical water injector in the Middle East. The well
was drilled in May 2016, completed as cased/
cemented with permanent DTS installed outside
the casing, and put on stream in June 2016 with a
target injection rate of 200 m3/d. The field is char-
The First
Page 20 SPE Norway — Well Performance
OPTISIM – Innovative Solution to Obtain Formation Flow Profile
From Fiber Optics – DTS and DAS by Sergey Aristov and Rita-Michel Greiss, TGT Oilfield Services
Sergey Aristov Lead Production Engineer
TGT Oilfield Services
Rita-Michel Greiss Business Development Manager
TGT Oilfield Services
V o l u m e 3 2 0 1 7 S e p t e m b e r
acterized by thinly laminated sandstone with
highly variable permeability, interbedded with
shales. This makes achieving injection con-
formance a very difficult task.
DTS data had been acquired over the period
of 2 days (Fig.1) with static data recorded at
the end of 3.5 days shut-in period, followed
by an injection period, during which the flow-
ing data were collected. Then, the well was
shut-in again, allowing the gathering of the
transient data.
This well’s fiber optic installation is Distribut-
ed Acoustic Sensing (DAS)-enabled. The
DAS data were collected on October 2
(Fig.1). Later in October, an HPT-SNL survey
was performed.
The results of all the data processing and in-
terpretation of all the three surveys are sum-
marized in Fig.2.
Looking at the acoustic data first, one can see
that out of the three active zones captured by
the HPT-SNL logging, only two zones were
detected by DAS. The DAS data were very
noisy, so heavy amount of processing and
filtering were required in order to ‘clean up’
the picture. It was also found that all the in-
formative noise in the DAS was in the very
low frequency range (below 50 Hz).
In the temperature panel, blue lines represent
injection logs for HPT and DTS (illustrated in
Fig.2). The discrepancy in absolute tempera-
ture is most likely due to the different timing
of the two surveys. One can see high level of
noise in the DTS logs (STD ±0.2 °C, while
HPT STD ±0.005 °C). This masked the mi-
nute details in the flowing log, making it pos-
sible to match only the average injection tem-
perature (dashed lines represent the simulated
temperature response).
The lines from green to brown represent the
transient logs of 1, 2, 4, 10 and 28 hours of
shut-in times accordingly. It is the transient
logs that allowed to simulate the temperature
response in this well, as opposed to the HPT
survey, where all the matching was done by
the flowing and the static passes. It can also
be observed that the later transient logs give
The First
Page 21 SPE Norway — Well Performance
Figure 1a. DTS procedure
Figure1. Well injection history and timing of surveys

V o l u m e 3 2 0 1 7 S e p t e m b e r
better matching than the early ones (dashed
lines). The two rightmost curves are the static
passes from DTS and HPT (marked on Fig.2).
Both methods give adequate identification and
quantification of the formation flow profile
(see respective panels). Note that in static
conditions, both surveys identified crossflow
between the zones. Difference in the cross-
flow distribution is caused by the changed
well and reservoir conditions. DTS, taken
soon after the well had been put on stream,
shows two upper zones producing and only
the lower zone accepting water. Whereas in
October, we can see only the upper zone pro-
ducing and the two lower zones accepting.
During injection, all three zones have been
identified as active in both surveys. Variance
in the profile distribution in again caused by
the changed well and reservoir conditions
between the two time periods.
Summary
On DAS:
Informative noises across Zone 1 and
Zone 3 were detected. Noise across Zone
2 was not detected
Overall, good correlation with SNL
Informative noise is lower than 50 Hz
Data are very noisy, additional processing
required
On DTS:
DTS data are noisy (STD (DTS) ±0.2 °C,
while STD (HPT) ± 0.005 °C)
Injection profile was identified by OP-
TISIM. Most useful information was de-
rived from transient logs
Good correlation between DTS and HPT
results were found
Discrepancy between HPT and DTS injec-
tion profiles is explained by different
survey dates, well and reservoir condi-
tions
References
[1] A. R. Al Marzouqi, A. Keshka, J. N. Bahamaish,
Tareq Al Junaibi (ADCO); A. Aslanyan, I. Aslan-
yan, M. Filenev, J.Barghouti, V. Sudakov, A. An-
dreev, (TGT Oil & Gas Services). Integrating Res-
ervoir Modelling, High-Precision Temperature
Logging and Spectral Noise Logging for Waterflood
Analysis. Abu Dhabi – SPE,
2012.
[2] Aslanyan A., Al Shammakhy A., Aristov S. Eval-
uating Injection Performance With High-precision
Temperature Logging And Numerical Temperature
Modelling. SPE Reservoir Characterization and
Simulation Conference and Exhibition, Abu Dhabi,
UAE, 2013.
[3] A.A. Lutfullin, A.R. Abdrahimov, I.N. Shigapov,
I.Yu. Aslanyan, A.M. Aslanyan, R.K. Kuzyutin et al.
2014. Identification of Behind-Casing Flowing
Reservoir Intervals by the Integrated High-
Precision Temperature and Spectral Noise Logging
Techniques. SPE-171251-MS presented at the SPE
Russian Oil and Gas Exploration and Production
Technical Conference and Exhibition
[4] Arthur Aslanyan, Irina Aslanyan, Andrey Sala-
matin, Andrey Karuzin, Yulia Fesina et al. 2014.
Numerical Temperature Modelling for Quantitative
Analysis of Low-Compressible Fluid Production.
SPE 172090 presented at the Abu-Dhabi Interna-
tional Petroleum Exhibition and Conference held in
Abu-Dhabi, UAE, 10–13 Novem-
ber.
[5] Ghalem S., Serry A., Al-felasi A., Berrim A.,
Keshtta M., Filenev M., Draoui A., Mohamed A.,
Chaker A., Gabdrakhmanova A., Aslanyan A. Inno-
vative Noise and High-Precision Temperature
Logging Tool for Diagnosing Complex Well Prob-
lems. Abu Dhabi International Petroleum Confer-
ence and Exhibition, Abu Dhabi, UAE,
2012).
The First
Page 22 SPE Norway — Well Performance
Figure 2. Results of DTS-DAS and HPT-SNL surveys
V o l u m e 3 2 0 1 7 S e p t e m b e r

V o l u m e 3 2 0 1 7 S e p t e m b e r
Poor well performance and downhole failures have
a significant impact on the profitability of a well.
To combat this, operators spend billions of USD
each year on time-consuming and costly well in-
terventions to improve production and repair hard-
ware. These interventions cover a broad range of
activities from straightforward maintenance to
complicated workovers, but in all cases, operators
strive for efficient and low-risk operations. A ma-
jor factor contributing to inefficiency in interven-
tions is the lack of reliable information about the
current condition of the downhole equipment.
When initially planning an intervention, operators
frequently infer downhole conditions either from
surface measurements or from downhole measure-
ments that are ancillary to the issue they are inves-
tigating [1]. Such limited information often fails to
accurately diagnose the issue or misses an under-
lying problem, which in turn leads to ineffectual
intervention activities that do not achieve the ob-
jectives. The operator must then investigate further
using the same insufficient tools and try another
intervention. This trial-and-error cycle repeats
with costs and non-productive time mounting until
eventually the issue is resolved or the operator
abandons the original intervention objectives. To
break this inefficient cycle, a number of downhole
imaging techniques have been developed.
The purpose of downhole imaging is to improve
the initial investigation step of the intervention
cycle, as well as any subsequent investigations, by
providing a clear visual representation of what is
happening in the well. Typical techniques include
the lead impression block and optical camera, with
ultrasonic imaging having been recently intro-
duced. The first technique uses a block of lead
lowered inside the well to take an impression of
the object [2]. While fast and inexpensive, the
impression can often be difficult to interpret. As a
second option, optical cameras can provide images
in well fluids transparent to visible light or in gas
filled wells, but even small traces of oil or particu-
lates will distort the images [3]. As a result, wells
must be cleaned and well fluids replaced with
clear fluid or gas before attempting optical imag-
ing. A more recent technology involves using
ultrasonic imaging to produce an image of an ob-
ject inside a fluid-filled well [4]. Ultrasonic imag-
ing works even when the well is filled with opaque
fluids, but fails when the fluid is too heterogene-
ous, for example when the fluid contains suspend-
ed particles or bubbles, or when the speed of
sound is inaccurately estimated.
As an alternative, Visuray has recently introduced
the VR90 downhole X-ray diagnostic service [5].
While X-ray imaging has been applied advanta-
geously in the health and security industries for
decades, Visuray is the first company to have suc-
cessfully adapted this powerful technique to the
challenging downhole environment. The primary
advantage of using X-rays for imaging in an oil
well is that the radiation can penetrate materials
that are opaque and highly heterogeneous. Such
materials include oil, brine, oil/water mixtures,
and fluids with a large amount of suspended par-
ticulates, as well as some solid materials such as
cement and sediments [6]. The ability of X-rays to
“see” in almost any fluid means that the VR90 tool
reliably produces accurate diagnoses without ex-
tensive well preparation, saving time and money
during interventions.
The VR90 tool’s imaging capabilities rest on a
patent-pending technique for reconstructing the
surface topography of objects in a well based on
the X-rays backscattered from the well fluids [6].
The amount of X-ray radiation recorded by the
VR90 tool’s detectors depends upon the amount of
X-ray-illuminated well fluid between the VR90
tool and the target object in the well. This radia-
tion recorded by each pixel of the detectors is
converted into a distance to the surface of the ob-
ject viewed by that pixel using a semi-empirical
formula based on the physics of X-ray scattering.
In this way, we reconstruct the surface of the tar-
get object in three dimensions.
An example of one such reconstruction is shown
in Figure 1 where it is displayed both as a two-
dimensional depth map image and a three-
dimensional rendering. In the depth map represen-
tation, white and light grey pixels represent areas
that are closer to the VR90 tool, while black and
dark grey pixels represent areas that are farther
from the tool (i.e. the depth of the surface of the
object is mapped to a grey scale color scheme).
The imaging data were obtained during laboratory
tests in water made completely opaque by particles
of rust suspended in it. The results reveal an easily
-recognizable adjustable spanner. Fine details on
the spanner are visible, such as a small hole in the
neck and the threads on the adjustment screw,
demonstrating the millimeter-scale resolution of
the VR90 tool’s reconstructions. Furthermore,
these reconstructions are dimensionally-accurate,
so the resulting images and renderings can be used
to measure features on the target object with milli-
meter-scale accuracy. While these results were
obtained in the lab, the VR90 service reliably pro-
duces the same caliber results in the field – all in
real-time without any well preparation necessary.
To demonstrate these capabilities, consider a re-
cent case from offshore Norway [7]. The operator
was considering converting the North Sea injector
well back into a producer, but the decision on how
The First
Page 24 SPE Norway — Well Performance
Improving Intervention Efficiency with Downhole X-ray Diagnostics by Melissa Spannuth, PhD, Senior Physicist, Visuray
Melissa Spannuth PhD, Senior Physicist
Visuray
V o l u m e 3 2 0 1 7 S e p t e m b e r
to proceed was held up by uncertainty about
the downhole safety valve (DHSV). The
DHSV had failed during testing and attempts
to install an insert DHSV had been unsuccess-
ful. The operator had also attempted to lock
the valve open, so they suspected that the
flapper on the DHSV was stuck in a partially
open position. They wanted to determine
whether it would be possible to repair or re-
place the safety valve as part of the conver-
sion to a producer without having to recom-
plete the well. Our objectives for the VR90
service’s X-ray diagnosis were thus to investi-
gate the valve and define the clearance
through the valve.
We achieved these objectives by acquiring
multiple X-ray images with the VR90 tool
positioned at various locations within the
DHSV. Three of the X-ray images acquired
by the VR90 tool are shown in Figure 2. Side
view drawings of the corresponding tool and
flapper positions, and renderings of what the
tool sees are also shown. From top to bottom,
the X-ray images show the flapper nearly
closed, half-way closed, and almost fully
open. As indicated by the drawings, the VR90
tool was resting on the flapper and pushed it
open as the tool was moved through the valve.
The X-ray images show that the maximum
measured opening angle of the flapper was
73°.
In particular, the VR90 diagnostic service
provided two key pieces of information: the
flapper was not locked open and the flapper
could open wide enough to install the insert
safety valve. By performing this diagnostic
imaging before beginning the intervention on
the DHSV, the operator was able to eliminate
other time-consuming and risky options, such
as recompleting the well or attempting to mill
the flapper. Instead, they were able to success-
The First
Page 25 SPE Norway — Well Performance
Figure 2. Results of VR90 service’s X-ray investigation of DHSV in a North Sea well
Figure 1. Examples of 2d depth map (left) and 3d rendering (right) from laboratory imaging of an adjustable spanner
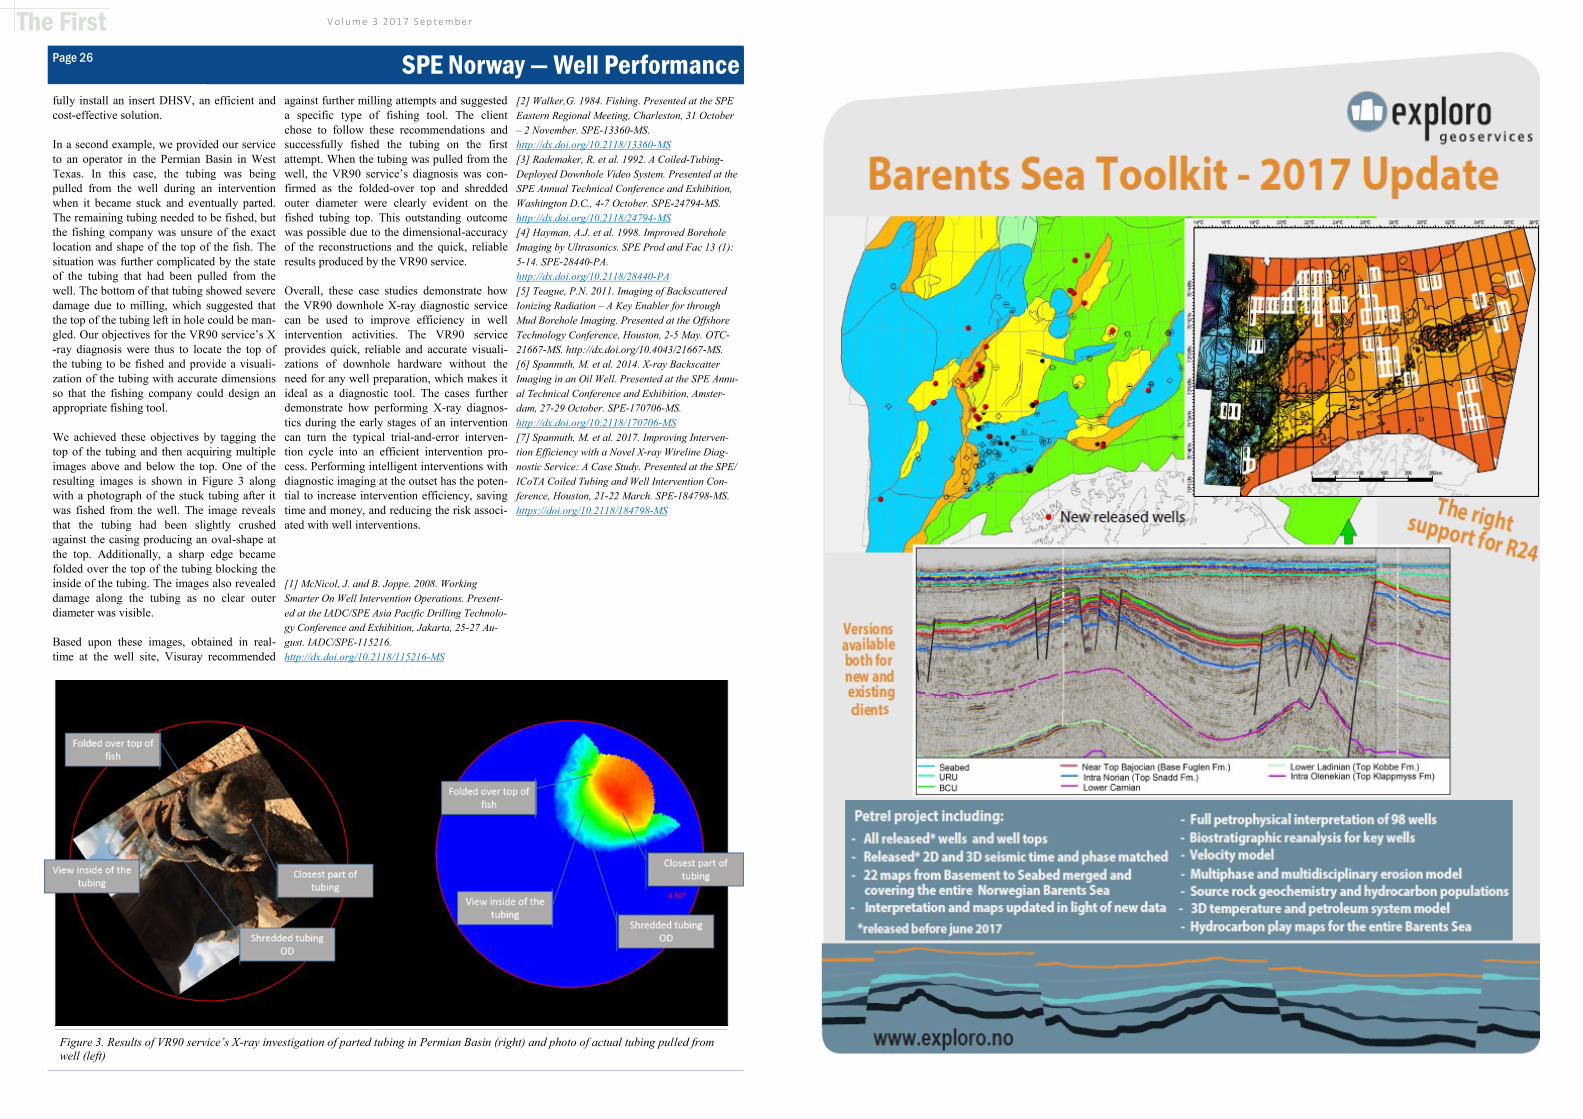
V o l u m e 3 2 0 1 7 S e p t e m b e r
fully install an insert DHSV, an efficient and
cost-effective solution.
In a second example, we provided our service
to an operator in the Permian Basin in West
Texas. In this case, the tubing was being
pulled from the well during an intervention
when it became stuck and eventually parted.
The remaining tubing needed to be fished, but
the fishing company was unsure of the exact
location and shape of the top of the fish. The
situation was further complicated by the state
of the tubing that had been pulled from the
well. The bottom of that tubing showed severe
damage due to milling, which suggested that
the top of the tubing left in hole could be man-
gled. Our objectives for the VR90 service’s X
-ray diagnosis were thus to locate the top of
the tubing to be fished and provide a visuali-
zation of the tubing with accurate dimensions
so that the fishing company could design an
appropriate fishing tool.
We achieved these objectives by tagging the
top of the tubing and then acquiring multiple
images above and below the top. One of the
resulting images is shown in Figure 3 along
with a photograph of the stuck tubing after it
was fished from the well. The image reveals
that the tubing had been slightly crushed
against the casing producing an oval-shape at
the top. Additionally, a sharp edge became
folded over the top of the tubing blocking the
inside of the tubing. The images also revealed
damage along the tubing as no clear outer
diameter was visible.
Based upon these images, obtained in real-
time at the well site, Visuray recommended
against further milling attempts and suggested
a specific type of fishing tool. The client
chose to follow these recommendations and
successfully fished the tubing on the first
attempt. When the tubing was pulled from the
well, the VR90 service’s diagnosis was con-
firmed as the folded-over top and shredded
outer diameter were clearly evident on the
fished tubing top. This outstanding outcome
was possible due to the dimensional-accuracy
of the reconstructions and the quick, reliable
results produced by the VR90 service.
Overall, these case studies demonstrate how
the VR90 downhole X-ray diagnostic service
can be used to improve efficiency in well
intervention activities. The VR90 service
provides quick, reliable and accurate visuali-
zations of downhole hardware without the
need for any well preparation, which makes it
ideal as a diagnostic tool. The cases further
demonstrate how performing X-ray diagnos-
tics during the early stages of an intervention
can turn the typical trial-and-error interven-
tion cycle into an efficient intervention pro-
cess. Performing intelligent interventions with
diagnostic imaging at the outset has the poten-
tial to increase intervention efficiency, saving
time and money, and reducing the risk associ-
ated with well interventions.
[1] McNicol, J. and B. Joppe. 2008. Working
Smarter On Well Intervention Operations. Present-
ed at the IADC/SPE Asia Pacific Drilling Technolo-
gy Conference and Exhibition, Jakarta, 25-27 Au-
gust. IADC/SPE-115216.
http://dx.doi.org/10.2118/115216-MS
[2] Walker,G. 1984. Fishing. Presented at the SPE
Eastern Regional Meeting, Charleston, 31 October
– 2 November. SPE-13360-MS.
http://dx.doi.org/10.2118/13360-MS
[3] Rademaker, R. et al. 1992. A Coiled-Tubing-
Deployed Downhole Video System. Presented at the
SPE Annual Technical Conference and Exhibition,
Washington D.C., 4-7 October. SPE-24794-MS.
http://dx.doi.org/10.2118/24794-MS
[4] Hayman, A.J. et al. 1998. Improved Borehole
Imaging by Ultrasonics. SPE Prod and Fac 13 (1):
5-14. SPE-28440-PA.
http://dx.doi.org/10.2118/28440-PA
[5] Teague, P.N. 2011. Imaging of Backscattered
Ionizing Radiation – A Key Enabler for through
Mud Borehole Imaging. Presented at the Offshore
Technology Conference, Houston, 2-5 May. OTC-
21667-MS. http://dx.doi.org/10.4043/21667-MS.
[6] Spannuth, M. et al. 2014. X-ray Backscatter
Imaging in an Oil Well. Presented at the SPE Annu-
al Technical Conference and Exhibition, Amster-
dam, 27-29 October. SPE-170706-MS.
http://dx.doi.org/10.2118/170706-MS
[7] Spannuth, M. et al. 2017. Improving Interven-
tion Efficiency with a Novel X-ray Wireline Diag-
nostic Service: A Case Study. Presented at the SPE/
ICoTA Coiled Tubing and Well Intervention Con-
ference, Houston, 21-22 March. SPE-184798-MS.
https://doi.org/10.2118/184798-MS
The First
Page 26 SPE Norway — Well Performance
Figure 3. Results of VR90 service’s X-ray investigation of parted tubing in Permian Basin (right) and photo of actual tubing pulled from
well (left)
V o l u m e 3 2 0 1 7 S e p t e m b e r

V o l u m e 3 2 0 1 7 S e p t e m b e r
Thank you to SPE Norway sponsors!
Dear
SPE Norway sponsors!
You can publish your
content for free in our
magazine.
For non-member
sponsoring opportunities
please contact