volume 4, no.1 2016 - ijssyabatech.comijssyabatech.com/wp-content/uploads/2016/12/vol.4.pdf · ......
TRANSCRIPT

INTERNATIONAL, JOURNAL OF SCIENCE & SOCIETY YABATECH VOL 4, No 1, SEPTEMBER, 2016
i | P a g e
Volume 4, No.1 2016

INTERNATIONAL, JOURNAL OF SCIENCE & SOCIETY YABATECH VOL 4, No 1, SEPTEMBER, 2016
i | P a g e
INTERNATIONAL, JOURNAL OF SCIENCE AND SOCIETY
YABATECH
VOLUME 4, NUMBER 1
SEPTEMBER, 2016

INTERNATIONAL, JOURNAL OF SCIENCE & SOCIETY YABATECH VOL 4, No 1, SEPTEMBER, 2016
ii | P a g e
© Copyright: School of Science, Yaba College of Technology 2016
All rights reserved. No part of this publication may be reproduced, stored in a retrieval system or
transmitted in any form or by any means, electronics, mechanical, photocopying or otherwise, without
the prior permission of the publishers.
A publication of school of science, Yaba College of Technology, Yaba, Nigeria.

INTERNATIONAL, JOURNAL OF SCIENCE & SOCIETY YABATECH VOL 4, No 1, SEPTEMBER, 2016
iii | P a g e
MANAGING EDITOR: Dr (Mrs) A. O. DAWODU
EDITOR – IN- CHIEF: Dr (Mrs) L. N. OFODILE
EDITOR: Dr. S. A. OJOKUKU
EDITORIAL TEAM
(1) Prof. E. O. Somoye Department of Physics Lagos State University Lagos
(2) Dr. A. Ogunkanmi Department of Cell Biology and Genetics University of Lagos
(3) Dr. A. A .Adeleke Department of Actuary Science and Insurance University of Lagos
(4) Dr. M. Adamu Department of Mathematics University of Lagos
(5) Dr. R.I. Lawal Department of Biochemistry University of Lagos
(6) Dr. (Mrs.) J. O. Owoso Department of Chemical Science Yaba College of Technology
(7) Dr. A.A. Abiodun Department of Chemical Science Yaba College of Technology
(8) Dr. (Mrs.) N. Azike Department of Chemical Science Yaba College of Technology
(9) Dr. (Mrs.) E.O. Popoola Department of Chemical Science Yaba College of Technology
(10) Dr. J.B. Abe Department of Statistics Yaba College of Technology
(11) Dr. A. Adesina Department of Physical Science Yaba College of Technology
(12) Dr. S.O. Adewoye Department of Mathematics Yaba College of Technology
(13) Dr. O.A. Folorunsho Department of Computer Technology College of Technology
(14) Dr. N.M. Nzekwe Department of Physical Science Yaba College of Technology
(15) Mr. O.N. Lawal Department of Computer Technology College of Technology
(16) Mrs. A. Sobande Department of Biological Science Yaba College of Technology
(17) Mr. L.O. Imafidon Department of Physical Science Yaba College of Technology
(18) Mr. O. O. Olufolabo Department of Statistics Yaba College of Technology

INTERNATIONAL, JOURNAL OF SCIENCE & SOCIETY YABATECH VOL 4, No 1, SEPTEMBER, 2016
iv | P a g e
Titles Authors pages
A COMPARATIVE STUDY OF
COMPANIES‟ HEALTH: ALTMAN‟S Z-
SCORE APPROACH TO BANKRUPTCY
PREDICTIONS USING R
Emmanuel Mmaduabuchi Ikegwu;
Ademola Azeez Arowolo;
Stephen Oluwole Adebesin; Oluwasegun
Quadri Durowoju
1 - 7
CRITICAL ANALYSIS ON THE POST
ECONOMIC MELTDOWN FINANCIAL
PERFORMANCE OF GUARANTY
TRUST AND ACCESS BANKS IN
NIGERIA
Emmanuel Mmaduabuchi Ikegwu1*
;
Sunday Okeke Obidiegwu1;
Olusesan Oluyomi Olufolabo1;
Funke Obafemi Omowunmi2;
8 - 15
EVALUATION OF HEAVY METALS IN
SOME COSMETIC PRODUCTS
IN LAGOS NIGERIA.
Nzekwe Nwachukwu Martins, Imafidon
Lawrence Osamu &
Afeni John Kolawole.
16 - 24
FACTORS AFFECTING THE
GENERATION, MANAGEMENT AND
DISPOSAL OF URBAN HOUSEHOLD
SOLID WASTE IN LAGOS STATE,
NIGERIA.
HUNGBO Anthony Akinola,
IDOWU, Falilat Olubunmi &
VICTOR OPARA
25 - 31
RELIABILITY STUDY OF SELECTED
ELECTRONIC COMPONENTS- A CASE
STUDY OF RESISTORS
1,2Oluyo, K.S.,
3Nwosu, E.U.,
1 Sode, A.T. and 2,4
Fasesin, S.B.
32 – 38
TOURISM DEVELOPMENT: A
REVOLUTIONALISED SECTOR AS
A PANACEA FOR DWINDLING
HOSPITALITY BUSINESS IN NIGERIA
1Ibeh, Phebian Ekwutosi;
Emmanuel Mmaduabuchi Ikegwu2*
; 1Amaechi, Chijioke Juliet.
39 – 48
PHYTOCHEMICAL AND GCMS
ANALYSES OF MEDICINAL
PROPERTIES OF ETHANOL EXTRACT
OF Gossypium barbadense LEAVES
Jokotagba O,A1,
Onasanya S,S2,
Siyanbola T,O3.
49 - 52

INTERNATIONAL, JOURNAL OF SCIENCE & SOCIETY YABATECH VOL 4, No 1, SEPTEMBER, 2016
1 | P a g e
A COMPARATIVE STUDY OF COMPANIES’ HEALTH: ALTMAN’S Z-SCORE APPROACH
TO BANKRUPTCY PREDICTIONS USING R
Emmanuel Mmaduabuchi Ikegwu; Ademola Azeez Arowolo; Stephen Oluwole Adebesin; Oluwasegun
Quadri Durowoju;
Department of Statistics, Yaba College of Technology, Yaba Lagos.
Email: [email protected]
ABSTRACT
Financial analysis provides the basis for
understanding and evaluating the results of
business operations and explaining how well a
business is doing as well as help creditors,
investors, and managers determine if a company
can pay the interests and principal on its debt, earn
an acceptable return on invested capital, growing
or shrinking, control costs, and grow its market
share. This study used the Altman‟s z-score
analysis to predict a firm‟s insolvency. Altman
uses the standardised financial performance of
firms in determining their financial health. Four
companies: Guinness and Seven Up in the FMCG
sector and Mobil and Eterna Oil in the Oil and Gas
sector were studied and compared. The data used
were sieved from the financial statements of these
companies for 2012 and 2013 financial years. The
study results for the period revealed the
weaknesses of Seven Up Plc which z-score was
less than 3.0 which showed it had 50:50 chance of
bankruptcy and survival. Guinness Plc had a z-
score of 4.854 (2013) and 5.341 (2012), a decline
in the financial health in 2013 relative to 2012
though it can still be opined that the company is
healthy. Eterna Oil has a z-score of 30.190 (2012)
and 17.027 (2013) a decline also in 2013 relative to
2012, though the company enjoys a sound financial
health. Mobil Plc has a z-score of 4.177 (2013) and
4.701 (2012) a marginal decline as well in 2013
relative to 2012 though also still financially sound.
KEYWORDS: Z-score, financial health,
standardised, R, bankruptcy
Introduction
There has being many controversial questions on
the issues of liquidation of companies. Our study is
to use Altman Z-score to predict the bankruptcy of
some companies (Guinness Plc, Eternal oil, Mobil
Plc). Altman‟s Z-score is a tool used widely in
finance for analyzing and predicting the risks of
bankruptcy of listed firms. The Z-score is a
number computed as a sum of weighted financial
variables. Altman used companies‟ data from
1950s and 1960s in obtaining the original Z-score
model, which might be outdated. Thus, using more
recent data to estimate new Z-score model is
essential to evaluate the ability of analyzing and
predicting the risk of bankruptcies of listed firms.
Given the relatively high frequency of
bankruptcies filed by publicly-traded businesses,
and the threat posed to suppliers and other
stakeholders that rely on firms‟ solvency for their
own success, a reliable bankruptcy model with
consistent predictive power is essential in today‟s
business environment. One common bankruptcy
prediction method is Altman‟s Z-Score formula.
The objective of this study is to apply Altman‟s Z-
Score in a contemporary analysis during a period
of rapidly-changing business conditions. This
research work studies the predictive ability of the
Z- Score using data from 2012 and 2013 and
applies it to a group of firms (Guinness Plc, Mobil
Plc, and Eternal oil). In addition to using current
data, this study extends current research by
utilizing Altman‟s Z- Score with a new subset of
firms.
The original model, using US data, was put forth
by Altman (1968) and aims at predicting corporate
bankruptcy. While Altman proved in his paper that
the model is highly accurate for the US, does this
mean that it is also as accurate in an international
setting? Is the model robust in predicting corporate

INTERNATIONAL, JOURNAL OF SCIENCE & SOCIETY YABATECH VOL 4, No 1, SEPTEMBER, 2016
2 | P a g e
bankruptcy in the Nigeria? The purpose of this
paper is extending the Altman approach to
company‟s health in Nigeria. This basically means
that the new model will be constructed using the
guidelines from Altman‟s ground breaking paper.
The Altman‟s model will be constructed on the
basis of several financial and economic ratios.
Those ratios will be statistically analysed by first
evaluating them in a univariate approach.
Investment is the commitment of financial
resources which have been saved with the
expectation of some positive rate of return.
Investing one‟s savings in financial securities is to
improve the financial stability. Using the financial
analytical tools and the acceptance of quantitative
techniques by the investment community has
changed the investment scenario. Investment
decisions require scientific knowledge, a
systematic approach and professional expertise on
the part of the investor. Such a decision would
ensure an effective mix of safety, rate of return and
liquidity.
Financial analytical valuation process requires both
internal and external comparison of financial and
non - financial data to measure financial and
operational efficiency, as well as to determine the
strengths and weaknesses of an organization. Kahl
(2002) argues that investment decisions are
affected by the degree of uncertainty on a firm‟s
prospects and that stakeholders, such as creditors
may postpone their decision to learn more about
the distressed firm‟s on better information. Thus
uncertainty of financial performance makes
investors to be more prudent in choosing a
prospective company. Any prudent investor would
require an array of tools to predict the volatility of
a company‟s performance. This study looked into
company‟s health and likelihood of bankruptcy to
aid investors in knowing the state of the companies
they are investing on.
Identification of company malaises, operation and
financial, finds some of its foundations in ratio
analysis. Before the advent of quantitative
measures of business performance one would have
employed specific firms which would supply
creditworthiness information concerning other
firms. Studies concerning company failure
concluded that defaulting companies showed
significant different ratio measurements than non-
defaulting firms (Smith & Winakor, 1935). Beaver
(1966) and Tamari (1966), both utilised financial
ratios analysis in a bankruptcy prediction setting.
The latter study used a matched sample of
bankrupt and non-bankrupt firms, comparing their
respective ratios on an individual basis. Altman
(1968) brilliantly saw, “definite potential of ratios
as predictors of bankruptcy” and recognize that
ratios assessing profitability, liquidity and solvency
were among the most significant. He advocated
using the method to perform a multivariate
analysis rather than individually assessing the
ratios in a univariate setting. This eventually led to
the well-known Altman Z-score model, which this
paper extends upon.
Even though the foundations of this paper lie in the
insightful paper by Altman (1968), it does deviate
slightly from it which enables a significant
contribution to the existing literature. One of the
main points where this paper deviates from
Altman‟s is in its geographical application.
Compared to Altman‟s paper, where public US
manufacturing firms were used, this paper used a
dataset comprised of public Nigeria firms.
Firstly, addressing the accounting divergence, the
accounting practices for depreciation and
amortization of both countries differ as they
directly impact on earnings before interest and
taxes (EBIT). According to
PriceWaterhouseCoopers (2005), while both US
Chevron and Nigeria Chevron are similar to IFRS
in terms of depreciation and amortization, there are
differences concerning changes in the depreciation
method and the maximum life of an intangible
asset.
Secondly, there is the issue of differing financial
possibilities nowadays. These possibilities and
instruments allow users of them to manage
company aspects which effectively change the
firm‟s underlying probability of default. In support
of and extension to this claim is Marin (2013),
stating that the possibility of filing bankruptcy is
lower for firms managing foreign currency risk.
The outcome of this paper will be a Nigeria
specific Altman Z-score model. To the best of my
knowledge, such a model does not currently exist
at the time of writing this paper. The proposed
Nigeria model will contribute to the existing
literature by not only taking into account the

INTERNATIONAL, JOURNAL OF SCIENCE & SOCIETY YABATECH VOL 4, No 1, SEPTEMBER, 2016
3 | P a g e
divergence problems, but also taking on and
modelling some of the criticism hurled at Altman‟s
original model.
The type of information required from the analysis
of financial statements may vary depending upon
the user for whom the information is required.
Management‟s responsibility is to employ
resources efficiently to meet the objectives of the
business (Foss, Knudsen & Montgomery, 1995).
Investors need information to help them to decide
whether they should buy, hold, or sell.
Furthermore, investors are interested in financial
information that enables them to assess the ability
of the firm to pay dividends (i.e. return on
investment) for their stocks (Helfert, 1991).
Financial statements may assist the public by
providing information about the trends and recent
developments in the prosperity of the firm and the
range of its activities (Higgins, 1995).
The analysis of a firm‟s financial statements is
undertaken with the purpose of extracting
significant information relating to firm‟s
objectives, profitability, efficiency and degree of
risk. This is achieved by using ratios relating to
key financial variables and analysis of the
statements and the notes relating to them. Because
ratio analysis employs financial data taken from
the firm‟s balance sheet, statement of retained
earnings, and income statement, these reports and
their interrelations must be mastered to fully
understand the significance of the various financial
ratios (Betker, 1995).
The main aim of the study is to identify the
company‟s health using Altman-Z score. The
specific objectives are: to compute relevant
financial ratios for companies studied, compute
companies‟ z-scores using information from their
financial statements, use the variables in the annual
financial statement of companies to determine their
health, compare the health of companies studied
based on their z-scores, predict companies‟
bankruptcy likelihood using their z-scores and
make recommendations to companies studied.
Materials and Methods
The study covers companies in Nigeria, both in
manufacturing and other sectors. The companies
considered in this study are Guinness Plc, Mobil
Plc, Eternal oil Plc and Seven up Plc. We used two
of the leading Manufacturing companies (Guinness
Plc and 7up Plc) and also two of the leading Oil
and Gas sector (Mobil Plc and Eternal Oil Plc).
The data obtained were secondary data obtained
from financial reports of the listed companies at
the Nigeria Stock Exchange and the Capital
Markets Authority. The secondary data were
current assets and liabilities, total assets, retained
earnings, earnings before interest and taxes, book
value of equity and sales. The market price of the
firm‟s stock used in conjunction with the equity
number in the financial statements to compute the
market value of equity was obtained from the
official publication in the newspaper (Business
Day). The value of each ratio was computed by
researcher.
The Altman Z-Score (named after Edward Altman,
the New York University professor who devised it)
is a statistical tool used to measure the likelihood
that a company will go bankrupt (Wikipedia,
2014). Altman used a statistical technique called
multivariate analysis to the mix of traditional ratio
analysis techniques, and this allowed him to
consider not only the effects of several ratios on
the "predictiveness" of his bankruptcy model, but
also how those ratios affected each other's
usefulness in the model.
The formula for the Z-Score is:
The working capital / total assets ratio is a good
indicator of a firm's ability to make good on what it
owes in the next few months. The Retained
Earnings/ Total Assets ratio is a good indicator of
how in debt the company is and whether it has a
history of profitability. The Operating Earnings/
Total Assets ratio is a measure of efficiency in that
it indicates how many kobo the company generates
in earnings for every Naira of assets it owns. The
Market Capitalisation/ Total Liabilities ratio is a
fluid measure of the market's "confidence" in the
company. The Sales/ Total Assets ratio measures
the company's efficiency in delivering sales from
its assets.

INTERNATIONAL, JOURNAL OF SCIENCE & SOCIETY YABATECH VOL 4, No 1, SEPTEMBER, 2016
4 | P a g e
The Procedure is as follows:
Firstly, obtain the financial identities used in the
ratios from the financial statements of the
companies for the two years considered. Secondly,
the ratios were computed for each of the company
studied. Finally, Altman‟s equation for insolvency
prediction was evaluated using the ratios obtained.
With Altman‟s model, when Z-score < 1.81, high
likelihood of bankruptcy, when Z-score > 3.0, low
likelihood of bankruptcy, and when 1.81 < Z-score
< 3.0, indeterminate.
R studio was the software employed in executing
the analysis for this study.
Results
Table 1: Financial measures for the studied companies
Performance Measures Guinness Eterna Oil Mobil Plc Seven Up
2012 2013 2012 2013 2012 2013 2012 2013
Total Assets (T.A) 106.01 121.06 32.44 17.12 33.56 40.73 48.09 51.37
Working Capital (W.C) 60.81 69.78 6.86 8.64 21.23 26.35 18.82 23.51
Retained Earnings (R.E) 36.27 36.31 319.05 285.03 2.88 3.48 9.69 11.96
Earnings before Interest and Tax
(E.B.I.T)
22.48 20.81 1.60 1.66 4.7 5.73 1.68 2.88
Market Value of Equity (M.V.E) 266.96 270.7 2.35 2.35 42.93 42.93 10.31 12.58
Book Value of Total liability
(B.V.T.L)
67.39 75.02 25.78 8.75 26.97 31.19 38.18 38.79
Sales 116.46 122.46 90.49 99.31 80.8 78.74 59.86 64.09
Source: Financial statements of each company (2012, 2013)
Fig 1: Plot of Z-score for the companies for 2012 and 2013
Table 2: Summary of Z-scores for each Company per year.
Year Guinness Plc Eterna Oil Mobil Plc Seven Up Plc
2012 5.34 30.190 4.117 2.501
2013 4.85 17.027 4.701 2.234

INTERNATIONAL, JOURNAL OF SCIENCE & SOCIETY YABATECH VOL 4, No 1, SEPTEMBER, 2016
5 | P a g e
Table 3: Summary of Financial ratios
Ratio Guinness Plc Eterna Oil Mobil Plc Seven Up Plc
2013 2012 2013 2012 2013 2012 2013 2012
WC/TA 0.576 0.574 0.505 0.211 0.647 0.633 0.458 0.384
RE/TA 0.300 0.342 16.649 9.835 0.085 0.086 0.233 0.198
EBIT/T 0.172 0.212 0.097 0.049 0.141 0.140 0.056 0.034
MVE/BVTL 3.608 3.961 0.269 0.091 1.376 1.592 0.324 0.270
SALES/TA 1.012 1.099 5.801 2.789 1.933 2.408 1.248 1.222
Table 3 show the financial ratio of each firm
which are:
Working Capital to Total Assets: Guinness in
2013 was 0.576 and 0.574 in 2012. Eterna Oil in
2013 was 0.505 while 2012 was 0.211. Mobil
increased by 0.014 in 2013 (0.647) from 2012
(0.633) and Seven up was also greater in 2013
(0.458) than 2012 (0.384). Guinness Plc was
more liquid in 2013 by 0.2% (57.6% – 57.4%),
Eterna oil increased its liquidity by 29.4%
(50.5% - 21.1%), Mobil Plc increased its
liquidity marginally by 1.4% (64.7% - 63.3%)
while Seven Up also increased by 5.3% (23.3% -
18%)
Retained earnings to Total assets: Guinness
PLC in 2013 is 0.300 while 2012 was 0.342,
Eterna Oil in 2013 was 16.649 while 2012 was
9.835, Mobil PLC while 2013 was 0.085 while in
2012 was 0.086 and Seven up in 2013 was 0.233
while 2012 was 0.198. Guinness Plc decreased in
cumulative profitability in 2013 by 4.2% (30% -
34.2%), Eterna oil increased in cumulative
profitability by 6.81% (16.649% - 9.835%),
Mobil Plc decreased in cumulative profitability
in 2013 by 0.1% (8.5% - 8.6%) while Seven Up
Plc also increased by 4% (23.3% - 19.8%)
Earnings before interest and tax to Total
assets: For Guinness Plc in 2013 was 0.172
while 2012 was 0.212, Eterna Oil in 2013 was
0.097 while 2012 was 0.049, Mobil Plc in 2013
was 0.141 while 2012 is 0.140 and Seven up in
2013 was 0.056 while 2012 was 0.034. Guinness
Plc decreased in productivity in 2013 by 4%
(17.2% - 21.2%), Eterna Oil increased in
productivity by 4.8% (9.7% - 4.8%), Mobil Plc
increased in productivity by 0.1% (14.1% - 14%)
and Seven Up increased in productivity by 2.2%
(5.6% - 3.4%).
Market value of Equity to Book value of total
liabilities: Guinness Plc in 2013 was 3.608 while
2012 was 3.961 (35.3% decrease), Eterna Oil in
2013 was 0.269 while 2012 was 0.091 (17.8%
increase), Mobil Plc in 2013 was 1.376 while in
2012 was 1.592 (21.6% decrease) and Seven up
Plc in 2013 was 0.324 while 2012 was 0.270
(5.4% increase).
Sales to Total Assets: Guinness PLC in 2013
was 1.012 while 2012 was 1.099 (8.7%
decrease), Eterna Oil in 2013 was 5.801 while
2012 was 2.789 (301.2% increase), Mobil Plc in
2013 was 1.933 while 2012 was 2.408 (47.5%
decrease) and Seven up Plc in 2013 was 1.248
while 2012 was 1.222 (2.6% increase).
The results from table 2 above show the z-score
of each firm which are:
Guinness Plc has a z-score of 4.854 (2013) and
5.341 (2012). This implies a decline in the
financial health of the company in 2013 relative
to 2012 though it can still be opined that the
company is healthy. Also, Eterna Oil has a z-
score of 30.190 (2012) and 17.027 (2013). This
is also a case of decline in the financial health of
Eterna oil in 2013 relative to 2012, yet the
company enjoys a sound financial health. In
addition, Mobil Plc has a z-score of 4.177 (2013)
and 4.701 (2012). This company had a marginal
decline in her measured financial health in 2013
relative to 2012 though also still financially
sound. Lastly, Seven Up Plc has a z-score of

INTERNATIONAL, JOURNAL OF SCIENCE & SOCIETY YABATECH VOL 4, No 1, SEPTEMBER, 2016
6 | P a g e
2.234 in 2013 and 2.501 in 2012. This shows that
there was also a decline in the financial health of
Seven Up Plc in 2013 relative to 2012 and the
company is really struggling though we cannot
conclude that it is healthy or not.
Discussion
Conclusions reached from the results above are:
Firstly, relevant financial ratios were computed
as well as the z-scores for the companies
compared for years 2012 and 2013. Secondly,
Guinness Plc, Eterna Oil and Mobil Plc are
financially sound and have low likelihood of
bankruptcy as per their financial reports in the
studied years. In addition, Seven Up Plc result is
indeterminate; hence we cannot conclude on its
healthiness or otherwise. Furthermore, there was
general decline in the z-scores of all the
companies in 2013 relative to year 2012. Also,
Eterna Oil has least likelihood of bankruptcy as it
has the highest z-score of all the companies
compared. Lastly, the companies compared
differed significantly in their financial health.
It was therefore recommended that though
Guinness Plc, Eterna Oil and Mobil Plc are
stable, they should address the ratios that
decreased in 2013 so as to do better in
subsequent years. Also, they should consolidate
the current organization and business strategy
and sustain the measured health of their
companies. Lastly, Seven Up Plc should be
careful with their strategy because they have
50:50 chance of bankruptcy and survival, the
current business strategy should be looked into
and improved upon to change the fortunes of the
company and reverse the downward.
REFERENCES
Ahn, E. I. (2000) "Financial Ratios,
Discriminant Analysis and the
Prediction of Corporate
Bankruptcy". J. Fin., 589-609.
Altman, E. I. (1968) “Financial Ratios,
Discriminant Analysis, and the
Prediction of Corporate
Bankruptcy”, J. Fin. 23, 589 - 609
Argenti, M. (2003) Financial ratios as
predictors of failure, Empirical Research
in Accounting: Selected Studies,
University of Chicago, Chicago, Ill., 71-
111.
Beaver, W. H. (1966). Financial Ratios and the
Prediction of Failure.
J. Acct Res, 4, 71 111
Betker, L. (1995). An Empirical Examination
of Pre-Packaged Bankruptcy, Fin. Mgt.,
3 – 18.
Bruton, H., Wan, K., Ahlstrom, A., (2003)
“The effects of acquisitions on the
market value of the banking sector: An
empirical analysis from Greece”, Eur.
J. Sci. Res. (EJSR), 24 (3), 2008.
Bryant, S. M. (1997). “A case-based reasoning
approach to bankruptcy prediction
Modeling.” Intel. Sys. Acct., Fin. &
Mgt., 6, 195-214.
Business Day Newspaper (2013) Stock Market.
Eidleman, E. B. (2007) “A discriminant
analysis of predictors of business
failure” J.Acct Res., Spring Institute of
Professional Accounting, Chicago, I ll,
167- 179.
El-Zayaty, W., (2003), “Financial Ratios as
Predictors of Failure, Empirical
Research in Accounting: Selected
Studies, Supplement”, J. Acct Res. 5,
71-127.

INTERNATIONAL, JOURNAL OF SCIENCE & SOCIETY YABATECH VOL 4, No 1, SEPTEMBER, 2016
7 | P a g e
Eterna Plc (2013) Published Financial Online
Statement.
Foss, N.J., Knudsen, C., Montgomery, C.
(1995) An Exploration of Common
ground: Integrating Evolutionary and
Strategic Theories of the Firm. In N. J.
Foss & P. Torben (2000) Transferring
Knowledge in MNCs: The Role of
Sources of Subsidiary Knowledge and
Organisational Context. Denmark: Dept.
of Industrial Economics and Strategy.
Guinness Plc (2013) Published Online
Financial Statement.
Helfert, A. (1991) Techniques of Financial
Analysis, 7th
ed., Homewood: IL, Irwin.
Higgins, C. (1995) Analysis for Financial
Management. Homewood: IL, Irwin.
Kahl, M. (2002) Economic Distress, Financial
Distress and Dynamic Liquidation. The
J. Fin. 57 (5): 2317 - 2336
Marin, M.M. (2013) Bankruptcy. In Mel M.
Marin, Appellant vs. Thomas H.
Billingslea, Appellee, US Court, S. D.
California, February.
Mobil Plc (2013) Published Financial Online
Statement.
Ohlson, J.A. (1980). “Financial ratios and the
probabilistic prediction of bankruptcy.”
J. Acct Res.18 (1), 109 - 31.
PriceWaterhouseCoopers (2005) Similarities
and Differences - A Comparison of
IFRS, US GAAP and UK GAAP.
PWC, August.
Seven Up (2013) Published Financial Online
Statement.
Tamari, M. (1966) Financial Ratios, Analysis
and Prediction. London: Paul Elek Ltd.
Thynne K. (2006), “Test of the
Generalizability of Altman‟s
Bankruptcy. Prediction Model,” J. Bus.
Res., 10, 53 - 61.
Smith, R. F. & Winakor, A. H. (1935) Changes
in the Financial Structure of
Unsuccessful Industrial Corporations.
Bulletin No. 51, Urbana, III: University
of Illinois, Bur. Bus. Res.
www. Wikipedia.org/wiki/Altman_Z-score

INTERNATIONAL, JOURNAL OF SCIENCE & SOCIETY YABATECH VOL 4, No 1, SEPTEMBER, 2016
8 | P a g e
CRITICAL ANALYSIS ON THE POST ECONOMIC MELTDOWN FINANCIAL
PERFORMANCE OF GUARANTY TRUST AND ACCESS BANKS IN NIGERIA
Emmanuel Mmaduabuchi Ikegwu1*
; Sunday Okeke Obidiegwu1; Olusesan Oluyomi Olufolabo
1;
Funke Obafemi Omowunmi2;
1Department of Statistics, Yaba College of Technology, Yaba
2Department of Public Administration, Yaba College of Technology, Yaba
*Email: [email protected], 08066940814
ABSTRACT
The global economic meltdown hit the financial
world very hard and many financial institutions
Nigerian‟s inclusive still grapple with the effect
of that phenomenon and many are yet to recover
from it. This study critically evaluated the
financial performance of some big and
technologically re-engineered banks in Nigeria
using some financial performance measures, and
also compared the financial performances of the
banks considered. Guarantee Trust Bank Plc and
Access Bank Plc were selected for the study and
data on their post – economic meltdown
performances was obtained from their financial
statements over the period. Descriptive analysis
of the performances was presented and t-test
was used to ascertain compare the banks‟
performance. The results show that GTB
performed better than ACCESS in four of the
financial measures tested where mean difference
was significant (earnings per share, p = 0.002;
profit after tax, p = 0.013; operating income, p =
0.030; gross earnings, p = 0.013), ACCESS was
better in only one of the financial measure
(investment subsidiaries, p = 0.029) while they
do not differ significantly in the other financial
measures. These results are in consonance with
recent banking rankings in the country where
GTB was constantly ranked above Access Bank
in virtually all performance indicators. It is
concluded that GTB has a better operational
efficiency than Access as seen from the results.
It is therefore recommended that Access bank
improve in its operational efficiency to keep
pace with others within the industry.
KEYWORDS: Post-meltdown, Operational
efficiency, Financial performance, Mean
difference.
Introduction
The importance of a vibrant, transparent and
healthy banking system in the mobilization and
intermediation of fund, for the growth and
development of the economy need not be over-
emphasized. Worthy of note is the fact that the
level of functioning of the financial sector
depend on the perception and patronage of the
citizens towards its services, the situation where
the public losses confidence in the financial
institutions, can result in panic and
consequential financial and economic woes. The
absence of confidence in any organization is
attributable to opaque management practices
with deleterious effect on its performance (Al-
Faki, 2006).
The Nigerian banking sector has witnessed
remarkable changes in recent times given the
increasing wave of globalization, structural and
technological changes and integration of
financial markets. The reforms in the Nigerian
banking sector marked another giant stride in
the history and development of the Nigerian
banking industry. Banking industry in the world
overplays fundamental roles in the development
and growth of the economy, it plays the crucial
roles of lubricating the payment system,
resources mobilization and credit allocation. The
effective and the efficient performance of these
roles and the intermediation between the surplus
and the deficit units of the economy are largely
anchored on the level of development of the
financial system. It is in view of these that the
banking sector receives greater attention and has
become the most regulated and controlled sector
by government and its agencies (Imala, 2005).
In any country, the banking sector occupies an
important place in the financial system. The
reasons for this are the role banks play in the
development of an economy. Banks among
others play the following roles in an economy:

INTERNATIONAL, JOURNAL OF SCIENCE & SOCIETY YABATECH VOL 4, No 1, SEPTEMBER, 2016
9 | P a g e
They act as intermediary between the deficit and
surplus units in an economy, that is, they
mobilize funds and allocate them among
competing ends. Secondly, they facilitate the use
of appropriate monetary policy instruments as
well as make the transmission mechanism
reliable and policies effective. Thirdly, the
banking sector is instrumental in the pursuit of
stabilization policies and in structural
transformation. The main source of funds for
Banks is deposits and the main application of
funds is loan and investment. (Osuka and
Osadume, 2013)
The deregulation of the banking industry
initiated by the Babangida administration in the
1980s has changed not only the structure but
also the contents and service structure of
banking business. Just as the number of banks
grew from 40 in 1985 to 125 in 1991, the
techniques of delivering banking services and
range of products and services in the Market
have also changed. The changes have been
described as a “revolution” while others see
them as another banking boom comparable to
what was witnessed in the fifties. The
antecedent of banks proliferation and lack of
control by the supervisory authority led to the
paper profit declared by banks in order to stay
afloat. The effect of these unethical practices led
to the distress in the banking industry with the
introduction of the prudential guidelines and
statement of accounting standard which majorly
dwelt on the provisioning for loans and
advances. The lesson to learn from the distress
in the banking industry was that profitability
alone does not determine the yardstick for
financial performance of banks. The deficiency
of profitability as a measure of financial
performance led to the use of CAMEL which is
an acronym for capital adequacy, Asset quality,
Management, Earnings and Liquidity by
Monetary authorities. Since the introduction of
CAMEL, the banking industry has improved
tremendously with respect to their financial
performances (Osuka and Osadume, 2013).
The scenario of commercial banking in Nigeria
has been characterized by low capitalization
which consequently affected their financial
performance. While re-capitalization of
Nigerian banks may address this concern, the
effect of the exercise on banks performance
remains an empirical one. The main problem
addressed in this study, is whether
recapitalization of Nigerian banks has improved
their financial performance (Sani and Alani,
2013).
McCall & Walker (1973) studied commercial
banks in New Hampshire to determine whether
or not control by mutual savings banks affect
commercial bank profitability and also focused
on the role that ownership and control play on
profitability of banks in analyzing the impact of
ownership and control on some banks in the
United States. It was concluded that
management or owner-controlled status did not
affect the profit rates of these banks. In Nigeria,
the impact of ownership and control on the
performance of banks is significantly different.
Alashi, (2002) identified ownership structure as
one of the major variables that could be used to
explain financial distress in Nigerian banks. In
contrast, Heggestad ((1977) in the study of bank
pricing behavior affirmed that prices of bank
services decreases with the degree of monopoly
in banking markets.
Researches on factors impacting on profitability
of commercial banks have also been vigorously
extended to market interest rate sensitivities.
Since revenues of commercial banks are largely
from interest income, it follows that fluctuations
in interest rates should have an impact on the
profitability and overall financial performance
of these banks. There have been some studies
relating to the profitability of commercial banks
in Nigeria. Ogunlewe (2001) in a study of the
monetary policy influence of bank‟s
profitability, using data from Nigerian banks
found the determinants of bank profitability to
include reserve ratio, permissible credit growth,
stabilization securities and exchange rate.
Uchendu (1995) investigated the effect of
monetary policies on the performance of
Nigerian commercial banks. He found that
whether you use all banks data, six banks or the
then three large banks‟ data, the dominant
factors influencing bank profitability are interest
rates, exchange rate, bank reserves, banking
structure and unit labor costs, particularly when
return on capital is used as measure of
profitability. He concluded that stable and

INTERNATIONAL, JOURNAL OF SCIENCE & SOCIETY YABATECH VOL 4, No 1, SEPTEMBER, 2016
10 | P a g e
realistic monetary and banking policies are
important for the profitability of commercial
banking business in Nigeria. The study by
Uchendu is significant because it is an attempt
to shed more light on the factors that influence
commercial bank profitability in Nigeria. By so
doing, it assists the industry managers in
identifying the dominant variables to manage in
order to improve performance.
The issue of re-capitalization is a major reform
objective; re-capitalization means increasing the
amount of long-term finances used in financing
the organization. Re-capitalization entails
increasing the debt stock of the company or
issuing additional shares through existing
shareholders or new shareholders or a
combination of the two. It could even take the
form of mergers and acquisitions or foreign
direct investment (Asiedu, 2004). Whichever
form it takes the end result is that the long term
capital stock of the organization is increased
substantially to sustain the current economic
trend in the global world. Even though re-
capitalization policy of the Central Bank of
Nigeria (CBN) has increased the capital base
and made them competitive players for the
economic development of this country, there are
still some noticeable drawbacks being
envisaged.
This study examined and compared the Gross
Earnings, Operating Income, Operating
Expense, Profit after Tax, earning per Share
(basic), Retaining Earnings Reserve, Customer
Deposits, Investment in Subsidiaries, Investment
in Associates and Investment in Securities of
two banks in Nigeria over a period of five years
post economic meltdown. The findings of this
study would help banks retrace their financial
activities in other to achieve a greater financial
status in the coming years. The objectives
pursued in this study were to determine the
financial performance of Guaranty Trust and
Access Banks with reference to CAMEL and, to
compare the performance of both banks post
economic meltdown based on the different
financial performance measures
Materials and Methods
The data used for this study was a quantitative
secondary data measuring the performances of
Guaranty Trust and Access Banks extracted
from their Financial Statements published online
from 2009 to 2013. The performances measured
were gross earnings, operating income,
operating expenses, profit after tax (PAT),
Earning per share, retained earnings reserve,
customers deposit, investment subsidiaries, and
investment securities all extracted from financial
statements of the stated banks. The descriptive
of the data showing the means and standard
deviation was obtained as a measure of their
level of performance while t-test was employed
to ascertain differences in the mean
performances of the banks. Microsoft Excel was
used in the analysis.
Results
The results from the analysis using Microsoft
Excel 2013 are displayed in the charts and table
below:
Fig. 1: Bar charts of Gross Earnings and Operating Income of GTB and Access Bank

INTERNATIONAL, JOURNAL OF SCIENCE & SOCIETY YABATECH VOL 4, No 1, SEPTEMBER, 2016
11 | P a g e
Fig. 2: Bar charts of Operating Expenses and Profit after Tax of GTB and Access Bank
Fig. 3: Bar charts of Earnings per Share and Customer Deposit of GTB and Access Bank

INTERNATIONAL, JOURNAL OF SCIENCE & SOCIETY YABATECH VOL 4, No 1, SEPTEMBER, 2016
12 | P a g e
Fig. 4: Bar charts of Investment in Subsidiaries and Investment in Securities of GTB and
Access Bank
Table 1:
Mean, Standard Deviation, and the t-value obtained from GTBank, Access Bank
and measure of their mean differences for various financial performance measures.
Performance Measures Bank Mean Std. Dev. df T p
Gross Earnings
(#Million)
GTB 193334.80 19835.54 8 2.719 0.013
*
ACCESS 118639.40 58143.37
Operating Income
(#Million)
GTB 143781.00 31205.22 8 2.197 0.030
*
ACCESS 89685.20 45350.09
Operating Expenses
(#Million)
GTB 37089.00 9552.98 8 -0.924 0.191
ACCESS 44492.60 15149.83
Profit After Tax
(#Million)
GTB 60424.00 29623.89 8 2.740 0.013
*
ACCESS 22300.40 9496.33
Earnings Per Share
(kobo)
GTB 242.40 74.97 8 3.846 0.002
*
ACCESS 98.00 37.80
Customers Deposit
(#Million)
GTB 912158.00 195628.15 8 0.930 0.190
ACCESS 728729.00 395027.82
Investment in
Subsidiaries (#Million)
GTB 18375.00 5110.53 8 -2.207 0.029
*
ACCESS 41839.60 23216.70
Investment in Securities
(#Million)
GTB 104577.00 73587.07 8 -1.586 0.076
ACCESS 227384.80 156742.07
Note:*Bold p-values show those where GTB and
Access differ significantly at 5%

INTERNATIONAL, JOURNAL OF SCIENCE & SOCIETY YABATECH VOL 4, No 1, SEPTEMBER, 2016
13 | P a g e
Table 1 reveals that the mean gross earnings of
GTBank was #193334.80m (std. dev =
#19835.54) while that of Access Bank was
#118639.37m (std. dev. = #58143.37). This
implies that GTBank performed significantly
better than Access Bank over the five years post
economic meltdown (p < 0.05). A look at fig. 1
will show that over the five years, GTBank‟s
gross earnings were greater than that of Access
Bank. While the difference was very wide in the
first three years (2009 – 2011), the gap narrowed
in 2012 and 2013.
Also, the mean operating income of GTBank was
#143781.00m (std. dev. = #31205.22) and that of
Access Bank was #89685.20 (std. dev. =
45350.09) revealing that GTBank was also
significantly better in operating income than
Access Bank (p < 0.05). Fig. 2 shows that the gap
between the two banks was wide in all the years
except 2012.
The outcome of the operating expense show that
the mean opex of GTBank was #37089.00
(#9552.98) and that of Access was #44492.60 m
(#15149.83). This result meant that GTBank
performed better than Access Bank in the
management of operating expense though not
significantly (p > 0.05). A peep at fig. 3 reveals
that GTBank‟s operating expense was better
(lower bars) in 2010 – 2013 but worse (higher
bar) only in 2009.
The mean GTBank‟s profit after tax was
#60424.00 m (#29623.89) while that of Access
bank was #22300.40 (#9496.33) and it can be
seen that GTBank performed significantly better
than Access Bank (p < 0.05). Fig.4 shows that the
gap in the profit after tax of GTBank was very
widely different to that of Access Bank in all the
years except 2009.
The earnings per share measure reveals that
GTBank have a mean of 242.40 kobo (std. dev. =
74.97 kobo) and Access Bank‟s was 98.00 kobo
(std. dev. = 37.80 kobo). The implication here is
that GTBank performed significantly better that
Access Bank (p < 0.05) and fig. 5 supports the
claim that GTBank‟s earnings per share (eps) was
significantly higher than Access‟ for all the
periods reviewed.
GTBank‟s mean customer deposit was
#912158.00m (std. dev. = #195628.15) while that
of Access was #728729.00m (std. dev. =
#395027.82). It can be deduced that the difference
in customer deposit was not significant (p > 0.05).
Fig. 6 show that GTBank‟s customer deposit was
higher for the first three years (2009 – 2011) but
lower than that of Access in the last two years
(2012 – 2013).
Furthermore, the mean Investments in
Subsidiaries of GTBank was #18375.00m (std.
dev. = #5110.53) and that of Access Bank was
#41839.60m (std. dev. = #23216.70) revealing
that Access Bank has significantly higher
investment in subsidiaries than GTBank (p <
0.05). A view of fig.7 reveal that Access Bank‟s
investment in subsidiaries was higher in all the
years than GTBank‟s and very pronounced in
2011.
Lastly, GTBank‟s mean investment in securities
was #104577.00m (std. dev. = #73587.07) and
that of Access was #227384.80m (std. dev. =
#156742.07). Though it can be seen that Access
Bank‟s investment in securities was higher than
that of GTBank, the difference was not significant
(p > 0.05). Fig. 8 show that GTBank was higher
up till 2011 and Access took over the lead in 2012
and 2013.
Discussion
The findings of this study show that GTBank
performed better than Access Bank in respect of
gross earnings, operating income, operating
expense, profit after tax, earnings per share and
customer deposit while Access bank was better in
investments. Weighing these measures of
performance in the light of CAMEL, GTBank had
better earnings (gross earnings, profit after tax and
earnings per share). Also, in asset quality, Access
Bank had better performance (Investment in
subsidiaries and investment in securities) while
GTBank had better performance in customer
deposits. In addition, as per management,
GTBank performed better in managing operating
income and operating expenses. This agreed with
GTB (2012), Omoh (2014), Opeyemi (2016), and
Agusto & Co. (2015) which all put GTB before
Access Bank in most operational ratings in recent
times

INTERNATIONAL, JOURNAL OF SCIENCE & SOCIETY YABATECH VOL 4, No 1, SEPTEMBER, 2016
14 | P a g e
The research work had shown that most of the
measures under study increased over time in the
bid of the banks to recover from the meltdown
and put themselves on the part of growth again. It
can then be concluded that Guaranty Trust Bank
was better in most financial performance
measures while Access Bank was better only in
investment in subsidiaries and securities.
Banks are the back bones of any economy and
their performance is very vital for the growth and
expansion of such economy. Though, GTBank
and Access Bank are rated as very strong,
profitable, and growing banks, it was discovered
that GTBank was performing better than Access
bank. It is therefore recommended that Access
bank do everything possible like embarking on
aggressive marketing to improve on its earnings,
and manage its operating income and expense to
put itself on the part of growth and profitability.
Also, it should strive to improve on its earnings
per share to be able to increase the shareholders‟
investment.
References
Adegbemi, B.O.O., Donald, I.O., Ismail, O.F.
(2012) “Corporate Governance and Bank
Performance, a Pool Study of Selected
Banks in Nigeria.” Eur. Sci. Jour. 8 (28)
Agusto & Co. (2015). First Bank of
Nigeria Plc. 2015 Bank Rating Reports.
Agusto & Co. Ltd.
Alashi, S.O. (2002). Banking Crises: Causes,
Early Warning Signals and Resolutions.
Quarterly Jour. Nig. Dep. Ins. Corp.
(NDIC). 12 (4), 49 – 69.
Al – Faki, M. (2006) The Nigerian capital
market and socio-economic development.
A paper presented at the 4th distinguished
Faculty of Social Science, Public
Lectures, University of Benin, 9 – 16
Annual Report of Access Bank (2009 – 2013)
Retrieved from
www.google.com/financial_report_of_ac
cess_bank
Asiedu, E. (2004) Policy Reform and Foreign
Direct Investment in Africa: Absolute
Progress but Relative Decline, Dev. Pol.
Rev.22 (1), 41 – 48.
Asiedu, E., Lien, D. (2010) Democracy, foreign
direct investment and natural resources.
University of Kansas Working Paper.
Financial Statement for Guaranty Trust Bank
(2008 – 2013) Retrieved from
www.google.com/GTB_financial_report
GTB (2012). Bank performance ranking 2012:
How they stand. Guaranty Trust Bank.
https://www.gtbank.com/media-
centre/press-releases/49-media/gtbank-
in-the-news/299-bank-performance-
ranking-2012-how-they-stand
Heggestad, A. (1977) Market Structure, Risk
and Profitability in Commercial
Banking. The Jour. Fin., 32, 1207 –
1216.
Imala, O.I. (2005) Challenges of Banking Sector
Reforms and Bank Consolidation in
Nigeria. Bullion, 29 (2)
McCall, A.S., Walker, D.A. (1973). The Effects
of Control Status on Commercial Bank
Profitability. J. Fin. & Quant. Anal. 8,
637 – 645.
Ogunlewe, R.W. (2001) Sensitivity of Bank
Stock Returns to Market and Interest
Rates Risks: An Empirical Investigation.
Nig. Dep. Ins. Corp. Quar. Rev., 11 (1 –
2), 57 – 77
Olufolabo, O.O. & Talabi, C. O. (2010).
Principles and Practice of Statistics, (2nd
edn). Lagos, B-Optimum Prints.
Omoh, G. (2014) Nigerian Banks performing
well despite hurdles – Fitch. Vanguard

INTERNATIONAL, JOURNAL OF SCIENCE & SOCIETY YABATECH VOL 4, No 1, SEPTEMBER, 2016
15 | P a g e
Newspapers, October 9, 2014.
http://www.vanguardngr.com/2014/10/ni
gerian-banks-performing-well-despite-
hurdles-fitch/
Opeyemi, D. (2016). These are the Nigerian
Banks named among top 500 global
rankings Ventures Africa.
http://venturesafrica.com/nigerian-
banks-named-among-top-500-global-
ranking/
Osuka, B.O., Osadume, D. R. (2013). “The
Determinant of Financial Performance of
Quoted Banks in Nigeria” Int. J. Ed.
Res., 1 (10), 1 - 18. Retrieved from
www.ijern.com
Sani, J., Alani, G.O. (2013). “A Comparative
Analysis of Pre and Post Re-
capitalization Financial Performance of
Banks in Nigeria” Int. J. Cap. Build.
Edu. Mgt. 2 (1): 79 - 90. Retrieved from
www.rcmss.com
Uchendu, O. (1995) Monetary Policy and the
Performance of Commercial Banks in
Nigeria, CBN Econ. Fin. Rev. 33 (2), 156
- 170.

INTERNATIONAL, JOURNAL OF SCIENCE & SOCIETY YABATECH VOL 4, No 1, SEPTEMBER, 2016
16 | P a g e
EVALUATION OF HEAVY METALS IN SOME COSMETIC PRODUCTS
IN LAGOS NIGERIA.
Nzekwe Nwachukwu Martins, Imafidon Lawrence Osamu and Afeni John Kolawole.
Physical Science Department, Yaba College of Technology, Lagos State, Nigeria email: [email protected]
ABSTRACT
The harmful effects of hidden hazardous
heavy metals in cosmetics are not well
emphasized in Nigeria. These metals are
known to be of toxic effects to human
according to the results of several studies.
This study was aimed at evaluating the
presence of heavy metals like: Arsenic (As),
Cadmium (Cd), Chromium (Cr), lead (Pb),
Nickel (Ni), Mercury (Hg) and Zinc (Zn) in
selected cosmetics. Thirty samples of
imported cosmetics classified as: Nail polish
(Np), Eye shadow (Es), Perfume (Pf), Body
spray (Bs), Lipstick (Ls) and Powder (Pd)
were purchased from three major markets
(Balogun, Idumota and Ojota markets) in
Lagos State, Nigeria. Samples of these
cosmetics were prepared and analyzed for the
various concentrations of the metals present
using flame atomic absorption spectrometer.
The results obtained showed the presence of
these metals in the analyzed cosmetics at
varying concentrations. The ranges of the
concentrations obtained for As, Cd, Cr, Pb,
Ni, Hg and Zn were: 0.50 – 2.40 ppm, 0.20 –
6.10 ppm, 0.80 – 5.80 ppm, 0.20 - 3.20 ppm,
1.10 – 12.20 ppm, 0.10 – 1.80 ppm and 7.20 –
19.60 ppm respectively. The peak
concentrations respectively detected for As,
Cd, Cr, Pb, Ni, Hg and Zn, were: 2.40 ppm in
Pd-27, 6.10 ppm in Ls-15, 5.80 ppm in Es-6,
3.20 ppm in Ls-12, 12.20 ppm in Np-3, 1.80
ppm in Pd-27 and 19.60 ppm in Pd-26.
Obtained concentrations for this study were
relatively higher compared with similar
studies carried out in the European axis. Our
results suggest that dermal exposure to heavy
metals through the use of cosmetics is the
major route of exposure to these metals. Users
of cosmetics should avoid excessive use of it
since these metals could pose hazardous
health effects on them.
Keywords: Heavy metals, Impurities,
Bioaccumulation, cosmetics and Dermal
exposure.
INTRODUCTION
Heavy metals refer to any metallic element
that has a relatively high density and is toxic
or poisonous even at low concentrations
(Lenntech, 2014). They are found naturally in
the environment in rocks, water and soils.
Therefore, they exist in the manufacture of
pigments and can be used in trace quantities
into raw materials used in the manufacture of
the various cosmetic products available to
users. Some of these metals are used in
cosmetics for one reason or the other, for
example Cadmium‟s (a deep yellow to orange
element) colour properties enables it to be
used in some lipsticks and facial cosmetics,
thiomerasl (mercury) as a preservative, the
progressive hair dye lead acetate and a number
of tattoo pigments such as red cinnabar
(mercuric sulfide) and so on. Apart from the
regulated intentional uses of these heavy
metals in cosmetics, they can be found as
impurities also in various cosmetic products.
The latter makes it very difficult to avoid
exposure to heavy metals because of their
prevalence nature in the environment
(Nnorom et al., 2005; Ayenimo et al., 2010;
USEPA, 2013; Health Canada, 2011; Rashed
et al., 2010).
Several researches have related the causes of
some health issues to the presence of heavy
metals such as arsenic, mercury, lead,
cadmium, chromium, etc as impurities in
cosmetics, (Darbre, 2001 and 2003; Health
Canada, 2011; Harvey and Darbre, 2004;
McGrath, 2003; Houston, 2007; Kawata et al.,
2007; Liu et al., 2009; IARC, 2010). Adepoju-
Bello et al., (2012) reported that cosmetics
expose users to low level concentrations of
toxic heavy metals may pose potential health

INTERNATIONAL, JOURNAL OF SCIENCE & SOCIETY YABATECH VOL 4, No 1, SEPTEMBER, 2016
17 | P a g e
issues to the users since heavy metals are
known to accumulate in the biological system
over time and also known to induce skin
problems such as cancer. Heavy metals such
as lead and cadmium are notable for their
ability to accumulate in the body tissue faster
than the body detoxification pathways can get
rid of them; thus, a gradual build up of toxic
levels which can greatly be enhanced through
the application of cosmetics and other
personal care products on the skin. The skin,
despite being a protective barrier, some
components of cosmetics such as arsenic,
cadmium and lead penetrate and become
available in our systems, (Health Canada,
2009). Loretz et al., (2006), found that the
possibility of exposure to cosmetic products
may occur when applied via spray, while
dermally applied products to the mucous
membranes present the possibility of enhanced
availability or in the case of lips products
provide the opportunity for oral ingestion.
Nnorom et al. (2005), reported the significant
levels of heavy metals in facial cosmetics such
as eye pencil and lipsticks.
Heavy metals in cosmetics have been shown
to have adverse effects on human health. Lead
has been described as the environment‟s most
harmful contaminant to arise in human
civilization and has been shown to impair
renal, hemopoietic and nervous system with
different reports linking it to deficiency in
cognitive functioning (Chukwuma, 1997;
Nnorom et al., 2005). Lead poisoning leads to
poor intelligent quotient (IQ) (Wang et al.,
2002); inhibition of the synthesis of
haemoglobin, dysfunctions in kidneys, joints,
reproduction and vascular systems
(Ogwuegbu and Muhanga, 2005). Al-Saleh et
al., (2009), linked lead poisoning to infertility
and miscarriage. High concentrations of zinc
can result in stomach cramps, vomiting, skin
irritation, anaemia and nausea (Odukudu et
al., 2014).
International agency for Research on Cancer
(IARC) 2010, reported that cadmium and its
compounds are considered human
carcinogens. It is extremely toxic even at low
concentrations. Nickel though a trace elements
required in the body in minute quantities, can
accumulate in the kidneys, bones and thyroid
and cause toxicity (Rashed et al., 2010).
Allergy to nickel is common and it can cause
severe contact dermatitis (Health Canada,
2010). IARC (2010), arsenic and its inorganic
compounds are considered to be carcinogenic
to humans. Chromium (VI) ion (Cr6+
) is a
known human carcinogen; inhalation causes
lung cancer (Agency for Toxic Substances and
Disease Registry (ATSDR), 2008). Mercury is
a neurotoxin and the prolonged use of
products containing it can lead to
inflammation of the liver, kidneys and urinary
track infection, (Ramakant et al., 2014).
Mercury is particularly hazardous during
foetal development and it is readily absorbed
by the skin. Neither mercury nor thiomerasl
are highly common as direct ingredients or
impurities, but its high toxicity means that the
presence of mercury in any cosmetics is of
concern (Adepoju-Bello et al., 2012).
Arsenic, cadmium, lead and mercury are
among the metals banned as intentional
ingredients in Canada. The aim of this study
was to determine the concentrations of As, Cd,
Cr, Pb, Hg, Ni and Zn in commonly used
cosmetics available in Lagos State, Nigeria
and to assess if the concentrations are within
the acceptable standards.
MATERIALS AND METHODS
The modified method of Umar and Caleb,
(2013) together with Hydride Generation/Cold
Vapor Atomic Absorption Spectroscopy was
used for Arsenic and Mercury in this work.
Collection of Samples
Thirty different cosmetics in the classes of nail
polish (1-5), eye shadow (6-10), lipstick (11-
15), perfume (16-20), body spray (21-25) and
powder (26-30) were bought from Balogun,
Idumota and Ojota markets, Lagos State,
Nigeria. The cosmetics were coded as shown
in Table 1.

INTERNATIONAL, JOURNAL OF SCIENCE & SOCIETY YABATECH VOL 4, No 1, SEPTEMBER, 2016
18 | P a g e
Table 1: Samples list and their codes
Samples
Code
Samples
Brand
Samples
Code
Samples
Brand
Np-1 Colodion
gel 3.2.1
Es-6 Black
Opal
Np-2 Viva Es-7 Iman
Np-3 Everyone Es-8 Romantic
Np-4 Vienne Es-9 My
Colour
Np-5 Liz Es-10 Ushas
Pf-16 Seduction Lp-11 Island
Beauty
Blue
Flame
Pf-17 Professional Lp-12 Mary-Kay
Pf-18 Nauveaute Lp-13 Romantic
Pf-19 Nikita Lp-14 Iman
Pf-20 Wishbone Lp-15 Miss Rose
Bs-21 One love Pd-26 Iman
Bs-22 Cool breeze Pd -27 Black
Opal
Bs-23 Treajar Pd-28 Classic
Bs-24 Wishbone Pd-29 Bouquet
Bs-25 Balila Pd-30 Fashion
Faire
Preparation of Standard Solutions
Analytical grade tri-oxo-nitrate (v) acid (65%
sigma Aldrich) and Tetra-oxo-chloric (VII) acid
(70% Sigma Aldrich) were used for samples
preparation. Calibration standards for each
heavy metal were prepared each day from the
certified standard stock solution (1000 ppm
manufactured under ISO 9001 quality
Assurance System Perkin Elmer) in the range of
0.5 to 10 ppm. All solutions were prepared in
double distilled water. Dilution correction was
applied for samples diluted or concentrated
during analysis.
Preparation of Samples
The solid samples were crushed in a porcelain
mortar. 2g of each sample was weighed using
analytical balance and then taken into a 100 ml
digestion flask. 10 ml of Tri-oxo nitrate (V) acid
(HNO3) was added and the flask was placed in
the dark over night. On the next day, 5 ml of
Tetra-oxo-chloric (VII) acid (HClO4) was added
to it. The mixture was then placed on a hot plate
at 50°C for 15 minutes and then the temperature
was raised slowly up to 200°C. Heating was
continued until the white fumes of the HClO4
disappeared. This was done on a digester inside
the fume cupboard. After the digestion, the
contents were cooled and filtered through the
Whatman filter paper ( 2). Then the samples
were transferred to the 50 ml volumetric flask
and diluted with de-ionized distilled water up to
the mark. A solution of each sample was taken
into sample bottles for analysis.
A Perkin Elmer Analyst 200 Atomic
Spectrometer equipped with hollow cathode
lamp was used for the analysis while Hydride
Generation/Cold Vapor Atomic Absorption
Spectroscopy was used for As and Hg. The
instrumental parameters were adjusted as
specified by the manufacturer. The hollow
cathode lamps for the selected metals were of
wavelengths and slit wavelengths respectively
as: Ni- 232.00nm ; 0.20nm, Cd- 228.80nm ;
0.70nm, Cr- 357.90nm ; 0.70nm, Zn- 213.90nm
; 0.70nm, Pb- 283.30nm ; 0.70nm, As-
193.70nm ; 0.70nm and Hg- 253.70nm ;
0.70nm. Limit of Detection (LOD) of AAS used
was 0.0001ppm. The gas used was acetylene
with 20Pa pressure and air 45Pa pressure. The
instrument was calibrated with standard
solutions and the samples were introduced to it.
RESULT AND DISCUSSION
The samples were analyzed and the
concentration of the metals present were
displayed in parts per million (ppm) on the
display unit of the spectrometer and were
presented in Table 2, as follows,

INTERNATIONAL, JOURNAL OF SCIENCE & SOCIETY YABATECH VOL 4, No 1, SEPTEMBER, 2016
19 | P a g e
Table 2: Concentrations of Heavy Metals in Analysed Cosmetics Samples
Sample
Codes
As
(ppm)
Cd
(ppm)
Cr (ppm) Pb (ppm) Ni (ppm) Hg
(ppm)
Zn (ppm)
Np-1 1.00 1.80 1.20 ND ND 1.20 13.60
Np-2 0.80 2.10 2.30 1.30 1.10 1.20
Np-3 0.50 ND ND ND 12.20 1.60 9.40
Np-4 0.70 4.00 3.80 1.80 2.70 1.10
Np-5 0.80 2.40 2.60 1.90 3.00 0.40
Es-6 1.10 ND 5.80 1.80 4.80 0.70 7.80
Es-7 1.00 2.00 3.10 1.30 1.90 0.10
Es-8 1.00 1.20 3.20 ND 7.80 0.60 7.20
Es-9 1.10 1.90 2.30 1.20 2.90 0.50
Es-10 1.20 2.10 5.20 0.90 2.10 1.10
Ls-11 1.20 1.80 2.80 ND ND 0.80 8.80
Ls-12 0.70 3.60 2.00 3.20 ND 0.30 10.80
Ls-13 0.90 5.90 3.10 2.00 2.00 0.10
Ls-14 1.00 3.80 1.40 2.10 1.90 0.30
Ls-15 1.20 6.10 1.30 2.00 2.70 1.00
Pf-16 1.90 3.60 1.90 1.90 1.90 1.00
Pf-17 1.90 2.10 1.10 1.90 2.90 1.20
Pf-18 1.80 2.00 3.80 1.70 2.00 0.90
Pf-19 1.10 ND 0.80 1.80 ND 0.90 11.80
Pf-20 1.20 ND 1.20 ND ND 0.80 12.80
Bs-21 1.00 2.20 3.80 2.00 4.00 1.00
Bs-22 1.90 0.20 2.20 0.20 7.20 1.30
Bs-23 2.10 1.20 2.00 ND 2.00 0.70
Bs-24 2.00 3.30 4.00 1.80 2.60 0.50
Bs-25 1.80 2.80 2.90 1.90 1.80 1.10
Pd-26 1.80 ND 1.80 ND 4.80 1.20 19.60
Pd-27 2.40 4.20 1.80 2.20 1.50 1.80
Pd-28 1.70 2.50 1.10 1.40 1.80 0.80
Pd-29 1.40 3.60 1.60 1.60 3.10 1.20
Pd-30 1.60 3.10 2.00 1.50 3.60 1.00
ND= Not Detected
Table 3: Mean, Standard Deviation and
Range of Each Heavy Metal Analyzed in all
the Cosmetics in ppm
Heavy
Metals
Mean (ppm) ±
SD
Range
(ppm)
As 1.33 ± 0.40 0.76 – 1.78
Cd 2.75 ± 0.84 1.80 – 4.24
Cr 2.49 ± 0.78 1.66 – 3.92
Pb 1.74 ± 0.39 1.30 – 2.53
Ni 3.27 ± 0.90 1.30 – 2.53
Hg 0.88 ± 0.25 0.50 – 1.20
Zn 13.03 ± 4.22 9.80 – 19.60
The results of the analysis indicated the
uneven distribution of the metals and their
concentrations. The highest concentration of
Zn was found in sample Pd-26 (19.60 ppm),
Ni in sample Np-3 (12.20 ppm), Cd in sample
Ls-15 (6.10 ppm), Cr in sample Es-6 (5.80
ppm), Pb in sample Ls-12 (3.20 ppm), As in
sample Pd-27 (2.40 ppm) and Hg in sample
Pd-27 (1.80 ppm). The mean concentration of
the heavy metals for all the cosmetics
analyzed in decreasing order were 13.03ppm

INTERNATIONAL, JOURNAL OF SCIENCE & SOCIETY YABATECH VOL 4, No 1, SEPTEMBER, 2016
20 | P a g e
for Zn, 3.27ppm for Ni, 2.75ppm for Cd,
2.49ppm for Cr, 1.74ppm for Pb, 1.33ppm for
As and 0.88ppm for Hg. Table 4, shows the
distribution of the metals in the various
cosmetics considered.
Table 4: Mean concentration of heavy metals in the cosmetic products.
Forms of
Cosmetics
As (ppm) Cd(ppm) Cr(ppm) Pb(ppm) Ni(ppm) Hg(ppm) Zn(ppm)
Mean ±
SD
Mean ±
SD
Mean ±
SD
Mean ±
SD
Mean ±
SD
Mean ±
SD
Mean ±
SD
Nail
polish
0.76±0.16 2.58±0.85 2.48±0.93 1.67±0.26 4.75±4.36 1.10±0.39 11.50±2.10
Eye
shadow
1.08±0.07 1.80±0.35 3.92±1.34 1.30±0.32 3.90±2.20 0.60±0.32 7.50±0.30
Lipstick 1.00±0.19 4.24±1.60 2.12±0.72 2.53±0.51 2.20±0.36 0.50±0.34 9.80±1.00
Perfume 1.58±0.35 2.57±0.73 1.76±1.08 1.83±0.08 2.27±0.45 0.96±0.14 12.30±0.50
Body
spray
1.76±0.40 1.94±1.12 2.98±0.81 1.45±0.74 3.52±2.00 0.92±0.29 17.50±1.70
Powder 1.78±0.34 3.35±0.63 1.66±0.31 1.68±0.31 2.96±1.21 1.20±0.33 19.60±0.00
The highest concentration of Zn in this study
was 19.60 ppm in sample Pd-26, this value
was greater than a concentration of 0.332 ppm
reported by Odukudu et al., (2014). This may
be adduced to the shinning nature of Zinc, this
may tempt manufacturers to add either
regulated or unregulated amount of it in the
various samples.
Cd highest was 6.10 ppm in sample Ls-15,
this was higher than the impurity level of 3
ppm obtained in a similar research reported by
Health Canada (2009). The value obtained for
Cd in this work exceeded the limits suggested
by Nnorom et al., (2005) of 1ppm, and 0.50
ppm by Gondal et al., (2010). Ni highest
concentration was found in sample Np-3, as
12.20 ppm, this level was below the safety
permissible level of 1701μg/g (Basketter,
2003) and 5 ppm, (Gondal et al., 2010). The
value 3.20 ppm for Pb in sample Ls-12 was
lesser than the recommended safety level of
10 ppm (Health Canada, 2009) but higher than
1 ppm (Gesund und Wirtschaftlicher, 2010),
0.2 ppm (Expert Panel, 2007) and 0.5 ppm
(Gondal et al., 2010). Environmental Defence
Canada (EDC), (2011) suggested a safety
level of 3 ppm for As. The highest
concentration of As in this study was 2.40
ppm in sample Pd-27 which was below the
safety level of EDC, (2011). EDC, (2011) also
recommended a safe value of 3 ppm for Hg
and the highest concentration for Hg for this
study was found to be 1.80 ppm in sample Pd-
27 indicating that it was lower. Chromium‟s
highest concentration was 5.80 ppm in sample
Es-6, although not further varrified if it was
found as Cr6+
. This value was higher than the
permissible level of 0.00047 ppm for Cr6+
as
reported by Odukudu et al., (2014).
Comparing Heavy Metals in the analysed
Cosmetics for this Study with Similar Study
carried out by Umar and Caleb, (2013), there
was significant difference in the
concentrations of Cd. There where mark

INTERNATIONAL, JOURNAL OF SCIENCE & SOCIETY YABATECH VOL 4, No 1, SEPTEMBER, 2016
21 | P a g e
differences in the concentration of Ni, Pb and
Cr, these indicated that the concentrations of
the impurities differs with manufacturers and
locations.
Furthermore, our results indicated that the
major route of heavy metals entrance into the
body is through dermal exposure. With the
continual use of the analyzed cosmetics, users
are mostly exposed to five out of the seven
metals evaluated through dermal applications
i.e. Zn, Ni, Cr, As and Hg. The main source of
exposure of Pb and Cd is through ingestion as
depicted in Figure 1.
Figure 1: Routes of Heavy Metals Exposure in the Analysed Cosmetics
The study has shown notably the presence of
As, Cd, Cr, Pb, Ni, Zn and Hg in cosmetics
sold in Lagos state. These metals were
contained in relatively high concentrations
with respect to some safety limits reported.
Therefore, their presence in cosmetics could
act as additional source of heavy metals
exposure. The possibilities of bioaccumulation
in living tissues could be of potential harm to
human health.
CONCLUSION
The results obtained indicated that these
metals were present in cosmetics in varying
concentrations. Zn had the highest
concentration for all the cosmetics samples
analyzed with a concentration of 19.60 ppm
and a mean concentration of 13.03 ppm. The
highest concentration of each metal were: As–
2.40 ppm in sample Pd- 27, Cd– 6.10 ppm in
sample Ls- 15 , Cr– 5.80 ppm in sample Es-6,
Pb– 3.20 ppm in sample Ls -12, Ni– 12.20
ppm in sample Np-3, Hg– 1.80ppm in sample
Pd- 27 and Zn– 19.60 ppm in sample Pd-26.
The concentrations of some of these metals
are relatively high in this study with respect to
their known toxicity on human health.
Dermal exposure is the most significant route
of entrance of these metals into the body.
Therefore, users of these cosmetics are at high
risk of the harmful effects of these heavy
metals. For other contaminant detected that
were below the permissible limit, continual
use of such products may cause slow release
of these metals into the human body and thus
manifest their harmful effects as a result of
bioaccumulation over a period of time.
RECOMMENDATION
Most of these metals were present as
impurities. Users should desist from indecent
and excessive use of these cosmetics because
of heavy metals “Add Up” and could result in
long last harmful effects, Less is better.
Natural beauty should be encourage and
Artificial beauty jettison. Consumers are to
choose safer products. Government can help
pass smarter and health-protective laws. Ban

INTERNATIONAL, JOURNAL OF SCIENCE & SOCIETY YABATECH VOL 4, No 1, SEPTEMBER, 2016
22 | P a g e
harmful and risky cosmetics, Demand that
cosmetics companies fully disclose
ingredients and support those that do.
REFERENCES
Adepoju–Bello A. A., Oguntibeju O. O.,
Adebisi R. A., Okpala N. and Coker H.
A. B., (2012): Evaluation of the
concentration of toxic metals in
cosmetics in Nigeria. African Journal of
Biotechnology, 11(11): 16360 – 16364.
Al–Saleh I., Al–Enazi S. and Shinwani A. S.,
(2009): “Assessment of lead in cosmetic
products”, Regulatory. Toxicology and
Pharmacology, 54(2): 105 – 113.
ATSDR, (2008): Agency for Toxic
Substances and Disease Registry.
Toxicology profile for chromium (Draft
for Public Comment). Retrieved October
7, 2014 from
http://www.atsdr.cdc.gov/toxprofiles/tp.a
sp?id=102&tid=23
Ayenimo J. G., Yusuf A. M., Adekunle A. S.,
(2010): Heavy Metal exposure from
personal care products. Bull
Environmental Contaminant Toxicology.
84(1): 8 – 14.
Basketter D. A., Angelini G. M., Ingber A.,
Kern P., S. and Menné T., (2003):
“Nickel, chromium and cobalt in
consumer products: revisiting safety
levels in the new millennium”, Contact
Dermatitis, 49(1): 1 –7.
Chukwuma C., (1997): Environmental Lead
Exposure in Africa Ambio, 26: 399 –
403.
Cosmetics Ingredients Review Experts Panel,
(2007): Retrieved October 6, 2014 from
http://www.rxpharmacy.md/news/cosme
tic_ingredient_review_publishers_new_
2007_compendium.html
Darbre P. D., (2001): Underarm cosmetics are
a cause of breast cancer. European
Journal of Cancer Prevention, 10: 389 –
393.
Darbre P. D., (2003): Underarm cosmetics and
breast cancer. Journal of Applied
Toxicology, 23: 89 – 95.
EDC (2011): Environmental Defense Canada.
Heavy metals hazards. The health risks
of hidden heavy metals in face makeup.
Toronto, Ontario. Environmental
Defense Canada. Retrieved May 17,
2014 from
http://environmentaldefence.ca/sites/defa
ult/files/report_files/HeavyMetalHazard
%20FINAL.pdf
Gesund H. und Wirtschaftlicher V. E. (2010):
Federal Office for Consumer Protection
and Food Safety, Germany.
Gondal M. A., Sedigi Z. S., Nasr M. M. and
Gondal B. J., (2010): “Spectroscopic
detection of health hazard contaminants
in lip stick using lacer induced
breakdown spectroscopy”. Journal of
Hazardous Materials, 175 (3):726 – 732.
Harver P. W. and Darbre P., (2004):
Endocrine disruptors and human health:
could oestrogenic chemicals adversely
affect breast cancer incidence in
women? A review of evidence and call
for further research. Journal of Applied
Toxicology, 24: 167 – 176
Health Canada, (2009): Draft guidance on
heavy metals impurities in cosmetics.
Retrieved May 7, 2014 from
http://www.hc.sc.gc.ca/cps–
spc/legislation/consultation/cosmet/meta
l–metauxconsult–eng.php

INTERNATIONAL, JOURNAL OF SCIENCE & SOCIETY YABATECH VOL 4, No 1, SEPTEMBER, 2016
23 | P a g e
Health Canada, (2010): Report on Human
Biomonitoring of Environmental
Chemicals in Canada. Results of the
Canadian Health Measures Survey Cycle
1 (2007 – 2009). Ottawa.
Health Canada, (2011): The health risks of
Hidden heavy Metals in Face Makeup. A
report released by Environmental
Defence. Retrieved May 17, 2014 from
http://www.environmentaldefence.ca
Houston M. C., (2007): The role of mercury
and cadmium heavy metals in vascular
disease, hypertension, coronary heart
disease and myocardial in fraction.
Alternative Therapies in Health and
Medicine, 13: S128 – S133.
IARC, (2010): International Agency for
Research on Cancer. Agents classified
by IARC monographs, Volumes 1 – 100.
Retrieved October 1, 2014 from
http://monographs.iarc.fr/ENG/Classific
ation/index.php.
Kawata k., Yokoo H., Shimazaki R. and
Okabe S., (2007): Classification of
heavy metal toxicity by human DNA
microarray analysis. Environmental
Science and Technology, 41: 3769 –
3774.
Lenntech, (2014): heavy Metals. Retrieved
June 13, 2014 from
http://www.lenntech.com/processes/heav
y/heavy–metals/heavy–metals.htm
Liu H., Chen L. P., Ai Y. W., Yang X., Yu Y.
H., Zuo Y. B. and Fu G. Y., (2009):
Heavy Metal contamination in soil
alongside mountain railway in Sichuan,
China. Environmental Monitoring and
Assessment, 152: 25 – 33.
Loretz L., Api A. M., Barraj L., Burdick J.,
Davis D. A., Dressler W., Gilberti E.,
Jarret G., Mann S., Laurie Pan Y. H., Re
T., Renskers K., Scrafford C. and Vater
S., (2006): Exposure data for personal
care products: hair spray, spray
perfumes, liquid foundation, shampoo,
body wash and solid antiperspirant. Food
and Chemical Toxicology, 44, 2008 –
2018
McGrath K. G., (2003): An early age of breast
cancer diagnosis related to more
frequent use of antiperspirant/deodorants
and underarm shaving. European
Journal of Cancer Prevention, 12, 479 –
485
Nnorom I. C., Igwe J. C. and Oji–Nnorom C.
G., (2005): Trace Metal Contents of
Facial (Make–up) Cosmetics Commonly
used in Nigeria. African Journal of
Biotechnology, 4: 1133 – 1138
Odukudu F. B., Ayenimo J. G., Adekunle A.,
S., Yusuf F. A. M. and Mamba B. A.,
(2014): Safety evaluation of heavy
metals exposure from consumer
products. International Journal of
Consumer Studies, 38: 25 – 34. doi:
10.1111/ijcs.12061
Ogwuegbu M. O. C. and Muhanga W.,
(2005): Investigation of Lead
Concentration in the Blood of People in
Copper Belt Province in Zambia,
Journal of Environmental Management,
1: 66 – 75
Ramakant S., Poornima S. and Sapna J.,
(2014): Heavy metals in cosmetics.
Centre for Science and Environment,
Pollution Monitoring Laboratory,
PML/PR– 45/2014, India.

INTERNATIONAL, JOURNAL OF SCIENCE & SOCIETY YABATECH VOL 4, No 1, SEPTEMBER, 2016
24 | P a g e
Rashed M. N., Ahmed M. M., Al–Hossainy A.
F. and Abd S. M,m (2010): Trends in
speciation of heavy metals in serum of
patients with chronic hepatitis C and
hepatitis B using different pulse
absorptive stripping volumetric
measurements and atomic absorption
spectrometry. Journal of Trace Elements
in Medicine and Biology: Organ of the
society for minerals and Trace Elements
(GMS), 4: 138 – 145.
US EPA, (2013): United States Environmental
Protection Agency. Radiation Protection.
Retrieved April 29, 2014 from
http://www.epa.gov/rpdweb00/understan
d/ionize_nonionize.html
Wang C. –L., Chuang H. –Y. and Ho C. –K.,
(2002): “Relationship between blood
lead concentrations and learning
achievement among primary school
children in Taiwan”. Environmental
Research, (89) 1: 12 – 18.

INTERNATIONAL, JOURNAL OF SCIENCE & SOCIETY YABATECH VOL 4, No 1, SEPTEMBER, 2016
25 | P a g e
FACTORS AFFECTING THE GENERATION, MANAGEMENT AND DISPOSAL OF
URBAN HOUSEHOLD SOLID WASTE IN LAGOS STATE, NIGERIA.
HUNGBO Anthony Akinola, IDOWU, Falilat Olubunmi & VICTOR OPARA
Department of Quantity Surveying, Yaba College of Technology and
Department of Quantity Surveying, Lagos State Polytechnic, Ikorodu, Lagos.
Corresponding author: Hungbo Anthony Akinola: [email protected] , 08033357461.
ABSTRACT
Waste is a global phenomenon that has attracted
global concerns, particularly household solid
waste in developing countries. This household
solid waste is a by-product of urbanization.
population growth, technological advancement
and increase in consumption pattern. It therefore
means that the proper and sustainable
management of household solid waste within an
urban area requires the factors that influence the
generation, management and disposal of such
wastes, which is the aim of this paper, with a
view towards finding measures that would help
reduce their negative effects on urban cities
beautification and sanitation. This paper
established through a review of related literature
that the relationships among the significant
assessment variable such as residential area
type, employment status, monthly income, and
size of waste generated and disposed are high.
The study therefore recommended intensive
awareness program by the government to
sensitize the populace on the management and
disposal of solid wastes in city centres in order
to improve the health of the citizens.
Keywords: Generation, Management and
Disposal, Urban Waste
WASTE MANAGEMENT
1.0 INTRODUCTION
Waste is a wide ranging term encompassing
most unwanted materials, defined by the UK
Environmental Protection Act 1990, waste
includes any scrap material, effluent or
unwanted surplus substance or article the wise
spoiled. Moreover solid wastes comprises all
the wastes arising from human and animals
activities that are normally solid, discarded as
useless or unwanted. Or all materials that may
be required by law to be disposed off (Okecha,
2000).
A United Nations Report (August, 2004) noted
with regret that while developing countries are
improving access to clean drinking water, they
are falling behind on sanitation goals. At one of
its submit in 2000 (Uwaegbulun, 2004)
revealed that the World Health Organization
(WHO, 2004) and United Nations International
Children Education Fund (UNICEF, 2004)
Joint Report in August 2004 that: “about
2.4billion people will likely face the risk of
needless diseases and death by the target of
2015 because of bad sanitation”. The report
also noted that bad sanitation-decaying or non-
existent sewage system and toilets-fuels the
spread of deases like cholera and basic illness
like diarrhea, which kills a child every
21seconds.
In 1992, the “Earth Summit Succeeded in
alerting the conscience of the world to the
urgency of achieving environmentally
sustainable development. It affirms that rapid
urbanization in developing world if ignored can
be a threat to health, the environment and urban
productivity. Cities are the engines of
economic growth, but the environmental

INTERNATIONAL, JOURNAL OF SCIENCE & SOCIETY YABATECH VOL 4, No 1, SEPTEMBER, 2016
26 | P a g e
implications of such growth need to be
assessed and managed better.
In spite of the formulation of FEPA by the
Federal Government of Nigeria of Decree 58
(Federal Environmental Protection Agency) on
30 December, 1988 and a national
environmental policy, the environment has not
been adequately protected. Interest is mainly on
aesthetics, which is rarely achieved
(Agunwanba, 1998). Waste pollution is
irregular and restricted to the major cities.
Improperly sited open dumps faces several
cities examples the open dump at Ojota Lagos
Nigeria, thereby endangering public health by
encouraging the spread of odors and diseases
uncontrolled recycling of contaminated goods
and pollution of water sources (Adegoke, 1989
and Sigh, 1998).
However, in reactions to the inescapable
environmental impact of delay in solid waste
removal, the federal government for example,
introduced the monthly environmental
sanitation in the early seventies. From there the
states and local governments were expected to
take queue and evolve their own Solid Wastes
Management (SWM) strategies based on the
peculiarities of their states and environment.
From the above Lagos State had in the process
of mitigating urban solid waste, set up Lagos
Waste Management Authority (LAWMA) in
attempt to tackle the occurrence of wastes and
their hazards to society as a whole. While the
unhealthy aspect of abandoned solid wastes can
be contained, the avoidable features of blocked
drains. One feature common in the wastes
build-up and emanating environmental
degradation scenario is the high cost of capital
intensive nature of its amelioration as well as
tackling the solid waste menace. It requires a
lot of financial and human capital to minimize
and attempt to eradicate the adverse effects of
exposed and untreated household solid wastes
in our urban centers.
Generating of household waste are the resultant
of urbanization. As population drift to city
centers, the consumption patterns and needs
increases. Therefore these domestic wastes
includes that from domestic premises, caravan
sites, residential homes, educational
establishments and nursing homes (and
probably hospitals) which can be organic or
non-organic. The organic wastes can decay
which are food from the household and can be
composed and returned to the soil. But these
wastes such as cans of tins, plastics and bottles
are inorganic and cannot be treated in the same
way-as the organic. Domestic waste can pollute
the environment and be indirectly dangerous to
humans, therefore it is expected that the Lagos
State Government would in due course arrive at
the means to combat solid wastes and reduce
their negative impact on area resident and the
perception of our cities as being dirty, chaotic
and full of traces of rotting or fermenting
garbage‟s that emit odor
rest harmful to the human body. Obviously, the
timely removal of accumulated solid wastes
requires much more than Lagos State
Government and other government (local
governments and all LCDA‟s) are presently
engaged in. further plans, policies and
programs would need to be put on a more
permanent basis in order to combat the
dastardly effects of environmental degradation.
Understandably, it would require effective
mobilization of resources such as involving all
stakeholders in regular counter measure to
suppress uncontrolled solid waste generation
and irregular disposal outside city continues
altogether.

INTERNATIONAL, JOURNAL OF SCIENCE & SOCIETY YABATECH VOL 4, No 1, SEPTEMBER, 2016
27 | P a g e
2.0 FACTORS AFFECTING THE GENERATION, MANAGEMENT AND DISPOSAL OF
URBAN HOUSEHOLD SOLID WASTE
2.1 The factors contributing to waste
generation are:
1. Traditions/canned foods
In so part of the country today, there still
exists the use of leaves in the form of plates.
Also the now canned food, drink, water etc,
have become a means of waste generation,
which has become is substantial.
2. Personal income
A study by Afroz et al. (2010) found that
individuals with higher income generated more
waste than lower income people and
respondents that were concerned about the
environment generated less waste
3. Population
Rapid increases in the population and
improvements in the quality of life, especially
in urban cities in the developing countries, have
aggravated the problem of solid waste
generation. Therefore, waste management
authorities will require huge capital
investments and operational strategies for
collection, transportation, and disposal of solid
waste
4. Environmental awareness and concern According to Afroz et al. (2010) individuals
with that are concerned about the environment
generated less waste
5. Time of the year
It generally regarded that festive period of the
year generate more waste than other times. The
highest generation of waste is recorded in
December due to festivities in the southern
cities of Nigeria illustrating the influence of
time of year and traditions (Afon, 2007).
2.2 The problems hindering the management of waste disposal are as follows;
6. Technical,
Technical factors influencing the system are
related to lack of technical skills among
personnel within municipalities and
government authorities (Hazra and Goel,
2009), deficient infrastructure (Moghadam et
al., 2009), poor roads and vehicles (Henry et
al., 2006), insufficient technologies and
reliable data (Mrayyan and Hamdi, 2006).
7. Environmental,
Matete and Trois, 2008 and Asase et al., 2009
respectively suggested that the factors
affecting the environmental aspect of solid
waste management in developing countries are
the lack of environmental control systems and
evaluation of the real impacts. Ekere et al.
(2009) proposed that the involvement of the
population in active environmental
organizations is necessary to have better
systems.
Financial,
States and Local Governments have failed to
adequate manage solid waste as a result of
poor funding. According to (Sharholy et al.,
2007), huge expenditure is needed to provide
the service. The absence of financial support,
limited resources, the unwillingness of the
users to pay for the service (Sujauddin et al.,
2008) and lack of proper use of economic
instruments have hampered the delivery of
proper waste management services. However,
with the introduction of the private sector
participation (PSP) model, there have been
improvements in the efficiency of the system
Socio-cultural
Waste workers are associated to low social
status (Vidanaarachchi et al., 2006), situation
that gives as a result low motivation among
the solid waste employees. Various
Government do not attach priority to these set
of workers compared to other employees. You
hardly find any PSP operator with well

INTERNATIONAL, JOURNAL OF SCIENCE & SOCIETY YABATECH VOL 4, No 1, SEPTEMBER, 2016
28 | P a g e
equipped and trained and skilled personnel in
the organisation.)
Institutional
It is extremely difficult to gain an insight into
the complex problem of solid waste
management (Seng et al., 2010). This is
because information available is very scanty
from the public domain. Waste management
authorities have a lack of organizational
capacities (leadership) and professional
knowledge.
Legal
The introduction of the monthly sanitation
exercise that takes place on the last Saturday
of the month and the every Thursday market
clean up, contributes positively to the
development of the integrated waste
management system while the absence of
satisfactory policies (Mrayyan and Hamdi,
2006) and weak regulations (Seng et al., 2010)
are detrimental to it.
2.3 The factors affecting waste disposal are:
Disposal site
Most of the disposal sites in the state are
open dumps without leachate treatment,
protection at the bottom by a geo-membrane
or clay-lined layer, gases treatment nor other
infrastructures needed. For a state with a
population of over 15million citizens, the
three incinerators available are in adequate
Distance
The distances to most of the official dump or
disposal sites like the Ojota dump site vary
from 0 km in Olusosi axis to 20km in Apapa
from the city centers.
Cost
The tipping charge by the cat pushes, PSP
operators and the like, has led to the state
suffer from the illegal disposal of waste in
rivers, canals, drainage channels, empty lots
and roadsides
Materials
Materials like plastic, paper, metal, glass,
organic, battery, electric and electronic are
recyclable which makes their disposal
economical, while other solid waste like
fasces are emptied in the rivers, canals etc.
2.4 Management of Household Solid Waste
Waste Management simply means the
collection, keeping treatment and disposal of
waste in such a way as to render the waste
harmless to human and animal life, the
ecology and environment generally. It could
also be said to be the organized and systematic
dumping and channeling of waste through or
into landfills or pathways, to ensure that they
are disposed of with attention to acceptable
public health and environmental safeguard.
Household solid waste management has
become an area of major concern in Lagos
Nigeria till the advent of Fashola Babatunde
(SAN) government who took the challenge
head on to clear the heaps/ accumulated
wastes in order to win the battle against the
harmful consequences of unguided waste
dumping and then attainment of a clean
healthy environment for the state inhabitants.
2.5 Funding and Excessive Population
Waste management is by nature capital and economic intensive. The household solid waste require
huge capital outlay. Lagos State Government spends between 20-25% of its funds on waste
management (Mowoe, 1990). But what this amount could accomplished is nothing compared to the
population it caters for. Lagos State has a projected population of 18-22million persons and many
people continue to troop into the city per day in-search for survival from other part of the country
and the neighboring countries.
It is then estimated that the average individual in such mega cities as Lagos generates an average of
46kg of waste daily (Uchegbu, 1988). With it‟s the fund available or at least earmarked for the
household solid waste management is grossly inadequate, to fund the public agencies and other
private sector participants (PSP) when are involved in collection and disposal of household solid

INTERNATIONAL, JOURNAL OF SCIENCE & SOCIETY YABATECH VOL 4, No 1, SEPTEMBER, 2016
29 | P a g e
waste to fund the procurement of equipments and materials required for effective domestic waste
management and disposal. (Aigbokhavb, 2006).
2.6 Lack of Trained Professional Waste Managers
There are few sanitation and environment Engineers in Lagos compared to the enormity of the
population challenge. While most private sectors operators involved in the waste management are
mainly party stalwarts who know little or nothing about waste management than collection and
dump at the dump site. Therefore management of waste management agency should be headed by a
professional environmental manager who is well trained environmental practitioner.
2.7 The Way Out for a better Management and Disposal of Household Solid Waste in Lagos
There are two major approaches to the waste
management and disposal. These are private
and public arrangements. The private system
is a contractual arrangement between an
individual or group of persons who undertake
waste disposal as a business venture and the
waste generator example (P.S.P.)
This system is common among the high and
medium income households who can afford
the charge. The public system is more
conventional. This is a situation where
government establishes a waste disposal
agency whose responsibility it is to collect
waste from waste generators and dispose
them at disposal depots.
The combination of this two system is called
hybrid arrangement which is the system
needed for Lagos.
Though this system is been adopted in Lagos
State but lack the necessary legislator back
and particularly enforcement.
The hybrid system has many attributes which
support its adoption. While the public system
is under state government control and
supervision, the private system because of its
profit motive tries to offer satisfactory
service so as to get more customers and
enlarge its area of operation. This motive in
turn ensures that efficiency is maintained
(Omuta, 1988).
This hybrid system though have help Lagos
State to drastically reduce the problem of
waste generation management and disposal,
but operators are still facing serious
challenges in the area of inability to acquire
the needed modernized plants, equipments
and material for effective performance, due
to their capital intensive.
2.8 Application of Modern Technological
System in Managing and Disposal
According to a study done by Egunjobi
(1986), the problem of effective household
solid waste management has to do with poor
social services delivery efforts which cause
unnecessary delays in solid waste clearance. It
is either broken down machinery, non-
maintenance of dumpsters, poorly maintained
urban streets landfills site. Following the
modernized technological system of managing
and disposal of solid waste in Lagos State the
following motorized vehicles are suggested
for the Lagos State Government to acquire in
order to maintain the State Mega Status which
will also enhance the best practices and enable
the state minimize or free from health hazard
as a result of managing and disposal of
household solid waste.
Fore-and-aft tipper truck
Rear-loading hydraulic –computer truck
Front loader compaction collection
vehicle.
Tilt frame Roll-off Truck (particularly
suited in densely populated area with
minimal street access or unpaved streets)

INTERNATIONAL, JOURNAL OF SCIENCE & SOCIETY YABATECH VOL 4, No 1, SEPTEMBER, 2016
30 | P a g e
2.9 Disposal of Household Solid Waste in
Lagos State
Recycling is very popular among developed
countries, which have long realized that waste is
not necessarily a waste it can be turned into
money. Recycling according to (Wikipedia,
2009) report, is in most developing countries,
the widespread of collection and reuse of
everyday waste material such as empty
beverage containers. These are collected and
sorted out into common types so that the raw
materials can be reprocessed into new products.
Sorted waste can do the following:
It become raw materials
It can improve physical and environmental
health.
It can provide gainful employment.
It helps in establishing more raw materials
for processing in factories.
It can lead to self-reliance.
It can help establish recycling plants.
Moreover, Lagos State Government through its
Waste Management Authorities (LAWMA)
launched waste recycling management
initiative when it unveiled two communal
waste recycle banks in an effort to deal with
over 9,000tons of waste generated daily. The
scheme encourage communities in the state to
partner with the agency to sort waste in
furtherance of its waste to wealth program.
This program contributed immensely to the
reduction / eradication of hips of waste in
Lagos State thereby give way to the state
beautification and improved healthy
environment the citizens are now being.
Conclusion
Certainly, the hazard associated with the time
lag in disposing solid wastes is thus a
challenge to all stakeholders, especially
public officials who must provide leadership,
capacity building and funding or capital
formation to facilitate and renew community
service to ensure smooth social services
delivery to all.
There must be put in place a concerted
approach to waste avoidance, minimization
and reduction through modern methods of
waste management and disposal using the
right mix of strategies sustainable by
purchasing of updated equipments there is an
urgent need for well trained staff, vehicles,
trucks etc as enumerated in the literature.
Land fills management and control
which could give us waste-to-energy
programs to generate methane gas through
the land fills.
The support of private sector and
NGO‟s is also required most especially in the
area of organizing maintenance workshops
and enlightened program which should
include grassroots participation and input.
There is need for domestic waste
incineration plants in each local government/
council areas.
There should be effective penalties
invoked and culprits punished, so that the
enforcement of proper practices are not left to
area wide waste management authorities
alone.

INTERNATIONAL, JOURNAL OF SCIENCE & SOCIETY YABATECH VOL 4, No 1, SEPTEMBER, 2016
31 | P a g e
REFERENCES
Adegoke, O.S. (1989). Waste Management
within the context of Sustainable
Development proceedings of the
Environment and Sustainable
Development in Nigeria. Workshop,
25-26 April, Abuja Nigeria, pp 103-
110.
Agunwambas (1998). Solid Waste
Management in Nigeria Problems and
Issues. Environmental Management
22(6): 849-856.
Aigbokhavbo, V.O.O. (2000). Waste
Management in Nigeria; A
Comparative Analysis in Alsegbua
L.A. (ed). Selected Essay in Petroleum
and Environmental Laws, Benin City,
New Era, p.12-13.
CIPS (2002). How to develop a Waste
Management and disposal strategy.
Egunjobi, T.O. (1986). Problems of Solid
Waste Management in Nigeria Urban
Centres, In: E.A. Adeniyi, T.B. Bello
Imam (Eds): Proceedings of Nationla
Conference on Development and
Environmental, Ibadan: NISER, pp.
74-92.
Federal Military Government (1988). Federal
Environmental Protection Agency
Decree No. 58: A911-A932.
FEPA (1998). (Federal Environmental
Protection Agency), 1989 National
Policy on the Environment, Nigeria
FEPA, p.22.
Mitah, M. Problems of Domestic Waste
Management in Nigeria Any
repressors.
Mowoe, K.M. (1990). Quality of Life and
Environmental Pollution and
Protection in Omotola J.A. (ed.),
Environmental Law in Nigeria, Faculty
of Law, University of Lagos. P.177.
Napoleon, S. Momodu, Kingsley, O.; Dimuna,
Joan, E. Dimuna (2011). Mitigating
the Impact of Solid Waste in Urban
Centres in Nigeria.
Ogwuche, J. (2011). Assessment of the
Factors, Influences the generation and
disposal of urban household solid
waste in Africa: The Nigerian
Perspective.
Okecha, S.A.(2000), Pollution and
Conservation of Nigeria Environment
T. Afrique International Associates,
Owerri, Nigeria.
Omuta, G.E.D. (1988). Urban Solid Wastes
Generation and Management towards
on Environmental Sanitation Policy In;
P.O.Sada and F.O. Odemerho (eds):
Environmental Issues and
Management in Nigeria Development,
Evans Brothers Ltd (Pub), Ibadan.
RTI., International (2004). How to develop on
effective soild waste collection
program.
Singh, S.K. (1998). Solid Waste Management:
An Overview of Environmental
Pollution, Enviornmental Control
Journal, 1(3):50-56.
Taiwo, A.A. (2009). Waste Management
towards sustainable development in
Nigeria: A case study of Lagos State.
Uchegbu, S.N. (2007). Environmental
Management and Protection,
Enugu,Precision Printers (Pub.).
Uwadiegwu, B. O. (2013). Strategies for
effective urban solid waste
management in Nigeria.
Uwaegbulam, C. (2004); World is meeting
goals of safe drinking water but falling
behind on sanitation says UN The
Guardian Monday, August 30, 2004,
P.50.
Waste Management – From wikipedia the free
encyclopedia 2010 from
http://en.wikipedia_org/wiki/wasteman
agement (Retrieved on 10/16/2015).

INTERNATIONAL, JOURNAL OF SCIENCE & SOCIETY YABATECH VOL 4, No 1, SEPTEMBER, 2016
32 | P a g e
RELIABILITY STUDY OF SELECTED ELECTRONIC COMPONENTS- A CASE STUDY
OF RESISTORS 1,2
Oluyo, K.S., 3Nwosu, E.U.,
1 Sode, A.T. and
2,4Fasesin, S.B.
Department of Physics, Lagos State University, Ojo – Nigeria.
Department of Physical Science, Yaba College of Technology, Lagos – Nigeria.
Department of Industrial Maintenace Engineering, YabaTech., Lagos – Nigeria.
West African Examination Council (WAEC), International Office, Lagos – Nigeria.
Abstract
Instrumentation and control electronics have
been established as vital aspects of lots of
processes, ranging from manufacturing to
regulation for standard as with the Standard
Organisation of Nigeria (SON), and the
National Agency for Food and Drug
Administration and Control (NAFDAC) as
well as in oil exploration, transport (road, rail,
marine, air) management, technical projects
for research and development just to mention
a few. Beyond these civil uses of instruments,
the military even rely more on control
instruments for precision of reliable military
operations. Like any electronic gadget, a
control electronic instrumentation system,
comprising units (e.g. oscillator, amplifier,
power supply etc.), is composed of
components) like resistors, inductors,
capacitors, integrated circuits, thyristors,
crystals, inductors, sensors etc. This study
investigates the gap between rated and
measured values of selected range of
components, namely: resistors. A specified
variation is expected between the nominal and
rated values. This specified deviation is called
"tolerance". Every resistor has a specified
tolerance range over which the resistance
value is allowed to vary; anywhere from
approximately 0.1% to 20% of the nominal
value. The resistors used for this study, were
sourced only from a central location in Lagos
(Mushin) South-West Nigeria. Measured
values notably vary from the rated values but
most variations fall within coded range
indicated on the components. The resistors
were also tested for reliability in selected
circuits. The disparity in values did not
significantly affect the circuit performance in
the cases examined. Resistors with values
above 100 ohms show high difference while
those below 100 ohms show minimal error.
Components in the category investigated from
Mushin may be rated good for instrument
maintenance and precision electronic project
for students and researchers.
1.0 KEYWORDS: Control
instrumentation, reliability, circuit
performance, maintenance.
2.0 Introduction
Resistors come in many sizes, shapes, power
ratings and tolerances (Holowitz and Hill,
1997). Some have values stamped on the case,
while others have a group of colour bands that
allows experts to make out the values. Theses
discrete components are devices manufactured
specifically to provide a fixed or variable
resistance to fit a particular electrical circuit
application.The field of electronics is run by
devices called components. These components
may be active or passive. Resistors,
capacitors, inductors, thyristors, transistors,
integrated circuits (IC), sensors are examples,
just to mention a few. Instruments are
electronics systems made of these
components. Precisely, any technical system is
an assembly of components that are connected
together to form a functioning unit (Oluyo et
al, 2012). This unit is usually variously called
a machine, equipment or instrument.
Collection, use, operation or study of
instrument is called instrumentation.
Instrumentation is central to control systems
either in the military or in civilian
applications. The focus of this research is
resistor- a component which offers opposition
to the flow of current (with constant
resistance). The resistor is one of the simpler
electronic components.

INTERNATIONAL, JOURNAL OF SCIENCE & SOCIETY YABATECH VOL 4, No 1, SEPTEMBER, 2016
33 | P a g e
Electronic technology is now dominated by
semiconductor devices, which era started in
1947 with Bardeen, Brattain and Shockley
(Holowitz and Hill, 1997) of Bells Laboratory
as a successor of the vacuum technology. The
performance or otherwise of a machine is a
function of the state of the composing devices,
namely components. If a component does not
perform as expected it is said to have failed.
Component failure may be gradual, sudden or
catastrophic.
Figure 1: Carbon Film Resistor with Colour Code
The failure of a component (Loveday, 1988)
in any equipment thus leads to system failure.
Failure is said to be the inability of a system to
perform its required function (Aggarwal,
2007). The need for continuous performance
of an instrument requires that it is given
regular maintenance. The resistor is one of the
simpler electronic components. The resistor is
hardly suspected during maintenance routines
and resistor characteristics may not even be
given any attention until there's a resistor-
related problem with a circuit design. As a
service expert, say engineer or technician, it is
pertinent to consider some questions about the
resistor prior to fixing a resistor related fault
condition(Loveday, 1988). Ask first, what
makes a resistor fail? Then, by how much can
the resistance vary? Furthermore, ask what
magnitude of surge can it withstand? What
level of heating is expected in the resistor? A
good percentage of resistor related issues may
be resolved after answering these five key
questions. Empirically, temperature, voltage,
resistance, surge are the factors which play
very important roles in failure of a resistor.
In order to specify resistors, certain rated
parameters have to be indicated. These
technical features include resistance value in
ohms, power in watts, have rated values
a) Value: Resistance (ohm: Ω, k Ω, or m Ω;
1 k Ω = 103 Ω, 1 M = 1000 K Ω =
1,000,000Ω): indicated by colour code or
written.
b) Power: Indicated by the size of the
resistor.
c) Tolerance of the resistance: indicated by
the colour code.
d) Features: Measured resistance
corresponds with the indicated value
(within the limits of the tolerance).
e) Faulty: Open circuit reading
f) Replace with: Resistor with same
resistance (identical or better tolerance)
same or higher power dissipation.

INTERNATIONAL, JOURNAL OF SCIENCE & SOCIETY YABATECH VOL 4, No 1, SEPTEMBER, 2016
34 | P a g e
2.1 RESISTOR FAILURE
Resistor failure (Loveday, 1988)is considered
to be electrical opens (open circuit), shorts
(short) circuit) or a radical variation from the
resistor specifications, (Watkins and Russell,
1984). Recall that components generally may
fail gradually, suddenly or catastrophically
(Oluyo, et al, 2012). Each of gradual failure,
sudden failure or catastrophic failure may be
the open circuit, short circuit or radical
variation kinds of failure.
2.2 APPLICATIONS
Resistors, especially the general purpose ones,
are variously used for impedance matching,
loading, biasing, to limit current flow
(Holowitz and Hill, 1997) and reduce voltage
for many other applications while in the
adjustable resistor form is used as volume
control as isthe stereo, TV set, transistor or car
radio. Two parameters, STOL and voltage
stress are considered in this study to explain
the behaviour of a given resistor, wire wound,
film or composition type, behaviour prior to
failure. The composition type are not used in
critical applications e.g. on the medical
instrumentation in which case a high
reliability is a requirement.
2.3 SHORT-TIME-OVERLOAD
(STOL)
This is a technical concept that is used to
understand a resistor‟s expected voltage input
and this is empirically deduced from the
power rating (Watkins and Russell, 1984),
which is indicated by the size of the
component. STOL is a non-repetitive surge or
overload condition. A maximum allowable
STOL voltage exists for a given resistor. This
is typically two times the maximum
continuous rated voltage (VRATED). In practice,
ifa resistor is fed two to ten times the rated
power for more than 5 or 10 sec, the
component may be permanently damaged and
can melt the solder joints that hold the part in
place. The applied power correlates with
operating temperature, which relates to
oxidation.
2.4 VOLTAGE STRESS
Voltage stress is a concept that plays a vital
role in resistor failure. Normally, this stress
comes into play only on resistors with
resistance of more than 100 kΩ and voltage of
more than 500V. Voltage stress has become a
problem if a modest voltage-stress overload
results in a negative change in resistance that
exceeds the value for the maximum-STOL-
percent change!
2.5 INSTRUMENTS PERFORMANCE Machines at work must be sustained at
optimum performance (Aggarwal, 2007). This
is impossible if maintenance and repairs
become a hard task to achieve. Resistor-
related problems come up in circuit designs
from time to time. Hence component failure is
a commonplace on the field of electronics. A
component is said to have failed when it open
circuits, short circuits or exhibits radical
variation. A component misbehaves in any of
the states and it is no longer reliable. However
the reliability (Aggarwal, 2007) of an
electronic system stems from that of its
components. This study sets to investigate
how reliable components sourced from a
location in Lagos can be when called upon for
electronic repairs or component replacement.
Maintenance culture is key to any economy as
this has a direct bearing on technology
dependent systems and organisations. Ohm
(1828) propounded a law (Ohm‟s Law) which
relates the current (I), potential difference (V)
and the resistance (R) and this is the scientific
method by which the behaviour of a resistor is
estimated.

INTERNATIONAL, JOURNAL OF SCIENCE & SOCIETY YABATECH VOL 4, No 1, SEPTEMBER, 2016
35 | P a g e
3.0 Material and method Resistors were selected from Mushin market
located at Ido Oro, Lagos. South-West,
Nigeria. Once mounted, the assumptions are
that, the resistors in question have no defects,
they perfectly terminate, and attach to the pc
board (say) with an ideal solder joint. The first
stage used one thousand (1000) selected
components (resistors) in four (4) categories
with nominal values of
(a) 33Ω, 39 Ω, 56 Ω and 68 Ω.
(b) 160 Ω, 480 Ω and 220 Ω.
(c) 1KΩ (1K0 for short),1K8, 2K2 ,3K3, 3K9
and 4K7.
(d) 10K9, 15K0, 27K0, 30K0, 33K0, 100K0,
560K and 1M Ω.
The nominal (rated) values were determined
using resistor colour codes. Using high
sensitive test equipment, namely, a
professional digital multimeter (previously
calibrated for accuracy), each resistor was
measured using appropriate meter ranges.
Tolerance then estimated! Circuits (shown in
Figures2 and 3) were built and selected
components were tried as replacements for
initial components and circuit performance
then studied. A consideration study for
precision application outside normal civil use
is also included in the analysis to cover the
possibility of military engineering application.
Recall that such applications (military
engineering applications) require high
precision for reliable delivery of strategic
military services (Oluyo et al, 2012),
especially if it concerns warfare and remote
sensing or control. Such benchmarks as what
is called “Established Reliability” becomes the
yard stick to which the components have to
conform to.
Figure 2: Test Circuit 1-Capacitor charging and discharge circuit.
Figure 3: Test Circuit 2- Single stage amplifier

INTERNATIONAL, JOURNAL OF SCIENCE & SOCIETY YABATECH VOL 4, No 1, SEPTEMBER, 2016
36 | P a g e
4.0 RESULT We present the results of this study as tables 1
and two. Results of the follow up experiments
presented as test circuits (Figures 2 and 3)
were monitored using portable digital dual
channel oscilloscope with capability to display
both input and output simultaneously. We
present a replica each of the input and output
of test circuit 2 in Figures 4 and 5.
The summary of the resistance value
measurements (measured or nominal value/Ω)
and colour coded values (rated value/ Ω) is
presented as tables 1 and 2.
Figure 4: A replica of the input to Test Circuit 2 Figure 5: A replica of the output of Test Circuit 2
SN Rated
Value/Ω
Measured
Value/Ω
Difference/
Ω
%
Error
1 33 32.5 0.5 1.54
2 39 38.8 0.2 0.52
3 56 54.5 1.5 2.75
4 68 66.5 1.5 2.26
5 160 97.6 62.4 63.93
6 220 213.0 7.0 3.29
7 1000 700.0 300.0 64.86
8 1800 980.0 820.0 83.67
9 2200 2090.0 110.0 5.26
10 3300 3230.0 70.0 2.17
11 3900 3800.0 100.0 2.63
12 4700 4300.0 400.0 9.30
13 10000 9910.0 90.0 0.91
14 15000 14820.0 180.0 1.21
15 27000 26200.0 800.0 3.05
16 30000 29400.0 600.0 2.04
17 33000 32400.0 600.0 1.85
18 100000 97700.0 2300.0 2.35
19 560000 545000.0 15000.0 2.75
20 1000000 980000.0 20000.0 2.04
Table 2: Results of rated and nominal values of test resistors (“spurious” values omitted)
SN Rated
Value/Ω
Measured
Value/Ω
Differe
nce/Ω
% Error
1 33 32.5 0.5 1.54
2 39 38.8 0.2 0.52
3 56 54.5 1.5 2.75
4 68 66.5 1.5 2.26
5 160 97.6 62.4 x
6 220 213.0 7.0 3.29
7 1000 700.0 300.0 x
8 1800 980.0 820.0 x
9 2200 2090.0 110.0 5.26
10 3300 3230.0 70.0 2.17
11 3900 3800.0 100.0 2.63
12 4700 4300.0 400.0 9.30
13 10000 9910.0 90.0 0.91
14 15000 14820.0 180.0 1.21
15 27000 26200.0 800.0 3.05
16 30000 29400.0 600.0 2.04
17 33000 32400.0 600.0 1.85
18 100000 97700.0 2300.0 2.35
19 560000 545000.0 15000.0 2.75
20 1000000 980000.0 20000.0 2.04
Table 1: Results of rated and nominal values of
selected resistors

INTERNATIONAL, JOURNAL OF SCIENCE & SOCIETY YABATECH VOL 4, No 1, SEPTEMBER, 2016
37 | P a g e
5.0 Discussion
The result of measurements of resistor values
is given in table 1. It is observed that resistor
values less than 100 Ω (see serial 1 to 4 on
Table 1) show minimal deviation from rated
values. The least error is recorded for 39 Ω
resistors with a maximum error recorded for
56 Ω.
However a rather erratic deviation is observed
for each resistor above 100 Ω except for 220
Ω with a 3.29% error among error values of
over 60% in each of 160 Ω, 1 KΩ and 1K8Ω.
This rather strange tendency prompted some
statistical investigations in which the average
error as well as standard deviation was
computed for all test resistor categories. The
result (12.9Ω ±25.3Ω) shows that the
deviation is large with the inclusion of 160 Ω,
1 KΩ and1K8Ω. Table 2 shows the result of
Table 1 with the resistor values above
100ohms (shown in red) removed as indicated
with x in red (see Table 2 serial 5, 7 and 8)
and the result returns a relatively normal error
of 2.7Ω ±2.0Ω. The implication of this
investigation is that minimal error is expected
in a real life application where the resistors
(sourced from Mushin, Lagos South West
Nigeria) are in use with higher reliability
provided resistors of values above 100 Ω (in
red) are not included. To this end the Test
Circuit 1 involves two (2) 1 KΩ resistors
incorporated in a capacitor charge and
discharge circuit shown in Figure 2. The result
of the empirical investigation was satisfactory
as the outcome does not deviate significantly
from the expected circuit behavior. But this is
not a sensitive or precision circuit, it rather a
simple illustration. The foregoing leads to a
relatively complex circuit of Test Circuit 2
comprising a 1 KΩ resistor shown in the
single stage amplifier circuit of Figure 2
alongside three (3) other resistors (480Ω, 6.8
KΩ and 15 KΩ) carefully selected from the
lots. The output was monitored using portable
dual channel oscilloscope to enable
simultaneous display of both input and output.
The gain was monitored and was satisfactory
with 98.85% agreement with the expected
outcome circuit performance. This translates
to acceptable reliability. Note that the entries
in serial 19 1nd 20, namely 560 KΩ and 100
KΩ nominal values, recorded rather high
numerical differences (hence indicated in red)
but statistically bearable errors as these error
values (2.75% and 2.04%) are among the
acceptable figures being within the 2.7Ω
±2.0Ω range. The difference column (2072Ω
±5364Ω) is greatly influenced by high valued
resistor entries of serial 7 through 20 as
recorded in Tables 2 and 3.
In a follow up study a number of high
precision wire wound resistors were
investigated. The resistors are in three
categories, namely 0.1 Ω, 0.22Ω and 0.47Ω
alongside with a number of 1Ω metal film
resistors. Our result shows that only themetal
film resistors have their values in ranges
defined by the tolerance. The metal film
resistors show marked deviations from the
rated values. In order to ascertain if the results
are consistent with practical reality various
digital meters were used in turn to determine
their values. The resistors marked 0.1 Ω gave
0.2 Ω, the ones marked 0.22Ω gave 0.4Ω
while the ones marked 0.47Ω gave 0.6Ω on
average. This goes to suggest that the
reliability of this category of components in
practical application is questionable.
5.1 Conclusion
Resistor reliability is empirically a function of
a number of variables. Certain category of
resistors seem to be technically dependable
than other categories in terms of rated values.
Reliability of a components as empirically
determined by a researcher may necessarily be
reported with remark on the type of measuring
instruments used to ascertain the parameters
that led to the reliability figure.
5.2 Recommendation
Copious practical investigation is
recommended to establish some findings of
this study. The rated values are hereby
suggested not to be taken on the face value for
practical applications or usage, especially
where precision and accuracy are subject of
interest.

INTERNATIONAL, JOURNAL OF SCIENCE & SOCIETY YABATECH VOL 4, No 1, SEPTEMBER, 2016
38 | P a g e
6.0 Acknowledgement
The authors are grateful to the team of
undergraduate students who collaborated in
the process of procuring, sorting and carrying
out the bench work in the laboratory during
the research. OKS and FSB are grateful to
Late Akaegbobi C.A. (former HOD, Physical
Science Department, Yaba College of
Technology) for all time support for
Physics/Electronics oriented research. OKS is
also grateful to Dr Temi Oluyo of the
Department of Pure and Applied Mathematics,
Ladoke Akintola University, Ogbomoso-
Nigeria for (home based) challenging support.
7.0 References
Aggarwal, K.K. (2007). Reliability
Engineering, India Reprint Ed.,
Springer, India, pp. 1-10.
Bhattacharya, S.K. and Chatterji, S. (2009).
Projects in Electrical, Electronics,
Instrumentation and Computer
Engineering (First Edition), S. Chand
and Company Ltd.: New Delhi, India.
Pp239, 275.
DeMaw Doug (1984). Understanding
Resistors, First Step in Radio (Part 3) :
Luther.
George Loveday (1988). Electronics Fault
Diagnosis ( 3rd
Ed.), Longman
Scientific and Technical: UK, pp. 1-
2,30.
Oluyo, K.S., Nwosu, E.U., Osunmakinde,
A.O., Sode. A.T. and Fasesin, S.B
(2012). A comparative study of rated
and measured values of selected
electronic component, Conference
Paper at Yaba College of Technology
Confair 2012.
Paul Holowitz and Winfield Hill (1997). The
Art of Electronics, (2nd
Ed.),
Cambridge Low Cost Ed. Cambridge
University Press: UK, pp. 257, 330,
971, 1053, 4ff, 57f.
Physical Science Dept., YabaTech. (2013),
Foundation Experimental Physics
Series, A Lab Manual for Practical
Electronics. Yaba College of
Technology, Dept. of Physical
Science, pp. 2, 7, 8.
Pugh, F. and Ponick, W. (1988). Experiments
in Basic Electronics (Fouth Edition),
Glencoe – McGrw Hill: New York, pp.
3,7-11,17,23,186.
Rajash Malhostra (1987). Practical
Electronics Project, BPB Publications,
Delhi, pp 15,16.
School Council Project Technology (1985).
Resistors in Circuits in Basic
Electronics 2, School Council
Publications, UK, pp. 2-15.
Watkins, A. J. and Russell K. Parton (1984).
Electrical Installation Calculations,
vol. 1, Edward Arnoid Publishers,
London, pp. 5,6, 17.

INTERNATIONAL, JOURNAL OF SCIENCE & SOCIETY YABATECH VOL 4, No 1, SEPTEMBER, 2016
39 | P a g e
TOURISM DEVELOPMENT: A REVOLUTIONALISED SECTOR AS A PANACEA FOR
DWINDLING HOSPITALITY BUSINESS IN NIGERIA
1Ibeh, Phebian Ekwutosi; Emmanuel Mmaduabuchi Ikegwu
2*.;
1Amaechi, Chijioke Juliet.
1Department of Hospitality Management, Yaba College of Technology, Yaba Lagos
2Department of Statistics, Yaba College of Technology, Yaba Lagos
*Email: [email protected], 08066940814
ABSTRACT
Nigerian has abundant tourism components that
could make her the leading provider in African.
There are numerous attractions ranging from
places of natural beauty to cultural and historical
heritage. These papers identify the socio
economic impact of tourism along the coastline of
Lagos. Despite the fact that tourism is important
in the development of Lagos, there are still
problems encountered at the coastal line of Lagos
like over-congestion during the holidays,
pollution, solid waste disposal in the water by the
residents which causes environmental problem,
flooding etc. has constituted a major setback to
the development of hospitality thriving business
in Lagos State. The empirical part of this research
work is the use of qualitative research method
which include questionnaire, interviews and other
observations.384 well-structured and validated
questionnaires were distributed to the respondents
out of which 375 were retrieved. The data
collected from the respondents were analysed
using Statistical Package for Social Science
(SPSS). The result from the study reveals that a
revolutionized tourism industry is a remedy for a
thriving hospitality business in Lagos State (p <
0.001). The study recommends that government
should pay adequate attention to coastal tourism
as this will generate more revenue to the state
through a thriving hospitality business.
KEYWORDS: Tourism, Hospitality,
Panacea, Business, Revolutionalise, Job
opportunity
Introduction
Tourism development is an element of
economic growth that involves enlarging the
ownership base such as people benefiting
from the tourism industry through job
procurement, skills development business and
wealth creation and ensuring the geographical
spread of tourism business all over the given
destination. A very good and easy example of
tourism development is the right to host a
soccer event such as the "world cup". Tourism
definitely takes place in such a country
because many people coming from across the
world to witness the event gives the host
country advantage to open tourism businesses
such as hotels, restaurants, car rentals, parks
and all other businesses for the purpose of the
visitors. For instance, the “BRAZIL 2014
world cup” hosted by Brazil was a
revolutionized tourism sector which produced
thriving hospitality business because people
that came from all over the world to witness
the event thereby generating revenue from
tourism and hospitality business in the host
country.
In 2006, the Nigerian Government instituted a
new set of reforms in the tourism industry
with the aid of the United Nations
Development. This led to the creation of the
''Nigeria Tourism Master Plan". The report
identified amongst other things that the
number of international visitors to Nigeria had
been static over the last 15 years because of
factors like stodgy entry visa processes, lack
of information on Nigeria amongst tour
operators in the west, bad road networks, and
the dilapidated state of many of Nigeria's
historic sites. Shamefully. Six years after the
master plan had been drawn, the commentary
on tourism industry will probably be worse.
Though there has been a major influx of
global hotel brands into Nigeria in the five

INTERNATIONAL, JOURNAL OF SCIENCE & SOCIETY YABATECH VOL 4, No 1, SEPTEMBER, 2016
40 | P a g e
years, especially Lagos, the commercial
capital of Nigeria, the average cost of these
rooms puts it out of reach of the average
holiday maker from Europe and America
especially in these hard times. The tourism
master plan advocated for partnership
programs between the internationally operated
hotels in Nigeria and tour operators in the
west to use spare capacity in these hotels at
favourable rates. Five years after, the tourism
and hospitality industry still represents a
meagre 0.5% of Nigeria's GDP.
As a matter of fact, tourism is developing at a
faster rate globally and more countries are
getting awareness about the need to develop
tourism for socio-economic advantages.
According to the United Nation World
Tourism Organization (2006), tourism has
grown in terms of destinations as there has
been a widespread increase in the
geographical expansion of tourism throughout
the globe which has made it possible for many
developing countries to develop tourism at
their own pace for socio-economic
advancement. However, it is a general
phenomenon that tourism has a vital impact on
the society, topography, environment and
socio- economic aspect of any country. In the
social terms, the immediate benefit of tourism
industry is the ability to bring people out of
the unemployment circle. In other words, it
creates job opportunity and also caters for
both skilled and unskilled employment and it
is known to be a labour-intensive industry
which provides job per unit of investment
compared to any other industry. The industry
gives room to partnership and
entrepreneurship within the tourism business
concept thereby creating an innovation and
bringing about economic activity (Morrison,
Rimmington and Williams, 1999).
Despite the fact that tourism is important
today in the nation, the problem associated
with Coastal tourism is quite enormous. In
that case such problems are perceptive at the
coastal line of Lagos. Being the industrial
capital of Nigeria, Lagos has attracted millions
of people to the area for business, leisure and
other purposes. This resulted to the coastline
being over congested during the holidays. The
infrastructural facilities such as good road
network and parking space are not enough to
meet the demand of the Coastal region. The
problem of pollution is one of the vital issues
in contention. The Solid waste disposal in the
water by the residents and visitors has posed
potential environmental problem in the area
and made the coastal region unattractive.
Government is not paying adequate attention
to coastal tourism and this contribute a major
setback to the development of tourism along
the coastal line of Lagos.
The idea of developing tourism in a particular
area is encouraged by steady improvement in
the creation of social amenities and basic
infrastructures in the area in question. These
creations, coupled with attraction in the
destination bring about the development of
tourism in the area. The idea of using
infrastructure to develop tourism in a
destination happened to be something of a
gradual process. The physical improvement in
the destinations' infrastructure would help to
improve socio-economic relations among the
local people. Community was revealed to be
the major factor to modern tourism (Godfrey
and Clarke, 2000).
In other words, communities were the basic
element in the supply of accommodation,
catering, information, transport facilities and
service. As the interaction goes on, and the
level of inflow of tourists continue to be on
the increase, coupled with the fact that
infrastructure is in place, the local people
would start to bring up ideas of setting up
hospitality businesses such as hotels,
restaurants and the likes. Then, the destination
becomes popular giving room to more tourism
businesses which in turn encourages tourists
to the area. As the process of tourism
development continues, as a matter of fact,
government and cooperate bodies would start
to pick interest in the areas thereby investing a
huge amount of money to maintain, sustain
and retain the destination as a major tourist
region (Godfrey and Clarke, 2009). This
among others would lead to the creation of
civic centre, parks, street improvement, good
road networks and other facilities that will
enable the area to be totally tagged as a tourist

INTERNATIONAL, JOURNAL OF SCIENCE & SOCIETY YABATECH VOL 4, No 1, SEPTEMBER, 2016
41 | P a g e
destination region. The increase in all these
facilities provides opportunities for even a
small city to develop as a tourist destination.
The following sub-headings explain tourism
planning and tourism marketing as some of
the major evidence towards enhancing tourism
development.
Tourism in a revolutionized sector as panacea
for thriving hospitality business development
cannot be discussed without taking into
consideration the planning of tourism.
Tourism planning has recently been
acknowledged from three different levels,
namely the national, local and personal
attractions. The central government
coordinates and manages the tourist regions in
the whole country, possibly through policy
development, national standard and
institutions. Also, it involves the developing
and planning of individual tourist attractions,
services and facilities to serve the tourists'
need. At the local level, it equally involved the
planning and management of tourist
destination area and these factors are equally
important to that of the national level
(Godfrey and Clarke, 2009). Apart from that,
the local government also involve themselves
in the organization and development of
visitors' attractions and services in and around
destination regions. These regions are the
basic element of tourism. They are the major
point for the supply of tourism services such
as accommodation, catering, tourist
information, transportation and all other
tourist services. These services are the reasons
why national and local government focused
attention on them in order to establish a
maintainable tourism destination.
Five years after the tourism and hospitality
industry still represents a meager 0.5% of
Nigeria GDP.
The destination regions must have many
values ranging from cultural, historical and
even environmental in which it is necessary to
be maintained in order to attract tourists. The
majority of tourists are concerned about the
destination in which they will spend their
holiday. So, the natural environment of the
host regions, their buildings and tourist
institutions, their people, culture and history
and other forms of tourist elements are what
the tourists wanted to experience in the
destination. (George, Mair and Reid, 2009)
The growth in tourism industry can also be
attributed to the increase in tourism marketing.
Tourism marketing is the method of applying
the correct marketing concepts and ideology
to planning a strategy to attract tourists to
particular destinations which may come in
form of resort, city, region or country.
Marketing is a process of planning and
executing the conception, pricing, promotion
and distribution of ideas, goods and services
to create exchanges that will satisfy' individual
and organizational goals. Referring to the
definition in the concept of tourism marketing,
it revolves around planning for tourism from
the demand and supply concept in order to
satisfy both the host communities (suppliers of
tourism) and the visitors (Godfrey & Clarke,
2000). Marketing is a process of identifying
customer's satisfaction, design appropriate
product and design a market to convey it to
the final consumer (Pierre, 2000). It can also
be a way of executing the conception, pricing,
promotion and distribution of ideas, goods and
services to create an exchange that satisfied
individual and organizational goals. Referring
the definition in the concept of tourism
marketing, it revolves around planning for
tourism from the demand and supply concept
in order to satisfy both the visitors and the
communities (Kotler, 2006). The application
of marketing in tourism industry is an equal
focus on the "four Ps" (Product, Place, Price
and Promotion). Product: the destination or
region as a product can only be consumed by
travelling to that region. Equivalently, the
product is also the place and each tourist can
consume or buy the product/place at different
prices (Kotler. 2006). As a matter of fact,
when marketing a city, price is the least of
focus. This is because it discourages some
tourists whose intention is to have fun without
paying anything. Promotion is an awareness
created by media and other advertising agents
for the events. The promotion of socio-
economic expansion by tourism was driven by
the fact that, as an export industry, it
encourages new spending within the local or

INTERNATIONAL, JOURNAL OF SCIENCE & SOCIETY YABATECH VOL 4, No 1, SEPTEMBER, 2016
42 | P a g e
host communities. This spending creates job
opportunities, socio-cultural interaction, pride
and appreciation, understanding and respect,
and even tolerance for each other's culture and
norms (Kotler, 2006). In addition to the socio-
economic benefits, tourism development tends
to appreciate local cultures, promote solidarity
from cultural exchange give rooms for
comprehendible feelings of both the host
communities and the tourists (Kotler, 2006).
However, based on the increase in tourism
awareness all over the world, it has been a
general notice that social and economic
tourism play a vital role in the sustainability of
the global tourism. While social tourism
explains how satisfied a tourist is at any
destination, economic tourism modifies the
financial affordability of the situation.
Therefore, social and economic tourism are
directly the pillars of sustaining tourism in the
world.
Tourism is a social vice that is established by
the participating individuals either as
travelers, hosts or employees. There is a
growing effort of local communities to
promote and improve social tourism.
Destination regions are trying to attract the
interest of visitors with their cultural heritage,
natural beauty, norms and values and their
contribution toward protecting biodiversity.
Social tourism is a tourism initiatives
comprise of programmes and projects aim at
ensuring the right to holiday and access to
tourism to all population groups, including
poor children, low-income earners and
individuals with limited capacities (Minnaert,
Maitland& Miller, 2010). From that point of
view, social tourism is for everyone in as
much as there is an intention to travel. Social
tourism is an interface for social and cultural
exchange (Barkin, 2009). It facilitates the
interaction between communities and tourists
both on domestic and international level.
Tourists want to interact with other cultures,
want to learn more about their values, learn
about traditions and even confront themselves
with a new way of life and society. It has been
revealed from research that travel is a means
of discovering those things unknown or
forgotten within oneself. Social tourism is
indeed an experience driven industry and local
culture is a unique experience.
Moreover, local personality and hospitality
bring about what tourists regard as built
attractions whereby the more one learns about
a particular destination, the more fulfilling the
travel experience will be. Social tourism is an
element for raising a social awareness, in the
sense of creating awareness on local issues
and needs thereby booming regional identity
both nationally and globally. The globe is
creating an investment trend towards
interpreting natural and cultural resources.
The attraction to natural and heritage values
helps to generate revenue and provide
opportunities to effect management in the
sensitive and vital destinations. However,
socio-cultural values of the destination that
create attraction are not the only drive for
attractions, but provide one of many
experiences. In that case, social tourism is a
factor for tourism development in any given
destination region (Barkin, 2009).
Issues that must be addressed by Nigeria in
meeting the challenges of climate change and
to promote sustainable tourism development
include the following:
Lack of adequate political will to legislate
and regulate human activities related to
climate change, the environment and the
tourism industry at large.
Lack of adequate funding to address
desertification and de-forestation in affected
areas.
Lack of rain causing drought and death of
wildlife that in turn is resulting in the
encroachment of herdsmen into game
reserves and national parks.
Flooding that is eroding road networks, and
negatively affecting wild life and human
socio-economic activities as experienced in
Kano, Jigawa, Taraba, Nasarawa and Sokoto
States.
Mining activities and the emission of
radioactive gases at the Jos, Plateau, Jagindi,
Kaduna, Nasarawa, Eggon/Keana Nassarwa,
Nkalagu, Enugu and Zamfara States.
The dumping of toxic waste in Nigeria's sea
ports and industrial cities including Lagos,
Port Harcourt, Kano, Onitsha, Kaduna and

INTERNATIONAL, JOURNAL OF SCIENCE & SOCIETY YABATECH VOL 4, No 1, SEPTEMBER, 2016
43 | P a g e
other capital towns. These have resulted in
mysterious ailments proving difficult to
cure.
Business travel and movements by air and
land emit high levels of carbons through
aircrafts and automobiles.
Tourist flows to Nigeria for ecotourism,
safari and related activities is negligible
compared to business travel.
Nigeria's industrial cities such as Lagos,
Kano, Ibadan. Aba, Onitsha, Port Harcourt
and the cosmopolitan cities of Sokoto,
Maiduguri, Lafia that utilize automobiles to
the fullest constitute much of the air/smoke
pollution.
Insecurity through the activities of restive
youth such as the Niger Delta Militants in
the South-South and the Boko Haram Sect
in the northern parts of Nigeria threatens the
inflow of tourists.
Nigeria is blessed with rich and abundant
natural resources that are mostly untapped.
These can be seen from the rich coastal
mangrove and rainforest to the savannah
regions. There are also opportunities that
abound in government efforts in the
promotion of tourism at both domestic and
international levels. Some of both the public
and private sectors initiatives are as follows:
The environmental and tourism policies of
Nigeria give priority to ensuring
environmental sustainability of the tourism
resources.
The establishment of the Climate Change
Unit under the Federal Ministry of
Environment at the federal level that
oversees and regulates all industrial and
rural development.
Federal Ministry of Tourism and Culture
that promotes the utilization of
environmental resources for ecotourism.
Federal Ministry of Agriculture and
Forestry implementing reforestation and
agricultural management programs, as well
as park forestry reserve activities.
Ecology funds being made available to
States in billions of Naira on a yearly basis
to combat erosion, desert encroachment,
gullies, petroleum oil spills, etc.
The World Wildlife Conservation
Federation with their activities in the forest
reserves and national parks.
National Conservation Societies are in all
States of the Federation coordinating
environmental activities.
This study undertook to show that a revolution
of the tourism industry would drastically lead
to the growth of the hospitality business.
Among the Specific Objectives are pursued
were to promote tourism development in
Nigeria and to assess the remedies of a change
in the tourism sector in the hospitality
industry, explore in details, the trends which
impact both the hospitality industry as well as
the tourism industry that makes up a wider
travel experience and to carve out socio-
economic roles for tourism providers and
assess the socio-economic contribution of
tourism development on the host community
and to recommend a way forward towards the
enhancement of coastal tourism in Nigeria.
Materials and Methods
The study explored conceptual, descriptive
and review method of research paradigms in
order to explore the objectives in the context
of tourism as a panacea for a thriving
hospitality industry. The research design was a
sample survey, and the data were collected
through observations, interviews and well-
structured questionnaire. The questions were
arranged round the objective with a focus on
the research questions. Practitioners in the
industry (384) were purposively selected from
Lagos environment and interviewed
employing the questionnaire designed for the
purpose. The paper also draws largely on the
use of post research findings and many
academic literatures such as
(George, Mair and Rod, 2009), etc. The data
obtained from the questionnaires were
analysed with SPSS 20 using frequency
distributions alone.
Results
The findings from the respondents about the
revolution of the tourism industry being a
remedy for a thriving hospitality business
were analysed as follows. The gender analysis
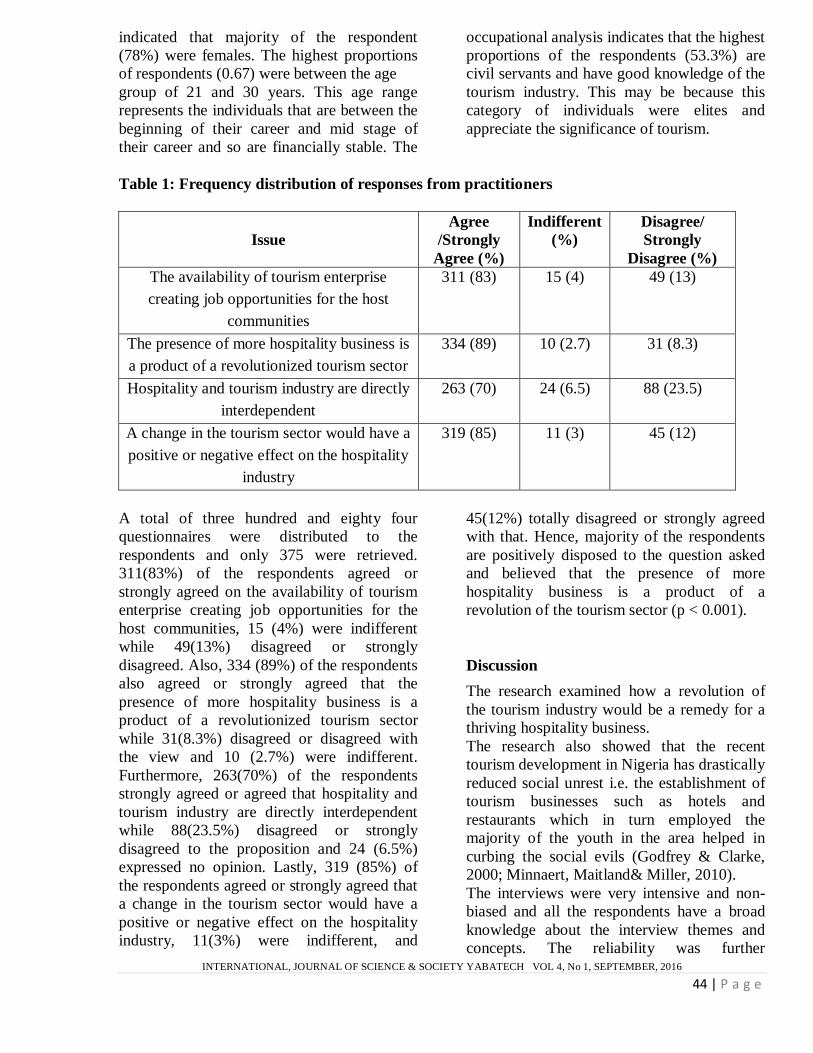
INTERNATIONAL, JOURNAL OF SCIENCE & SOCIETY YABATECH VOL 4, No 1, SEPTEMBER, 2016
44 | P a g e
indicated that majority of the respondent
(78%) were females. The highest proportions
of respondents (0.67) were between the age
group of 21 and 30 years. This age range
represents the individuals that are between the
beginning of their career and mid stage of
their career and so are financially stable. The
occupational analysis indicates that the highest
proportions of the respondents (53.3%) are
civil servants and have good knowledge of the
tourism industry. This may be because this
category of individuals were elites and
appreciate the significance of tourism.
Table 1: Frequency distribution of responses from practitioners
Issue
Agree
/Strongly
Agree (%)
Indifferent
(%)
Disagree/
Strongly
Disagree (%)
The availability of tourism enterprise
creating job opportunities for the host
communities
311 (83) 15 (4) 49 (13)
The presence of more hospitality business is
a product of a revolutionized tourism sector
334 (89) 10 (2.7) 31 (8.3)
Hospitality and tourism industry are directly
interdependent
263 (70) 24 (6.5) 88 (23.5)
A change in the tourism sector would have a
positive or negative effect on the hospitality
industry
319 (85) 11 (3) 45 (12)
A total of three hundred and eighty four
questionnaires were distributed to the
respondents and only 375 were retrieved.
311(83%) of the respondents agreed or
strongly agreed on the availability of tourism
enterprise creating job opportunities for the
host communities, 15 (4%) were indifferent
while 49(13%) disagreed or strongly
disagreed. Also, 334 (89%) of the respondents
also agreed or strongly agreed that the
presence of more hospitality business is a
product of a revolutionized tourism sector
while 31(8.3%) disagreed or disagreed with
the view and 10 (2.7%) were indifferent.
Furthermore, 263(70%) of the respondents
strongly agreed or agreed that hospitality and
tourism industry are directly interdependent
while 88(23.5%) disagreed or strongly
disagreed to the proposition and 24 (6.5%)
expressed no opinion. Lastly, 319 (85%) of
the respondents agreed or strongly agreed that
a change in the tourism sector would have a
positive or negative effect on the hospitality
industry, 11(3%) were indifferent, and
45(12%) totally disagreed or strongly agreed
with that. Hence, majority of the respondents
are positively disposed to the question asked
and believed that the presence of more
hospitality business is a product of a
revolution of the tourism sector (p < 0.001).
Discussion
The research examined how a revolution of
the tourism industry would be a remedy for a
thriving hospitality business.
The research also showed that the recent
tourism development in Nigeria has drastically
reduced social unrest i.e. the establishment of
tourism businesses such as hotels and
restaurants which in turn employed the
majority of the youth in the area helped in
curbing the social evils (Godfrey & Clarke,
2000; Minnaert, Maitland& Miller, 2010).
The interviews were very intensive and non-
biased and all the respondents have a broad
knowledge about the interview themes and
concepts. The reliability was further

INTERNATIONAL, JOURNAL OF SCIENCE & SOCIETY YABATECH VOL 4, No 1, SEPTEMBER, 2016
45 | P a g e
reinforced by accurate personal observation
combined with the raw information gathered
from the interviews. Furthermore, most of the
respondents were tourism experts who have
spent some years in active tourism, hospitality
and environmental research which directly
indicate that information gathered from them
are highly reliable, credible and dependable.
Majority of the respondents have positive
responses relating to the questions asked and
believe that the presence of more hospitality
business is a product of a revolution of the
tourism sector (see table above).
According to the Tourism Master plan, while
the incidence of domestic leisure travel may
be low, the sheer size of Nigeria's population
means that there is a significant contribution
to the demand of tourism services from
domestic travel activity. The revenue value of
this impact is unknown but the sheer number
of Nigerians who travel to Ghana alone for
Easter and Christmas holidays is a pointer to
the lost income from domestic tourism
agreeing with Kotler (2006). Holiday
destinations like Cross River and states with
slave routes need to do more to attract
domestic holiday makers by increasing scale
which will serve to lower cost in the long run
and increasing investments in recreational
infrastructure. Government spending on travel
has also helped to promote the hospitality
sector.
There are prospects for a thriving hospitality
business and a revolutionized tourism
industry. However, the Nigerian tourism
industry has to be well developed for it to be a
panacea for a thriving hospitality business:
The way to increase tourism traffic in Nigeria
is to promote and deepen domestic tourism.
Another way to cause a revolution of the
tourism industry is to encourage members of
the Nigerian diaspora back home for their
holidays. This would cause a boom in the
hospitality business.
Tourism resources in Nigeria should be
properly managed and sustained in other to
meet the standard of the western world, and
for that reason attract resident tourists as well
as foreigners. Once they are attracted, they
will require some of the services provided by
the hospitality industry which would result in
a thriving hospitality business.
REFERENCES
Adebayo W. (2011).Tourism consultant and Sport
Editor, Lagos. Interviewed on the 13th of
January.
Adora, C. U. (2010). Managing tourism in
Nigeria.
Available:hrtp://www.cscanada.net/index.
php/mse/article/vie\vFile/1226/1300.
Accessed on the 28th of March, 2011
African Sun. (2011). Available:
http:\\www.africansunhotels.com/Index.cf
m?fuseaction
^hotels.mfo&name=obudu_mountain_res
ort. Accessed on the 30th of January. 2011
Ateljevic, J., Page S.J. (2009).Tourism and
entrepreneurship International
perspective. Oxford: ElsevierLimited.
Awolaja, K.G. (2010). Management of coastal
area land in Lagos state Nigeria.
Available:
http://www.eres2010.org/contents/papers/i
d203.pdf. Accessed on the 1st of January,
2011
Awosika, L.F. (2001). Development and
protection of Coastal and Marine
Environment in Sub-Sahara Africa.
Report of the Nigeria Integrated Problem
Analysis. Lagos: NIOMR Publication
Barkin D. (2000).Social tourism in rural areas.
Available:http://lasa.international.pitt.edu
/Lasa2000/Barkin.PDF. Accessed on the
4th of January, 2011
Black Sea Scene, (2011) Available at:
http://www.blackseascene.net Accessed
on the 1st of January, 2011

INTERNATIONAL, JOURNAL OF SCIENCE & SOCIETY YABATECH VOL 4, No 1, SEPTEMBER, 2016
46 | P a g e
Cooper, C. et al (2008). Tourism Principal and
Practice.(4thedn.). Essex: Pearson
Education Limited.
George, W, Mair H., Reid, D.G, (2009).Rural
Tourism Development. Localism and
Cultural Change.
Godfrey, K., Clarke, J. (2000).Tourism
development Handbook. London:
Continuum Ltd.
GolafshaniNahid(2003). Understanding
Reliability and Validity in Qualitative
Research.
http://www.leamingdomain.com/MEdHO
ME/QUALITATIVE/Reliab.
VALIDITY.pdf. Accessed on the 1st of
February, 2011
Hall, C.M., Muller, D.K., Saarinen, J. (2009).
Nordic tourism. Issues and Cases. Bristol:
Channel view publication.
Kotler, B.M. (2006). Tourism Marketing for
Cities and Towns. Oxford: Elsevier
Limited.
Last, J. (2001).International epidemiological
association. A dictionary of epidemiology.
(4th edn). New York: Oxford University
Press
Lucas, M. (2007). Tourist attraction in Calabar.
Available:http://www.goodlife.com.ng
/gltourism.php?gltourism=read&id=24
Accessed on the 21st of January, 2011
Middleton V.T.C. et al (2009). Marketing in
Travel and tourism. Oxford: Elsevier Ltd.
Minnaert, L., Maitland, R., Miller, G. (2009).
Available:
http://www.fhaonline.Qrg.ul<yDociiments
/Prog09MinnaertLongSynopsis
0.05Mb.pdf. Accessed on the 3rd of May,
2011.
Misiura Shashi (2006).Heritage Marketing.
Cornwall: MPG Books Limited
Morrison, A., Rimmington, M., Williams, C.
(1999).Entrepreneurship in hospitality,
Tourism and leisure industries. Oxford:
Butterworth-Heinemann
Motherland Nigeria, Tourist Attractions, (2002).
http://www.motherlandnigeria.com/tourist
.html. Accessed on the 25 of December,
2010
Next, Timbuktu Media, (2009). Available:
http ://23 4next. com/csp/cms/sites/Next/
Artsand Culture/Travel/5 390326-
147/Argungufestival_renews
itself__.csp.Accessed on the1st of
January, 2011

INTERNATIONAL, JOURNAL OF SCIENCE & SOCIETY YABATECH VOL 4, No 1, SEPTEMBER, 2016
47 | P a g e
PHYTOCHEMICAL AND GCMS ANALYSES OF MEDICINAL PROPERTIES OF
ETHANOL EXTRACT OF Gossypium barbadense LEAVES
Jokotagba O,A1, Onasanya S,S
2, Siyanbola T,O
3.
1Department of Science Laboratory Technology, Abraham Adesanya Polytechnic, Ijebu-Igbo, Ogun
State. 2Department of Pharmaceutical Technology, Moshood Abiola Polytechnic, Abeokuta, Ogun State.
3Department of Chemistry, Covenant University, Ota, Ogun State
Corresponding Author: [email protected], 08034433399
ABSTRACT
Medicinal plants are sources of important
therapeutic aids for alleviating human ailments.
The traditional use of medicinal plants leaf
extract for diseases is quite common in
developing countries like Nigeria. This research
work is carried out to analyze major bioactive
compounds present in the leaf extract of
Gossypium barbadense. The Phytochemical
analysis carried out indicated the presence of
Terpenoids, Steroids, Saponins, Cardiac
Glycosides and Flavanoids while the Gas
Chromatography-Mass Spectrometer Analysis
indicated twenty-eight compounds which
possess many biological properties among
which are Squalene(4.43%), Phytol(17.38%)
and 9,12,15-Octadecatrienoic acid, methyl ester,
(Z,Z,Z) (13.34%). The presence of some of
these constituents in the plant extract may be
responsible for the antimicrobial, anti-tumor,
and antioxidant properties of the leaf. Therefore,
the leaf is a good source of active
phytochemicals and can be used for clinical
trials which may produce positive results in
future.
Key words: Medicinal Anti-microbial
Gossypium barbadense
Phytotherapy
INTRODUCTION
Traditional medicine is “the knowledge, skills
and practices based on the theories, beliefs and
experiences indigenous to different cultures,
used in the maintenance of health and in the
prevention, diagnosis, improvement
or treatment of physical and mental illness”
(WHO, 2010). There are many different systems
of traditional medicine, and the philosophy and
practices of each are influenced by the
prevailing conditions, environment, and
geographic area within which it first evolved
(WHO, 2005), however, a common philosophy
is a holistic approach to life, equilibrium of the
mind, body, and the environment, and an
emphasis on health rather than on disease.
Generally, the focus is on the overall condition
of the individual, rather than on the particular
ailment or disease from which the patient is
suffering, and the use of herbs is a core part of
all systems of traditional medicine.
(Engebretson 2002; Conboy et al. 2007),
Over the past 100 years, the development and
mass production of chemically synthesized
drugs have revolutionized health care in most
parts of the word. However, large sections of
the population in developing countries still rely
on traditional practitioners and herbal medicines
for their primary care. In Africa up to 90% and
in India 70% of the population depend on
traditional medicine to help meet their health
care needs. In China, traditional medicine
accounts for around 40% of all health care
delivered and more than 90% of general
hospitals in China have units for traditional
medicine (WHO, 2005).
Gossypium barbadense commonly called
Cotton is the most important group of fibre
plants in the world. The main fibres of cotton

INTERNATIONAL, JOURNAL OF SCIENCE & SOCIETY YABATECH VOL 4, No 1, SEPTEMBER, 2016
48 | P a g e
plants are the longer seed hairs („lint‟), used for
making yarn to be woven into textile fabrics,
alone or in combination with other plant, animal
or synthetic fibres. Cotton lint is also made into
other products including sewing thread, cordage
and fishing nets. The lint of Gossypium
barbadense is especially valued for use in high-
quality textiles, luxury fabrics, yarns and sewing
thread. (Todou and Konsala, 2011).
Gossypium barbadense is widely used in
African traditional medicine. In West Africa
countries like Nigeria, Côte d‟Ivoire, Senegal
and Benin a leaf infusion is used as eyewash for
the treatment of eye affections and wound
dressing. In Mali the leaf juice diluted with
water is used as eye drops for the treatment of
conjunctivitis. The leaf juice is taken for the
treatment of cough, dystocia and vertigo, and a
decoction of the leaves with those of Pergularia
daemiais taken against convulsions. In
Cameroon a leaf decoction is taken for the
treatment of jaundice, pounded leaves are used
in poultices against stomach-ache and
constipation, and seed oil is used against otitis.
In Gabon, the leaf maceration is taken against
gonorrhoea and as an emetic, while the sap is
considered emollient and externally applied
against itch. In Congo the leaf sap is instilled in
the ear for the treatment of otitis, leaf
decoctions are drunk against cough, the leaf is
rubbed on the body to cure scabies. The leaf
infusion is usually drunk for the treatment of
colds, bronchitis, rheumatism and
haemorrhoids. It is also kept in the mouth to
treat dental caries and gingivitis. Pounded
leaves are applied on cuts, abscesses and used
for the treatment of leprosy. Pulped young
shoots are used against palpitations, and the
fibre in dressings on wounds. In Kenya the lint
is used as dressing on sores. (Todou and
Konsala, 2011).
In recent times, there has been an urgent need to
develop safer and less expensive drugs for the
treatment of various ailments. Hence, there is a
growing interest in the pharmacological
evaluation of various plants used in traditional
systems of medicine. This research work is
therefore carried out to elucidate the chemical
composition of Gossypium barbadense to reveal
its therapeutic properties which can be utilized
in the development of modern drugs.
MATERIALS AND METHODS
Fresh leaves of Gossypium barbadense obtained
from owu-ikija area in ogun state, Nigeria were
cut and washed with water to remove all
contaminants after being identified and
authenticated at the department of Plant Science
and Animal Physiology, Olabisi Onabanjo
University, Ogun State. They were air dried
under room temperature and ground to powder.
The powdered leaves were extracted with
ethanol using soxhlet extractor.
Phytochemical Screening:
Phytochemical compositions of the leaves were
determined using the methods variously
described by Trease and Evans (1996) and
Sofowora (1993).
Gas Chromatography Mass Spectrometer
(GC-MS) Analysis.
The plant powder was extracted with ethanol
and analyzed using GC-MS analyzer. The data
were obtained on an Elite-1(100% Dimethyl
poly siloxane) column (300.25mm 1umdf).
Helium (99.999%) was used as the carrier gas
with flow rate of 1ml/min in split mode (10:1).
An aliquot of 2ul of ethanol solution of sample
was injected into the column with the injector
temperature at 250o
C.GC oven temperature
stared at 110oC and holding for 2mins and it
was raised to 200oC at
the rate of 10oc/min, without holding. Holding
was allowed at 280oc for 9mins with program
rate of 5oc/min. The injector and detector was
temperature was set at 250oc and 280
oc
respectively. Ion source temperature was
maintained at 200oc. The mass spectrum of
compounds in sample was obtained by electron
ionization at 70ev and the detector was operate
in scan mode from 45-
459amu (atomic mass units). A scan interval of
0.5seconds and fragment from 45to 450 Da was
aintained. The total running time was 27
minutes.

INTERNATIONAL, JOURNAL OF SCIENCE & SOCIETY YABATECH VOL 4, No 1, SEPTEMBER, 2016
49 | P a g e
RESULT AND DISCUSSION
Table 1: Phytochemical Analysis of the ethanolic Extract of Gossypium barbadense Leaves
Tannins _
Saponins +
Flavonoid +
Alkaloids _
Steroids +
Glycosides _
Cardiac glycoside +
Terpenoids +
Key. + present - Absent
6.00 8.00 10.00 12.00 14.00 16.00 18.00 20.00 22.00 24.00 26.000
20000
40000
60000
80000
100000
120000
140000
160000
180000
200000
220000
240000
260000
280000
300000
320000
340000
360000
380000
Time-->
Abundance
TIC: gossysum b.D\data.ms
12.333
13.252
14.613
14.755
15.745
17.013
18.171
18.302
18.649
18.76818.863
18.92919.288
20.07120.220
20.329
20.668
21.370
21.502
21.55221.591
21.753
21.810
21.99722.702
24.174
24.228
26.190
Figure 1: GC-MS Spectra of ethanolic extract Gossypium barbadense
The spectra of the Gas chromatography-mass
spectroscopy analysis of the ethanolic extract
of Gossypium barbadense leaves is as shown
in figure 1 above. Twenty five bioactive
compounds were identified in ethanolic
extract of Gossypium barbadense leaves. The
identification of these compounds is based on
the Peak Area (%), Retention time (RT),
Molecular weight (MW), Molecular formular.
The highest peak area(%) of 17.38 was
obtained by Phytol with Retention time 21.372
and Lowest peak area (%) of 0.61 was
obtained by Tetradecyl-Oxirane with
Retention time 19.289.

INTERNATIONAL, JOURNAL OF SCIENCE & SOCIETY YABATECH VOL 4, No 1, SEPTEMBER, 2016
50 | P a g e
Table 2: Phytochemical component identified in the ethanolic leaf extract of
Gossypium barbadense by GC-MS
S/N RT Name of Compound Molecular
Formular
MW Peak
Area %
1 12.331 1,7-Octadiene, 2,7-dimethyl-3,6-
bis(methylene)-
C12 H18 162.27 5.23
2 13.252 .alpha.-Caryophyllene C15 H24 204.35 2.08
3 14.614
(Z,Z)-.alpha.-Farnesene C15 H24 204.35 2.44
4 14.757 Benzene, 1,4-diethyl C10 H14 134.22 0.61
5 15.747 1,3,6-Octatriene, 3,7-dimethyl-,
(Z)-
C10 H16 136.23 1.45
6 17.011 Bicyclo[3.1.1]hept-2-
ene,2,6dimethyl-6-(4-methyl-3-
pentenyl)-
C15 H24 204.35 13.70
7 18.173 Cyclopentene, 1-(1-methylethyl)- C8 H14 110.19 1.25
8 18.305 3-Decen-2-one,3-methyl- C11H20O 168.28 1.54
9 18.648 1,1,3-Trimethyl-1-silacyclo-3-
pentene C7 H14Si
126.27 3.29
10 18.768 1,1,1,5,7,7,7-Heptamethyl-3,3-bis
(trimethylsiloxy)tetrasiloxane
C13 H40O5Si6
444.97 0.83
11 18.865 Bicyclo[3.1.1]heptane, 2,6,6-
trimethyl-
C10 H18 138.25 1.08
12 18.928 Oxirane,[(hexadecyloxy)methyl]- C19 H38O2 298.00 0.77
13 19.289 Oxirane, tetradecyl- C16 H32O 240.42 0.61
14 20.073 Phthalic acid, 5-methylhex-2-yl
heptadecyl ester
C32 H54O4
502.77 1.71
15 20.221 3-Isopropoxy-1,1,1,7,7,7-
hexamethyl
tris(trimethylsiloxy)tetra siloxane
C18 H52O7Si7
577.20 1.04
16 20.330 Hexadecanoic acid, ethyl ester C18 H36O2 286.00 10.01
17 20.668 1,6,10,14-Hexadecatetraen-3-ol, 3,
C20 H34O
7,11,15-tetramethyl-, (E,E)-
290.48 0.69
18 21.372 Phytol C20 H40O 296.00 17.38
19 21.503 3-Isopropoxy-1,1,1,7,7,7-
hexamethyl-
3,5,5-tris(trimethylsiloxy)tetra
siloxane
C18 H52O7Si7
577.00 1.68
20 21.555 1-Tetradecyne C14 H28 196.00 0.87

INTERNATIONAL, JOURNAL OF SCIENCE & SOCIETY YABATECH VOL 4, No 1, SEPTEMBER, 2016
51 | P a g e
21 21.589 1-Methyl-2-methylenecyclohexane C8 H14 110.00 1.90
22 21.755 9,12-Octadecadienoic acid, methyl
ester,(E,E)-
C19H34O2
294.00 3.14
23 21.812 9,12,15-Octadecatrienoic acid,
methyl ester, (Z,Z,Z)-
C19H32O2
292.46 13.34
24 21.995 Octadecanoic acid, ethyl ester C20H40O2 312.53 1.49
25 24.227 Squalene C30H50 410.00 4.43
DISCUSSION
Plants have provided mankind a large variety
of potent drugs to alleviate suffering from
diseases in spite of spectacular advances in
synthetic drugs in recent years; some of the
drugs of plant origin have still retained their
importance.
The results obtained for the phytochemicals
screening and the Gas chromatography- Mass
spectrometer analysis of Gossypium
barbadense are depicted in table 1 and table 2
above. The result obtained from the
phytochemical screening shows the presence
of Saponins, Flavonoid, Steroids, Cardiac
Glycosides, and Terpenoids while the GC-MS
analysis revealed the presence of twenty-five
compounds which possess many bioactive
properties. Phytol which is the major
constituent among the twenty-eight
compounds of this present possess some
medicinal properties. Okiei et al., (2009);
Kumar and Basu (1994) have suggested that
phytol would be effective as an anti-
inflammatory agent in such parts of the human
anatomy. A concluding remark in the study
states that reactive oxygen species-promoting
substances such as phytol constitute a
promising novel class of pharmaceuticals for
the treatment of rheumatoid arthritis and
possibly other chronic inflammatory diseases.
It is therefore possible to infer that phytol and
its isomers maybe the therapeutic constituent
in the essential oil useful for the management
of asthma.
Hexadanoic acid, ethyl ester, 9,12,15-
Octadecatrienoic acid, methyl ester,
Squalene,1-tetradecyne, 1-Methyl-2-
methylenecyclohexane,
Bicyclo[3.1.1]heptane, 2,6,6-trimethyl have
been reported effective as an anti
inflammatory, antioxidant, antibacterial, anti
tumor, cancer preventive, hepatoprotective,
nematicide, insectifuge, antihistaminic,
antieczemic, antiacne, antiandrogenic and
antiarthritic. (Devi and Muthu, 2014; Banu
and Nagarajan, 2013).
During the past few years, squalene was found
by some Researchers to have
shownantioxidant and protective activities
against several carcinogens. (Gunes ,2013;
Kelly 1999)
Experimental studies have shown that
squalene can effectively be utilized in
cosmetics dermatology. (Zih-Rou et al.,
2009).
In conclusion, ethanolic extract of
G.barbadense leaves can be useful medically
as an anti-inflammatory, antiezemic, anti
tumor and cancer preventive agent. Therefore,
leaves of Gossypium barbadense are good
source of active phytochemicals and can be
employed for clinical trials which may
generate successful results in future

INTERNATIONAL, JOURNAL OF SCIENCE & SOCIETY YABATECH VOL 4, No 1, SEPTEMBER, 2016
52 | P a g e
REFERENCES
Banu, H.R., Nagarajan, N. (2013). GC-MS
determination of bioactive components
of Wedelia chinensis (Osbeck) Merrill
J. Chem. Pharm. Res., 5(4):279-285
Conboy L., Kaptchuck T.J., Eisenberg ,M.,
Gottlieb B., Acevedo-Garcia D.
(2007). The Relationship between
social factors and attitudes toward
conventional and CAM practioners.
Complement Ther Clin Pract. 13:146-
157.
Devi J.A., Muthu K.A. (2014). Gas
chromatography-mass spectrometry
analysis of bioactive constituents in the
ethanolic extract of saccharum
spontaneum linn , international journal
of Pharmacy and Pharmaceutical
Sciences Vol 6, suppl 2:755-759.
Engebretson J. (2002). Culture and
complementary therapies.Complement
Ther Nurs Midwifery; 8(4): 177-184.
Güneş F.E. (2013). Medical use of squalene as
a natural antioxidant. Journal of
Marmara University Institute of
Health Sciences, 3 (4): 220-228.
Kelly G.S. (1999). Squalene And Its Potential
Clinical Uses Alternative Medicine
Review Volume 4, Number 1: 29-36.
Kumar L., Basu N,. (1994). Anti inflammatory
activity of the latex of Calotropis
procera. J. Ethnopharmacol44: 123–
125.
Okiei W., Ogunlesi M., Azeez L., Obakachi
V., Osunsami M., Nkenchor G. (2009).
The voltammetric and titrimetric
determination of ascorbic acid levels in
tropical fruit samples. Int. J.
Electrochem. Sci., 4: 276-287.
Sofowora A. (1993). Medicinal Plants and
Traditional Medicine in Africa.
Spectrum Books Ltd., Ibadan, Nigeria,
pp. 191-289.
Todou G., Konsala S. (2011). Gossypium
barbadense L. PROTA (Plant
Resources of Tropical
Africa / Ressources végétales de
l‟Afrique tropicale), Wageningen,
Netherlands.
http://www.prota4u.org/search.asp.
Trease G.E., Evans W.C. (1996). Trease&
Evans' Pharmacognosy, 14th edition,
WB Sounders, USA, p. 820-835.
World Health Organization. (2005). National
Policy on Traditional Medicine and
Regulation of
Herbal Medicines. Geneva: Report of
WHO global survey.
http://apps.who.int/iris/bitstream/10665/
43229/1/9241593237.pdf
World Health Organization. (2010). “Traditio
nal Medicine.” http://www
.who.int/topics/traditional_medicine/en/
Zih-Rou H., Yin-Ku L., Jia-You F. (2009).
Biological and Pharmacological
Activities of Squalene and Related
Compounds: Potential Uses in
Cosmetic DermatologyMolecules,14:
540-554.