volume 43 • issue 18 • 28 september 2016 • pages 9369–10,020
TRANSCRIPT

Volume 43 • Issue 18 • 28 September 2016 • Pages 9369– 10,020

MyShake: Initial observations from a globalsmartphone seismic networkQingkai Kong1, Richard M. Allen1, and Louis Schreier2
1Berkeley Seismological Laboratory, University of California, Berkeley, California, USA, 2Deutsche Telekom Silicon ValleyInnovation Center, Mountain View, California, USA
Abstract MyShake is a global smartphone seismic network that harnesses the power of crowdsourcing. Inthe first 6months since the release of the MyShake app, there were almost 200,000 downloads. On a typicalday about 8000 phones provide acceleration waveform data to the MyShake archive. The on-phone app candetect and trigger on P waves and is capable of recording magnitude 2.5 and larger events. More than 200seismic events have been recorded so far, including events in Chile, Argentina, Mexico, Morocco, Nepal, NewZealand, Taiwan, Japan, and across North America. The largest number of waveforms from a singleearthquake to date comes from the M5.2 Borrego Springs earthquake in Southern California, for whichMyShake collected 103 useful three-component waveforms. The network continues to grow with newdownloads from the Google Play store everyday and expands rapidly when public interest in earthquakespeaks such as during an earthquake sequence.
1. Introduction
Since the introduction of low-cost accelerometers in consumer devices such as cars and computers, seismol-ogists have been experimenting with how these sensors might contribute to the science of seismology andhazard reduction [Allen, 2007; Cochran et al., 2009b; Fleming et al., 2009; Chung et al., 2011; Clayton et al., 2011,2015; Wu et al., 2016, 2013; Evans et al., 2014; Wu and Lin, 2014; Wu, 2015]. While these devices have signifi-cantly lower price tags than traditional seismic stations, the data are of lower quality and the operation of net-works of low-cost devices is complex and not necessarily low cost. Various types of lower cost sensornetworks have been explored with varying degrees of success [e.g., Allen, 2012]. At the higher-quality endof the spectrum, the U.S. Geological Survey NetQuakes devices include a high-quality microelectromechani-cal system (MEMS) accelerometer in a station package that is installed by engineers in household basementsand makes use of the in-home WiFi [Luetgert et al., 2009, 2010]. Other efforts have made use of USB acceler-ometers attached to personal computers or low-cost computers as with the Community Seismic Network[Clayton et al., 2011, 2015; Kohler et al., 2013] and Quake Catcher Network [Cochran et al., 2009a, 2009b;Chung et al., 2011; Lawrence et al., 2014]. In all these cases hardware must be transported from the networkoperator to a station host. Both hardware and software must then be installed and maintained for the stationand network to continue to function.
The advantage of using smartphones is that all the hardware is already packaged in a device that is ubiqui-tous in urban environments around the world. In addition, convenient software distribution and mainte-nance platforms exist in the form of the Google Play and iTunes stores and the associated softwaredevelopment kits. The disadvantages of smartphones as seismic sensors are also obvious: the phones arenot fixed, phone resources are not tailored for seismology, recording earthquakes is not typically a priorityfor owners, the phones experience all kinds of motions that have nothing to do with earthquakes, and rapidfull waveform data recovery may present challenges.
Multiple efforts are underway using smartphones to detect earthquakes. Bossu et al. [2015, 2016] describe thecollection of quick eye-witness reports from people within a few tens of minutes after a felt-earthquakeoccurrence. Multiple efforts make use of the accelerometer. In some cases, a “trigger” message is generatedand sent to a central server when a phone moves [Faulkner et al., 2011; Olson et al., 2011; Finazzi, 2016]; inothers phones are used in a dedicated way to record earthquake shaking by attaching them to walls or otherstructures and recording continuously [Naito et al., 2013]. The GPS/Global Navigation Satellite Systems sensoron the phone can also be used to detect ground motion when the motion is sufficiently large [Minson et al.,2015]. MyShake attempts to combine all of these elements by turning a typical personal smartphone into a
KONG ET AL. OBSERVATIONS FROM MYSHAKE 9588
PUBLICATIONSGeophysical Research Letters
RESEARCH LETTER10.1002/2016GL070955
Key Points:• First global seismic networkharnessing personal smartphonesnow providing accelerationwaveforms
• On-phone earthquake detectionalgorithm is triggering on magnitude2.5 and greater earthquakes
• Two hundred thousand phones havedownloaded the MyShake appproviding seismic waveform data fromsix continents
Supporting Information:• Supporting Information S1
Correspondence to:Q. Kong,[email protected]
Citation:Kong, Q., R. M. Allen, and L. Schreier(2016), MyShake: Initial observationsfrom a global smartphone seismic net-work, Geophys. Res. Lett., 43, 9588–9594,doi:10.1002/2016GL070955.
Received 22 AUG 2016Accepted 8 SEP 2016Accepted article online 10 SEP 2016Published online 29 SEP 2016
©2016. American Geophysical Union.All Rights Reserved.

seismometer. The MyShake app has a filter to distinguish earthquakes from other human activities; it uploadsearthquake triggers to a real-time server for analysis and also uploads the acceleration time series data to aserver for further research analysis [Kong et al., 2016].
This paper presents initial observations from the seismic data recorded by MyShake since the public releasein February 2016. We detail the rapid expansion to a global seismic network recording earthquakes across sixcontinents and show that smartphone sensors are capable of recording seismic events with magnitude 2.5and larger. For larger earthquakes, these sensors can record the entire wave train starting from P wave.Previous shake-table tests have assessed the quality of the smartphone waveform data [Dashti et al., 2011,2012; Reilly et al., 2013; D’Alessandro and D’Anna, 2013; Kong et al., 2016]; here we compare smartphonerecordings in the field to nearby traditional seismic stations. Finally, we examine the potential for MyShaketo provide seismic data in many regions where there are little or no traditional seismic stations such asNepal and Ecuador and where seismicity is a relatively new phenomenon like Oklahoma.
2. MyShake Methodology
MyShake was developed on the android platform as an application to monitor the accelerometers inside thesmartphones. The motion of the smartphones is summarized into three key parameters that feed into anArtificial Neural Network (ANN), which has been trained to distinguish earthquakes from human activities.Once the ANN algorithm detects an earthquake-like motion, the app will send a message in real time tothe server. This message, which contains location, time, and amplitude of the trigger, can be used for earth-quake early warning or other types of rapid detection applications. At the same time, the app collects three-component acceleration time series data, at 25Hz. The waveform data have a duration of 5min, including1min before and 4min after the trigger. The 1min of data before the trigger ensures that the entire earth-quake waveform is recorded even when the phone only triggers on a later phase of the ground motion.When the phone is connected to WiFi and power, the waveform recordings are uploaded to the server forfurther analysis. For more details about the app and methodology, see Kong et al. [2016].
Since MyShake was released publicly on 12 February 2016 in the Google Play store, there have been almost200,000 downloads and the app is presently installed on 36,000 phones distributed across six continents(numbers from Google Play Store). Figure 1a shows the global distribution of all phones registered withthe system. The number of phones contributing shows peaks in North America and some other places whereearthquake hazard is high including Nepal and India. On a typical day between 8000 and 10,000 phonesprovide data to the system (see Figure S1 in the supporting information).
3. Seismic Data Recorded by MyShake
As of 11 August 2016, MyShake has recorded 237 earthquakes from M2.5 to M7.8 around the globe sincereleased to the public (“recorded earthquakes” are defined as having at least one good smartphone-recordedearthquake waveform sent back to the server and confirmed by a seismologist). Figure 1b shows the distri-bution of the recorded earthquakes and includes regions with good seismic network coverage like theU.S., Taiwan, Japan, and Chile and also areas without dense networks, such as Nepal and Ecuador. Not surpris-ingly, locations with higher density of MyShake users, like California, have a larger number of earthquakedetections. This is due to the higher density of users closer to the epicenter. Example waveforms from aroundthe world are included in Figure S2. Not only shallow but also large deep earthquakes have been detected byMyShake. These are shown by the warmer color circles in the Figure 1b. The distribution of the magnitudeand depth of the recorded earthquakes can be found in Figure S3.
The earthquake which has generated the most waveforms to date is theM5.2 earthquake that occurred nearBorrego Springs in Southern California on 10 June 2016 at 08:04:38 UTC. Figure 2a shows the status and per-formance of the MyShake network at the time of the event. The green dots show the locations of the phonesthat triggered on the earthquake ground motion using the ANN algorithm on each phone. The orange dotsare the phones that were “ready”; i.e., they were monitoring the accelerometer to detect an earthquake butdid not trigger on this event. The red dots show other MyShake phones that were in communication with thenetwork but were not monitoring for an earthquake at the time of the event. Not surprisingly, the percentageof phones that triggered on the event decreases with increasing epicentral distance as the amplitude of theground motion decreases.
Geophysical Research Letters 10.1002/2016GL070955
KONG ET AL. OBSERVATIONS FROM MYSHAKE 9589

Figure 1. Distribution of MyShake registered users and detected earthquakes. (a) Registered MyShake users are shown in clusters. The number in each circle indi-cates the number of registered users in the cluster, and the color of the circle shows the order of the number of phones; i.e., a purple circle indicates that thenumber of phones is of order tens of thousands, magenta is thousands, red is hundreds, yellow is tens, and blue for less than 10. (b) The 237 earthquakes recorded byMyShake users since 12 February 2016. The locations of the earthquakes are shown as circles, which are color coded by the depth and whose sizes are scaled by themagnitude of the earthquake. Figures are generated on 11 August 2016.
Geophysical Research Letters 10.1002/2016GL070955
KONG ET AL. OBSERVATIONS FROM MYSHAKE 9590
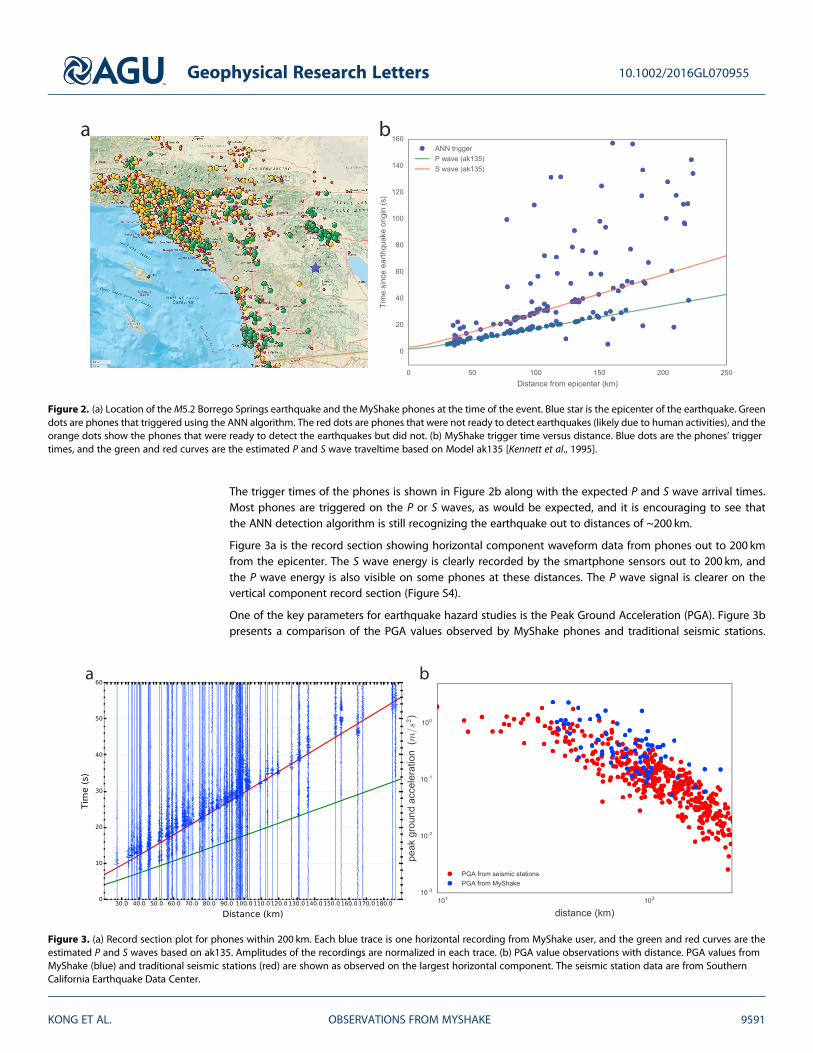
The trigger times of the phones is shown in Figure 2b along with the expected P and S wave arrival times.Most phones are triggered on the P or S waves, as would be expected, and it is encouraging to see thatthe ANN detection algorithm is still recognizing the earthquake out to distances of ~200 km.
Figure 3a is the record section showing horizontal component waveform data from phones out to 200 kmfrom the epicenter. The S wave energy is clearly recorded by the smartphone sensors out to 200 km, andthe P wave energy is also visible on some phones at these distances. The P wave signal is clearer on thevertical component record section (Figure S4).
One of the key parameters for earthquake hazard studies is the Peak Ground Acceleration (PGA). Figure 3bpresents a comparison of the PGA values observed by MyShake phones and traditional seismic stations.
Figure 2. (a) Location of theM5.2 Borrego Springs earthquake and the MyShake phones at the time of the event. Blue star is the epicenter of the earthquake. Greendots are phones that triggered using the ANN algorithm. The red dots are phones that were not ready to detect earthquakes (likely due to human activities), and theorange dots show the phones that were ready to detect the earthquakes but did not. (b) MyShake trigger time versus distance. Blue dots are the phones’ triggertimes, and the green and red curves are the estimated P and S wave traveltime based on Model ak135 [Kennett et al., 1995].
Figure 3. (a) Record section plot for phones within 200 km. Each blue trace is one horizontal recording from MyShake user, and the green and red curves are theestimated P and S waves based on ak135. Amplitudes of the recordings are normalized in each trace. (b) PGA value observations with distance. PGA values fromMyShake (blue) and traditional seismic stations (red) are shown as observed on the largest horizontal component. The seismic station data are from SouthernCalifornia Earthquake Data Center.
Geophysical Research Letters 10.1002/2016GL070955
KONG ET AL. OBSERVATIONS FROM MYSHAKE 9591

While the values are similar and show the same trend with epicentral distance, the ratio of the PGA valuesfrom the phones to that of the nearest seismic station is 2.0. Figure S5a shows a histogram of PGAdifference between MyShake recordings and the closest traditional seismic station. This may reflect the factthat the phones are in buildings and on tables rather than being free field sites as with most traditionalstations. It may also reflect the fact that most people (and their phones) live in basin locations and onsediments leading to amplification effects. Figure S5b shows a comparison of the occurrence time of thePGA value on MyShake recordings and traditional seismic stations showing correlation with the S wavearrivals. Figures 4a and 4b show comparisons of the waveforms recorded on a smartphone and a nearbytraditional seismic station. It shows good agreement between the waveforms (they are separated by1–2 km) but also shows that the PGA is greater on the phone records. For other components comparisonssee Figures S6 and S7.
The other recorded earthquakes typically have far fewer waveforms than the Borrego Springs earthquakes,because of lower density of MyShake phones. The largest earthquake recorded to date is the M7.8 16 April2016 Ecuador earthquake. In this event two phones triggered at distances of 170 and 200 km (the locationof the phones and earthquake is shown in Figure S8a). Figure 4c is the waveform record at 170 km and showsthat the phone triggered on the Pwave arrival even at this great distance. Shortly following the Swave arrival,there is a very large acceleration likely due to the phone owner picking up the phone (see the whole wave-form in Figure S8b).
MyShake has also recorded multiple earthquakes in Oklahoma. Figure 4d is one example from the 13February 2016M5.1 event recorded at a phone 130.5 km away. While the individual counts are clearly visiblein the record, the phone still triggered on the Pwave arrival. Figure S9 shows the map of this earthquake andthe waveforms for the three components. Additional examples of Pwave recordings are shown in Figure S10illustrating that P wave arrivals are typically recorded out to ~100 km for M5 and larger events. Figure S2shows some more examples of recordings from other regions.
Figure 4. Example MyShake waveforms. (a and b) Comparison of the waveforms recorded by MyShake and a nearby traditional seismic station (horizontal compo-nent) for the M5.2 Borrego Springs earthquake. Figure 4a shows MyShake waveform recorded 37.2 km from the epicenter and a traditional seismic station 0.88 kmfrom the smartphone. Figure 4b shows MyShake waveform recorded at 100.9 km from the epicenter and a traditional seismic station 1.93 km from the smartphone.See Figures S6 and S7 for the comparison of other components. (c) M7.8 Ecuador earthquake recorded at 170 km away from epicenter. (d) M5.1 Oklahomaearthquake recorded by a phone at 130 km from epicenter. For Figures 4c and 4d the zero time is the phone trigger time. The vertical black, green, and red lines arethe origin time and predicted P and S wave arrival times, respectively (estimated using ak135 model).
Geophysical Research Letters 10.1002/2016GL070955
KONG ET AL. OBSERVATIONS FROM MYSHAKE 9592

4. Discussion and Conclusions
Based on the data recorded by the MyShake network during the first 6months of operation, the MyShakeapproach of using personal smartphones has the clear potential to provide data useful for multiple seismo-logical studies and hazard reduction efforts. It is remarkable how quickly the network has grown, primarilydriven by news media and citizen scientist interest in the project. While technical challenges still remain,and there are opportunities to improve the data quality through further improvements in the on-phoneapp, the network is already collecting a substantial volume of earthquake time series. MyShake has alreadyprovided data from many earthquake-prone areas, including the U.S., Nepal, Chile, Japan, Taiwan, andNew Zealand.
The MyShake data are of sufficient quality to be useful in many types of scientific and hazard reductionprojects. The data collected show that the full seismic waveform (P wave, S wave, and surface waves) canbe recorded with a high signal-to-noise ratio at distances in excess of 100 km for earthquakes of magnitude5 and larger (see examples in Figures S11 and S12). It can also provide peak ground motion information formuch smaller earthquakes; a M2.5 earthquake is the smallest detected to date. The network can provide avery dense array of stations across urban centers if deployed on enough phones, providing a perhaps unpre-cedented opportunity for full wavefield analysis. The network can also be used for more traditional seismicstudies as it can be used to detect, locate, and estimate the magnitude of earthquakes in regions that havefew or no seismic stations. Microzonation peak ground motion maps can also easily be generated from thedata. These mapsmay also have a third dimension when arrays of phones also provide observations onmulti-ple floors of high-rise buildings. More events with large numbers of observations are needed to fully under-stand the potential uses of these data.
The rapid expansion of the network and the large number of recordings are all possible because we harness aubiquitous hardware/software package: android smartphones. While the sensor network therefore alreadyexists—it is estimated that there are over 1 billion worldwide—the challenge is in reaching enough sensorowners and persuading them to run MyShake. MyShake must therefore minimize any interference with otherphone functions. This means that the applications must run in the background and consume as little poweras possible. We must also provide the owner with some value. The current version of the app has a userinterface that provides basic information about “recent” (past week) earthquakes as many other apps do.In addition, there is some educational material with information about past earthquakes including videosillustrating the intensity of shaking at the users’ location in those past earthquakes and information onhow to be earthquake safe. Finally, users are participating in a citizen science project whereby they arehelping to develop and test the MyShake network. Over the coming months and years substantial effort willbe needed to maintain and grow the number of users.
One key objective is also to use the network to deliver earthquake alerts as described by Kong et al. [2016].This is not only the right thing to do as it will reduce the impact of earthquakes on MyShake participants,but it is also important for MyShake to provide this service in order to increase that value of the app to phoneowners and thereby increase the number of phones running MyShake and recording earthquakes. The factthat we can clearly detect Pwave arrivals with MyShake will allow the application of Pwave-based methodol-ogies for early warning as are currently employed by traditional seismic networks running early warningsystems [Allen et al., 2009].
Perhaps the most important conclusion is that MyShake has demonstrated the potential to collect seismicwaveform data of similar density and useful quality to what we are accustomed to in California, Japan, andthe few other densely instrumented regions. The network can provide more data in areas with few seismicstations like Nepal, Ecuador, and Haiti, including regions with few stations because significant-risk seismicityis a new phenomenon like Oklahoma and Texas.
ReferencesAllen, R. M. (2007), Earthquake hazard mitigation: New directions and opportunities, in Treatise on Geophysics, vol. 4, pp. 593–625, edited by
G. Schubert, Elsevier, Amsterdam.Allen, R. M. (2012), Transforming earthquake detection?, Science, 335(6066), 297–298, doi:10.1126/science.1214650.Allen, R. M., P. Gasparini, O. Kamigaichi, and M. Bose (2009), The status of earthquake early warning around the world: An introductory
overview, Seismol. Res. Lett., 80(5), 682–693, doi:10.1785/gssrl.80.5.682.
Geophysical Research Letters 10.1002/2016GL070955
KONG ET AL. OBSERVATIONS FROM MYSHAKE 9593
AcknowledgmentsThe MyShake project is a collaborationbetween Berkeley SeismologicalLaboratory and Deutsche TelecomSilicone Valley Innovation Center. Wethank the MyShake team members:Roman Baumgaertner, SiddarthaPothapragada, Garner Lee, Arno Puder,Pooja Kanchan, Young-Woo Kwon,Stephen Allen, Stephen Thompson,Jennifer Strauss, Doug Neuhauser,Stephane Zuzlewski, and JenniferTaggart for making this work available.Funding for the project is provided bythe Berkeley Seismological Laboratory,Deutsche Telecom, and the Gordon andBetty Moore Foundation through grantGBMF5230 to UC Berkeley. We thankthe Northern California Earthquake DataCenter (doi:10.7932/NCEDC) andSouthern California Earthquake DataCenter (http://scedc.caltech.edu/) forproviding the seismic data. We alsothank Andrew Newman, John Vidale,and one anonymous reviewer for theirhelpful reviews. All the analysis of thisproject is done in Python, particularlythe ObsPy package [Beyreuther et al.,2010; Krischer et al., 2015]. MyShakeproject website is http://myshake.berkeley.edu. Data recorded byMyShake are currently archived atBerkeley Seismological Laboratory andare constrained by the privacy policy ofMyShake (see http://myshake.berkeley.edu/privacy-policy/index.html). Forinformation about access to the data forresearch purposes contact [email protected].

Beyreuther, M., R. Barsch, L. Krischer, T. Megies, Y. Behr, and J. Wassermann (2010), ObsPy: A Python toolbox for seismology, Seismol. Res. Lett.,81(3), 530–533, doi:10.1785/gssrl.81.3.530.
Bossu, R., M. Laurin, G. Mazet-Roux, F. Roussel, and R. Steed (2015), The importance of smartphones as public earthquake-information toolsand tools for the rapid engagement with eyewitnesses: A case study of the 2015 Nepal earthquake sequence, Seismol. Res. Lett., 86(6),1587–1592, doi:10.1785/0220150147.
Bossu, R., R. Steed, G. Mazet-Roux, F. Roussel, C. Etivant, L. Frobert, and S. Godey (2016), The key role of eyewitnesses in rapid impactassessment of global earthquakes, in Earthquakes and Their Impact on Society, pp. 601–618, Springer International, Cham.
Chung, A. I., C. Neighbors, A. Belmonte, M. Miller, H. H. Sepulveda, C. Christensen, R. S. Jakka, E. S. Cochran, and J. F. Lawrence (2011), TheQuake-Catcher Network Rapid Aftershock Mobilization Program following the 2010 M 8.8 Maule, Chile earthquake, Seismol. Res. Lett.,82(4), 526–532, doi:10.1785/gssrl.82.4.526.
Clayton, R. W., et al. (2011), Community seismic network, Ann. Geophys., 54(6), 738–747, doi:10.4401/ag-5269.Clayton, R. W., T. Heaton, M. Kohler, M. Chandy, R. Guy, and J. Bunn (2015), Community seismic network: A dense array to sense earthquake
strong motion, Seismol. Res. Lett., 86(5), 1–10, doi:10.1785/0220150094.Cochran, E., J. Lawrence, C. Christensen, and A. Chung (2009a), A novel strong-motion seismic network for community participation in
earthquake monitoring, IEEE Instrum. Meas. Mag., 12(6), 8–15, doi:10.1109/MIM.2009.5338255.Cochran, E., J. Lawrence, C. Christensen, and R. S. Jakka (2009b), The Quake-Catcher Network: Citizen science expanding seismic horizons,
Seismol. Res. Lett., 80(1), 26–30, doi:10.1785/gssrl.80.1.26.D’Alessandro, A., and G. D’Anna (2013), Suitability of low-cost three-axis MEMS accelerometers in strong-motion seismology: Tests on the
LIS331DLH (iPhone) accelerometer, Bull. Seismol. Soc. Am., 103(5), 2906–2913, doi:10.1785/0120120287.Dashti, S., J. Reilly, and J. Bray (2011), iShake: Using personal devices to deliver rapid semi-qualitative earthquake shaking information.Dashti, S., J. D. Bray, J. Reilly, S. Glaser, and A. Bayen (2012), iShake: Reliability of Phones as Seismic Sensors, in Proceedings of the 15th World
Conference on Earthquake, Engineering, Lisbon, Portugal.Evans, J. R., R. M. Allen, A. I. Chung, E. S. Cochran, R. Guy, M. Hellweg, and J. F. Lawrence (2014), Performance of several low-cost
accelerometers, Seismol. Res. Lett., 85(1), 147–158, doi:10.1785/0220130091.Faulkner, M., M. Olson, R. Chandy, J. Krause, K. M. Chandy, and A. Krause (2011), The next big one: Detecting earthquakes and other rare
events from community-based sensors, Proc. 10th ACM/IEEE Int. Conf. Inf. Process. Sens. Networks, 13–24.Finazzi, F. (2016), The Earthquake Network Project: Toward a srowdsourced smartphone-based earthquake early warning system, Bull.
Seismol. Soc. Am., 106(3), doi:10.1785/0120150354.Fleming, K., M. Picozzi, C. Milkereit, F. Kuhnlenz, B. Lichtblau, J. Fischer, C. Zulfikar, and O. Ozel (2009), The Self-organizing Seismic Early
Warning Information Network (SOSEWIN), Seismol. Res. Lett., 80(5), 755–771, doi:10.1785/gssrl.80.5.755.Kennett, B. L. N., E. R. Engdahl, and R. Buland (1995), Constraints on seismic velocities in the Earth from traveltimes, Geophys. J. Int., 122(1),
108–124, doi:10.1111/j.1365-246X.1995.tb03540.x.Kohler, M. D., T. H. Heaton, and M.-H. Cheng (2013), The community seismic network and quake-catcher network: Enabling structural health
monitoring through instrumentation by community participants, in Proceedings of SPIE 8692, edited by J. P. Lynch, C.-B. Yun, and K.-W.Wang, The International Society for Optical Engineering, Bellingham, Wash.
Kong, Q., R. M. Allen, L. Schreier, and Y.-W. Kwon (2016), MyShake: A smartphone seismic network for earthquake early warning and beyond,Sci. Adv., 2(2 e1501055–e1501055,), doi:10.1126/sciadv.1501055.
Krischer, L., T. Megies, R. Barsch, M. Beyreuther, T. Lecocq, C. Caudron, and J. Wassermann (2015), ObsPy: A bridge for seismology into thescientific Python ecosystem, Comput. Sci. Discov., 8(1 014003,), doi:10.1088/1749-4699/8/1/014003.
Lawrence, J. F., et al. (2014), Rapid earthquake characterization using MEMS accelerometers and volunteer hosts following theM 7.2 Darfield,New Zealand, earthquake, Bull. Seismol. Soc. Am., 104(1), 184–192, doi:10.1785/0120120196.
Luetgert, J. H., J. R. Evans, J. Hamilton, C. R. Hutt, E. G. Jensen, and D. H. Oppenheimer (2009), NetQuakes—A new approach to urbanstrong-motion seismology, Abstract S11B-1707, presented at 2009 Fall Meeting, AGU, San Francisco Calif., 14–18 Dec.
Luetgert, J. H., D. H. Oppenheimer, and J. Hamilton (2010), The NetQuakes project—Research-quality seismic data transmitted via theinternet from citizen-hosted instruments (invited), Am. Geophys. Union, Fall Meet. 2010, Abstr. #S51E-03.
Minson, S. E., B. A. Brooks, C. L. Glennie, J. R. Murray, J. O. Langbein, S. E. Owen, T. H. Heaton, R. A. Iannucci, and D. L. Hauser (2015),Crowdsourced earthquake early warning, Sci. Adv., 1(3), e1500036–e1500036, doi:10.1126/sciadv.1500036.
Naito, S., H. Azuma, S. Senna, M. Yoshizaw, H. Nakamura, K. X. Hao, H. Fujiwara, Y. Hirayama, N. Yuki, and M. Yoshida (2013), Development andtesting of a mobile application for recording and analyzing seismic data, J. Disaster Res., 8(5), 990–1000.
Olson, M., A. Liu, M. Faulkner, and K. Chandy (2011), Rapid detection of rare geospatial events: Earthquake early warning applications, Proc.5th ACM Int. Conf. Distrib. event-based Syst., 89–100, doi:10.1145/2002259.2002276.
Reilly, J., S. Dashti, M. Ervasti, J. D. Bray, S. D. Glaser, and A. M. Bayen (2013), Mobile phones as seismologic sensors: Automating dataextraction for the iShake system, IEEE Trans. Autom. Sci. Eng., 10(2), 242–251, doi:10.1109/TASE.2013.2245121.
Wu, Y., W. Liang, H. Mittal, W. Chao, C. Lin, B. Huang, and C. Lin (2016), Performance of a low-cost earthquake early warning system (P-Alert)during the 2016 ML 6.4 Meinong (Taiwan) earthquake, Seismol. Res. Lett., 87(5), 1050–1059, doi:10.1785/0220160058.
Wu, Y.-M. (2015), Progress on development of an earthquake early warning system using low-cost sensors, Pure Appl. Geophys., 172(9),2343–2351, doi:10.1007/s00024-014-0933-5.
Wu, Y.-M., and T.-L. Lin (2014), A Test of Earthquake Early Warning System Using Low Cost Accelerometer in Hualien, Taiwan, pp. 253–261,Springer, Berlin Heidelberg.
Wu, Y.-M., D.-Y. Chen, T.-L. Lin, C.-Y. Hsieh, T.-L. Chin, W.-Y. Chang, W.-S. Li, and S.-H. Ker (2013), A high-density seismic network for earthquakeearly warning in Taiwan based on low cost sensors, Seismol. Res. Lett., 84(6), 1048–1054, doi:10.1785/0220130085.
Geophysical Research Letters 10.1002/2016GL070955
KONG ET AL. OBSERVATIONS FROM MYSHAKE 9594