volume 45(3) december 2019 - acube
TRANSCRIPT

Volume 45(3) December 2019

Volume 45 (3) December 2019 Bioscene 1
EDITORIAL & GOVERNANCE INFORMATION .............................2
ARTICLES ............................................................................................3
Spanish-language Version of the Science Identity Survey (SISE):
Translation, Cultural Adaptation, and Evaluation……………………………3
Liz Hernandez-Matias, Pablo A. Llerandi-Román, Lizmar Pérez-Donato,
Natalia Calzada-Jorge, Stephanie Mendoza, Faviola Laureano-Torres,
A.Valance Washington, Michelle Borrero
INNOVATIONS
Plant Tracer: A Program to Track and Quantify Plant Movement from
Cellphone Captured Time-Lapse Movies ………………………………….14
Angelica M. Guercio, B.A., Yixiang Mao, M.S., Victor N. D. Carvalho,
M.S., Jiazhen Zhang, B.S., Changyuan Li, M.S., Zheng Ren, M.S., Winnie
Zhao, Yao Wang, Ph.D., and Eric D. Brenner, Ph.D.
The Color of Survival: An Inquiry-based Inter-disciplinary Study of Bacterial
Pigments ……………………………………………………………………22
José de Ondarza, Ph.D.
Using Student-generated Press Releases in a Vertebrate Physiology Course to
Enhance Scientific Communication Skills …………………………………31
Shawn K. Stover
Linking Phrases for Concept Mapping in Introductory College Biology ….34
Robert Javonillo,and Catherine Martin-Dunlop
PERSPECTIVES
Why Teach Biology If It Is Rejected? How to Teach Evolution So That It
Can Be Accepted ………………………………………………………..…39
Clinton Laidlaw and Jamie Jensen
SUBMISSION GUIDELINES............................................................. 48
64th ANNUAL MEETING
The 64th Annual ACUBE meeting will be held at Rockhurst
University on Friday October 23rd – Saturday Oct 24th in Kansas
City, MO.
CONTENTS
Volume 45(3) December 2019
ISSN 1539-2422 ______________________
A Peer-Reviewed Journal of the
Association of College and
University Biology Educators
Editor-in-Chief:
Robert W. Yost
Indiana University –
Purdue University
Indianapolis
______________________________
An archive of all publications of the
Association of College and University
Biology Educators (ACUBE) can be
found at http://acube.org/bioscene
___________________________
Bioscene is published in May (online) and
December (online and in paper format).
Manuscripts submitted for consideration
by Bioscene should follow the guidelines
for submission.
Cover image:
Flamingo tongue snails (Cyphoma
gibbosum) feeding on a common sea fan
(Gorgonia ventalina)
Location:
Shallow reef within the Sapodilla
Cayes Marine Reserve, Gulf of
Honduras,
Belize
Photographer:
Paul Pickhardt, Associate Professor
of Biology, Lakeland University

Volume 45 (3) December 2019 Bioscene 2
Bioscene: Journal of College Biology Teaching
Volume 45(3) ·December 2019
A Publication of the Association of College and University Biology Educators
Bioscene Editors
Robert W. Yost, Editor-In-Chief,
Department of Biology
Indiana University – Purdue University Indianapolis
723 W. Michigan St., Indianapolis, IN 46202
Telephone: 317-278-1147
FAX: 317-274-2846
Email: [email protected]
Denise Slayback-Barry, Associate Editor,
Indiana University – Purdue University Indianapolis
723 W. Michigan St., Indianapolis, IN 46202
Editorial Board
Melissa Anderson, Lindenwood University
Eric Brenner, Pace University
Rebecca Burton, Alverno College
Luciana Caporaletti, Penn State, Wilkes-Barre
Jim Clack, Indiana University – Purdue University
Ashley Driver, University of Wisconsin - Stevens Point
Neil Haave, University of Alberta
Barbara Hass Jacobus, Indiana University – Purdue
University
Liz Hernandez, University of Puerto Rico
Luke Jacobus, Indiana University – Purdue University
Judy Maloney, Marquette University
Paul Pickhardt, Lakeland College
Scott Shreve, Lindenwood University
Sharon Thoma, University of Wisconsin - Madison
Conrad Toepfer, Brescia University
Jason Wiles, Syracuse University
ACUBE Mission Statement
Members of ACUBE share ideas and address the unique
challenges of balancing teaching, research, advising,
administration, and service.
We are a supporting and mentoring community that
provides professional development opportunities to:
develop and recognize excellence in teaching;
incubate new and innovative teaching ideas;
involve student research in the biology curriculum;
advise and mentor students in and out of the
classroom;
enhance scholarship through our nationally, peer-
reviewed journal, Bioscene.
ACUBE Governance Jason Wiles, Syracuse Univ., President
Rebecca Burton, Alverno College, Past President
Christina Wills, Rockhurst Univ., Executive Secretary of
Membership, Website editor, local arrangements chair
Greg Smith, Lakeland College, Executive Secretary of
Finance.
Paul Pickhardt, Lakeland College, Executive Secretary
Jessica Allen, Rockhurst Univ. Member
Ashley Driver, Univ. of Wisconsin-Stevens Point,
Member
Melissa Haswell, Davenport Univ., Member
Holly Nance, College of Costal Georgia, Member
Scott Schreve, Lindenwald Univ.- Belleville, Member
Heather Seitz, Johnson County Community College,
Member
Conrad Toepfer, Brescia Univ., Historian
Robert Yost, Indiana Univ – Purdue Univ, ex officio
Jessica Allen, Rockhurst University, program chair
Volume 45 (3) December 2019 Hernandez-Matias et al.: Spanish Language Version of the Science Identity Survey ………. 3
Articles
Spanish-language Version of the Science Identity Survey (SISE): Translation,
Cultural Adaptation, and Evaluation
Liz Hernandez-Matiasa, Pablo A. Llerandi-Románb,c, Lizmar Pérez-Donatoa, Natalia Calzada-Jorgea,
Stephanie Mendozad, Faviola Laureano-Torresa, A. Valance Washingtona, Michelle Borreroa
a Biology Department, University of Puerto Rico, Río Piedras Campus, San Juan, PR 00931
bPuerto Rico-Louis Stokes Alliance for Minority Participation Centro de Recursos para Ciencias e
Ingeniería Universidad de Puerto Rico, Rio Piedras Campus, San Juan, PR 00931
c Current address: United States Department of Agriculture , Forest Service, El Yunque National Forest,
Rio Grande, PR, 00745-9625
dBiology Department, University of Puerto Rico, Bayamón, PR 00959
Corresponding author: Michelle Borrero, Ph.D. University of Puerto Rico, Río Piedras Campus, San Juan,
Puerto Rico, 00931; Phone: 787-764-0000 ext. 88026; Fax: 787-274-8011; Email:
Abstract
Multiple worldwide efforts, including research experiences and internships for students, have been developed to
increase diversity in STEM. In order to understand the outcomes of these research experiences, instruments have
become available, but surprisingly, Spanish instruments for these purposes are scarce. The evaluation of diverse
scientific experiences and their influence on science identity is imperative. For this reason, we aimed to translate, and
evaluate a Science Identity Survey for Puerto Rican high school students. A committee of experts evaluated the
original survey of Science Identity and it was translated to Spanish using back-translation. Think-aloud results
revealed that students’ perception of their: (1) science competence is based on their grades, understanding, knowledge,
and learning; (2) performance is based on design and completion of a scientific task; (3) recognition is based on the
value that others give to science. The survey was analyzed to determine its dimensionality and reliability. A Cronbach's
alpha of .857 was obtained, which suggests that the items have a good internal consistency. Exploratory factor analysis
was performed and three factors; competence, performance and recognition were retained. This version of the survey
was deemed to be an appropriate instrument to address student science identity.
Keywords science identity, high school students, Spanish translation, quick assessment, scale
Introduction
A recurring global issue in Science, Technology,
Engineering and Math (STEM) education is the poor
academic performance and retention of students.
(Sithole et al., 2017; Therriault et al., 2017). Multiple
worldwide efforts, including research experiences and
internships for students, have been provided to
increase diversity in STEM. (Eeds et al., 2017;
Laursen et al., 2010, 2015; Lopatto, 2010). In order to
identify program outcomes and define gains, multiple
surveys have been developed (Corwin et al., 2015;
Hanauer and Dolan, 2017; Lopatto, 2004, 2010;
Weston and Laursen, 2015) and a growing body of
research has been reported (Bauer and Bennett, 2003;
Hathaway, 2002; Kardash, 2000; Kremer and Bringle,
1990; Lopatto, 2004, 2007; Lopatto and Tobias, 2010;
Russel, 2007). Some examples of developed surveys
and instruments are the Classroom Undergraduate
Research Experience (CURE) survey, Survey of
Undergraduate Research Experiences (SURE),
Laboratory Course Assessment Survey (LCAS),
Project Ownership Survey (POS) and Undergraduate
Research Student Self-Assessment (URSSA).
While each of the aforementioned surveys
measure research experience outcomes, each of them
evaluates the experience within a particular theoretical
framework. For example, the project ownership
survey (POS) measures project ownership, and
positive emotions towards the experience of the
laboratory course (Hanauer and Dolan, 2017). The

Volume 45 (3) December 2019 Hernandez-Matias et al.: Spanish Language Version of the Science Identity Survey ……… 4
CURE survey focuses on measuring the outcomes of
research experiences by using a pre-course survey, a
post-course survey, and an instructor report of course
elements (Lopatto, 2010). The pre-course survey is
focused on student level of expertise, science attitude,
and learning style. The post-course survey estimates
cognitive gains and benefits as well as attitude towards
science. The SURE survey focuses on gains in
laboratory technical skills, independence, intrinsic
motivation, active participation and personal skills
(Lopatto, 2004). LCAS measures students’
perceptions of biology lab courses; in particular it is
focused on collaboration, discovery, relevance, and
iteration (Corwin et al., 2015). URSSA measures
personal gains related to research work, skills,
attitudes and behaviors, as well as thinking and
working like a scientist (Weston and Laursen, 2015).
The data gathered with these instruments and other
research strategies has found that undergraduate
research allows students to acquire beneficial learning
and personal gains such as concept understanding,
thinking like scientists, elucidation of what they want
to study, and whether to further pursue graduate
education, specifically in STEM.
Although these instruments comprised multiple
important factors that influence research experiences
and persistence of different populations including
Latino/Hispanic populations, the impact of scientific
experiences on the science identity of Latino/Hispanic
high school students remains incompletely defined.
Due to the increasing population of high school
students whose first language is Spanish, it is critical
to understand the science identity of them taking into
consideration culturally-patterned differences, native
language, and familiar concepts to obtain a better
understanding of their science identity (Ramirez et al.,
2017). Since diversity and inclusion of everyone into
science, including the Latino/Hispanic population, is
important for the nation’s economic and social
development, the study of science identity and key
components for retention is imperative (Malcom and
Feder, 2016). Unfortunately, in a review of the
literature, no single validated Spanish-language
assessment instrument for science identity was found.
Identity as described by Gee (1991) is “the kind
of person one is seeking to be and enact in the here and
now”. When it comes to science identity, researchers
agree that there is a component of self or intrinsic
factors and a component of fitting into the norms and
practice of the scientific community that leads to the
recognition of the person in the specific community. A
growing amount of research has argued that the
components that build up students’ science identity
offers “the most complete understanding of students’
trajectories and persistence in science related careers”
(Fraser and Ward, 2009; Krogh and Andersen, 2013).
Although science identity has taken many different
meanings, we will focus on the definition given by
Carlone and Johnson (2007) because of their
methodological and practical implications. This
selection does not deny other useful approaches that
could be taken using other definitions; it gives us a
framework for data analysis and interpretation.
Carlone and Johnson’s approach to define and
contextualize a science identity model is formed by the
following question: “How would we describe a person
who has a strong science identity?” They define the
science identity concept as the kind of person that
“makes visible to (performs for) others one’s
competence in relevant practices, and, in response,
others recognize one’s performance as credible”
(2007). In other words, their science identity model
captures the key elements that build and describe a
person that belongs to the scientific community.
Interestingly, this model is based on the interrelated
dimensions of competence, performance and
recognition that an individual can envision at different
degrees and configurations (Carlone and Johnson,
2007). Competence is defined as “knowledge and
understanding of science content”; performance is
defined as “social performances of relevant research
practices such as: ways of taking and using tools”; and
recognition by “recognizing oneself and others as a
“science person” (Carlone and Johnson, 2007).
Multiple researchers have developed surveys
addressing science identity (Cole, 2012; Estrada et al.,
2011; Hanauer, et al. 2016; Schon, 2015; Stets et al.,
2016; Vincent and Schunn, 2018). These instruments
attempt to define science identity using the following
constructs: self-identification, performance,
recognition, students’ interests related to science,
reflected appraisals, science self-efficacy, science
behavior, interest, fascination, values, competency
beliefs, project ownership, emotion, and networking.
Among the surveys that study students’ science
identity and follow the structure and specific
dimensions of Carlone and Johnson is Jennifer
Schon’s Science Identity Survey (SIS) (Schon, 2015).
The SIS instrument measures intrinsic and extrinsic
components of science identity using 15 items.
Although the SIS instrument measures competence
using knowledge and understanding of science topics,
these items are not content-based and therefore can be
used for the evaluation of interventions of a wide range
of topics. Its length and approach make this instrument
suitable for the evaluation of a variety of short
interventions. Therefore, we have selected this survey
to study high school students’ science identity.
The SIS was translated, contextualized, and
evaluated (Schon, 2015) with Spanish-speaking,
Puerto Rican high-school students as research

Volume 45 (3) December 2019 Hernandez-Matias et al.: Spanish Language Version of the Science Identity Survey …….... 5
subjects. Survey evaluation was conducted following
amixed method approach, as the one performed by the
original SIS developers (Schon, 2015).
SIS development and use
The SIS was created to evaluate the impact of
students’ experiences at informal education centers
(Schon, 2015). Since informal education experiences,
such as museums, afterschool programs, and activities
in off-school venues differ in style, context, and
content, the developers of the survey created a short
non-content based survey to evaluate students’
experiences based on a mixed method approach
(Schon, 2015). First, interviews were held to gather
insight on student’s scientific experiences. Items were
then constructed, followed by think-aloud and pilot
testing (Schon, 2015).
The three different dimensions or constructs of
science identity described by Carlone and Johnson:
competence, performance, and recognition were
included and studied in the SIS. The competence
category consists of 5 items that are related to student
perception of knowledge and learning. Performance
consists of 5 items based on student perception of
science skills as experimental design, making
observations, and using the scientific method.
Recognition includes 5 items that identify if the
students feel like a scientist or if they perceive that
friends or relatives see them as scientist. For each of
these categories, a 5 to 1 Likert scale from “Strongly
agree” to “Strongly disagree” was used.
The original instrument was used for 5th and 6th
grade students at the University Of Idaho College Of
Natural Resources’ McCall Outdoor Science School
(MOSS). For the confirmatory factor analysis, they
report the following indices: comparative fit index
(CFI) = .934, adjusted goodness of fit index (AGFI) =
.869, root mean square error of approximation
(RMSEA) = .07, standardized root mean squared
residual SRMR= .065. This instrument was further
used to evaluate students’ science identity before and
after an informal education experience at MOSS. Also,
a follow up evaluation was performed after a month.
Results showed that the experience at MOSS was a
positive influence on the participants’ science identity
(Schon, 2015).
Methods
Participants
The Institutional Review Board at the University
of Puerto Rico approved this study (IRB protocol
1718-036). Participants did not receive any incentive
for their participation. Anonymity of all participants is
guaranteed. We selected participants based on their
grade level (10th, 11th and 12th grade), and
availability and willingness to complete the survey.
An informative brochure of the study together with the
consent/assent form was given to students. Two weeks
after the initial approach, consent/assent forms were
collected and during the same day, participants
answered the survey or participated in interviews.
Survey content evaluation was addressed using the
think-aloud method (Trenor et al., 2011). One group
of three and another of four students participated in
this process to confirm that participants understood the
intended meaning of the questions. A preliminary
evaluation was performed with 32 participants (19
females and 12 males) from one school located in San
Juan, Puerto Rico. For the construct evaluation, three
different high schools from the San Juan region were
approached. The participants’ schools where selected
according to their specialization (science, sports, or
languages) in order to include students with a diverse
range of interests. A total of 180 participants
completed the survey.
Translation
The SIS was translated from English to Spanish
as suggested by the World Health Organization
guidelines (2007). A bilingual translator, who was
familiar with science identity constructs, and whose
mother tongue is Spanish performed the forward-
translation step. Once the initial translation was
completed, a bilingual panel composed of 4 experts in
the field of science, education, translation, and/or
instrument development discussed each item. The
expert panel evaluated each item for discrepancies
between the original version and the translated
version, cultural discrepancies, concept translation,
jargon, and clarity. Once the expert panel solved
discrepancies and reached a consensus on all items, the
revised Spanish version was given to an independent
translator whose mother tongue is English and did not
have any knowledge of the studied concepts of science
identity. The independent translator translated the
Spanish version of the survey back to English
(backward translation). Subsequently, the expert panel
compared the English version of the survey to the
original version and discrepancies were discussed
until conceptual and cultural equivalence of the survey
was achieved. Each panel discussion took
approximately 4 hours.
Survey content evaluation
The final version of the translation process was
given to groups of 4 participants as suggested by Virzi
(1992). Participants were asked to answer: (1) what
was their first thought about the item, (2) what was
their answer, (3) if something was not clear, and if so,
what was not clear to them, and (4) if they had a
suggestion to improve the item. Participants evaluated

Volume 45 (3) December 2019 Hernandez-Matias et al.: Spanish Language Version of the Science Identity Survey ……...… 6
each item and their suggestions were incorporated in
the survey. The final version of this process was a
consensus among all the participants. At the end of the
process, the interviewer read out-loud the survey and
final changes, or suggestions were incorporated. This
process was repeated until it reached saturation of
responses (Trenor et al., 2011).
Survey construct evaluation
Think-aloud suggestions were incorporated into the
survey and administered to participants. During this
process we realized that the numbered Likert scale was
not clear to participants. For this reason, we
incorporated another session of think-aloud with 4
additional participants, in which two versions of the
survey were given, one with a scale labeled with
numbers and another one labeled with descriptive
word answers. Participants were asked to answer the
survey in both formats and talk about their answer
selection process allowing us to define and correct any
misconception and select the best scale format for our
survey.
The survey was administered to 180 participants.
Survey descriptive statistics, reliability, and goodness
of fit analysis were calculated using IBM SPSS
Statistics software package, version 24. Cronbach's
alpha was used to estimate the internal consistency of
the survey (Cronbach, 1951). Measurement criterion
was as followed: α ≥ 0.90 (high internal consistency
or items may be redundant) α ≥ .80 (good internal
consistency) α ≥ .70 (adequate internal consistency)
(Nunnally, 1978). Skewness and kurtosis acceptable
criterion for normality was set at |2.0| as suggested by
George D. and Mallery P. (2010). Kaiser-Meyer-
Olkin, measure (KMO) of sampling adequacy
threshold was set at 0.5 as used by Hanauer and Dolan
(2014).
Students’ perceptions of their competence,
performance and recognition are variables that cannot
be directly observed (latent variables). To study these
unobservable variables, we analyze participants’
responses to specific questions (measurable variables)
to make inferences about the studied latent variables.
Exploratory Factor Analysis (EFA) with principal axis
extraction method was selected instead of the Principal
Components Analysis, because we wanted to
determine interpretable constructs that explain
correlations among measurable variables and not in
find components that explain as much variance as
possible (Preacher and McCallum, 2003; Knekta,
Runyon and Eddy, 2019).
To identify the best structure to interpret our
results we rotated the factor solutions. Among the
rotation methods that are available we selected the
oblimin method, which allowed correlation among
factors (Preacher and McCallum, 2003). Parallel
analysis was performed to determine the number of
factors to retain; Principal Axis Factor was used as the
method of extraction, 1000 data sets, 95 percentile,
and Pearson correlation (O’Connor, 2000).
Characteristics Number students
Age range 14-17
Female 93 (1.6%)
Male 86 (48%)
Other 1 (0.5%)
Metropolitan area of
San Juan*
155 (86%)
Other# 25 (14%)
Table 1. Student demographics. *including
Bayamón, Carolina, Cataño, Guaynabo, and Trujillo
Alto. # Corozal, Gurabo, Toa Baja, Aguas Buenas,
Dorado, Juncos, Las Piedras, Vega Alta, San
Lorenzo, Río Grande, Canóvanas.
Results
Participants
Participants’ age ranged from 14 to 17 years old (Table
1). The proportion of females and males was fairly
evenly distributed, but overall more females
participated. Most of the participants live in the
metropolitan area of San Juan, Puerto Rico. As it is
shown in Tables 2 and 3, some participants failed to
indicate their parent’s highest degree obtained, field of
study, and/or occupation because they had no
knowledge about this information, declined to answer,
Education High School Two-year
Associate
Bachelor’s
Degree
Post-graduate or
Professional
Degree*
N/A+
Father highest
degree obtained
9 (5%) 5 (3%) 57 (32%) 57 (32%) 52 (29%)
Mother highest
degree obtained
24 (13%) 5 (3%) 38 (21%) 42 (23%) 71 (39%)
Table 2. Parents highest degree obtained. *including master's, doctorate, medical or law degree. +don't know/refused
to answer.

Volume 45 (3) December 2019 Hernandez-Matias et al.: Spanish Language Version of the Science Identity Survey ………... 7
N/A+ STEM Other
Father field of study 68
(38%)
33
(18%)
79
(44%)
Mother field of study 37
(21%)
36
(20%)
107
(59%)
Father occupation 32
(18%)
27
(15%)
121
(67%)
Mother occupation 31
(17%)
23
(13%)
126
(70%)
Table 3. Parents field of study and occupation. +don't
know, refused to answer, unemployed.
or left unanswered because it didn’t apply to their case.
From the participants who answered, most of their
parents obtained a postgraduate or professional degree
(includes Master’s, Doctorate, Medical, or Law
degrees). A few participants had parents who
graduated from Associate degree programs. Most
parents studied in a field and/or have an occupation
that is not related to STEM.
Content evaluation
Two groups of four participants discussed each
item of the Spanish-translated version of the survey,
suggesting a total of 8 changes, all of which were
incorporated (Table 4). Changes were mainly focused
on verb usage and the inclusion of not just task, but
projects in item number 12. Participants also requested
to delete “mis” (“my”) on item number 13, (Las
personas me ven como un científico cuando comparto
Original questionnaire Translated questionnaire
Incorporation of think-aloud
suggestions
1. I am good at science Soy bueno en ciencia. Soy bueno en ciencia.
2. I know a lot about science Se mucho de ciencia. Se mucho de ciencia.
3. I am good at most science
experiments
Soy bueno haciendo experimentos
científicos.
Soy bueno llevando a cabo
experimentos científicos.
4. I understand science topics
Entiendo fácilmente los temas de
ciencia.
Domino los temas de ciencia.
5. I learn new science topics easily
Aprendo fácilmente nuevos temas de
ciencia.
Aprendo fácilmente nuevos temas de
ciencia.
6. I can use science equipment and/or
technology to collect data
Puedo usar equipos científicos y/o
tecnología para obtener datos.
Puedo usar equipos científicos y/o
tecnología para obtener datos.
7. I know how to use the scientific
method/process Se cómo usar el método científico. Se cómo usar el método científico.
8. I can talk with others about science
related topics
Puedo hablar con otras personas sobre
temas de ciencia.
Puedo hablar con otras personas sobre
temas de ciencia.
9. I can create my own science
experiments
Puedo crear mis propios experimentos
científicos.
Puedo diseñar mis propios
experimentos científicos.
10. I can use my observations to create
a hypothesis
Puedo usar mis observaciones para
hacer una hipótesis.
Puedo usar observaciones para hacer
una hipótesis.
11. My friends see me as someone that
is good at science
Mis amigos me ven como una persona
que es buena en ciencia.
Mis amigos me ven como una persona
que es buena en ciencia.
12. When giving a science report, I
feel like a scientist
Cuando hago mis trabajos de ciencia,
me siento como un científico.
Cuando hago trabajos y/o proyectos
de ciencia, me siento como un
científico.
13. Others see me as a scientist when I
share my observations
Las personas me ven como un
científico cuando comparto mis
observaciones.
Las personas me ven como un
científico cuando comparto
observaciones.
14. When I share data I've collected, I
feel like a scientist
Cuando comparto los datos que he
obtenido me siento como un
científico.
Cuando comparto los datos que he
obtenido me siento como un
científico.
15. I can help others with science
related topics
Puedo ayudar a las personas cuando
tienen dudas de ciencia.
Puedo ayudar a las personas cuando
tienen dudas de ciencia.
Table 4. Translation of the items and the result of think-aloud process. Translation of the Science identity
questionnaire published by Jennifer Schon was performed using back-translation followed by a committee expert
evaluation. Think-aloud was performed twice using a group of 3 to 4 students.

Volume 45 (3) December 2019 Hernandez-Matias et al.: Spanish Language Version of the Science Identity Survey ……...… 8
“mis” observaciones) since they feel like scientists
when they are sharing observations of other scientists
as well as their own.
Participants also commented that the numbered
scale is subjective, and the descriptive scale is clearer
to them. From the think-aloud interviews we gathered
the following participants’ quotes (see translated
English version at the bottom of each quote):
“Me enfrento a la escala de palabras y mi humildad toca
la puerta. En la escala de palabras valgo menos.”
“When I am confronted with the words scale
my humility knocks on the door. With the
words scale I feel of less value”
“Es más claro (en palabras), número es más subjetivo.”
“It is clearer (in words), numbers are more
subjective”
“Palabras es más claro”.
“With words it is clearer.”
“Con números la interpretación es diferente; es
subjetivo.”
“With numbers the interpretation is different; it is
subjective”
Therefore, the following descriptive word scale was
incorporated: “Muy de acuerdo”, “De acuerdo” Ni en
desacuerdo ni de acuerdo”, “En desacuerdo”, and
“Muy en desacuerdo”. The modified version was
administered to 180 participants for construct
evaluation.
Answers mean value for the items ranged from 2.8
to 4.3 (Table 5). All the items had a skewness and
kurtosis below |1.0|. Intra-subscale correlations ranged
from 0.325 to 0.724 and communalities range from
0.463 to 0.785. Results show a Chi-Square, value of
1125.633 significance 0.000, Cronbach's alpha
coefficient value of 0.867, and Kaiser-Meyer-Olkin,
measure (KMO) of sampling adequacy of .855. Also,
a Bartlett’s test of sphericity, tests of correlation
matrix, showed a significance of 0.000. After the
analysis and interpretation of the measurements above
Item Mean Std.
Deviation
Skewness Kurtosis Corrected Item-
Total correlation
1 3.8 0.84313 -0.528 0.664 0.602
2 3.4 0.7907 -0.015 0.271 0.591
3 3.9 0.82827 -0.402 -0.31 0.438
4 3.6 0.79451 -0.386 0.793 0.615
5 3.7 0.84643 -0.379 0.184 0.568
6 4.2 0.72541 -0.759 0.689 0.473
7 4.2 0.69171 -0.318 -0.501 0.325
8 3.9 0.89872 -0.571 -0.349 0.503
9 3.4 0.92727 -0.089 -0.326 0.406
10 4.3 0.60051 -0.208 -0.573 0.355
11 3.4 1.06871 -0.242 -0.448 0.724
12 3.4 1.14525 -0.265 -0.678 0.374
13 2.8 0.92244 -0.027 -0.033 0.59
14 3.2 1.13551 -0.146 -0.769 0.491
15 3.7 1.01882 -0.651 0.176 0.661
Table 5. Descriptive statistics for each of the items. n=180
Number of items 15
Number of responses 180
Average inter-item correlations 0.306
Standard deviation of Inter-item correlations 0.15
Cronbach’s alpha 0.867
Kaiser-Meyer-Olkin Measure of Sampling Adequacy 0.855
Bartlett’s Test of Sphericity 1125.633
Bartlett’s Test of Sphericity Significance 0
Table 6. Scale and Reliability Statistics of the survey. 15 items, n=180

Volume 45 (3) December 2019 Hernandez-Matias et al.: Spanish Language Version of the Science Identity Survey ……… 9
Component Matrix
Item 1 2 3 4 Total variance
explained
Soy bueno en ciencia. .873 5.492 (33.71%)
Se mucho de ciencia. .701
Domino los temas de ciencia. .699
Aprendo facilmente nuevos temas de ciencia. .654
Puedo ayudar a las personas cuando tienen dudas de
ciencia.
.590
Mis amigos me ven como una persona que es buena en
ciencia.
.565 -.402
Cuando hago mis trabajos de ciencia, me siento como
un cientificico.
.950 1.834 (10.174%)
Las personas me ven como un cientifico cuando
comparto mis observaciones.
.801
Cuando comparto los datos que he obtenido me siento
como un cientifico.
.659
Se cómo usar el método cientifico. .704 1.478 (96.083%)
Soy bueno llevando a cabo experimentos cientificos .539
Puedo usar equipos cientificos y/o tecnologia para
obtener datos.
.494
Puedo usar observaciones para hacer una hipótesis. .419
Puedo hablar con otras personas sobre temas de ciencia -.643 1.02 (3.35%)
Puedo diseñar mispropios experimentos cientificos. -.431
Table 7. Exploratory factor analysis. Using Oblimin rotation, four factors were found that explained 53.32% of the
variance.
mentioned and descriptive statistics we confirmed that
the sample was adequate and that its dimensionality
could be explained using a factor analysis (Table 6).
The internal structure of the test items was
identified using the exploratory factor analysis.
Principal axis factoring using the oblimin with Kaiser
normalization rotation was conducted. Results
indicate a 4-factors solution (Table 7). The 4-factor
solution explained 53.32% of the variance. Each item
was explained by one factor, with the exception of
item 11. Factor 1, which accounts for 33.71% of the
explained variance, was constructed of competence
and recognition items. Factor 2 (10.174% variance
explained) was constructed of recognition items.
Factor 3 (6.083% variance explained) was constructed
of performance and one item of competences. Factor 4
(3.357% variance explained) was constructed of
performance items.
In general, these factors were consistent with what
was originally described for the SIS. In detail, the first
factor, that comprised mainly competence items,
included the following items that were previously
categorized in the recognition dimension: “Mis
amigos me ven como una persona que es buena en
ciencia” (SIS original item: “My friends see me as
someone who is good at science”), and “Puedo ayudar
a las personas cuando tienen dudas de ciencia” (SIS
original item: “I can help others with science related
topics”). In the think-aloud, participants commented
that in order to help others and to be recognized as a
person that is good at science, they needed to know the
material and have good grades. Thus, they related
these items to their ability to understand and know
science topics , which directly associates to science
competencies.
The third and fourth factors are mainly composed
of performance items. One item previously included
in the competence dimension: “Soy bueno llevando a
cabo experimentos científicos” (SIS original item: “I
am good in most science experiments”) was
incorporated in the third factor. Participants’
interpretation of this item focused on experimental
design, methods, and experimentation. Participants
emphasized that the item is open enough that it can be
interpreted as experimental design or experimentation.
The fourth factor was composed of two performance
items. According to the parallel analysis and because
of the small number of items in factor 4, just factors 1,
2 and 3 were retained (Figure 1).
Based on the exploratory factor analysis, parallel
analysis, and think-aloud comments we recommended
a rearrangement of the items on each of the dimensions

Volume 45 (3) December 2019 Hernandez-Matias et al.: Spanish Language Version of the Science Identity Survey ………... 10
and the deletion of original items 8, 9, and 11.
Cronbach's alpha index was re-calculated for the final
version of the survey and we obtained a result of .857.
The final version of the survey is presented in Table 8
and it has incorporated the aforementioned
modifications.
Discussion
Although science identity has been mainly studied
in undergraduates or higher degrees, it is known that
high school science identity is influenced by students’
persistence, the role of the community, and level of
science at school (Aschbacher et al., 2009).
Unfortunately, the impact of scientific experiences on
the science identity of Latino/Hispanic high school
students remains relatively undefined (Gándara, 2006;
Rochin and Mello, 2007; Tabak and Collins, 2011). To
characterize the effectiveness of research experiences
and identify which components actually are important
for STEM retention of high school Latino/Hispanic
population, an assessment in Spanish was necessary.
This study presents evidence of the translation and
evaluation of the Spanish version of the SIS (SISE, for
SIS-Español), using Puerto Rican high school students
as research subjects and takes into consideration
culturally patterned differences.
After the think aloud process, participants agreed
that the numbered Likert scale was subjective, and the
descriptive word scale was more informative. For this
reason, the original numbered scale on the SIS was
replaced and the word descriptive scale was
incorporated. This result is consistent with previous
research on scales that found that numbered scales are
subjective to participant interpretations and are more
problematic for respondents that do not tolerate
ambiguity (Johnson et al., 2005). Interestingly, our
results show that participants tend to assign higher
scores when using the numbered scale
Fig 1. Parallel analysis. Method of extraction:
Principal Axis Factor, 1000 data sets, 95 percentile,
and Pearson correlation.
Muy de
aucerdo
De
acerdo
Niem
desacuerdo
nide
acuerdo
Em
desacuerdo
Mu yen
desacuerdo
1. Soy bueno en ciencia.
2. Se mucho de ciencia.
3. Soy bueno hacienda experimentos cientificos.
4. Entiendo fácilmente lose mas de ciencia.
5. Aprendo fácilmente nuevos temas de ciencia.
6. Puedousar equipos cientificos y/o tecnologiia
para obtenere datos.
7. Se cómo usar elmétodo cientifico.
8. Puedo usar observaciones paraq hacer una
hipótesis.
9. Cuando hago mis trabajos de ciencia, me
siento como un cientifico.
10. Las personas me ven como un cientifico
cuando compartomi observaciones.
11. Cuando comparto los datos que he ob tenido
me siento como un cientifico.
12. Puedo ayudara las peronsasw cuando tienen
dudas de ciencia.
Table 8. SISE Suggested changes
Volume 45 (3) December 2019 Hernandez-Matias et al.: Spanish Language Version of the Science Identity Survey ……...… 11
than when they are using the descriptive word scale.
This effect may be influenced by the submissive
response (simpatía) style documented among Latinos
and Hispanics (Johnson et al., 2005). Our results
suggest that the use of a descriptive word scale can
help participants to think about the best word that
describes their answer and not on giving the highest
score possible to each item.
After content evaluation and scale changes, an
exploratory factor analysis and Cronbach’s alpha
index were calculated to explore the structure and
reliability of the survey. A 4-factor solution was
suggested, but one of the factors was not reliable. As a
result, this factor was deleted.
Limitations and Suggestions
One limitation of the SIS is that its evaluation was
performed using just one informal center. Given that
participants of the SIS evaluation were self-selected,
they may have a predisposition to science careers and
this selection process excluded those students that may
not like science and are not interested on a STEM
career. To overcome this limitation, we chose schools
specialized in various areas to have a diverse group of
students with different levels of interests in science.
We are aware that this selection does not imply or
ensure participants’ interest for science, but it does
gather different student profiles. A potential limitation
of the survey for future SISE users is that it has only
been validated with Puerto Rican high school’
students, and there are cultural differences across
Spanish-speaking communities. We encourage future
users of the SISE to validate this survey with a similar
population to the one that will be further tested, taking
into account culturally patterned differences and scale
interpretations.
Acknowledgments
We would like to thank Dr. Jorge Rodríguez-Lara
and the Center for Science and Math Education
Research [CSMER; NSF#1038166] for insightful
discussions, suggestions, and advice. Research
reported in this publication was supported by the NIH
grant [R01HL090933]. We would also like to thank
teachers, students and parents involved in this research
for their time and contribution. Finally, we will like to
thank the Research Initiative for Scientific
Enhancement (RISE) Grant: [5R25GM061151-17] for
their support to LHM. Also, we would like to thank
Dr. José Agosto and Dr. Paul Bayman for their help
and insights in the instrument translation.
Declaration of Interest
The authors declare no conflict of interest.
References
ASCHBACHER, P.R., LI, E., AND E.J. ROTH. 2009.
Is Science me? High school students’ identities,
participation and aspirations in Science, Engineering,
and Medicine. Journal of Research and Science
Teaching. 47(5): 564–582.
BANDURA, A., AND E.A. LOCKE. 2003. Negative
self-efficacy and goal effects revisited. Journal of
Applied Psychology. 88(1): 87–99.
BAUER, K.W., AND J.S. BENNETT. 2003. Alumni
perceptions used to assess undergraduate research
experience. The Journal of Higher Education. 74(2):
210–230.
CARLONE, H.B., AND A. JOHNSON. 2007.
Understanding the science experiences of successful
women of color: Science identity as an analytic lens.
Journal of Research in Science Teaching. 44(8):
1187–1218.
COLE S. 2012. The development of science identity:
An evaluation of youth development programs at the
museum of Science and industry, Chicago. (Doctoral
dissertation)
CORWIN, L.A., RUNYON, C., ROBINSON, A.,
AND E.L. DOLAN. 2015. The laboratory
courseassessment survey: A tool to measure three
dimensions of research-course design. CBE Life
Sciences Education. 14(4): 1-11.
COSTELLO, A.B., AND J.W. OSBORNE. 2005. Best
practices in exploratory factor analysis: Four
recommendations for getting the most from your
analysis. Practical Assessment, Research &
Evaluation. 10(7): 1–9. CRISP, N., AND A. NORA.
2012. Overview of Hispanics in Science, Math,
Engineering, and Technology (STEM): K-16
representation, preparation and participation San
Antonio: Hispanic Association of Colleges and
Universities. Accesed from
https://www.hacu.net/images/hacu/OPAI/H3ERC/20
12_papers/Crisp%20nora%20-
%20hispanics%20in%20stem%20-
%20updated%202012.pdf
CRONBACH, L.J. 1951. Coefficient alpha and the
internal structure of tests. Psychometrika. 16(3): 297-
334.
EEDS, A., VANAGS, C., CREAMER, J.,
LOVELESS, M., DIXON, A., SPERLING, H.,
MCCOMBS, G., ROBINSON, D., AND V.L.
SHEPERD. 2014. The school for Science and Math at
Vanderbilt: An innovative research-based program for
high school students. CBE life sciences education.
13(2): 297-310.

Volume 45 (3) December 2019 Hernandez-Matias et al.: Spanish Language Version of the Science Identity Survey (SISE). 12
ESTRADA, M., WOODCOCK, A., HERNANDEZ,
P.R., AND P.W. SCHULTZ. 2011. Toward a model
of social influence that explains minority student
integration into the scientific community. Journal of
educational psychology. 103(1): 206-222.
GANDARA, P. 2006. Strengthening the academic
pipeline leading to careers in Math, Science, and
Technology for Latino students. Journal of Hispanic
Higher Education. 5(3): 222-237.
GEE, J.P. 1999. An introduction to discourse analysis:
Theory and method. New York: Routledge.
GEE, J.P. 2000–1. Identity as an analytic lens for
research in education. Review of Research in
Education. Accessed from
http://citeseerx.ist.psu.edu/viewdoc/download?doi=1
0.1.1.462.2577&rep=rep1&type=pdf
GEORGE, D., AND P. MALLERY. 2010. SPSS for
Windows Step by Step: A Simple Guide and
Reference 17.0 Update. 10th Edition, Boston: Pearson.
HANAUER, D.I., AND E.L. DOLAN. 2014. The
project ownership survey: Measuring differences in
scientific inquiry experiences. CBE Life Sciences
Education. 13(1): 149-158.
HANUER, D. I., GRAHAM, M. J., AND G.F.
HATFULL. 2016. A Measure of college student
persistence in the Sciences (PITS). CBE Life Sciences
Education. 15(4): 1-10.
HATHAWAY R.S., NAGDA B., AND S.R.
GREGERMAN. 2002. The relationship of
undergraduate research participation to graduate and
professional education pursuit: An empirical study.
Journal of College Student Development. 43(5): 614-
631.
JOHNSON, T., KULESA P., CHO, Y.I., AND S.
SHAVITT. 2005. The Relation between culture and
response styles. Evidence from 19 countries. Journal
of Cross-cultural Psychology. 36(2): 64–77.
KAISER, H.F. 1958. The varimax criterion for
analytic rotation in factor analysis. Psychometrika.
23(3): 187-200.
KAISER, H.F. 1960. The application of electronic
computers to factor analysis. Educational and
Psychological Measurement. 20(1): 141-151.
KARDASH, C.A.M. 2000. Evaluation of an
undergraduate research experience: Perceptions of
undergraduate interns and their faculty mentors.
Journal of Educational Psychology. 92(1): 191-201.
KREMER, J. F., AND R.G., BRINGLE. 1990. The
effects of an intensive research experience on the
careers of talented undergraduates. Journal of
Research & Development in Education. 24(1): 1-5.
KROGH, L. B., AND H.M. ANDERSEN. 2012.
“Actually, I may be clever enough to do it”. Using
identity as a lens to investigate students’ trajectories
towards science and university. Research in Science
Education. 43(2): 711–731.
ROCHIN R. I., AND S.F. MELLO. 2007. Latinos in
science trends and opportunities. Journal of Hispanic
Higher Education. 6(4): 305-355.
LAURSEN, S. L. 2015. Assessing undergraduate
research in the sciences: The next generation. Council
of Undergraduate Research. 35(3): 9–14.
LAURSEN, S., SEYMOUR, E., HUNTER, A. E.,
THIRY, H., AND G. MELTON. 2010. Undergraduate
research in the sciences: Engaging students in real
science. Hoboken, NJ: Wiley.
LOPATTO, D. 2004. Survey of undergraduate
research experiences (SURE): First findings. Cell
Biology Education. 3(4): 270-277.
LOPATTO, D. 2010. Undergraduate research as a
high-impact student experience. Peer Rev. 12(10).
LOPATTO, D., AND S. TOBIAS. 2010. Science in
solution: The impact of undergraduate research on
student learning. Washington, DC: Council on
Undergraduate Research.MALCOM S., AND M.
FEDER. 2016. Barriers and opportunities for 2-year
and 4-year STEM degrees: Systemic change to support
students' diverse pathways. Washington DC: The
National Academic Press.
MARTIN, J., MATTHEW, K. M., AND K.G.
GIPSON. 2011. Utilization of a think-aloud protocol
to cognitively validate a survey instrument identifying
social capital resources of engineering
undergraduates. 2011 ASEE Annual Conference &
Exposition. Accessed from
https://peer.asee.org/18492
NORRIS, M., AND L. LECAVELIER. 2010.
Evaluating the use of exploratory factor analysis in
developmental disability psychological research.
Journal of Autism and Developmental Disorders.
40(1): 8-20.
NUNNALY, J. Psychometric Theory. New York:
McGraw-Hill; 1978. Streiner DL. Starting at the
beginning: An introduction to coefficient alpha and
internal consistency. J Pers Assess. 2003; 80:99–103.

Volume 45 (3) December 2019 Hernandez-Matias et al.: Spanish Language Version of the Science Identity Survey (SISE). 13
O’COONORR, B.P. 2000. SPSS and SAS programs
for determining the number of components using
parallel analysis and Velicer's MAP test. Behavior
Research Methods, Instrumentation, and Computers.
32(3). 396-402.
PREACHER, K.J., AND R.C. MACCALLUM. 2003.
Repairing Tom Swift’s electric factor analysis.
Understanding Statistics. 2: 13–44.
RAMIREZ, A.S., WILLIS, G., AND L.F. RUTTEN.
2017. Understanding Spanish-language response in a
national health communication survey: Implications
for health communication research. Journal of health
communication. 22(5): 442-450.
RUSSELL, S.H., HANCOCK, M.P., AND J.
MCCULLOUGH. 2007. Benefits of undergraduate
research experiences. Science. 316(5824): 548-549.
SCHON, J. A., MILLER, B., EITEL, K. B.,
WAPETT, M. AND F. LAWRENZ. 2015. Science
identity in informal education. UMI Dissertation
Publishing. 1-171. (Doctoral Dissertation)
SITHOLE, A., CHIYAKA, E.T., MCCARTHY, P.,
MUPINGA, D.M., BUCKLEIN, B.K., AND J.
KIBIRIGE. 2017. Student Attraction, persistence and
retention in STEM programs: Successes and
continuing challenges. Higher Education Studies.
7(1): 46-59
STETS, J.E., BRENNER, P.S., BURKE, P.J., AND
R.T. SERPE. 2017. The science identity and entering
a science occupation. Social Science Research. 64: 1-
14.
STREINER, D.L. 2003. Starting at the beginning: An
introduction to coefficient alpha and internal
consistency. Journal of Personality Assessment. 80(1):
99-103.
TABAK, L.A., AND F.S. COLLINS. 2011. Weaving
a richer tapestry in biomedical science. Science.
333(6045): 940–941.
THERRIAULT, S., LI, Y., BHATT, M.P.,
NARLOCK, J., (ED), R.E.L.N., AND I.,
EDUCATION DEVELOPMENT CENTER, I.
(EDC), & (ED), N.C. for E.E. AND R.A. 2017. Puerto
Rico school characteristics and student graduation:
Implications for research and policy (REL 2017-266).
Regional Educational Laboratory Northeast and
Islands. TRENOR, J.M., MILLER, M.K., AND K.G.
GIPSON. Utilization of a think-aloud protocol to
cognitively validate a survey instrument identifying
social capital resources of engineering
undergraduates. ASEE Annual Conference &
Exposition, Vancouver, BC.
TSANG, S., ROYSE, C.F., AND A.S. TERKAWI.
2017. Guidelines for developing, translating, and
validating a questionnaire in perioperative and pain
medicine. Saudi journal of anesthesia. 11(1): 80-89.
VINCENT-RUZ, P. AND C.D. SCHUNN. 2018. The
nature of science identity and its role as the driver of
student choices. International Journal of STEM
Education, 5 (1): 1-12.
VIRZI, R. A. 1992. Refining the test phase of usability
evaluation: How many subjects is enough? The
Journal of Human Factors and Ergonomics Society.
34(4): 457-468.
WESTON, T. J., AND S.L. LAURSEN. 2015. The
undergraduate research student self-assessment
(URSSA): Validation for use in program evaluation.
CBE Life Sciences Education. 14(3) ar33: 1-10.
WORLD HEALTH ORGANIZATION. 2007. Process
of translation and adaptation of instruments.
Accessed from
https://www.who.int/substance_abuse/research_tools/
translation/en/

Volume 45 (3) December 2019 Guercio et al.: Plant Tracer: A Program to Quantify Plant Movement from Cellphone……… 14
Innovations Plant Tracer: A Program to Track and Quantify Plant Movement from
Cellphone Captured Time-Lapse Movies
Angelica M. Guercio, B.A.1, Yixiang Mao, M.S.2, Victor N. D. Carvalho, M.S.3,
Jiazhen Zhang, B.S.4, Changyuan Li, M.S.5, Zheng Ren, M.S.6, Winnie Zhao7,
Yao Wang, Ph.D.8, and Eric D. Brenner, Ph.D.9*
1Department of Plant Biology, University of California, Davis, CA 95616, 2Department of Electrical and
Computer Engineering, Tandon School of Engineering, New York University, Brooklyn, NY, 11201, 3Center for Magnetic Resonance in Biology and Medicine, CNRS UMR 7339, Aix Marseille University,
Marseille, France, 13385, 4Huawei Technologies Co., Ltd. Dongguan, Guangdong, China, 523808, 5Google, LLC, Mountain View, California, 94043, 6Dialogic Inc., Parsippany, NJ, 07054, 7Department of
Biology, Pace University, New York, NY 10038, 8Department of Electrical and Computer Engineering,
Tandon School of Engineering, New York University, Brooklyn, NY, 11201, 9Department of Biology, Pace
University, New York, NY 10038
*Corresponding Author: [email protected]
Abstract Despite the fundamental importance of plants to our very survival, student interest in plant biology is in
decline as technology draws us further away from nature. Here we introduce Plant Tracer
(http://www.planttracer.com), a Matlab-based program, which can quantify time-lapse videos of plant movement. We
demonstrate that Plant Tracer can be used to distinguish altered movement qualities in the inflorescence (flowering)
stem in the Arabidopsis pgm-1 (phosphoglucomutase) mutant when compared to wildtype, providing a genetic
platform for students to evaluate how plants sense and respond to gravity and circumnutation (the back-and-forth
swaying of plant organs). We show that both gravitropism and circumnutation is diminished in the pgm-1 mutant
when compared to wildtype. In this way, Plant Tracer is a promising instructional tool for biology labs to quantify
the genetics of plant movement using smartphones.
Keywords plant biology, plant movement, Plant Tracer, software, movement quantification, movement tracking,
gravitropism, circumnutation, Arabidopsis thaliana
Introduction
Time-lapse photography has proven itself to be a
promising instructional tool in biology lectures to
stimulate interest in plants, enabling student
visualization of the complexities of plant development
and movement (Fitzgerald, 2012; Hangarter, 2000;
Harrison-Pitaniello, 2013; Stark, 2008). Building
upon this technology, a plant time-lapse photography
educational lab was created where students use their
personal digital devices to record and visualize
movement in the flowering stems of the genetic model
plant, Arabidopsis thaliana (Brenner, 2017).
Arabidopsis thaliana exhibits rapid positional changes
in the inflorescence in a little more than an hour
(Brenner, 2017; Niinuma, 2005; Masson, 2002). This
active learning lab not only increased student interest
in plants but also inspired nearly half of the students to
share their smart phone derived videos with friends
and family (Brenner, 2017), effectively amplifying the
educational impact of this approach.
While this method of having students create plant
movement time-lapse movies was successful at
increasing engagement, it yielded only qualitative, not
quantitative data, hence, the development of software
that not only tracks, but also analyzes plant movement
is the logical next step for students to directly become
active in the field of plant-movement research.
Developing this method is especially useful in that
currently available plant movement-tracking software
is targeted exclusively to academic research
laboratories, thus necessitating the use of expensive
cameras, and requiring knowledge of computer coding
languages (Stolarz, 2014; Wagner, 2017; Greenham,
2015). In addition, most existing plant movement
tracking software is merely limited to examining only
one type of movement, one organ, or one species of
plant. Here we introduce a Matlab-based (MATLAB,
2015b) graphical user interface (GUI) software
program, Plant Tracer, to not only bring the
dynamism of the plant into the classroom, but also to
provide investigators with tools to analyze this

Volume 45 (3) December 2019 Guercio et al.: Plant Tracer: A Program to Quantify Plant Movement from Cellphone ………15
movement and gather quantifiable data to better
understand plant movements.
Among the fascinating and sophisticated
movements that plants make are tropisms (movement
towards or away from a stimulus), and nutations (back
and forth movements that occur with no obvious
stimulus). Time-lapse technology can capture these
movements to stimulate student engagement by
revealing this dynamism (Brenner, 2017; Fitzgerald,
2012; Harrison-Pitaniello, 2013; Hayden et al. 2011).
Gravitropism, the re-orientation of plant organs in
response to gravity has been well documented by
Charles Darwin (Darwin, 1865). Darwin hypothesized
in 1903 that the mechanism of gravitropism is
activated by the settling of mobile starch-synthesizing
organelles called statoliths in root tissue in response to
gravity, and this hypothesis was further augmented by
Zimmerman in 1924. Statoliths are easily stained and
observed in the classroom, where they are found in the
gravity sensing columella cells of the root cap (Kiss,
2000). It is still not known exactly how statoliths
initiate the gravitropic cascade, but it is theorized that
statoliths activate mechanosensitive pathways in the
actin cytoskeleton that subsequently cause the
asymmetric distribution of the major regulatory plant
hormone auxin, causing a response in the stem to bend
in reorientation against gravity (Chen, 1999;
Blancaflor, 2003; Band, 2012; Wyatt, 2013). One
strong piece of evidence that statoliths function as the,
or one of the gravity vector sensor(s), comes from the
Arabidopsis mutant, phosphoglucomutase-1 (pgm)
(Vitha, 2000; Weise, 1999). This mutant is blocked in
a key step involved in starch formation, and thereby
consequently deprived of statoliths (Weise, 1999). As
a way of easily demonstrating the role of statoliths in
shoot gravitropism, students can easily observe—
during a single class laboratory—impaired shoot
reorientation in pgm-1 compared to wildtype (Kiss
2000).
Circumnutation is another type of plant
movement. It is a complex and poorly understood
process that is universal to all plants (Darwin, 1880;
Stolarz, 2009). Circumnutation is the back-and-forth
swaying found in plant organs (Darwin, 1880; Stolarz,
2009), but little is understood about why and how it
occurs. Like all nutations, circumnutation is
influenced, but also exists independently of external
stimuli (Stolarz, 2009; Schuster, 2010).
Circumnutation is influenced by the circadian clock,
light, temperature, chemicals, organ morphology, and
age (Stolarz, 2009; Schuster, 2010; Niinuma, 2005;
Kitazawa, 2005). Circumnutation has been shown to
be influenced by gravisensing cells, auxin, ion
channels, and proton pumps but its mechanism and
purpose is not well understood (Stolarz, 2009;
Schuster, 2010; Niinuma, 2005; Kitazawa, 2005). To
engage student interest in plants, circumnutation is a
highly dynamic and intriguing process where one
nutation (back and forth motion) can be observed
within one lab period using the model genetic plant
Arabidopsis thaliana (Brenner, 2017).
With Plant Tracer students first create plant
movement footage using the application Lapse It
(http://www.lapseit.com) as described in Brenner,
2017 and then upload these time-lapse movies into
Plant Tracer (which currently runs as an executable
Matlab-originated (MATLAB, 2015b) program
available for download), in order to quantify
movement rate, and periodicity (distance moved)
during gravitropism or circumnutation. Plant Tracer
enables students to not only quantify changes in plant
movement, but also compare movement values
between different strains, mutants, and other plant
variations for scientific discovery. Here we use Plant
Tracer to demonstrate reduced movement qualities in
the Arabidopsis thaliana mutant, pgm-1, when
compared to wildtype.
Methods
Plant Tracer Software Development
Plant Tracer was developed in Matlab
(MATLAB, 2015b) and functions as an executable
program, allowing it to be downloaded without charge
and to be run independently of the base program. Plant
Tracer is installed on a personal computer running
either Mac OS or Windows operating systems.
To track Arabidopsis thaliana apex movement,
we modified the basic block matching algorithm to
detect a moving inflorescence stem apex (Fig. 1) (Lu
& Liou, 1997). This algorithm is used as a method of
locating matching blocks in a sequence of digital video
frames for the purposes of motion estimation. The
underlying assumption behind this method is that the
visual pattern of a block enclosing the apex stays
approximately the same from frame to frame. In Plant
Tracer, starting with a manually annotated block in an
initial frame, its position in the current frame is
determined by an exhaustive search, which calculates
a matching cost function between the block in the
previous frame and each candidate block in the current
frame centered at each possible location in a search
window. The candidate block with the least cost is then
chosen for the current frame, and the process continues
to the next frame.
Figure. 1. Mechanism of Block-matching Algorithm.

Volume 45 (3) December 2019 Guercio et al.: Plant Tracer: A Program to Quantify Plant Movement from Cellphone ………16
Figure. 2. Cost Function Equation.
Block matching is based on minimizing a cost
function (Fig. 2). In Plant Tracer, we have modified
the cost function of the basic block-matching
algorithm to incorporate constraints on possible apex
movements.
The cost function equation is shown where N is
block width (which is assumed to be the same as block
height), Fij and Cij are the luminance intensity values
of pixels in the current and previous blocks,
respectively. xF, xC and xP are the block center
coordinate vector in the current frame, the previous
frame, and the previous frame before that,
respectively. W2 and W3 are weighting parameters.
The first term is the mean absolute difference (MAD)
which calculates the intensity difference between two
connected frames. The second term represents the
distance the apex traveled between two frames. The
third term is the difference magnitude of the apex
movement in two successive inter-frame periods. Note
that 2 indicates the L2 norm or length of a vector. By
adding the second and third terms, we favor candidate
blocks that undergo small and smooth motion from the
previously determined blocks, among those that have
similar MAD as the previous block. Through
empirical trial and error with our testing videos, we set
W2 and W3 to 0.375 and 0.175, respectively.
To alleviate the influence of any pattern(s) on the
background on continuous tracking, we apply
background subtraction prior to the block matching
algorithm. Here we assume the background is
stationary and obtain the background image for a
frame by averaging the past 10 frames. Then, we
subtract the background image from the current frame
and threshold the difference image. For each pixel, if
the absolute value of the difference is smaller than a
threshold value, this pixel is set to 0 in the current
frame. Otherwise, the original value is kept. We then
apply the block matching algorithm on this
background-removed frame. A threshold value of 20
is found to work well (the intensity range is from 0 to
255).
Plant Culture Methods
Standard Arabidopsis cultivation methods were
performed as described according to Brenner (2017).
Seeds from the Arabidopsis thaliana genotype
Columbia (Col) as the control, and the mutant
phosphoglucomutase (pgm-1) (which can be ordered
as a “teaching kit” through the Ohio Biological
Resource Center (#CS19985)) were cultivated in 2 ½
inch (side) square plastic pots containing MetroMix
360 (Sun Grow) soil or on hydrated jiffy-7 soil pellets
(Carolina Biologicals). Water was applied to the tray
under the flat holding the plants so that water seeped
into the soil from below. In both cases plants were
fertilized with water containing Miracle Grow Bloom
Booster Flower Food fertilizer powder [NPK of 15-30-
15, with the following microelements: B (0.02%), Cu
(0.07%), Fe (0.15%), Mn (0.05%), Mo (0.0005%), and
Zn (0.06%)]) at day 10 after the seeds were sown.
Plants were cultivated for approximately 4-6 weeks
under fluorescent lights on growth carts. Light
conditions consisted of 16 hours of light and 8 hours
of dark.
Staging a Time Lapse Recording
Recordings were made using a standard portable
electronic device such as a tablet or smartphone. The
developmental stage used for this analysis is reached
when the inflorescence stem is approximately 2-6 cm
tall. At this stage the first flowers are just beginning to
undergo anthesis (flowering opening). It is important
to choose plants with only a small number of
inflorescence shoots, or ideally a single shoot. If a
plant with more than one shoot is tested for
gravitropism, it is important to avoid situating the
plant, so that one shoot might move across the path of
another shoot, leaf, or other structure, which may
cause the tracking algorithm to lose track of the
subject.
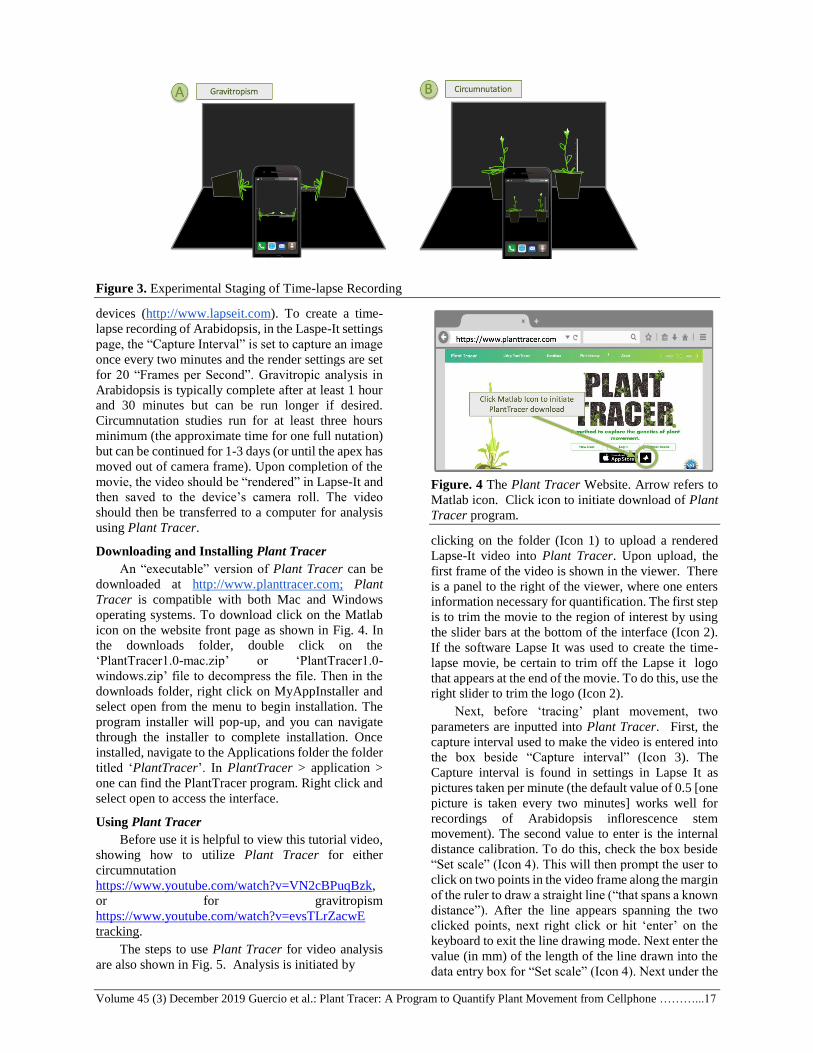
During testing of either circumnutation or
gravitropism digital recordings were made with
Arabidopsis strain Columbia, as a control vs. the pgm-
1 mutant, as shown in Fig. 3. Key materials for the
imaging set-up include a solid black background
(shown here as a black office folder), a metric ruler
(with white lettering and white increments set on a
black background for best contrast). The ruler is used
to calibrate the true distance within the movie. Labels
are placed in close proximity to the plants so that the
identity of the plant strain/genotype can be clearly
seen in the recording.
An experiment designed to measure the
movement parameters of gravitropism is initiated by
tipping the Arabidopsis plant 90 degrees to position it
on its side (Fig. 3); whereas, an experiment to measure
circumnutation is set up by simply leaving the plants
in their original upright orientation as shown in Fig. 3.
For both gravitropism and circumnutation the ruler
must be placed in the same focal plane as the apices so
as to not distort the measured values.
Making Time-Lapse Videos with Lapse-It
Lapse It is a free, simple, and publicly-available
time-lapse App compatible with Android and iOS
Volume 45 (3) December 2019 Guercio et al.: Plant Tracer: A Program to Quantify Plant Movement from Cellphone ………...17
Figure 3. Experimental Staging of Time-lapse Recording
devices (http://www.lapseit.com). To create a time-
lapse recording of Arabidopsis, in the Laspe-It settings
page, the “Capture Interval” is set to capture an image
once every two minutes and the render settings are set
for 20 “Frames per Second”. Gravitropic analysis in
Arabidopsis is typically complete after at least 1 hour
and 30 minutes but can be run longer if desired.
Circumnutation studies run for at least three hours
minimum (the approximate time for one full nutation)
but can be continued for 1-3 days (or until the apex has
moved out of camera frame). Upon completion of the
movie, the video should be “rendered” in Lapse-It and
then saved to the device’s camera roll. The video
should then be transferred to a computer for analysis
using Plant Tracer.
Downloading and Installing Plant Tracer
An “executable” version of Plant Tracer can be
downloaded at http://www.planttracer.com; Plant
Tracer is compatible with both Mac and Windows
operating systems. To download click on the Matlab
icon on the website front page as shown in Fig. 4. In
the downloads folder, double click on the
‘PlantTracer1.0-mac.zip’ or ‘PlantTracer1.0-
windows.zip’ file to decompress the file. Then in the
downloads folder, right click on MyAppInstaller and
select open from the menu to begin installation. The
program installer will pop-up, and you can navigate
through the installer to complete installation. Once
installed, navigate to the Applications folder the folder
titled ‘PlantTracer’. In PlantTracer > application >
one can find the PlantTracer program. Right click and
select open to access the interface.
Using Plant Tracer
Before use it is helpful to view this tutorial video,
showing how to utilize Plant Tracer for either
circumnutation
https://www.youtube.com/watch?v=VN2cBPuqBzk,
or for gravitropism
https://www.youtube.com/watch?v=evsTLrZacwE
tracking.
The steps to use Plant Tracer for video analysis
are also shown in Fig. 5. Analysis is initiated by
Figure. 4 The Plant Tracer Website. Arrow refers to
Matlab icon. Click icon to initiate download of Plant
Tracer program.
clicking on the folder (Icon 1) to upload a rendered
Lapse-It video into Plant Tracer. Upon upload, the
first frame of the video is shown in the viewer. There
is a panel to the right of the viewer, where one enters
information necessary for quantification. The first step
is to trim the movie to the region of interest by using
the slider bars at the bottom of the interface (Icon 2).
If the software Lapse It was used to create the time-
lapse movie, be certain to trim off the Lapse it logo
that appears at the end of the movie. To do this, use the
right slider to trim the logo (Icon 2).
Next, before ‘tracing’ plant movement, two
parameters are inputted into Plant Tracer. First, the
capture interval used to make the video is entered into
the box beside “Capture interval” (Icon 3). The
Capture interval is found in settings in Lapse It as
pictures taken per minute (the default value of 0.5 [one
picture is taken every two minutes] works well for
recordings of Arabidopsis inflorescence stem
movement). The second value to enter is the internal
distance calibration. To do this, check the box beside
“Set scale” (Icon 4). This will then prompt the user to
click on two points in the video frame along the margin
of the ruler to draw a straight line (“that spans a known
distance”). After the line appears spanning the two
clicked points, next right click or hit ‘enter’ on the
keyboard to exit the line drawing mode. Next enter the
value (in mm) of the length of the line drawn into the
data entry box for “Set scale” (Icon 4). Next under the

Volume 45 (3) December 2019 Guercio et al.: Plant Tracer: A Program to Quantify Plant Movement from Cellphone ………..18
Figure. 5 The Plant Tracer Interface. Boxed text and lines in green point out action steps in the Plant Tracer interface
to analyze a time-lapse movie of plant movement. Tasks should be completed in consecutive order from Icon 1 - Icon
8. See the video Circumnutation Tutorial at https://www.youtube.com/watch?v=VN2cBPuqBzk or Gravitropism
Tutorial at https://www.youtube.com/watch?v=evsTLrZacwE for a descriptive walk through of the Plant Tracer
program.
heading “Tracking” the user selects the plant
movement behavior of interest, either circumnutation
or gravitropism (Icon 5). Next, click on “Select Area
of Interest” (Icon 6), which enables the user to draw a
tracking rectangle on an organ, or segment of an organ
to ‘trace’. Next, the user chooses either “Select box or
path tracing” (Icon 7) to generate either a box or a
tracing line that will follow the path of movement.
Once the area of interest and movement type has been
chosen, “Press to start tracing” (Icon 8) is clicked and
Plant Tracer will automatically run the block
matching algorithm. While the computer is tracking
the moving plant the program follows the path of the
“gravitroping” or circumnutating selected object. By
clicking on “Plot graph” the data output will create a
graph revealing the x (horizontal) and y (vertical)
components along a Cartesian (x,y) grid system of the
positional changes of the object as shown in Fig. 6 A,
B. For gravitropism, the vertical direction is chosen to
measure the ascendance of the flowering stem apex.
Figure. 6 Still shots reveal progression of plant movement during Plant Tracer analysis of gravitropism and
circumnutation from Arabidopsis thaliana wildtype genotype, Columbia. Still shots demonstrate progression of
movement coupled with an x,y output plot alongside the program interface. Movement calculations include amplitude
and rate for A. vertical displacement during a gravitropism. B. horizontal displacement during circumnutation.

Volume 45 (3) December 2019 Guercio et al.: Plant Tracer: A Program to Quantify Plant Movement from Cellphone ………...19
For circumnutation, the horizontal direction is chosen
to measure the periodic back-and-forth swaying of the
flowering stem apex. The output plot values are
reported in the Plant Tracer including amplitude (mm)
and movement rate (mm/min) flowering shoot apex
(Fig. 6 A, B).
Results
Plant Tracer as a tool to measure plant movement
Plant Tracer is designed to measure plant
movement from time-lapse recordings. In order to test
the accuracy of Plant tracer, the actual distance an
Arabidopsis apex moved was hand measured and
compared to the software’s calculated output. Whilst
there are concerns about the 3-D movement of the
plant being reduced to two dimensions, analyses of
hand-measured vs Plant-Tracer computed amplitudes
and rates of movement show no significant difference
(Fig. 7).
We tested Plant Tracer to determine if it could
detect impaired movement qualities in an Arabidopsis
thaliana line that is deficient in gravitropism, the
starch mutant line phosphoglucomutase, pgm-1,
during both gravitropism and circumnutation in
comparison to wildtype, Columbia. pgm-1 has been
previously reported to exhibit a slower gravitropic
response in both movement rate and change in angle
due to a perturbation of the starch-dependent
gravisensing mechanism (17). In a pairwise
comparison of 16 control Columbia plants compared
to 16 pgm-1 mutant plants, all mutant plants were
shown to have significantly smaller amplitude of
movement and a lower movement rate during
gravitropic response (Fig. 8). Furthermore, pgm-1
mutants showed a decrease in circumnutation rate and
amplitude of horizontal movement (Fig. 8).
Fig. 7 Testing the accuracy of Plant Tracer. Comparative boxplots of hand-measured and Plant Tracer-computed
amplitude measurements. Rate measurements are not significantly different.
Discussion
Time-lapse photography is an excellent way to discern
and analyze plant movement and can encourage
student interest in plant biology. It brings the plant
world --that to many is often seen as static-- into the
relatable dynamic present. Bringing the dynamism of
plants to life makes plants more relatable and
interesting to students. Along with this the Plant
Tracer software also enables them to analyze the data
from their videos to characterize this process.
While we have begun to use this software to look
at circumnutation and gravitropism in a handful of
Arabidopsis mutant lines, we envision the flexibility
of the program to potentially measure other movement
properties in Arabidopsis and movement in other plant
species in future iterations. We have chosen
Arabidopsis because it has fast growth and movement,
when compared to other easily grown species and also
because it has tremendously rich genetic resources
which would enable the further identification of genes
that may be involved in movement processes (23). In
addition, Arabidopsis is easily grown indoors and is
highly suited for classroom studies (10, 23). Currently
we are working to create a version of Plant Tracer that
will operate independently on the smartphone, which
we believe will dramatically increase userability
among students (a beta test version of App can be
download from www.planttracer.com). The
development of Plant Tracer in Matlab is the first step

Volume 45 (3) December 2019 Guercio et al.: Plant Tracer: A Program to Quantify Plant Movement from Cellphone ………20
towards our ultimate goal of constructing a hand-held
App. Through the use of Plant Tracer we aim to
expose these dynamic processes to a wider audience,
as well as give students the opportunity to easily
perform novel experiments and make original
discoveries in the field of plant movement.
Fig. 8 Comparative analyses between pgm-1 vs. Wildtype Columbia Arabidopsis lines. Boxplots show median value
differences and 1st to 4th quartile differences between medians Columbia (yellow) vs. pgm-1 starch mutant (green)
lines after repeated tests (n=16, n=16). Asterisks indicate a significant difference in median values obtained via
Student’s t-test. One asterisk indicates p<0.05, two p<0.005, and three p<0.0005 A. Amplitude and rate of vertical
displacement (gravitropism) B. Amplitude and rate of horizontal displacement (circumnutation).
Acknowledgements
We would like to thank the National Science
Foundation for support from IUSE Grant #1611885.
We would also like to thank Morey Grebb for critical
comments on manuscript text.
References
BAND, L. 2012. Root gravitropism is regulated by a
transient lateral auxin gradient controlled by a tipping-
point mechanism. PNAS 109(12): 4668-4673.
BLANCAFLOR, E. 2003. Plant Gravitropism:
Unraveling the Ups and Downs of a Complex Process.
Plant Phys. 133(4): 1677-1690.
BRENNER, E.D. 2017. Smart Phones for Teaching
Plant Movement. American Biology Teacher 79: 740-
745.
CHEN, R. 1999. Gravitropism in Higher Plants. Plant
Phys. 120(2): 343-350.
DARWIN, C. 1880. The Power of Movement in
Plants. London: John Murray.
DARWIN, C. 1865. On the movements and habits of
climbing plants. Journal of the Linnean Society of
London (Botany) 9: 1-118.
DARWIN, C. 1903. The Statolith Theory of
Geotropism. Nature. 67: 571-572.
FITSGERALD, A. 2012. Science in Primary Schools:
Examining the Practices of Effective Teachers. Sense
Publishers 76: 43-47.
GREENHAM, K. et al. 2015. TRiP: Tracking
Rhythms in Plants, an automated leaf movement
analysis program for circadian period estimation. Plant
Methods 11: 33
HANGARTER, R. P., INDIANA UNIVERSITY.
2000.Plants-In-Motion.
http://plantsinmotion.bio.indiana.edu

Volume 45 (3) December 2019 Guercio et al.: Plant Tracer: A Program to Quantify Plant Movement from Cellphone ………21
HARRISON-PITANIELLO, M. 2013. Using Student-
Produced Time-Lapse Plant Movies to communicate
concepts in Plant Biology. J Microbiol Educ. 14(1):
101-102.
HINCHCLIFFE, E.H. 2005. Using long-term time-
lapse imaging of mammalian cell cycle progression for
laboratory instruction and analysis. Cell Biol Educ.
4(4): 284-90.
KISS, J. 2000. Mechanisms of the early phases of
plant gravitropism. CRC Crit Rev Plant Sci. 19(6):
551-73.
KITAZAWA, D. 2005. Shoot circumnutation and
winding movements require gravisensing cells. PNAS
102(51): 18742-18747
LapseIt. http://www.lapseit.com.
LU, J. AND M. LIOU. 1997. A Simple and Efficient
Search Algorithm for Block-Matching Motion
Estimation. IEEE Trans. Circuits And Systems For
Video Technology 7(2): 429–433.
MASSON, P. 2002. Arabidopsis thaliana: A Model for
the Study of Root and Shoot Gravitropism.
Arabidopsis Book 1: ee043
MATLAB and Statistics Toolbox Release 2015b, The
MathWorks, Inc., Natick, Massachusetts, United
States
NIINUMA, K. 2005. Circadian Rhythm of
Circumnutation in Inflorescence Stems of
Arabidopsis. Plant Cell Phys. 46(8): 1423–1427.
SCHUSTER, J. 2010. Circumnutations of Arabidopsis
thaliana Seedlings. Biological Rhythm Research 422-
440.
STARK, L. A. 2008. Plant movements revealed. CBE
life sciences education 7: 284-287
STOLARZ, M. 2009. Circumnutation as a visible
plant action and reaction. Plant Signal Behavior 4(5):
380-387.
STOLARZ, M. et al. 2014. Circumnutation Tracker:
novel software for investigation of circumnutation.
Plant Methods 10: 24
UNO, G. E. 2009. Botanical literacy: What and how
should students learn about plants? American journal
of botany 96: 1753-1759.
VITHA, S. 2000. Interaction of root gravitropism and
phototropism in Arabidopsis wild-type and starchless
mutants. Plant Phys. 122(2): 453-562.
WAGNER, L. et al. 2017. The plant leaf movement
analyzer (PALMA): a simple tool for the analysis of
periodic cotyledon and leaf movement in Arabidopsis
thaliana. Plant Methods 13: 2
WANDERSEE, J. AND E. SCHUSSLER. 1999.
Preventing plant blindness. American Biology
Teacher 61: 82-84.
WEISE, S. 1999. Gravitropism of inflorescence stems
in starch-deficient mutants of Arabidopsis. Int J Plant
Sci. 160(3): 521-527.
WILLIAMS, M. 2011. Why Study Plants? Teaching
Tools in Plant Biology: Lecture Notes. The Plant Cell
doi/10.1105/tpc.109.tt1009.
WYATT, S. E., KISS, J. Z. (2013) Plant Tropisms:
From Darwin to the International Space
Station. American Journal of Botany 100:1-3
ZIMMERMAN, W. 1924. Ueber die langsangreifende
Schwerkraft und das Sinusgesetz. I. II. Ber. Deut. Bot.
Ges. 42: 39.
Volume 45 (3) December 2019 Ondarza The Color of Survival: An Inquiry-based Interdisciplinary Study of Bacterial ………..22
The Color of Survival: An Inquiry-based Inter-disciplinary Study of
Bacterial Pigments
José de Ondarza, Ph.D.
Department of Biological Sciences, SUNY Plattsburgh, Plattsburgh NY 12901
Abstract. Pigments are light-absorbing substances that are abundant in nature, serving roles in coloration,
camouflage, mate/pollinator attraction and photosynthesis among higher life forms. Among microbial
organisms, pigments can also be found in a wide range of phyla. While some of these pigments function
in photosynthesis, namely among algae and some bacteria, the great majority of microbial pigments play
entirely different roles. The exploratory study presented here will stimulate students to think about the
cost and benefit of a heritable trait (pigment production) of microscopic organisms and its effects on
survival in a competitive and hostile environment. Exploring and understanding the roles these pigments
play allows for a number of cross-disciplinary learning opportunities that combine physics, chemistry,
biology and even art, and can be set up as an inquiry-based learning module suitable for small-group and
active learning experiences.
Keywords: Interdisciplinary; inquiry-based; bacterial pigments; microbiology; physics
Introduction
Pigment production in bacteria. If you have ever
had the opportunity to grow bacteria in a classroom,
you will likely have noticed that these microbes can be
surprisingly colorful. I am fascinated by the colors
produced by bacteria, both in teaching undergraduate
microbiology and through my own research. Many
bacteria have the ability to produce pigmentation,
spanning the spectrum of color from dark purple to
yellow. Pigments include violacein (purple),
prodigiosin (red), carotenoids (orange-yellow),
fluorescein (greenish-yellow), and pyocyanin (blue-
green). Colorful bacteria can be isolated from many
common sources, including soil, water and human
skin. The frequency with which such pigmented
bacteria can be isolated from environmental samples
suggests that pigments must play an important role,
since each pigment requires enzymatic pathways to
synthesize them that can be quite complex and
therefore costly. The production of prodigiosin by
Serratia marcescens, for instance, requires more than a
dozen different enzymes (Harris et al., 2004)! Have
you ever wondered what function these pigments
really play?
The following is an inquiry-based approach to
studying pigments that can be used in diverse settings,
including non-majors biology, ecology, chemistry,
and physics courses as well as general microbiology
classes. The above-mentioned question is an excellent
starting point for having students think about science
at multiple levels, including structure – function
relationships, heritability and expression of biological
traits, natural selection and the cost/benefit of pigment
production, physical and chemical properties of
pigments, and so on.
Pigment studies as an inter-disciplinary STEM
project. Although the most obvious questions about
bacterial pigments relate to their biological role, don’t
miss the opportunity to delve into inter-disciplinary
ideas! Pigments are often quite complex chemical
compounds composed of one or more cyclic
hydrocarbon skeletons. The spectrum of light that is
absorbed by a pigment (a.k.a. its absorption spectrum),
and hence its color, depends on the chemical structure
of the pigment, and changes to this structure can
change the color. Use this pigment study to integrate
concepts of organic chemistry and physics of light into
your class. Likewise, the calculations of dilutions and
bacterial numbers integrate math skills.
An inquiry-based learning module using
pigmented bacteria
Do bacterial pigments have a purpose beyond the
merely decorative? Your students are sure to have
some good ideas. An open-ended group discussion is
going to produce a variety of possible answers, many
of which are testable in a class setting. The following
sequence of hands-on activities can be adapted to your
classroom setting by selecting those for which you
have the time and resources available. Alternatives are
suggested at each level, and detailed protocols
included at the end of this article. Although students
should be encouraged to come up with their own ideas,
prior lessons or readings could be used to suggest
some possibilities, namely that bacteria produce
pigments for: 1) photosynthesis, 2) antibiotic
properties, 3) UV/light protection, 4)
competition/predation protection and 5) as
antioxidants. Water samples often contain
cyanobacteria (‘blue-green algae’) whose green
pigmentation consists of chlorophyll.

Volume 45 (3) December 2019 Ondarza The Color of Survival: An Inquiry-based Interdisciplinary Study of Bacterial ………..23
Chromobacterium violaceum and other purple-
pigmented bacteria can be isolated from water and soil
samples (Agate et al., 2016), and its deep purple
pigment (violacein) has antibiotic (Durán & Menck,
2001) and anti-oxidant properties (Konzen et al.,
2006) and protects against predation (Matz et al.,
2004). Other pigments protect bacteria from harmful
photodamage (Rajagopal et al., 1997). Soil and water
samples may contain Pseudomonas, whose blue-green
pyocyanin pigment is a factor in causing infections
(Lau et al., 2004), as is Staphylococcus aureus’ golden
pigment (Liu et al., 2005). Serratia marcescens’
prodigiosin (red) has anti-microbial, energy-spilling,
and cancer-killing properties (Williamson et al., 2006;
Haddix et al., 2008; Vijayalakshmi & Jagathy, 2016).
Yellow, orange, pink and red pigments are common
among Micrococcus species (Fig. 2) and may be anti-
microbial or protect them from oxidants and radiation
(Arrage et al., 1993; Mohammadi et al., 2012; Mohana
et al., 2013; Rostami et al., 2016).
pigment source Color Putative functions
Prodigiosin Serratia marcescens Red Antibiotic, energy management
Violacein Chromobacterium violaceum Purple Anti-microbial, antioxidant
Carotenoid Micrococcus luteus Yellow UV absorption
Carotenoid Micrococcus agilis Red ?
Pyocyanin Pseudomonas aeruginosa Green/blue Virulence
Carotenoid Micrococcus nishiominensis Orange ?
Staphyloxanthin Staphylococcus aureus Golden virulence
Canthaxanthin Micrococcus roseus Pink antimicrobial?
Table 1. Bacterial pigments and some of their putative functions. Citations are given in the text that follows.
A. Isolation of naturally occurring pigment-
producing bacteria. You may wish to start by having
your students culture bacteria from soil, water, or skin
swabs, having students “discover” these colorful
bacteria as they go along. Alternatively, many of the
pigmented bacteria can be purchased from biological
supply companies. You can easily isolate and grow
pigment producers from soils, water, air, plants, and
human skin through a simple swab inoculation or
streak plating of samples on agar (Fig. 1). Once
students have grown their own bacterial colonies, have
them compare plates to select the most colorful
colonies.
Figure 1. Bacterial colonies from a water sample
growing on agar include many pigmented species.
B. Functions of pigments. Once students have the
opportunity to observe colorful bacteria, you can have
them come up with hypotheses about their function.
Some good questions to start a discussion may be:
How common are pigmented bacteria (as a
percentage of the entire population)?
Which colors predominate?
Why do you think bacteria produce pigments?
Figure 2. A palette of pigmented bacteria, clockwise
from bottom: Micrococcus (yellow, orange, pink and
red), Serratia (dark red) and Chromobacterium
(purple)
Although not all ideas that students are likely to
come up with are testable, many can be investigated

Volume 45 (3) December 2019 Ondarza The Color of Survival: An Inquiry-based Interdisciplinary Study of Bacterial ………..24
and will make for a colorful lesson! Alternately, you
can provide readings for students to explore and
discuss. The summary above includes many references
that can serve as a starting point.
C. Preparing pure cultures of bacteria. To study
pigments, bacteria must first be grown in quantity as a
pure culture; either an agar plate or liquid medium can
be used. Have your class work in groups to prepare
cultures of growth medium each containing a
different-colored microbe. These cultures can be used
to extract pigments, paint pictures on agar (Fig. 3), or
study pigment functions. By observing cultures under
different conditions, students can study the effect of
temperature, light, or nutrients on color development.
You can also freeze portions of these for future use.
Figure 3. Agar plate with bacterial growth illustrates
the beauty of bacterial pigmentation
D. Extraction and analysis of pigments. Your
students can now extract the pigments from the cells
using solvent extraction. The solvent to be used
depends on the type of pigment (Dunn et al., 2004).
The extracted pigments can be analyzed with a
spectrophotometer by measuring the amount of light
absorbed at different wavelengths (absorption
spectrum; Fig. 4). Each pigment’s absorption
spectrum is unique and can help identify specific
bacteria (Sahin, 2011).
E. Examining pigment function in bacteria. Some
of the possible roles of pigments can be studied in the
laboratory with minimal resources, such as
antimicrobial properties and UV light resistance.
Other interesting concepts you can tie in to your
lessons include quorum sensing, a phenomenon where
pigment production in Serratia and Chromobacterium
requires a certain cell number, or “quorum”, to take
place (Mcclean et al., 1997; Van Houdt et al., 2007);
temperature-dependent pigment production (Serratia
produces pigment only below 35°C; competition
(many pigmented bacteria out-compete non-
pigmented rivals); and predation.
F. The physics and chemistry of light and color.
Interwoven with the chemical and biological
aspects of pigmentation is the understanding of
how light works. The visible spectrum of light
consists of a range of wavelengths (400 – 700 nm)
which, when impinging on a molecule, may be
absorbed, reflected or transmitted. Wavelengths which
are absorbed or reflected by an object determine the
color that is perceived by the human eye; in the case
of chlorophyll, those reflected wavelengths are
predominantly green light, hence the color of most
plants. In other cases, it is the complementary color of
the absorbed wavelength that is seen. The chemical
structure of pigments determines the wavelengths that
are absorbed, and is influenced by chemical bonds,
pH, and molecular size (see Clark, 2019 in the online
resources section).
G. A place for math. While all of the experiments can
be set up for students, don’t miss the opportunity to
engage them in the calculations they may need to
perform. Serial dilutions are a frequent necessity in
microbiology as the number of bacteria in samples
often measures in the billions. Calculating dilution
factors and using scientific notation are incorporated
into this exercise. Analyzing and graphing data, even
if done using software, builds analytical skills such as
scaling, normalizing data, and comparing populations
using statistical tests.
Procedure
Protocols for culturing and analyzing pigmented
bacteria. Whether using bacteria for artistic or
scientific experiments, here are a few protocols to get
you started. Students should always practice safe
laboratory techniques when handling bacteria – handle
these soil/water bacteria as if they were hazardous,
even if they are perfectly safe. Sterilize and dispose of
all cultures properly after the experiments are done.
Materials needed for a class of 24
General: per group: Bunsen burner or bacticinerator;
inoculating loops; 100 ul and 1 ml micropipettors and
pipette tips; balance; weigh paper
Soil culturing: Saline solution (9 g sodium chloride in
1 L distilled water), 3 Erlenmeyer flasks (250 ml size),
stoppers or tin foil, 24 Trypticase Soy Agar (TSA)
plates (can be purchased pre-made), sterile screw-cap
test tubes for collecting soil
Skin Swabs: 24 TSA plates, 24 sterile cotton swabs,
100 ml sterile saline or water
Lake or stream water: 24 TSA plates, sterile bottles
for collecting water sample
Pure culture study: 24 TSA plates, pure cultures of
Chromobacterium violaceum, Micrococcus luteus,

Volume 45 (3) December 2019 Ondarza The Color of Survival: An Inquiry-based Interdisciplinary Study of Bacterial ………..25
Micrococcus roseus, Micrococcus agilis,
Pseudomonas putida, Pseudomonas aeruginosa,
Rhodospirillum rubrum, and/or Serratia marcescens
Spectrophotometry: 100 ml of various solvents
(ethanol, acetone, methanol or isopropanol), screw-
cap tubes, spectrophotometer, cuvettes. Solvents
should be selected based on availability, safety, and
effectiveness. While we have found methanol to be
most effective, other less toxic solvents such as
acetone can also give satisfactory results (Fig. 4).
Pigment extraction may be more effective at different
concentrations of solvents (70 – 100%).
Figure 4. Absorption spectrum of pigment isolated from a red soil bacterium after extraction with methanol, ethanol
or isopropanol.
Protocols
Sterilization. Sterilize all liquids and pipettes by
autoclaving for 20 minutes at 121°C at 15 psi pressure.
Alternately, pre-sterilized solutions and media may be
purchased. Glassware can be heat-sterilized (2h at
160°C). Surfaces as well as stoppers can be adequately
disinfected with 70% ethanol.
Culturing soil samples. Since bacteria are
abundant in soils, a dilution is necessary to avoid
having all the colonies grow into each other. Weigh
out 1 gram of soil and add it to 99 ml of sterile saline
solution. Stopper the flask and shake vigorously for 1
minute. Using a sterile pipette, remove 1 ml from this
flask and add it to a second 99 ml flask of saline.
Stopper the flask and shake vigorously for 1 minute.
Transfer 1 ml from flask #2 to a third flask, stopper the
flask and shake vigorously. Students now have 3
dilutions available: Flask #1 (1:100 or 10-2), Flask #2
(1:10,000 or 10-4), and Flask #3 (1:1,000,000 or 10-6).
Add 1.0 ml of dilution #3 to the surface of an agar plate
and spread out the water sample using a bent (L-
shaped) glass rod sterilized in ethanol or boiling water.
The agar plates should be taped shut and allowed to
incubate at room temperature for 2 – 7 days.
Culturing water samples. Most lake, pond or stream
samples contain far fewer bacteria per ml than soils,
and 0.1 – 1.0 ml of the water sample can be placed
directly onto the surface of an agar plate. Samples are
spread out and incubated as noted above.
Culturing skin bacteria. Moisten a sterile cotton
swab by dipping it into a beaker of sterile water or
saline solution. Vigorously rub the swab over a 2 cm x
2 cm area of skin (forearm works nicely) and, with
gentle pressure, rub and roll the swab over the surface
of a TSA plate. Incubate 2 – 7 days at room
temperature.
Culturing commercial strains of bacteria. Chromobacterium violaceum, Micrococcus luteus,
Micrococcus roseus, Micrococcus agilis,
Pseudomonas putida, Pseudomonas aeruginosa,
Rhodospirillum rubrum, and Serratia marcescens can
be purchased from Biological Supply companies such
as Presque Isle Cultures (Erie, PA). These cultures will
be shipped in agar slant tubes and will be ready for use.
Aseptic transfer of bacteria to the agar plate is done
with inoculating loops. Metal loops are heated
(Bunsen burner or bacticinerator) for 10 seconds to
sterilize them before and after transfers. Alternatively,
pre-sterilized plastic loops can be purchased and

Volume 45 (3) December 2019 Ondarza The Color of Survival: An Inquiry-based Interdisciplinary Study of Bacterial ………..26
disposed of when done. The bacteria picked up with
one loop are sufficient for an experiment. Transfer the
bacteria to their agar plate and coat from ¼ to ½ of the
agar plate surface with each strain selected. Incubate
the plates for 2 – 7 days at room temperature.
Producing pure cultures from environmental
samples. Once the individual colonies of bacteria
from soil, water, or skin have grown to a size of 1 – 5
mm (see Fig. 1), select one colony of interest. Describe
the colony (color, size, shape). Using an inoculating
loop, carefully transfer part of the colony to a sterile
agar plate as described above. Incubate for 2 – 7 days
at room temperature. After incubation, examine the
plate carefully to ensure that only the desired bacteria
are growing on this plate.
Painting with bacteria. For each “color”
(pigmented bacterial strain) and group of students, add
10 ml of 0.9% saline to sterile screw-cap test tubes.
Using a sterile inoculating loop, add 3 loops of a pure
bacterial culture (bought or prepared as described
above) to a tube, tightly seal the tube with the screw
cap and shake well to mix. You may wish to prepare
larger volumes to divide up your stock into test tubes
for several lab groups to use. Label flasks and tubes.
Allow each student to ‘paint’ on a sterile agar plate
using two or more ‘colors’. Remind students to use a
different loop for each culture. Seal each agar plate
with tape and incubate the plates for up to one week at
room temperature. At the end of the class, collect
bacterial culture flasks and tubes and sterilize.
Particularly creative artwork can be submitted to the
annual Agar Art contest (see online resources).
Panel A Panel B
Panel C Panel D
Figure 5. Absorption spectra of pigments isolated from Chromobacterium violaceum (A), Micrococcus agilis (B),
Sporosarcina ureae (C) and Micrococcus roseus (D).

Volume 45 (3) December 2019 Ondarza The Color of Survival: An Inquiry-based Interdisciplinary Study of Bacterial ………..27
Spectrophotometry. Add 5 ml of solvent to a sterile
screw-cap tube. Solvents should be selected based
availability, safety and disposal considerations, and
effectiveness (often based on the lipid solubility of the
pigment). Suggested solvents include acetone (80% or
100%), ethanol (70%, 95% or 100%), methanol
(100%), or isopropanol (70% or 95%). Once sufficient
bacterial growth is observed on the pure culture plate,
transfer a pea-sized clump of cells (~ 1 g) of the culture
into the solvent by scraping the agar surface with a
sterile inoculating loop. Several loop transfers may be
necessary. Cap the tube and shake or vortex (if a
vortexer is available) for 5 minutes until the pigment
is well dissolved in the solvent. Water-soluble
pigments will easily dissolve in alcohols, but lipid-
soluble pigments may require chloroform, benzene or
other non-polar solvents. Additional disruption of cells
may help release pigment, including mashing the cells
with a mortar or using sonication. Turn on the
spectrophotometer 15 minutes before taking
measurements. Follow the manufacturer’s instructions
for calibrating and using the instrument. Most
spectrophotometers accept 13 mm x 30 mm cuvettes.
One such cuvette should be filled with pigment-free
solvent used in the extraction. This cuvette can be
shared among lab groups and is used to calibrate the
baseline (zero) absorbance before each reading and at
each wavelength. Take the first absorbance reading at
the lowest wavelength allowed by the instrument
(usually ~ 350 nm) and take readings in increments of
10 nm, up to the maximum of ~ 700 nm (Fig. 5). Some
instruments will automatically scan the entire
spectrum, allowing more rapid data collection. If
compatible with data collection software such as
LoggerPro, data will be saved and graphed
automatically. Other skills that can be practiced here
include graphing, comparison of the spectra of several
different-colored bacteria, and normalizing data
relative to each spectrum’s maximum value. This will
allow students to understand the difference between
absorbed and reflected light and to better discuss the
role of pigments in biological process such as
photosynthesis.
Further studies
Although brief in nature, the following ideas can
easily be adapted to your classroom setting, and we
have tested and tried these ideas already.
Antibiotic properties. A simple test of the antibiotic
potential of the pigment can be carried out using the
Kirby-Bauer method (Bauer et al., 1966) with the
pigment extract. Transfer 5 ml of the pigmented
solvent to a clean test tube. Place 6 small paper disks
(I use the cardboard backing from notepads and a
single hole-punch, then sterilize the disks in an
autoclave) into the tube and allow the solvent to
evaporate – this may take several days. Place each
dried paper disk on an agar plate inoculated with
Escherichia coli or Staphylococcus aureus and observe
the plates for the absence of growth around the paper
disk. Suitable controls should be conducted with
solvent-exposed disks.
Study of pigment-less mutants. The importance of
the pigments can be further studied by using non-
pigmented mutants. Pigmented bacteria are suspended
in 10 ml of 0.9% NaCl and then exposed to UV light
for 1 – 5 minutes. 1,000,000-fold dilutions are spread
on Petri plates and cultured in an attempt to find non-
pigmented mutants. Using this approach, we were able
to isolate mutant strains of M. roseus, P. putida and
soil bacteria (Fig. 6). Such mutants can also be used in
a genetic analysis of the pigment-synthesizing
pathways (Schmidt, 1993). Non-pigmented mutant
strains are also available from researchers who are
often willing to provide such cultures for teaching
purposes, and some bacteria (e.g. Serratia) will be non-
pigmented at temperatures above 35°C.
Panel A
Panel B
Panel C
Figure 6. Pigmented bacteria and non-pigmented
mutant strains obtained by UV exposure. (A) Red soil
bacteria (unidentified), (B) Pseudomonas putida, (C)
Micrococcus roseus.

Volume 45 (3) December 2019 Ondarza The Color of Survival: An Inquiry-based Interdisciplinary Study of Bacterial ………..28
Protection from UV light or chemicals. To evaluate
the importance of pigmentation in protecting bacteria
from oxidative stress, UV radiation or other
challenges, pigmented and unpigmented strains of the
same species can be subjected to UV light (Fig. 7),
ozone (de Ondarza, 2017), hydrogen peroxide or
antiseptics/disinfectants. This experiment will require
good dilution skills and enumeration of surviving
bacteria.
Figure 7. Effect of UV irradiation on survival of pigmented and non-pigmented (mutant strain) bacteria.
Safety considerations. The bacterial strains selected
for this study are generally harmless to human health.
Nonetheless, many bacteria are opportunistic
pathogens and may cause an infection if in contact
with a scratch or open wound. Students should handle
all bacteria with the utmost caution. Lab benches
should be disinfected before and after class with
commercially available disinfectants. Students should
wash their hands and wear protective gloves, lab coats
and goggles. Absolutely no mouth pipetting, eating or
drinking should be allowed.
Disposal. All biological materials and disposable
objects that came in contact with them (agar plates,
plastic pipettes, plastic loops, paper towels, filter
paper) should be disposed of in a large biohazard bag.
Seal the bag and sterilize by autoclave. (Other
arrangements may be available to you for the safe
disposal of biohazard materials). Disposal of solvents
usually requires special arrangements, such as
flammable waste containers.
Discussion
As science and scientific research become more
specialized and focused, we often miss out on the
inter-disciplinary nature of most biological studies and
experimentation. By designing projects to
intentionally include lessons in other disciplines such
as physics, chemistry and ecology, students can be
engaged in multiple ways while gaining a deeper
understanding of the ways different STEM disciplines
interact. Some of the most insightful ideas in my
classroom have come from students outside of the
traditional Biology curriculum, including art,
education, history, nutrition and physics. Bacterial
pigments are ideally suited to such inter-disciplinary
projects; they are at once visually enticing and
generate curiosity. Bacteria that produce pigments are
readily isolated from natural habitats such as soil and
water and even the human body and can be cultured
with very little material and equipment. The potential
to engage students in “living art” through painting
pictures on agar plates is stunningly illustrated by the
many entries into the annual Agar Art contest of the
American Society for Microbiology. Pigments from
bacteria are extracted with minimal difficulty or
expense and allow for further study of their possible
function. Mostly, having students discuss the “why” of
bacterial pigments engages them in the physics of light
absorption, the energy cost of biosynthesis, the
potential selective advantage of a biological trait, the
ecological interactions (predation, antibiosis)
involved, and the chemistry of complex pigments. A
learning module that incorporates lessons in physics,
chemistry, biology and ecology can be implemented
over a 3-4-week span in one class or even engage
instructors and courses outside of biology in a
common-problem project.

Volume 45 (3) December 2019 Ondarza The Color of Survival: An Inquiry-based Interdisciplinary Study of Bacterial ………..29
Acknowledgements
I wish to acknowledge the contributions of former
undergraduate students Dawn Lavene and Ryosuke
Suzuki for their work on the pigment project in my lab.
References
AGATE, LARRA, DEBORAH BEAM, COLLEEN
BUCCI, YEGOR DUKASHIN, RANEEM JO’BEH,
et al. 2016. The search for violacein-producing
microbes to combat batrachochytrium dendrobatidis: a
collaborative research project between secondary
school and college research students. Journal of
Microbiology and Biology Education 17 (1):70-73
doi: 10.1128/jmbe.v17i1.1002
ARRAGE, A. A., T. J. PHELPS, R. E. BENOIT, AND
D. C. WHITE. 1993. Survival of subsurface
microorganisms exposed to UV radiation and
hydrogen peroxide. Applied and Environmental
Microbiology 59 (11):3545.
BAUER, A. W., W. M. KIRBY, J. C. SHERRIS, AND
M. TURCK. 1966. Antibiotic susceptibility testing by
a standardized single disk method. Am J Clin Pathol
45 (4):493-6.
DE ONDARZA, JOSÉ. 2017. Ozone Sensitivity and
Catalase Activity in Pigmented and Non-Pigmented
Strains of Serratia marcescens. 11:12-22. doi:
10.2174/1874285801711010012.
DUNN, JODIE L., JOHANNA D. TURNBULL, AND
SHARON A. ROBINSON. 2004. Comparison of
solvent regimes for the extraction of photosynthetic
pigments from leaves of higher plants. Functional
Plant Biology 31 (2):195-202.
DURÁN, NELSON, AND CARLOS F. M. MENCK.
2001. Chromobacterium violaceum: A Review of
Pharmacological and Industiral Perspectives. Critical
Reviews in Microbiology 27 (3):201-222. doi:
10.1080/20014091096747.
HADDIX, PRYCE L., SARAH JONES, PRATIK
PATEL, SARAH BURNHAM, KAORI KNIGHTS et
al. 2008. Kinetic Analysis of Growth Rate, ATP, and
Pigmentation Suggests an Energy-Spilling Function
for the Pigment Prodigiosin of Serratia marcescens.
Journal of Bacteriology 190 (22):7453. doi:
10.1128/JB.00909-08.
KONZEN, MARLON, DANIELA DE MARCO,
CLARISSA A. S. CORDOVA, TIAGO O. VIEIRA,
REGINA V. ANTÔNIO et al. 2006. Antioxidant
properties of violacein: possible relation on its
biological function. Bioorganic & medicinal
chemistry 14 (24):8307-8313.
LAU, GEE W., DANIEL J. HASSETT, HUIMIN
RAN, AND FANSHENG KONG. 2004. The role of
pyocyanin in Pseudomonas aeruginosa infection.
Trends in Molecular Medicine 10 (12):599-606. doi:
10.1016/j.molmed.2004.10.002.
LIU, GEORGE Y., ANTHONY ESSEX, JOHN T.
BUCHANAN, VIVEKANAND DATTA, HAL M.
HOFFMAN et al. 2005. Staphylococcus aureus golden
pigment impairs neutrophil killing and promotes
virulence through its antioxidant activity. The Journal
of Experimental Medicine 202 (2):209. doi:
10.1084/jem.20050846.
MATZ, CARSTEN, PETER DEINES, JENS
BOENIGK, HARTMUT ARNDT, LEO EBERL et al.
2004. Impact of Violacein-Producing Bacteria on
Survival and Feeding of Bacterivorous
Nanoflagellates. Applied and Environmental
Microbiology 70 (3):1593. doi:
10.1128/AEM.70.3.1593-1599.2004.
MCCLEAN, K. H., M. K. WINSON, L. FISH, A.
TAYLOR, S. R. CHHABRA et al. 1997. Quorum
sensing and Chromobacterium violaceum:
exploitation of violacein production and inhibition for
the detection of N-acylhomoserine lactones.
Microbiology 143 ( Pt 12):3703-11. doi:
10.1099/00221287-143-12-3703.
MOHAMMADI, MOJTABA, LINDSEY
BURBANK, AND M. CAROLINE ROPER. 2012.
Biological Role of Pigment Production for the
Bacterial Pantoea stewartii. Applied and
Environmental Microbiology 78 (19):6859. doi:
10.1128/AEM.01574-12.
MOHANA, DEVIHALLI CHIKKAIAH,
SREERANGEGOWDA THIPPESWAMY, AND
UMESH RAYASANDRA ABHISHEK 2013.
Antioxidant, antibacterial, and ultraviolet-protective
properties of carotenoids isolated from Micrococcus
spp. Radiation Protection and Environment 36
(4):168-174.
RAJAGOPAL, LAKSHMI, C. SIVAKAMA
SUNDARI, D. BALASUBRAMANIAN, AND
RAMESH V. SONTI. 1997. The bacterial pigment
xanthomonadin offers protection against
photodamage. FEBS Letters 415 (2):125-128. doi:
10.1016/S0014-5793(97)01109-5.
ROSTAMI, HOSSEIN, HASSAN HAMEDI, AND
MAHMOUD YOLMEH. 2016. Some biological
activities of pigments extracted from Micrococcus
roseus (PTCC 1411) and Rhodotorula glutinis (PTCC
5257). International Journal of Immunopathology and
Pharmacology 29 (4):684-695. doi:
10.1177/0394632016673846.
SAHIN, NURETTIN. 2011. Significance of
absorption spectra for the chemotaxonomic
characterization of pigmented bacteria. Turkish
Journal of Biology 35 (2):167-175.

Volume 45 (3) December 2019 Ondarza The Color of Survival: An Inquiry-based Interdisciplinary Study of Bacterial ………..30
SCHMIDT, ELISE V. 1993. Genetic control of cell
chemistry using Serratia marcescens. In Proceedings
of the 14th Workshop/Conference of the Association
for Biology Laboratory Education (ABLE), edited by
C.A. Goldman, 21-34.
VAN HOUDT, R., M. GIVSKOV, AND C. W.
MICHIELS. 2007. Quorum sensing in Serratia.
FEMS Microbiol Rev 31 (4):407-24. doi:
10.1111/j.1574-6976.2007.00071.x.
VIJAYALAKSHMI, K, AND K JAGATHY. 2016.
Production of prodigiosin from Serratia marcescens
and its antioxidant and anticancer potential. 3 (3):75-
88.
WILLIAMSON, N. R., P. C. FINERAN, F. J.
LEEPER, AND G. P. SALMOND. 2006. The
biosynthesis and regulation of bacterial prodiginines.
Nat Rev Microbiol 4 (12):887-99. doi:
10.1038/nrmicro1531.
ONLINE RESOURCES
AMERICAN SOCIETY FOR MICROBIOLOGY.
2019. Agar Art. Accessed from
https://www.asm.org/Events/2019-ASM-Agar-Art-
Contest/Home on July 31, 2019.
CLARK, JIM. 2019. What causes molecules to absorb
UV and visible light. Accessed from
https://chem.libretexts.org/Bookshelves/Physical_and
_Theoretical_Chemistry_Textbook_Maps/Supplemen
tal_Modules_(Physical_and_Theoretical_Chemistry)/
Spectroscopy/Electronic_Spectroscopy/Electronic_S
pectroscopy_Basics/What_Causes_Molecules_to_Ab
sorb_UV_and_Visible_Light on July 30, 2019.
HADDIX, P.L. AND T.F. WERNER.
Spectrophotometric Assay of Gene Expression:
Serratia marcescens Pigmentation. Accessed from
http://papa.indstate.edu/amcbt/volume_26/v26-4p3-
13.pdf on July 16, 2019.
THE PHYSICS CLASSROOM. 2019. Light
Absorption, Reflection and Color.
https://www.physicsclassroom.com/class/light/Lesso
n-2/Light-Absorption,-Reflection,-and-Transmission
on July 30, 2019.
UNIVERSITY OF MARYLAND. 2019. Viable plate
count, or…how to count to a million. Accessed from
https://mathbench.umd.edu/modules/microbio_serial-
dilution/page01.htm on July 31, 2019.

Volume 45 (3) December 2019 Stover Using Student Generated Press Releases in a Vertebrate Physiology Course …………...31
Using Student-generated Press Releases in a Vertebrate Physiology
Course to Enhance Scientific Communication Skills
Shawn K. Stover
Department of Biology & Environmental Science,
Davis & Elkins College, 100 Campus Drive, Elkins, WV 26241
Abstract: This article describes an activity designed to hone students’ lay communication skills. After carefully
analyzing journal articles that highlight specific aspects of vertebrate physiology, students generate “press releases”
to summarize experimental results and suggest potential applications of the research. By producing succinct, jargon-
free summaries of current research, along with creative connections between the research and potential real-world
applications, students develop skills that allow them to communicate more effectively with the general public.
Key words: Press releases, communication skills, primary literature
Introduction
Davis & Elkins College (D&E) is a small, private
liberal arts college that emphasizes small class sizes
and strong faculty-student interactions. In the
Department of Biology and Environmental Science,
students are introduced to the critical analysis of
primary scientific literature as early as the sophomore
year, and the importance of data interpretation is
stressed throughout the curriculum. By the end of the
senior year, we expect our majors to be able to
interpret scientific data and assess the merit of
published research according to evidence presented.
While the ability to analyze primary literature is
critical, it may not be sufficient to prepare students for
interactions with the lay public. According to Millar
and Osborne (1998), one of the necessary outcomes of
formal science education is the ability to “understand,
and respond critically to, media reports of issues with
a science component.” Misconceptions regarding
vaccinations, genetically modified organisms, and
climate change abound. Scientists, current and future,
need to address these misconceptions. What can be
done to reduce the epistemic distance between
scientists and the public? The answer may be
communication. Scientists need to communicate
information to non-scientists in a way that is
understandable, but not condescending.
Vertebrate Physiology is an elective course for
biology majors at D&E. The course surveys
physiological mechanisms common to all vertebrate
animals and introduces functional adaptations
essential to each vertebrate class. The course is
divided into five sections: respiration, metabolism,
temperature regulation, osmotic regulation, and
biomechanics. The laboratory portion of the course
incorporates analysis of current research articles from
the primary literature, typically one paper per section.
In recent years, in addition to standard analysis of
research data, I have required students to generate
“press releases” that summarize experimental results
for the general public. The press release is more than
just a filtered abstract. It is meant to spark interest in
readers, to inform readers of recent scientific efforts,
and to demonstrate how the research might potentially
affect readers. Generation of a good press release
requires some creativity, distinct from standard
scientific writing.
Assignment
The assignment begins with the formal analysis of
a journal article, using very specific guidelines (Table
1). Subsequently, students are instructed to generate a
jargon-free summary of the paper that would be
appropriate for non-scientists. They are then tasked
with making that summary appealing to the general
public by turning it into a short press release that
includes potential real world applications of the
published research. Press releases are read aloud in
class, and students collectively decide which one(s)
would most effectively engage a non-scientific
audience. See Table 2 for an example of an effective
press release.
In 2015 and 2018, the last two times I taught the
course, I used the same five research articles to
highlight the five distinct physiological sections. The
respiration paper specifically dealt with pulmonary
gas exchange in foxhounds after high-altitude
residence during maturation (McDonough et al.,
2006). Blood volume, lung function at rest, and lung
function during exercise were measured, and the
authors concluded that short exposure to high-altitude
during maturation improves long-term lung function
into adulthood. In their press releases, many students
linked the research outcomes to potential impacts on
human athletic training, including the dominance of
Kenyan distance runners and the placement of the U.S.
Olympic Training Center in Colorado Springs, CO.
The metabolism paper described the effect of high
incubation temperatures on energy metabolism in
softshell turtle embryos (Sun et al., 2015). The

Volume 45 (3) December 2019 Stover Using Student Generated Press Releases in a Vertebrate Physiology Course …………...32
Component Description
Citation Author’s last names and first initials, year of publication, title of article, name of journal, volume number,
issue number, first-last page numbers.
Knowledge
Gap
What biological question does the research address? In other words, what was known and unknown prior
to this research? What is the significance of the current study? This information is generally found in the
Introduction.
Overall
hypothesis
A statement of explanation regarding the research question. A hypothesis may not be clearly stated. It may
have to be inferred based on the procedures used to address the research question.
Prediction An “If…, then…” statement. If the hypothesis is supported, what results are expected?
Methods What was measured or determined? Summarize the approach in your own words.
Results What new information was produced? Summarize the results in your own words.
Conclusion What do the authors make of the data? Are their conclusions valid? Do the data support the hypothesis? Is
there any other possible interpretation?
Future studies A good paper may generate more questions than it answers. What is the next question researchers in the
field should address?
Table 1. Instructions for analyzing journal articles (based on an instrument created by Dr. Catherine Gardiner, University of
Northern Colorado).
authors isolated mitochondria and assayed metabolic
enzyme activity, concluding that embryos can adjust
mitochondrial respiration and enzyme activity in
response to developmental temperature. Several
student press releases considered the impact of global
warming on turtle populations, while others focused
on potential conservation efforts in zoos and wildlife
refuges.
The temperature regulation study investigated
muscle oxygen consumption at low temperatures in
frogs of the genus Xenopus (Seebacher et al., 2014).
After isolated muscle mechanics and oxygen
consumption were analyzed, it was concluded that the
metabolic cost of muscle performance increases as
temperature decreases. Most students immediately
saw the application to human athletic performance.
They focused on the benefits of warming up muscles
prior to competition, especially in cold weather.
The osmotic regulation article addressed the
adrenocortical stress responses of invasive cane toads
in a desert environment (Jessop et al., 2013).
Researchers recorded the effects of hormone
manipulation on the toads’ stress responses,
dehydration levels, and survival rates. Ultimately, they
With global warming on the rise, it is natural to assume that some species are being negatively impacted. Wei-Guo Du and
colleagues studied turtle eggs incubated at low, medium, and high temperatures. They found that eggs incubated at higher
temperatures were better at maximizing oxygen intake and efficiently using it to make energy. As the temperature increased,
so did the eggs’ metabolic rates. These results suggest that turtle embryos incubated at higher temperatures may actually have
an advantage. However, the study also indicated that hatchling turtles that were acclimated to lower temperatures had a more
efficient metabolism than those acclimated to higher temperatures. While global warming may not adversely affect turtles at
the embryonic stage, it could still produce metabolic consequences after they leave the comfort of their eggshells.
Before competition, athletes are advised to take time to warm up their muscles, especially in colder conditions. Most athletes
know that it helps to prevent a pulled muscle, but they may not know that it can actually improve the energy efficiency of their
muscles. Lower temperatures increase the tension in muscles, making it more difficult for contraction. Seebacher and
colleagues studied the relationship between temperature and muscle power in frogs of the genus Xenopus. They measured
speed, muscle contraction/relaxation time, oxygen consumption, and power generated. They then used the data to calculate
the energetic cost of work at cold and warm temperatures. They found that the total cost to perform the same amount of work
is much higher at colder temperatures than at warmer temperatures. Frogs at lower temperatures required more oxygen,
generated less power, and exhibited lower speeds. Athletes could experience similar results if they do not properly warm up
their muscles prior to competition in cold weather.
Malaria is a life-threatening disease that is carried by mosquito vectors in certain hot climates, like those found in sub-Saharan
Africa. One way to decrease the number of malaria infections is to decrease the vector population. This might be done by
introducing an invasive species of mosquito predator, like frogs or toads. However, introducing a species to a new
environment may fail if the species is unable to adapt. Amphibians can be susceptible to desiccation in hot environments. A
study conducted by Tim Jessop and his colleagues demonstrated that cane toads (Rhinella marina) have adapted a mechanism
to reduce water loss and overheating in the hot-dry climate of Australia. Although the exact pathway is still unclear, the
researchers found that these toads have regulated their stress response hormones in a way to prevent desiccation and
overheating in the harsh climate. The experimental groups of toads, which had their stress hormones either upregulated or
downregulated, were far less successful than the unaltered toads. Since these toads have begun to adapt to the hotter climates,
they could prove to be an effective new predator for malaria spreading mosquitos.
Table 2. Press release examples.

Volume 45 (3) December 2019 Stover Using Student Generated Press Releases in a Vertebrate Physiology Course …………...33
determined that adrenocortical hormones reduce
evaporative water loss and increase survival. Some
students saw an opportunity to combat malaria in sub-
Saharan Africa by dispatching an army of
dehydration-resistant cane toads to prey on mosquito
vectors. While the introduction of an invasive species
can potentially be disastrous, it suggests that students
were thinking creatively.
Finally, the biomechanics study examined the
potential connection between incline running in
galliform birds and the evolution of flight (Dial, 2003).
Adult birds, fully capable of aerial flight, employed
wing-assisted incline running to reach elevated
refuges in both natural and laboratory settings. The
author indicated that the specific angle of the wing-
stroke generated aerodynamic forces oriented toward
the substrate to enhance hindlimb traction. Students
gravitated to the notion that incline running may have
been practiced by feathered dinosaurs, an idea
suggested by the author, leading to the gradual
evolution of flight in birds. A few students suggested
clever applications for robotics, including a winged
window-washing robot, based on the aerodynamic and
inertial forces associated with the wing-stroke cycle.
The Vertebrate Physiology course historically has
a small number of students, usually fewer than 10. The
last three times I taught the course, in 2012, 2015, and
2018, I conducted an informal survey of students to
assess the value of the press release activity. Of the 21
total responses I received, 19 were very positive, often
describing the activity as being “fun,” “interesting,” or
“a great way to keep us thinking about physiology”
(Table 3). The only two negative comments came in
2012, when some of the research articles I assigned to
illustrate physiological adaptations involved the use of
human subjects. The dissenters were pre-veterinary
students who indicated that they had signed up to focus
on non-human vertebrates. It was a good point. We
have a separate course in Human Physiology.
“I enjoyed the press release exercises. They really helped me understand the relevance of the research.”
“Writing press releases forced me to think about the potential impact that scientific research can have.”
“Research articles can be difficult to read and comprehend. Considering the practical aspects of the work makes it seem much
more interesting and relevant.”
“Reading the research papers demonstrated to me the type of work being done in the field of animal physiology. Writing the
press releases allowed me to consider the potential applications of the work.”
“Writing for the general public is much more fun than writing for lab reports. It’s also a great way to keep us thinking about
physiology and the impact it has on everyday life.”
Table 3. Comments from students.
We remain committed to our emphasis on primary
literature in the department. The ability to dissect a
journal article, interpret its results, and assess its merit,
is an absolute necessity for biology graduates.
However, we are also committed to improving our
students’ communication skills. We want them to be
able to communicate with the general public, as well
as the scientific community. Vertebrate Physiology
students have demonstrated that they can generate
succinct, jargon-free summaries of current research.
Furthermore, due to the creative connections they
make between current research and potential
applications, their press releases are interesting,
insightful, and relevant to lay readers.
References
DIAL, K.P. 2003. Wing-assisted incline running and
the evolution of flight. Science 299(5605): 402-404.
JESSOP, T.S., LETNIC, M., WEBB, J.K., AND
DEMPSTER, T. 2013. Adrenocortical stress
responses influence an invasive vertebrate’s fitness in
an extreme environment. Proceedings of the Royal
Society B: Biological Sciences 280(1768): 20131444.
MCDONOUGH, P., DANE, D.M., HISA, C.C.W.,
YILMAZ, C., AND JOHNSON, R.L. 2006. Long-
term enhancement of pulmonary gas exchange after
high-altitude residence during maturation. Journal of
Applied Physiology 100(2): 474-480.
MILLAR, R. AND OSBORNE, J.F. 1998. Beyond
2000: Science education for the future. London:
King’s College.
SEEBACHER, F., TALLIS, J.A., AND JAMES, R.S.
2014. The cost of muscle power production: muscle
oxygen consumption per unit work increases at low
temperatures in Xenopus laevis. Journal of
Experimental Biology 217(Pt 11): 1940-1945.
SUN, B.J., LI, T., GAO, J., MA, L., AND DU, W.G.
2015. High incubation temperatures enhance
mitochondrial energy metabolism in reptile embryos.
Scientific Reports 5: 8861.

Volume 45 (3) December 2019 Javonillo and Dunlop Linking Phrases for Concept Mapping in Introductory College .………...34
Linking Phrases for Concept Mapping in Introductory College Biology
Robert Javonillo1, and Catherine Martin-Dunlop2
1Corresponding author. Dept. of Biology, Morgan State University, Baltimore, Maryland.
2Center for Excellence in Teaching and Learning, Morgan State University, Baltimore, Maryland
Abstract
Concept maps can be used in undergraduate biology as ways to visually communicate the relationships among things
and events. One strength of concept mapping is that there is not just a single, correct way to compose one, given a
list of particular concepts. Nevertheless there seem to be associations among ideas that are expressed frequently while
teaching biology. For example, hierarchical relationships among structures and steps within processes are two
common kinds of relationships that students encounter regularly. Based on our own classroom experiences and
surveys of concepts appearing in two popular textbooks, we provide here a resource for composing propositions within
biological concept maps. This list of more than 50 linking words and phrases is appropriate for freshman biology but
can be adapted for use in more advanced courses.
Keywords: Mind maps, college science education, logical relationships
Introduction
The types of courses taken by a first-year
undergraduate are usually formal introductions to
particular scholarly disciplines. Success in such
courses is required to then proceed to more advanced
courses within that particular major field of study.
However, these courses can act as veritable academic
minefields to students, and are often referred to as
gatekeeper or weeding-out courses because they
frequently result in students doing poorly (and thus
requiring a repeat term in the course), switching
majors, or withdrawing from higher education
altogether.
The issue of gatekeeper courses is especially
acute for STEM majors. Whether the time spent until
entry into a STEM career is referred to as a pathway,
pipeline (Shaw et al., 2012; Allen-Ramdial &
Campbell, 2014; Miller & Wai, 2015), or other
metaphor, such experience involves a variety of
factors that can either retain or repel students from the
discipline. In some cases lack of success in an
introductory STEM course (including required STEM
courses outside of one’s own STEM major) could
determine whether a student continues to pursue any
STEM career whatsoever. Decisions to abandon a
STEM major may thus be based on the perceived
rigidity of curricula and difficulty of courses within it.
In other words, the timing and sequence of courses
within a degree program do not allow a student to
graduate “on time” if he fails any one particular
course. (For the sake of brevity, we will not address
here what constitutes an appropriate amount of time to
complete degree requirements.) Another, related
factor that may enter a student’s decision-making
process about whether to pursue a STEM degree has
to do with what has been called the “push-pull” of
majors. That is, majoring in a STEM discipline can be
perceived as more difficult, less interesting, or
otherwise less rewarding than majoring in a non-
STEM discipline. The connection between
introductory courses and the push-pull of majors was
highlighted by Chambliss and Takacs (2014), who
observed that a student’s experience with her first
professor in an academic discipline (e.g., an instructor
of an introductory course) had a notable effect on
whether that student decided to stay within that major.
The high vocabulary load of introductory biology
courses may be a barrier to student success and may,
in turn, have several contributing factors. One has to
do with choices by individual professors to include
more vocabulary than is absolutely necessary to attain
their teaching goals and their students’ concordant
learning outcomes. Instructors’ choices, in turn, may
be driven by textbooks and their publishers’ decisions
to increase the amount of included jargon over time, to
achieve a sense of up-to-date rigor. Biology’s
“terminology problem” does not seem to be waning
and Wandersee (1988) observed that the field’s
ongoing proliferation of acronyms, terminology
incorporated from chemistry, polysyllabic words of
Greek and Latin origins, terms with multiple
conflicting meanings, and new terms coined by
empirical researchers all contribute to overwhelming
and stifling the interests of nascent biology students.
Wandersee (1988) cited both Ausubel (as Ausubel
et al., 1978) and Novak (1977) in his recognition of the
weakness of rote learning (verbatim memorization) of
biological terminology, and advocated for careful
selection by professors of the terminology to be
learned meaningfully by their students. In contrast to
rote learning, meaningful learning allows for future
learning of related concepts such that they can be
subsumed into an individual’s extant framework of
knowledge (Ausubel, 1963, 1968). Drawing upon the

Volume 45 (3) December 2019 Javonillo and Dunlop Linking Phrases for Concept Mapping in Introductory College .………...35
work of Ausubel (1963, 1968), the development of
concept maps (as described by Novak, 2010) was
firmly intended to result in meaningful learning.
Associations among biological terminology, concept
mapping, and meaningful learning have thus been
recognized (Wandersee, 1988) for at least three
decades.
Ultimately, satisfaction with and, presumably,
success in a course seems dependent upon whether a
student felt engaged by the professor. Student
engagement takes on various forms, not only within
the spatiotemporal confines of a particular course, but
also across the college experience as a whole. Active
learning (Freeman et al., 2014) and student
engagement often mentioned in the same work, and it
can be argued that “active” and “engaged” are
synonymous (Chi & Wylie, 2014) or that active
learning is the process through which student
engagement occurs. Course-based undergraduate
research experiences (CUREs; Bangera & Brownell,
2014) and flipped classrooms are examples of two
popular strategies designed to increase student
engagement and, in turn, student success. Another
active learning strategy is concept mapping, which
was originally developed by Novak in the 1970s
(Novak & Cañas, 2008). In contrast to CUREs and
flipped classrooms, which might be categorized types
of course formats, concept mapping is a type of course
activity that is compatible with almost any type of
course format.
Concept maps are similar in design to figures such
as mind maps and argument maps: all are ways to
express relationships among ideas. Davies (2011)
compared and contrasted the three, concluding that
they indeed represent distinct communication
strategies with each having advantages and
disadvantages. Concept mapping, as envisioned by
Novak (2010), involves creation of a network of
concepts that together help answer a focus question,
describe a more encompassing topic, or otherwise
establish what a particular set of concepts have to do
with one another. Within a concept map, a pair of
concepts is joined by a linking word or linking phrase,
such that a proposition is formed. Linking phrases are
typically only one to five words in length so the whole
proposition communicates, in a manner akin to
telegraphic language, the relationship between the two
concepts. Each proposition has polarity or
directionality, indicated by an arrow that joins the two
concepts and near which the linking phrase is written.
This directionality can be critical to the meaning of a
proposition. For example, it would be factually
correct for a proposition to indicate that “toe is part of
foot” but it would incorrect to state, in the opposite
direction, that “foot is part of toe.” Similarly, an
incorrect proposition such as “ATP produces
glycolysis” could be modified to instead correctly
assert that “glycolysis produces ATP.”
Concept maps are similar to outlines in
summarizing larger bodies of text or knowledge. An
outline uses features such as subordination and
division to portray logical relationships among its
components. In concept maps, subordination can also
convey hierarchies of ideas. These relationships can
also be rendered in even more revealing ways in a
concept map with explicit cross-links that are not
easily gleaned from an outline, since each concept in a
concept map may have multiple arrows leading to and
from it, forming multiple propositions, which
collectively express a meaningful body of knowledge.
Each proposition has the form concept-linking
phrase-concept. An experienced concept mapper is
able to effectively form propositions using appropriate
linking phrases, organize concepts in a hierarchical
manner, and provide cross-links (i.e., form
propositions connecting different “regions” of the
concept map) among related concepts (Mintzes et al.,
2011). Rote learning, argued Ausubel (1968) and
Novak (2010), contrasts with the meaningful learning
that concept mapping ideally represents. The former
is what instructors should not encourage in their own
classroom activities or assessments. Rote learning,
however, is unfortunately the default strategy for
many students. It often takes the form of memorizing
definitions to vocabulary terms (i.e., concepts) without
real demonstration of how such terms are related.
Encouraging students to map a given set of concepts,
either as a formative or summative assessment, allows
them an opportunity to struggle with (and therefore
meaningfully learn from) how to briefly and
accurately express, in the telegraphic language of
propositions, what they know about a biological topic.
Methods
We contend that concept mapping is a strategy
appropriate for introductory college biology, among
other types of courses, and that our included list of
linking phrases is useful for potentially increasing
rates of student success in such courses. This list
(Table 1) was compiled through reflection upon our
own teaching and research experiences in biology, and
extracting from them the kinds of phrases and verbal
collocations that we perceive to be used frequently.
We also inspected the glossaries of two introductory
textbooks that have national distribution (Russell et
al., 2014; Urry et al., 2016). Each glossary entry’s part
of speech (e.g., noun, adjective) was determined.
Percentages of nouns, verbs, and adjectives were then
calculated to quantify the relative importance placed
by textbook authors upon the different kinds of
biological concepts (i.e., things, actions, descriptors)
in their texts. These data, in turn, helped ensure that
our linking phrases that would be appropriate for
propositions incorporating common concepts from
introductory college biology.

Volume 45 (3) December 2019 Javonillo and Dunlop Linking Phrases for Concept Mapping in Introductory College …………36
adjacent to affected by always higher than
analogous to approaches approximates
argued for, against as in assume(s)
attracted by, to become(s) bound to
calculated by cause(s) characterized by, using
combines with composed of connected to
consists of constant when constrain(s)
contain(s) contrasts with converted to, via
cycles through decreased during derived from
determine(s) develop(s) within developed method(s) for, to
discovered doesn’t affect enable(s)
enter(s) equal to equation for
evidence of exclude(s) exit(s)
expressed by evolved in, into, during for example, e.g., such as
forms found in function(s) in, to
has rate called homologous to in other words, i.e., that is
in units called increases with indicated by, with
influence(s) inherited by inhibit(s)
inversely proportional to is absence of is, are not same as
join(s) with likely when limited by
means flow of measure(s) modify(-ies)
needed for negative when never higher than
occurs before, after, during, until opposite of part(s) of
pass(es) through perform(s) persist(s) when
possess(es) proceed(s) without produce(s)
proportional to quantify(-ies) randomly change(s)
realized that receive(s) related to
repels require(s) result of
results in rises exponentially with rises non-linearly with
serves to smaller than special case of
split(s) into stimulate(s) stops if, when
stored as strengthens subset of
substrate(s) for supported by, with surround(s)
symbolize(s) synonymous with, same as transfer(s)
transported by, to, from type of undergo(es)
Table 1. Alphabetical list, in horizontal rows, of example linking phrases for use in biological concept maps. Included
are phrases that occur commonly in introductory college biology. Note that some standalone words in the list can be
linguistically changed into phrases and vice versa. For example, the word “stimulates” can be converted into the phrase
“stimulated by.” However such conversions should be used cautiously during construction of concept maps, as they
can substantively change the meanings of propositions (e.g., “X stimulates Y” contradicts “X stimulated by Y”).
Some standalone words in the list can be
linguistically integrated into phrases and vice versa.
For example, the word “stimulates” can be converted
into the phrase “stimulated by.” However such a
change can inadvertently reverse the directionality of
a proposition if not done judiciously (e.g., “X
stimulates Y” does not hold the same meaning as “X
stimulated by Y”). Thus the use or substitution of a
particular preposition within a proposition can alter its
meaning. Notice also the differences in meaning of
“transported to” and “transported from.” Given this
linguistic flexibility of the 105 linking words and
phrases provided in Table 1, we conjecture that many
more can be easily derived from those given.
Volume 45 (3) December 2019 Javonillo and Dunlop Linking Phrases for Concept Mapping in Introductory College …………37
Discussion
Introductory undergraduate biology is rife with
specialized vocabulary, and courses for similar
audiences in chemistry, physics, and mathematics also
rely on specialized vocabulary along with hosts of
symbols, all of which can infiltrate introductory
biology. Novak (2010) would consider all of these
terms, symbols, and other ideas to be concepts, which
can be learned by concept mapping. He described
typical concepts as being either “things” or “events.”
In the context of biology, things include anatomical
structures, famous biologists, techniques, theories, or
types of molecules, whereas events might include
biological processes like meiosis or speciation. (In a
sense, biological processes are thus both “things” and
“events.”)
Interestingly, biological vocabulary seems to
favor noun forms rather than verb forms (for example
“photosynthesis” as opposed to “photosynthesize”).
Even less emphasized in introductory biological
vocabulary are adjectives (e.g., photosynthetic),
though all of these parts of speech play critical roles in
biological discourse. Our cursory analysis of two
widely used introductory college textbooks (Russell et
al., 2014; Urry et al., 2016) reveals that, in each case,
less than 3% of glossary entries are adjectives. The
remaining terms are almost exclusively nouns. We
have not investigated, however, whether instructional
emphasis on the noun, verb, or adjective form of a
concept has a differential effect on learning
introductory biological vocabulary.
In general concept maps can include any part of
speech. However, given the proclivity for biological
concepts to be emphasized as nouns, propositions
within biological concept maps are likely to link either
two nouns with a linking phrase (a noun-noun
proposition), link a noun and an adjective (a noun-
adjective proposition), or link a noun and a verb (a
noun-verb proposition). Propositions involving other
parts of speech (noun-adverb, adverb-adjective) are
assumed to be even less frequent in biology. Thus the
linking phrases listed here are probably most
appropriate for propositions that include at least one
concept that is a noun. Most contain either a verb or
both a verb and preposition, since the object of a
preposition is also a noun. The linking phrases
presented here include many that are formatted to
accommodate concepts that are either singular or
plural nouns, to allow subject-verb agreement (for
example, “affect[s]”) within propositions.
Experts can relate concepts to one another in
succinct ways that novices cannot. That is, novices
sometimes struggle to express deep knowledge in the
propositional format required for concept mapping.
For example, if a student were asked to link the
biological terms cristae and mitochondria, he might
respond by formulating a proposition that reads
“cristae relate to mitochondria.” While this
proposition is true, it would be more meaningful if it
also indicated how exactly cristae are related to
mitochondria. Thus, propositions asserting that
“cristae part of mitochondria” or “cristae found in
mitochondria” are true statements that simultaneously
describe the conceptual (here, structural or spatial)
relationships between cristae and mitochondria. The
linking words or linking phrases provided herein are
some of many that students can use in their own
concept maps. This list includes linking phrases that
describe quantitative, structural, temporal, and other
kinds of relationships that exist among the biological
concepts commonly taught in introductory biology.
As students become more confident in the mechanics
of concept mapping and become more experienced
using linking phrases that convey meaningful
relationships (such as those supplied here), they can
begin to craft their own linking phrases that also do so.
In the absence of such examples, a concept mapper
may remain as a novice, composing only vague (even
if true) propositions. An instructor might interpret
such hardship to mean that the student has not grasped
the mechanics of concept mapping, does not
understand the relationships among particular
concepts, or both.
Linking phrases, as components of propositions,
help elucidate the “who, what, where, when, why, and
how” of biological ideas and interrelationships among
them. While each concept can represent a standalone
thing or event, the linking phrase better places it in
context. Linking phrases hold explanatory power for
describing the timing, duration, location, function,
cause, effect, or mechanism of an event. They can also
be crafted to specify whose ideas influenced or
conflicted with whose, what characterizes particular
structures or groups of organisms, and how certain
data are collected. In short, propositions constructed
with appropriate linking phrases can express the kinds
of ideas that are commonplace in introductory college
biology. Individuals often possess more information
than they can easily express. The list of linking
phrases provided here may help students and faculty
unlock this tacit knowledge (Polanyi, 1966) so that it
can be codified, refined, or preserved using concept
maps.
As undergraduate biological education continues
to undergo reform, and as instructors continue to find
value in it for teaching or assessment, concept
mapping may be used more extensively. It can be
noted, for instance, that concept mapping remains
compatible with all of the biological core concepts
(evolution; structure and function; information flow,
exchange, and storage; pathways and transformations
of energy and matter; and systems) and core
competencies (ability to apply the process of science,
use quantitative reasoning, use modeling and
Volume 45 (3) December 2019 Javonillo and Dunlop Linking Phrases for Concept Mapping in Introductory College …………38
simulation, tap into the interdisciplinary nature of
science, communicate and collaborate with other
disciplines, and understand the relationship between
science and society) promulgated by Vision and
Change: A Call to Action (AAAS, 2011) . As also
mentioned above, concept mapping can be integrated
into almost any kind of biology course format,
including online courses, hybrid courses, CUREs, and
flipped classrooms.
Corpus-driven analyses (sensu Biber, 2009) of
introductory biology textbooks, edited volumes, and
journal articles may provide quantitative insight into
the kinds of phrases that describe the logical
relationships among natural phenomena (i.e.,
biological concepts). Through identifying common
patterns of how professional biologists communicate
ideas to one another, we may better understand how to
effectively explain new ideas to our own students. By
modeling and working with concise, factually correct
propositions in concept maps, we can train our
students to maximize their explanatory power in the
academic discourse of biology.
Acknowledgements
We thank comments that ultimately improved this
paper during the review process. This work was
enabled by National Science Foundation HBCU-UP
Award 1623215.
References
AAAS (AMERICAN ASSOCIATION FOR THE
ADVANCEMENT OF SCIENCE). 2011. Vision and
change in undergraduate biology education: a call to
action. Washington, DC.
ALLEN-RAMDIAL, S.-A., AND CAMPBELL, A.G.
2014. Reimagining the pipeline: advancing STEM
diversity, persistence, and success. BioScience 64(7):
612-618.
AUSUBEL, D.P. 1963. The psychology of meaningful
verbal learning. Grune and Stratton, New York.
AUSUBEL, D.P. 1968. Educational psychology: a
cognitive view. Holt, Rinehart, and Winston, New York.
AUSUBEL, D.P., NOVAK, J.D., AND HANESLAN, H.
1978. Educational psychology: a cognitive view, 2 ed.
Holt, Rinehart, and Winston, New York.
BANGERA, G. AND BROWNELL, S.E., 2014. Course-
based undergraduate research experiences can make
scientific research more inclusive. CBE-Life Sciences
Education 13(4): 602-606.
BIBER, D. (2009). A corpus-driven approach to
formulaic language in English. International Journal of
Corpus Linguistics 14(3): 275-311
CHAMBLISS, D.F., AND TAKACS, C.G. 2014. How
college works. Harvard University Press, Cambridge,
MA.
CHI, M.T. AND WYLIE, R., 2014. The ICAP
framework: Linking cognitive engagement to active
learning outcomes. Educational Psychologist, 49(4): 219-
243.
DAVIES, M. 2011. Concept mapping, mind mapping
and argument mapping: what are the differences and do
they matter? Higher Education 62(3): 279-301.
FREEMAN, S., EDDY, S.L., MCDONOUGH, M.,
SMITH, M.K., OKOROAFOR, N.,JORDT, H., AND
WENDEROTH, M.P. 2014. Active learning increases
student performance in science, engineering, and
mathematics. Proceedings of the National Academy of
Sciences of the United States of America 111(23): 8410–
8415.
MILLER, D.I., AND WAI, J. 2015. The bachelor’s to
Ph.D. STEM pipeline no longer leaks more women than
men: a 30-year analysis. Frontiers in Psychology 6:
article 37.
MINTZES, J.J., CAÑAS, A., COFFEY, J., GORMAN,
J., GURLEY, L., HOFFMAN, R., MCGUIRE, S.Y.,
MILLER, N., MOON, B., TRIFONE, J. AND
WANDERSEE, J.H. 2011. Comment on “retrieval
practice produces more learning than elaborative
studying with concept mapping”. Science 334(6055):
453.
NOVAK, J.D. 1977. A theory of education. Cornell
University Press, Ithaca, NY.
NOVAK, J.D. 2010. Learning, creating, and using
knowledge: concept maps as facilitative tools in schools
and corporations, 2 ed. Routledge, New York.
NOVAK, J. D. AND CAÑAS, A. J. 2008. The Theory
Underlying Concept Maps and How to Construct and Use
Them. Technical Report IHMC CmapTools 2006-01,
Rev 01-2008. Florida Institute for Human and Machine
Cognition.
http://cmap.ihmc.us/docs/pdf/TheoryUnderlyingConcept
Maps.pdf. Accessed 6/29/18
POLANYI, M. 1966. The tacit dimension. Doubleday,
Garden City, NY. 108 p.
RUSSELL, P.J., HERTZ, P.E., AND MCMILLAN, B.
2014. Biology: the dynamic science, 3 ed. Brooks/Cole,
Belmont, CA.
SHAW, A.K., AND STANTON, D.E. 2012. Leaks in
the pipeline: separating demographic inertia from
ongoing gender differences in academia. Proceedings of
the Royal Society B 279: 3736-3741.
URRY, L.A., CAIN, M.L., WASSERMAN, S.A.,
MINORSKY, P.V., AND REECE, J.B. 2016. Campbell
biology in focus, 2 ed. Pearson, Boston, MA.
WANDERSEE, J.H. 1988. The Terminology Problem
in Biology Education: A Reconnaissance. The American
Biology Teacher 50(2): 97-100.

Volume 45 (3) December 2019 Laidlaw and Jensen Why Teach Biology if it is Rejected? How to Teach Evolution …………..39
Perspectives
Why Teach Biology If It Is Rejected? How to Teach Evolution So That It Can Be
Accepted
Clinton Laidlaw 1 and Jamie Jensen2
1(Corresponding Author), Brigham Young University, Biology 4101 LSB, Provo, UT, USA 84602-0002,
303-709-4528, [email protected]
2Brigham Young University, Biology 4059 LSB, Provo, UT, USA 84602-0002, (801) 422-6896,
Abstract
There exists a disconnect between instruction about biological evolution and acceptance of evolution by students.
This disconnect prevents students from applying the theory to their lives or to their understanding of the field of
biology. We examine the literature for common barriers to the acceptance of evolution, correlates with acceptance of
evolution, and potential means by which education might result in increased levels of acceptance among students.
We find that by changing the way that teachers themselves are taught, and by altering the methods teachers use to
teach, it is likely that student acceptance of evolution can increase from instruction.
Keywords: Evolution, Education, Instruction, Acceptance, Teaching
Introduction
Biological evolution is the central organizing
theory of the field of biology [Dobzhansky, 1973;
American Association for the Advancement of
Science (AAAS), 1993, 2011; Bybee, 1997;
Kagan, 1992; National Association of Biology
Teachers (NABT), 2010; National Research Council
(NRC), 1996]. Without evolutionary theory, biology
is reduced to an assemblage of tangential and loosely
connected facts. Despite possessing a unifying theory,
biology as a subject is still frequently viewed by
students as being a disparate and nonsensical field
requiring extensive levels of memorization of
seemingly unrelated topics (Nomme, 2014). Given
this perceived disconnect between topics, every aspect
of biology becomes more difficult or even impossible
to understand and is therefore avoided by many
students (Nomme, 2014).
A major factor contributing to the dissociation of
concepts in biology is the fact that the unifying
element (evolutionary theory) is so widely rejected.
Nearly a third of American adults firmly reject
evolution (Miller et al., 2006), and less than a quarter
accept evolution of humans (Lovely & Kondrick,
2008). Among educators, evolution is occasionally
rejected and frequently ignored or marginalized as to
evade what is perceived as avoidable conflict with
both students and parents (Lerner, 2000; Farber, 2003;
Olivera et al,. 2011; Verhey, 2005; Goldston & Kyzer,
2009). This widespread rejection within the general
populous comes despite near complete consensus
among scientists (Pew Research Center, 2015; Alters
& Alters, 2001). If the central organizing theory of the
entire field of biology is rejected, then there is some
question as to the utility of attempting its instruction at
all. If what is taught isn’t internalized, then it becomes
nothing more than trivia. Biology is generally
considered a part of a general education at all levels,
yet students that do not receive instruction about or
that do not accept evolution are less likely to retain the
information (Nehm & Schonfeld, 2007) or transfer
their understanding to applications outside of the
course itself (Nehm & Reilly, 2007; Catley & Novack,
2009; Fowler & Zeidler, 2016).
Instruction Does Not Mean Acceptance
Understanding that evolution is almost
universally accepted by scientists, one might postulate
that rejection of evolutionary theory is related to
general ignorance of the subject matter. This might
seem particularly plausible given that most students
are unable to properly articulate what evolutionary
theory posits (Robbins & Roy, 2007), and there is a
correlation between knowledge of evolution and
acceptance (Weisberg et al., 2018). As knowledge of
evolution generally increases with instruction (Kim &
Nehm, 2011; Moore et al., 2011) it has been frequently
hypothesized that acceptance of evolution should be
positively correlated with instruction and knowledge
of evolution, especially natural selection (Anderson et
al., 2002; Bishop & Anderson, 1990; Demastes et al.,
1995; Lord & Marino, 1993; Nehm &
Schonfeld, 2008; Sinatra et al., 2003). However, these
studies have revealed no such correlation. For
example, Sinatra et al. (2003) found that after
instruction about photosynthesis, evolution of
animals, and human evolution that students’
acceptance of photosynthesis, the non-controversial
control, went up significantly, but there was no such
increase in acceptance for either animal nor human
evolution following similar instruction on these topics.
Though some studies have shown an increase in

Volume 45 (3) December 2019 Laidlaw and Jensen Why Teach Biology if it is Rejected? How to Teach Evolution …………..40
acceptance with instruction (Weisberg et al., 2018;
Robbins & Roy, 2007), particularly outside of the
United States (Akyol et al., 2010; Kim & Nehm 2011;
Ha et al., 2012), it more often seems to be an effective
means of temporarily increasing knowledge of
evolution, but not acceptance (Bishop & Anderson,
1990; Demastes et al., 1995; Jensen & Finley 1996,
Sinatra et al. 2003, Asterhan and Schwarz 2007,
Stover and Mabry 2007, Rutledge & Sadler 2011;
Deniz & Donnely, 2011; Lawson & Worsnop, 1992;
Crawford et al,. 2005; Cavallo & McCall, 2008).
Thus, the correlation between understanding and
acceptance likely indicates that acceptance is a
predictor of understanding and not the other way
around (Smith & Siegel, 1994).
If biology is going to remain a meaningful part of
a general education, then it stands to reason that we
need to teach it in such a way that promotes retention
of the material and the application thereof by the
students to the real world. If students are going to
accomplish these goals, then we need to teach it in
such a way that they can accept what is being taught.
As acceptance is not, generally, correlated with
instruction it leads to the question, what can we do to
make instruction about evolution truly effective? To
answer this question, we engaged in a detailed look at
the literature to see what ideas have been presented
and tested that might, if implemented in classrooms,
increase the efficacy of biology teaching by increasing
acceptance of biological evolution.
The Correlates of Acceptance
Many factors such as per capita gross domestic
product (Heddy & Nadelson, 2012), parents’
education level (Deniz et al., 2008), conservative
political orientations (Nadelson & Hardy, 2015), and
feeling of certainty (Ha et al,. 2012), have been shown
to be correlated with acceptance of evolution. Some of
the most frequently observed correlates are religiosity
and basic science literacy (Heddy & Nadelson, 2012,
Glaze et al., 2015), particularly with understanding of
evolution and of the nature of science (Cofré et al.,
2018; Dunk et al., 2017; Lombrozo et al., 2008; Trani,
2004; Glaze et al., 2015; Cavallo et al., 2011; Carter &
Wiles, 2014; Weisberg et al., 2018). Generally,
religiosity is found to have a negative correlation with
acceptance of evolution in that the more religious an
individual is, the less likely they are to accept
evolution (Heddy & Nadelson, 2012; Glaze et al.,
2015). Conversely, correct understanding of the nature
of science and of evolutionary theory are positively
correlated with acceptance (Lombrozo et al., 2008;
Trani, 2004, Glaze et al., 201; Cavallo et al., 2011;
Weisberg et al., 2018). As stated previously,
knowledge of evolution is not always found to be
correlated with acceptance. When knowledge and
acceptance are correlated, it sometimes only makes a
difference in students that were undecided on the
subject before instruction (Wilson, 2005; Ingram &
Nelson, 2006). It could be that knowledge and
understanding are not always synonymous because
constructing such an understanding can be impeded by
misconceptions both present in students and taught by
instructors (Blackwell et al,. 2003; Sinatra et al., 2008;
Yates & Marek, 2014). Assuming a causative
relationship between these correlates and acceptance,
one could conceivably increase acceptance of
evolution by doing any of the following: increasing
students’ understanding of the nature of science,
increasing students’ correct understanding of
evolutionary theory particularly of “macroevolution”,
or the idea that the small-scale “micro” evolutionary
steps can accumulate and lead to speciation (Nadelson
& Southerland, 2010), or by decreasing students’
religious conviction.
Reduce Religiosity
Considering the negative correlation between
religiosity and acceptance of evolution, many teachers
and popularizers of science have attempted to confront
the apparent incompatibility of science and religion by
attempting to discredit the religious beliefs of the
students (Dawkins, 2016; Mahner & Bunge, 1996).
While this may be effective for some, it is also likely
that it simply reinforces the belief that science and
religion are incompatible and therefore hinders
acceptance in those who are unconvinced that they
should abandon their religious beliefs. In addition,
promoting an accurate understanding of students’
religious doctrine and discussing ways in which
science and religion can be reconciled can lead to
higher levels of acceptance of evolution even among
highly religious students (Brickhouse et al., 2000;
Manwaring et al., 2015; Barnes et al., 2017). Winslow
et al., (2011) found that among Christian students
raised as creationists, acceptance was possible when
students were presented with evidence, when they
were encouraged to examine the literalness of the
scriptural accounts of creation, when evolution was
presented as something unrelated to their eternal
salvation, and when their professor was viewed as a
religious role model who accepted evolution. Holt et
al., (2018) found that “The single factor linked with
the reduction in both creationist reasoning and in
students’ perceived conflict between evolution and
their worldview through a semester was the presence
of a role model.”
Along those lines, it is essential to differentiate
between accepting and believing in evolution as belief
and acceptance are not, necessarily, synonymous
(Smith & Siegel, 2004). Evolution is not a belief
system, but a rational explanation for a host of facts
which, to date, cannot otherwise be explained. One
therefore does not believe in evolution but accepts it
as the most reasonable explanation we have given the
facts. This understanding is likely associated with
understanding of the nature of science and its
limitations, and if understood could mitigate the belief

Volume 45 (3) December 2019 Laidlaw and Jensen Why Teach Biology if it is Rejected? How to Teach Evolution …………..41
that accepting evolution threatens ones’ eternal
salvation (Winslow et al., 2011).
All of this would suggest that, for highly religious
students, the best way to promote acceptance might
not be to attack their beliefs, but to aid them in
reconciling their beliefs with science and serving as a
non-hostile role model. In the case that the instructor
holds uninformed or antagonistic viewpoints towards
religion this approach should only be implemented
with great care (Brickhouse et al., 2000). Regardless,
presenting science as an antithesis to religion may do
more to promote rejection than acceptance. Whether it
is effective or not to diminish the religious beliefs of
students, Rice et al., (2015) found that, for university
faculty, knowledge and acceptance of evolution were
positively correlated, even in faculty with creationist
viewpoints, suggesting that acceptance and knowledge
can increase conjointly irrespective of the religious
position of the learners. Attacking the students’
religious convictions is likely not the best way to
increase the likelihood of accepting evolution.
Reduce Misconceptions
Given the variation in the strength of students’
religious beliefs as well as the compatibility of those
beliefs with evolutionary theory, in many instances it
may be counter-productive to engage those
convictions directly or indirectly. Attempting to
increase acceptance of evolution by confronting
student religiosity may not always be an effective
option for instructors. One of the principle issues
related to religion and science is that religious students
may be at an increased risk of possessing
misconceptions that hinder proper understanding of
science generally, especially evolution (Dagher &
BouJaoude, 1997; Sinatra et al., 2003; Blackwell et al.,
2003). To increase the likelihood of acceptance
among religious students it may be effective to address
those misconceptions in lieu of confronting the
religion directly.
The importance of confronting misconceptions is
not limited to religious students in any way, but such
misconceptions permeate society irrespective of
religiosity (Blackwell et al., 2003; Sinatra et al., 2008;
Yates & Marek, 2014). In some cases, people may
claim to reject evolution based on their religious
convictions, but this may not be the actual motivation.
Trani, (2004) found that many teachers claimed to
reject evolution due to their religion, but upon further
analysis it appeared to be more due to a lack of
understanding of the actual theory of evolution, and a
lack of understanding of the nature of science.
To confront the acceptance barrier of
misconceptions one could confront those
misconceptions directly in the classroom as a part of
the curriculum. Misconceptions about evolution are
numerous and include things such as those listed by
Gregory, (2009). Wilson, (2005) designed an entire
course with the objective of increasing interest in,
knowledge and acceptance of evolution. In the course
the researchers focused the beginning of the course on
the implications of evolution as many of the most
common reasons for dismissing the theory come from
incorrect assumptions regarding its implications.
Although some have chosen to devote the whole of a
course to confronting such misconceptions, all biology
courses are likely to benefit from taking time to assess
and address the misconceptions present in the
students.
What may be better than correcting
misconceptions would be to begin to teach evolution
explicitly as early as possible to students so that they
can develop accurate initial conceptions regarding
evolution and the nature of science before they have
the opportunity to construct inaccurate ones (Weiss &
Dreesmann, 2014). Kelemen et al., (2014) found that
children from 5 to 8 years of age can be taught basic
natural selection using a picture-storybook and retain
and apply that information even several months after
instruction. Contrary to what many might think,
correct understanding of evolution does not seem to be
outside of the reasoning ability of even very young
students.
Capability of Teachers
Among the major considerations which may
prevent earlier implementation of evolution into
curricula is the understanding of the teacher. Being
that we are seeking to evade misconceptions among
learners, it is important to consider that many teachers
of younger students themselves possess these
misconceptions (Blackwell et al., 2003; Yates &
Marek, 2014). Elementary teachers, for example, may
have a single semester or less of biology education
before beginning teaching, a single course which may
or may not have taught accurate principles of
biological evolution. Teachers are often not
sufficiently knowledgeable to correctly teach these
concepts and may deliberately or inadvertently teach
misconceptions explicitly in the classroom. Even
among more highly trained biology-specific teachers,
such misconceptions are prevalent. Many either teach
these misconceptions, or use them, combined with
concerns of parent outrage, as an excuse to avoid the
topic altogether. Rutledge & Mitchell, (2002) found
that 43% of surveyed teachers completely avoided, or
only briefly mentioned evolution in Indiana biology
classrooms. The principle reasons that the topic was
avoided was that the teachers felt ill-equipped in terms
of their personal understanding or rejected it
themselves. Some teachers do not want to teach
evolution, others are incapable (Wiles & Branch,
2008). Though beginning evolution education at an
earlier age may increase the likelihood of acceptance,
it is unlikely that our current workforce of teachers is
adequately trained to do so.

Volume 45 (3) December 2019 Laidlaw and Jensen Why Teach Biology if it is Rejected? How to Teach Evolution …………..42
If we are to have teachers that are more equipped
to teach evolution in schools then we need a better way
to teach not only our students, but our teachers (Weiss
& Dreesmann, 2014; Blackwell et al., 2003). Rutledge
& Warder, (2000) found that Indiana public high
school biology teachers were ill-prepared by their
academic qualifications to teach evolution, or the
nature of science and that most college and university
biology departments do not require evolution or nature
of science coursework to obtain teacher certification in
biology. Even when attempts are made to design
courses to increase instructor knowledge of evolution
these courses are frequently ineffective at changing the
way that instructors teach. For example, a course
taught at the graduate-level to instructors designed to
increase instructor knowledge and reduce
misconceptions was effective at increasing knowledge
and reducing misconceptions, but did not reduce the
desire of instructors to teach anti-evolutionary ideas
(Nehm & Schonfeld, 2007) suggesting that it did not
have an impact on instructor acceptance.
For students and educators that have received
quality instruction, but especially for those whose
early-life evolution education has left them either
uninformed or misinformed about evolution, the
question then becomes how do we teach evolution so
that they will be most able to understand and accept it?
Constructivism
Alters & Nelson, (2002) suggested teaching using
constructivism as a means of increasing the efficacy of
evolution teaching. Constructivism, when applied not
only as a theory of learning but as a theory of
education, should promote conceptual change in
learners because it, unlike many other educational
theories such as behaviorism, is not capable of
ignoring the misconceptions and past experiences of
the students. With behaviorism, instructors may elicit
desired responses from learners with sustained
reinforcement of those behavioral responses.
However, the knowledge that they are to attain is not
owned by the learner, but is predetermined by the
instructor. Understanding is only measured by the
learner behaving in the manner desired by the
instructor (such as repeating a word or phrase) in
response to specific stimuli (such as a test question),
which are again determined by the instructor
(Scheurman, 1998). Behaviorism treats learners as
though they were a blank slate and does not account
for the effect that their preconceived notions may have
on their ability to learn new material (Ertmer &
Newby, 1993). Cognitivism accepts that learners may
have preconceived notions that may interfere with
their ability to obtain knowledge, but it still views
knowledge as something created outside of the learner
and therefore something inflicted upon the learner and
not constructed thereby (Ertmer & Newby, 1993).
Constructivism is arguably a subset of cognitivism that
assumes that knowledge cannot be transferred intact
from one individual to another, but rather that all
people construct within themselves a logical set of
explanations for the experiences that they have had
(Jonassen, 1999). When we ignore the past
experiences of a learner, we are unable to predict how
they will incorporate the new information being
presented into their existing schemas. A constructivist
classroom will raise questions and problems that
require students to do things based on their prior
beliefs, but that have results or answers which may not
fit into their existing schemas requiring students to
reexamine their existing schemas to see if they remain
credible, or if they need to be replaced (Lawson,
1994). In addition to confronting incorrect schemas
that might otherwise go undetected, such experience
may increase overall reasoning abilities, which, as
suggested by Lawson & Wesner, (1990), should
decrease nonscientific beliefs in students. These
reasons should, at least hypothetically, make
constructivist teaching more effective in terms of
promoting acceptance of evolution.
Active Learning
Freeman et al., (2014) in a meta-analysis of 225
studies found that the use of active learning of any kind
increased exam scores an average of 6% and that
failure rates in STEM courses were 55% higher in non-
active courses than in active courses. Active learning
was also suggested as a means of increasing
knowledge and acceptance of evolution specifically by
Alters and Nelson, (2002) because learning tends to
increase in active learning classrooms. Where
learning increases, instructors have a greater chance of
increasing student understanding of the two key
knowledge correlates with evolution acceptance: the
nature of science and of evolution. Nehm & Reilly,
(2007), for example, found that classes taught using
active learning achieved higher scores on key concepts
of natural selection and had fewer misconceptions than
classes taught traditionally. Active learning
environments may too provide a greater opportunity
for instructors to gain insight into the thoughts and
misconceptions of their students and thus more able to
address them deliberately in the classroom.
Journals
Reflective journals are already widely used in
other fields of education such as nursing (Blake, 2005;
Raterink, 2016; Miller, 2017), counselling (Chabon &
Lee-Wilkerson, 2006; Hubbs & Brand, 2005), and
statistics (Thropp, 2017). These journals proved an
active-learning component to the course allowing the
students to reflect on the material (Blake, 2005;
Thropp, 2017), as well as giving instructors critical
feedback into the understanding and application of the
material in their students (Chabon & Lee-Wilkerson,
2006). In Biology classrooms, completing journaling
assignments has been correlated with an increase in
understanding and acceptance of biological evolution

Volume 45 (3) December 2019 Laidlaw and Jensen Why Teach Biology if it is Rejected? How to Teach Evolution …………..43
(Scharmann & Butler, 2015). While the lack of a
control in this study prevents us from knowing if
journaling caused any portion of the increase in
acceptance that the researchers observed, as with other
fields, the journals helped researchers gain a clearer
view into students’ thoughts. Combined with the use
of active learning in the classroom, they saw an
increase in acceptance of evolution over the course of
the semester. Journals may, in and of themselves,
increase acceptance, but at the very least journals can
inform instructors about the major misconceptions and
understanding of their classes so that instructors can
modify their curricula accordingly.
Make Evolution Relevant
To most biologists the importance of evolutionary
theory is obvious as it not only makes sense of the
field, but gives us the ability to understand and predict
many real-world, relevant phenomena such as the
spread of disease, pest management, and the potential
impacts of climactic change. Many students,
nonetheless, never see the practicality of the theory.
Learning is often impeded because students do not see
the relevance of the subject to their lives (Heddy &
Sinatra, 2013). One of the great benefits of active
learning is that it increases the attentiveness of the
students (Prince, 2004), but if the material is trivial and
irrelevant then such benefits may be lost (Heddy &
Sinatra, 2013). Infanti & Wiles, (2014) found that
exposing students to "Evo in the News" (news articles
involving evolution) was correlated with increases in
student attitudes regarding evolution and its relevance.
Thus, we may benefit from not only explaining the
historical importance of evolution but focusing on how
evolution impacts modern life for our students. Stover
et al., (2013) found that acceptance of evolution and
other controversial topics in science increased when
placed in a context of public health. As is often the
case, science is perceived as most relevant when it is
directly related to human health and survival. This
would include the evolution of diseases, drug
resistance, herb and pesticide resistance,
communicability of diseases from other organisms,
selective breeding and others. There are likely
countless examples of ways that evolution impacts
modern life, and the more examples we can bring to
the students the more likely they are to listen to the
content being shared.
Social Identity Theory
Social identity theory is a theory in social
psychology that explains much about intergroup
behavior based on their perceived membership to a
relevant social group (Turner & Oakes, 1986; Tajfel et
al., 1979; Tajfel & Turner, 1986). This theory led to
the creation of self-categorization theory that
describes the conditions under which an individual
will identify assemblages of individuals (potentially
including themselves) as being a group, and the
consequences of identifying people as a group
(Haslam, S. A., 1997). Based on these theories, social
identities are cognitively signified as group
stereotypes that both describe and assign beliefs,
attitudes and behaviors that minimize differences with
members of one’s perceived group and maximize
differences with members of other groups whether
those groups were formed randomly or non-randomly
(Tajfel, 2010). As a result, people tend to be
unreasonably critical of ideas that come from
individuals outside of their perceived group, and
unreasonably accepting of ideas that come from
individuals within their perceived group (Tajfel,
2010). While research has not focused on the impact
of social identity theory and in-group formation on
evolution acceptance specifically, it would explain
why acceptance rates vary based on factors such as
political party and religious affiliation (Nadelson &
Hardy, 2015). It stands to reason that students’
perception of their instructor as being either part of
their in-group or not part of their in-group could
dramatically influence the probability of evolution
acceptance among their students. This could
potentially be addressed by taking steps to
approximate the stereotypes of the students’ in-group,
or at least not deliberately portray oneself as a member
of an out-group (Holt et al., 2018) and also by building
a strong in-group culture in the classroom and never to
isolate members of the class as being members of
some other group.
Conclusions and Future Directions
While our understanding of the importance of
accepting evolution and how to increase that
acceptance is increasing, we still have much to
accomplish. In many cases the implementation of this
knowledge is inhibited by the fact that teachers are
unable or unmotivated to make the changes necessary
to improve the quality of biology education as to
increase student acceptance of the fundamental theory
of evolution. Despite the obstacles, there is great
reason for optimism. A greater focus on student
understanding of the nature of science and
evolutionary theory promises to increase student
acceptance particularly as these topics are presented in
an active, constructivist, and relevant way. Gone are
the days when we, as scientists, felt the need to engage
in the battle of science versus religion to inform our
students. We do not need to tear down as much as we
need to confront misconceptions and build, as early as
possible, correct ideas about the mechanisms and
implications of evolution.
Many great ideas have been postulated regarding
teaching strategies that are likely to increase
acceptance. As we focus on studies that
experimentally test these hypotheses, we are likely to
have greater and greater clarity as to the most effective
ways to present science and biology to modern
students. As we understand how to address

Volume 45 (3) December 2019 Laidlaw and Jensen Why Teach Biology if it is Rejected? How to Teach Evolution …………..44
controversial topics such as evolution we are likely to
gain insight into how we might better inform the
public about a host of other relevant and important
topics that are similarly perceived as being
controversial (e.g., reproductive technology, climate
change). We have long been fighting this battle, but
we are constantly learning which battles really should
be fought.
References
AKYOL, G., TEKKAYA, C., AND SUNGUR, S.
2010. The contribution of understandings of
evolutionary theory and nature of science to pre-
service science teachers’ acceptance of evolutionary
theory. Procedia-Social and Behavioral Sciences 9,
1889-1893.
ALTERS, B. J., AND ALTERS, S. 2001. Defending
evolution in the classroom: A guide to the
creation/evolution controversy. Jones & Bartlett
Learning.
ALTERS, B. J., AND NELSON, C. E. 2002.
Perspective: Teaching evolution in higher
education. Evolution, 56(10), 1891-1901.
AMERICAN ASSOCIATION FOR THE
ADVANCEMENT OF SCIENCE. Benchmarks for
science literacy. Oxford University Press, 1993.
ANDERSON, D. L., FISHER, K. M., AND
NORMAN, G. J. 2002. Development and evaluation
of the conceptual inventory of natural
selection. Journal of research in science
teaching, 39(10), 952-978.
ASTERHAN, C. S., AND SCHWARZ, B. B. 2007.
The effects of monological and dialogical
argumentation on concept learning in evolutionary
theory. Journal of Educational Psychology, 99(3),
626.
BARNES, M. E., ELSER, J., & BROWNELL, S. E.
2017. Impact of a Short Evolution Module on
Students' Perceived Conflict between Religion and
Evolution. The American Biology Teacher, 79(2),
104-111.
BISHOP, B. A., AND ANDERSON, C. W. 1990.
Student conceptions of natural selection and its role in
evolution. Journal of research in science
teaching, 27(5), 415-427.
BLACKWELL, W. H., POWELL, M. J., AND
DUKES, G. H. 2003. The problem of student
acceptance of evolution. Journal of Biological
Education, 37(2), 58-67.)
BLAKE, T. K. 2005. Journaling; An active learning
technique. International Journal of Nursing Education
Scholarship, 2(1), 1116.
BREWER, CAROL A., AND DIANE SMITH. Vision
and change in undergraduate biology education: a call
to action. American Association for the Advancement
of Science, Washington, DC (2011).
BRICKHOUSE, N. W., DAGHER, Z. R., LETTS, I.
V., WILLIAM, J., AND SHIPMAN, H. L. 2000.
Diversity of students' views about evidence, theory,
and the interface between science and religion in an
astronomy course. Journal of Research in Science
Teaching, 37(4), 340-362.
BYBEE, RODGER W. Achieving scientific literacy:
From purposes to practices. Heinemann, 88 Post Road
West, PO Box 5007, Westport, CT 06881, 1997.
CARTER, B. E., AND WILES, J. R. 2014. Scientific
consensus and social controversy: exploring
relationships between students’ conceptions of the
nature of science, biological evolution, and global
climate change. Evolution: education and
outreach, 7(1), 1.
CATLEY, K. M., AND NOVICK, L. R. 2009.
Digging deep: Exploring college students' knowledge
of macroevolutionary time. Journal of Research in
Science Teaching, 46(3), 311-332.
CAVALLO, A. M., & MCCALL, D. 2008. Seeing
may not mean believing: examining students'
understandings & beliefs in evolution. The American
Biology Teacher, 70(9), 522-530.
CAVALLO, A. M., WHITE, K. J., AND MCCALL,
D. 2011. The Mismatch among Students' Views about
Nature of Science, Acceptance of Evolution, and
Evolutionary Science Understandings. Science
Education Review, 10(2), 37-42.
CHABON, S. S., AND LEE-WILKERSON, D. 2006.
Use of Journal Writing in the Assessment of CSD
Students' Learning About Diversity A Method Worthy
of Reflection. Communication disorders
quarterly, 27(3), 146-158.
COFRÉ, H. L., SANTIBÁÑEZ, D. P., JIMÉNEZ, J.
P., SPOTORNO, A., CARMONA, F., NAVARRETE,
K., AND VERGARA, C. A. 2018. The effect of
teaching the nature of science on students’ acceptance
and understanding of evolution: myth or
reality? Journal of Biological Education, 52(3), 248-
261.
CRAWFORD, B. A., ZEMBAL‐SAUL, C.,
MUNFORD, D., AND FRIEDRICHSEN, P. 2005.
Confronting prospective teachers' ideas of evolution
and scientific inquiry using technology and inquiry‐
based tasks. Journal of research in science
teaching, 42(6), 613-637.
DAGHER, Z. R., AND BOUJAOUDE, S. 1997.
Scientific views and religious beliefs of college
students: The case of biological evolution. Journal of
research in Science Teaching, 34(5), 429-445.

Volume 45 (3) December 2019 Laidlaw and Jensen Why Teach Biology if it is Rejected? How to Teach Evolution …………..45
DAWKINS, R. 2016. The god delusion. Random
House.
DEMASTES, S. S., SETTLAGE, J., AND GOOD, R.
1995. Students' conceptions of natural selection and its
role in evolution: Cases of replication and
comparison. Journal of Research in Science
Teaching, 32(5), 535-550.
DENIZ, H., AND DONNELLY, L. A. 2011.
Preservice secondary science teachers’ acceptance of
evolutionary theory and factors related to
acceptance. Reports of the National Center for Science
Education, 31(4).
DENIZ, H., DONNELLY, L. A., AND YILMAZ, I.
2008. Exploring the factors related to acceptance of
evolutionary theory among Turkish preservice biology
teachers: Toward a more informative conceptual
ecology for biological evolution. Journal of Research
in Science Teaching, 45(4), 420-443.
DOBZHANSKY, THEODOSIUS. Nothing in biology
makes sense except in the light of evolution. (1973):
125-129.
DUNK, R. D., PETTO, A. J., WILES, J. R., AND
CAMPBELL, B. C. 2017. A multifactorial analysis of
acceptance of evolution. Evolution: Education and
Outreach, 10(1), 4.
ERTMER, P. A., AND NEWBY, T. J. 1993.
Behaviorism, cognitivism, constructivism: Comparing
critical features from an instructional design
perspective. Performance improvement
quarterly, 6(4), 50-72.
FARBER, P. 2003. Teaching evolution & the nature
of science. The American Biology Teacher, 65(5),
347-354.
FOWLER, S. R., AND ZEIDLER, D. L. 2016. Lack
of evolution acceptance inhibits students’ negotiation
of biology-based socioscientific issues. Journal of
Biological Education, 50(4), 407-424.
FREEMAN, S., EDDY, S. L., MCDONOUGH, M.,
SMITH, M. K., OKOROAFOR, N., JORDT, H., AND
WENDEROTH, M. P. 2014. Active learning increases
student performance in science, engineering, and
mathematics. Proceedings of the National Academy of
Sciences, 111(23), 8410-8415.
GLAZE, A. L., GOLDSTON, M. J., AND
DANTZLER, J. 2015. Evolution in the southeastern
USA: Factors influencing acceptance and rejection in
pre-service science teachers. International Journal of
Science and Mathematics Education, 13(6), 1189-
1209.
GLAZE, A. L., AND GOLDSTON, M. J. 2015. US
science teaching and learning of evolution: A critical
review of the literature 2000–2014. Science
Education,99(3), 500-518.
GOLDSTON, M. J., AND KYZER, P. 2009. Teaching
evolution: Narratives with a view from three southern
biology teachers in the USA. Journal of Research in
Science Teaching, 46(7), 762-790.
GREGORY, T. R. 2009. Understanding natural
selection: essential concepts and common
misconceptions. Evolution: Education and
Outreach, 2(2), 156-175.
HA, M., HAURY, D. L., AND NEHM, R. H. 2012.
Feeling of certainty: uncovering a missing link
between knowledge and acceptance of
evolution. Journal of Research in Science
Teaching, 49(1), 95-121.
HASLAM, S. A. 1997. Stereotyping and social
influence: Foundations of stereotype consensus.
HEDDY, B. C., AND NADELSON, L. S. 2012. A
global perspective of the variables associated with
acceptance of evolution. Evolution: Education and
Outreach,5(3), 412-418.)
HEDDY, B. C., AND SINATRA, G. M. 2013.
Transforming misconceptions: Using transformative
experience to promote positive affect and conceptual
change in students learning about biological
evolution. Science Education, 97(5), 723-744.
HOLT, E. A., OGDEN, T. H., AND DURHAM, S. L.
2018. The positive effect of role models in evolution
instruction. Evolution: Education and
Outreach, 11(1), 11.
HUBBS, D. L., AND BRAND, C. F. 2005. The paper
mirror: Understanding reflective journaling. Journal
of Experiential Education, 28(1), 60-71.
INFANTI, L. M., AND WILES, J. R. 2014. " Evo in
the News:" Understanding Evolution and Students'
Attitudes toward the Relevance of Evolutionary
Biology. Bioscene: Journal of College Biology
Teaching, 40(2), 9-14.
INGRAM, E. L., AND NELSON, C. E. 2006.
Relationship between achievement and students'
acceptance of evolution or creation in an upper‐level
evolution course. Journal of research in science
teaching, 43(1), 7-24.
JENSEN, M. S., AND FINLEY, F. N. 1996. Changes
in students' understanding of evolution resulting from
different curricular and instructional
strategies. Journal of research in science
teaching, 33(8), 879-900.
JONASSEN, D. H. 1999. Designing constructivist
learning environments. Instructional design theories
and models: A new paradigm of instructional
theory, 2, 215-239.
KAGAN, DONA M. "Implication of research on
teacher belief." Educational psychologist 27.1 (1992):
65-90.
Volume 45 (3) December 2019 Laidlaw and Jensen Why Teach Biology if it is Rejected? How to Teach Evolution …………..46
KELEMEN, D., EMMONS, N. A., SCHILLACI, R.
S., AND GANEA, P. A. 2014. Young children can be
taught basic natural selection using a picture-
storybook intervention. Psychological science, 25(4),
893-902.
KIM, S. Y., AND NEHM, R. H. 2011. A cross‐cultural
comparison of korean and american science teachers’
views of evolution and the nature of
science. International Journal of Science
Education, 33(2), 197-227.
LAWSON, A.E. 1994. Research on the acquisition of
science knowledge; epistemological foundation of
cognition. Pp. 131-176 in D.L. Gabriel, ed. Handbook
of research on science teaching and learning.
Macmillan, New York.
LAWSON, A. E., AND WESER, J. 1990. The
rejection of nonscientific beliefs about life: Effects of
instruction and reasoning skills. Journal of Research in
Science Teaching, 27(6), 589-606.
LAWSON, A. E., AND WORSNOP, W. A. 1992.
Learning about evolution and rejecting a belief in
special creation: Effects of reflective reasoning skill,
prior knowledge, prior belief and religious
commitment. Journal of research in science
teaching, 29(2), 143-166.
LERNER, L. S. 2001. Good Science, Bad Science:
Teaching Evolution in the States. California Journal of
Science Education, 1(2), 117-33.
LOMBROZO, T., THANUKOS, A., AND
WEISBERG, M. 2008. The importance of
understanding the nature of science for accepting
evolution. Evolution: Education and Outreach, 1(3),
290-298.)
LORD, T., AND MARINO, S. 1993. How university
students view the theory of evolution. Journal of
College Science Teaching, 22(6), 353-57.
LOVELY, E. C., AND KONDRICK, L. C. 2008.
Teaching evolution: challenging religious
preconceptions. American Zoologist, 48(2), 164-174.
MAHNER, M., AND BUNGE, M. 1996. Is religious
education compatible with science
education?. Science & Education, 5(2), 101-123.)
MANWARING, K. F., JENSEN, J. L., GILL, R. A.,
AND BYBEE, S. M. 2015. Influencing highly
religious undergraduate perceptions of evolution:
Mormons as a case study. Evolution: Education and
Outreach, 8(1), 1.)
MILLER, L. B. 2017. Review of Journaling as a
Teaching and Learning Strategy. Teaching and
Learning in Nursing, 12(1), 39-42.
MILLER, JON D., EUGENIE C. SCOTT, AND
SHINJI OKAMOTO. 2006. Public acceptance of
evolution. Science-New York then
Washington- 313.5788: 765.
MOORE, R., BROOKS, D. C., AND COTNER, S.
2011. The relation of high school biology courses &
students' religious beliefs to college students'
knowledge of evolution. The American Biology
Teacher, 73(4), 222-226.
NADELSON, L. S., AND HARDY, K. K. 2015. Trust
in science and scientists and the acceptance of
evolution. Evolution: Education and Outreach, 8(1),
1-9.
NADELSON, L. S., AND SOUTHERLAND, S. A.
2010. Examining the interaction of acceptance and
understanding: how does the relationship change with
a focus on macroevolution? Evolution: Education and
Outreach, 3(1), 82-88.)
NATIONAL ASSOCIATION OF BIOLOGY
TEACHERS (NABT). Mission statement.
http://www.nabt.org/websites/institution/index.php?p
=1 (2010).
NATIONAL RESEARCH COUNCIL, ED.
1996. National science education standards. National
Academy Press.
NOMME, KATHY M. “Q4B Update.” Presented at
the UBC Biology Teaching Program Reterat. July
2014.
NEHM, R. H., AND REILLY, L. 2007. Biology
majors' knowledge and misconceptions of natural
selection. BioScience, 57(3), 263-272.
NEHM, R. H., AND SCHONFELD, I. S. 2007. Does
increasing biology teacher knowledge of evolution
and the nature of science lead to greater preference for
the teaching of evolution in schools?. Journal of
Science Teacher Education, 18(5), 699-723.)
NEHM, R. H., AND SCHONFELD, I. S. 2008.
Measuring knowledge of natural selection: a
comparison of the CINS, an open‐response
instrument, and an oral interview. Journal of Research
in Science Teaching, 45(10), 1131-1160.
OLIVEIRA, A. W., COOK, K., AND BUCK, G. A.
2011. Framing evolution discussion
intellectually. Journal of Research in Science
Teaching, 48(3), 257-280.
PEW RESEARCH CENTER 2015. Major Gaps
Between the Public, Scientists on Key Issues.
Washington, D.C.. Accessed from
http://www.pewinternet.org/interactives/public-
scientists-opinion-gap on 8 December 2016.
PRINCE, M. 2004. Does active learning work? A
review of the research. Journal of engineering
education, 93(3), 223-231.
RATERINK, G. 2016. Reflective journaling for
critical thinking development in advanced practice

Volume 45 (3) December 2019 Laidlaw and Jensen Why Teach Biology if it is Rejected? How to Teach Evolution …………..47
registered nurse students. Journal of Nursing
Education, 55(2), 101-104.
RICE, J. W., CLOUGH, M. P., OLSON, J. K.,
ADAMS, D. C., AND COLBERT, J. T. 2015.
University faculty and their knowledge & acceptance
of biological evolution. Evolution: Education and
Outreach, 8(1), 1.
ROBBINS, J. R., AND ROY, P. 2007. The natural
selection: identifying & correcting non-science
student preconceptions through an inquiry-based,
critical approach to evolution. The American Biology
Teacher, 69(8), 460-466.
RUTLEDGE, M. L., AND MITCHELL, M. A. 2002.
High school biology teachers' knowledge structure,
acceptance & teaching of evolution. The American
Biology Teacher, 64(1), 21-28.)
RUTLEDGE, M. L., & SADLER, K. C. 2007.
Reliability of the measure of acceptance of the theory
of evolution (MATE) instrument with university
students. The American Biology Teacher, 69(6), 332-
335.
RUTLEDGE, M. L., & WARDEN, M. A. 2000.
Evolutionary theory, the nature of science & high
school biology teachers: Critical relationships. The
American Biology Teacher, 62(1), 23-31.
SCHARMANN, L. C., AND BUTLER JR, W. 2015.
The Use of Journaling to Assess Student Learning and
Acceptance of Evolutionary Science. Journal of
College Science Teaching, 45(1), 16.
SCHEURMAN, G. 1998. From Behaviorist to
Constructivist Teaching. Social Education, 62(1), 6-9.
SINATRA, G. M., BREM, S. K., AND EVANS, E. M.
2008. Changing minds? Implications of conceptual
change for teaching and learning about biological
evolution. Evolution: Education and outreach, 1(2),
189-195.
SINATRA, G. M., SOUTHERLAND, S. A.,
MCCONAUGHY, F., AND DEMASTES, J. W. 2003.
Intentions and beliefs in students' understanding and
acceptance of biological evolution. Journal of
Research in Science Teaching, 40(5), 510-528.
SMITH, M. U., AND SIEGEL, H. 2004. Knowing,
believing, and understanding: What goals for science
education?. Science & Education, 13(6), 553-582.
STOVER, S. K., AND MABRY, M. L. 2007.
Influences of Teleological and Lamarckian Thinking
on Student Understanding of Natural
Selection. Bioscene: Journal of College Biology
Teaching, 33(1), 11-18.
STOVER, S. K., MCARTHUR, L. B., AND MABRY,
M. L. 2013. Presenting Global Warming and
Evolution as Public Health Issues to Encourage
Acceptance of Scientific Evidence. Bioscene: Journal
of College Biology Teaching, 39(2), 3-10.
TAJFEL, H., TURNER, J. C., AUSTIN, W. G., AND
WORCHEL, S. 1979. An integrative theory of
intergroup conflict. Organizational identity: A reader,
56-65.
TAJFEL, H., AND TURNER, J. C. 1986. "The social
identity theory of intergroup behaviour". In S.
Worchel & W. G. Austin (eds.). Psychology of
Intergroup Relations. Chicago, IL: Nelson-Hall.
pp. 7–24.
TAJFEL, H. 2010. Social identity and intergroup
relations (Vol. 7). Cambridge University Press.
THROPP, J. 2017. Using Reflective Journaling to
Promote Achievement in Graduate Statistics
Coursework. International Journal of Learning,
Teaching and Educational Research, 16(1).
TRANI, R. 2004. I won't teach evolution; it's against
my religion. And now for the rest of the story…. The
American Biology Teacher, 66(6), 419-427.)
TURNER, J. C., AND OAKES, P. J. 1986. The
significance of the social identity concept for social
psychology with reference to individualism,
interactionism and social influence. British Journal of
Social Psychology, 25(3), 237-252.
VERHEY, S. D. 2005. The effect of engaging prior
learning on student attitudes toward creationism and
evolution. BioScience, 55(11), 996-1003.
WEISBERG, D. S., LANDRUM, A. R., METZ, S. E.,
AND WEISBERG, M. 2018. No missing link:
Knowledge predicts acceptance of evolution in the
United States. BioScience, 68(3), 212-222.
WEISS, M., AND DREESMANN, D. C. 2014.
Aspirations and Expectations: Comparing Scientist
and Teacher Views as a Source of Ideas for Teaching
Evolution. Universal Journal of Educational
Research, 2(5), 421-431.)
WILES, J. R., AND BRANCH, G. 2008. Teachers
who won't, don't, or can't teach evolution properly: a
burning issue. The American Biology Teacher, 70(1),
6-7.)
WILSON, D. S. 2005. Evolution for everyone: how to
increase acceptance of, interest in, and knowledge
about evolution. PLoS Biol, 3(12), e364.)
WINSLOW, M. W., STAVER, J. R., AND
SCHARMANN, L. C. 2011. Evolution and personal
religious belief: Christian university biology‐related
majors' search for reconciliation. Journal of Research
in Science Teaching, 48(9), 1026-1049.
YATES, T. B., AND MAREK, E. A. 2014. Teachers
teaching misconceptions: a study of factors
contributing to high school biology students’
acquisition of biological evolution-related
misconceptions. Evolution: Education and
Outreach, 7(1),

Volume 45 (3) December 2019 Submission Guidelines 48
Bioscene: Journal of College Biology Teaching Submission Guidelines
I. Submissions to Bioscene
Bioscene: Journal of College Biology Teaching is a refereed publication of the Association of College and
University Biology Educators (ACUBE). Bioscene is published online only in May and in print in December.
Submissions should reflect the interests of the membership of ACUBE. Appropriate submissions include:
Articles: Course and curriculum development, innovative and workable teaching strategies that include some
type of assessment of the impact of those strategies on student learning.
Innovations: Laboratory and field studies that work, innovative and money-saving techniques for the lab or
classroom. These do not ordinarily include assessment of the techniques’ effectiveness on student learning.
Perspectives: Reflections on general topics that include philosophical discussion of biology teaching and
other topical aspects of pedagogy as it relates to biology.
Reviews: Web site, software, and book reviews
Information: Technological advice, professional school advice, and funding sources
Letters to the Editor: Letters should deal with pedagogical issues facing college and university biology
educators
II. Preparation of Articles, Innovations and Perspectives
Submissions can vary in length, but articles should be between 1500 and 5000 words in length. This includes
references and tables, but excludes figures. Authors must number all pages and lines of the document in sequence.
This includes the abstract, but not figure or table legends. Concision, clarity, and originality are desirable. Topics
designated as acceptable as articles are described above. The formats for all submissions are as follows:
A. Abstract: The first page of the manuscript should contain the title of the manuscript, the names of the authors
and institutional addresses, a brief abstract (200 words or less) or important points in the manuscript, and
keywords in that order.
B. Manuscript Text: The introduction to the manuscript begins on the second page. It should supply sufficient
background for readers to appreciate the work without referring to previously published references dealing
with the subject. Citations should be reports of credible scientific or pedagogical research.
The body follows the introduction. Articles describing some type of research should be broken into sections
with appropriate subheadings including Materials and Methods, Results, and Discussion. Some flexibility is
permitted here depending upon the type of article being submitted. Articles describing a laboratory or class
exercise that works should be broken into sections following the introduction as procedure, assessment, and
discussion.
Acknowledgment of any financial support or personal contributions should be made at the end of the body
in an Acknowledgement section, with financial acknowledgements preceding personal acknowledgements.
If the study required institutional approval such as an Institutional Review Board (IRB), the approval or
review number should be included in this section. For example, this study was approved under the IRB
number 999999. The editor will delete disclaimers and endorsements (government, corporate, etc.)
A variety of writing styles can be used depending upon the type of article. Active voice is encouraged
whenever possible. Past tense is recommended for descriptions of events that occurred in the past such as
methods, observations, and data collection. Present tense can be used for your conclusions and accepted facts.
Because Bioscene has readers from a variety of biological specialties, authors should avoid extremely
technical language and define all specialized terms. Other than heading titles, the first word in a sentence or
a proper noun, authors should not use capitalization, underlining, italics, or boldface within the text. Authors
should not add extra spaces or indentations, nor should they use any hidden from view editing tools. All
weights and measures must be given in the SI (metric) system.
In- text citations should be done in the following manner:
Single Author:
"… when fruit flies were reared on media of sugar, tomatoes, and grapes" (Jaenike, 1986).
Volume 45 (3) December 2019. Submission Guidelines 49
Two Authors:
“…assay was performed as described previously (Roffner & Danzig, 2004).
Multiple Authors:
“…similar results have been reported previously (Baehr et al., 1999).
C. References: References cited within the text should appear alphabetically by the author's last name at the end
of the manuscript text under the heading references. All references must be cited in the text and come from
published materials in the literature or the Internet. Authors should use the current APA style when formatting
the reference list.
D. Example citations are below.
(1) Articles-
(a) Single author:
DeBuhr, L. E. (2012). Using Lemna to Study Geometric Population Growth. The
American Biology Teacher. https://doi.org/10.2307/4449274
(b) Multi-authored three to seven authors:
Green, H., Goldberg, B., Schwartz, M., & Brown, D. D. (1968). The synthesis of
collagen during the development of Xenopus laevis. Developmental Biology, 18(4), 391–
400. https://doi.org/10.1016/0012-1606(68)90048-1
(c) Mutli-authored more than seven authors
List the first six authors than an ellipsis followed by the last author.
(2) Books-
Bossel, H. (1994). Modeling and Simulation (1st ed.). New York, NY: A K Peters/CRC
Press. https://doi.org/10.1201/9781315275574
(3) Book chapters-
Glase, J. C., & Zimmerman, M. (1993). Population ecology: Experiments with Protistans.
In J. M. Beiswenger (Ed.), Experiments to Teach Ecology (pp. 39–82). Washington, DC:
Ecological Society of America. Retrieved from
https://tiee.esa.org/vol/expv1/protist/protist.pdf
(4) Web sites-
McKelvey, S. (1995). Malthusian growth model. Retrieved November 25, 2005, from
https://www.stolaf.edu/people/mckelvey/envision.dir/malthus.html
E. Tables
Tables should be submitted as individual electronic files in Word (2013+) or RTF format. Placement of
tables should be indicated within the body of the manuscript. The editor will make every effort to place them
in as close a proximity as possible. All tables must be accompanied by a descriptive legend using the
following format:
Table 1. A comparison of student pre-test and post-test scores in a non-majors' biology class.
F. Figures
Figures should be submitted as high resolution (≥ 300dpi) individual electronic files, either TIFF or JPEG.
Placement of figures should be indicated within the body of the manuscript. The editor will make every effort
to place them in as close a proximity as possible. Figures only include graphs and/or images. Figures
consisting entirely of text will not be accepted and must be submitted as tables instead. No figures put together
using a cut and past method will be accepted. All figures should be accompanied by a descriptive legend
using the following format:
Fig. 1. Polytene chromosomes of Drosophila melanogaster.
III. Letters to the Editor
Letters should be brief (400 words or less) and direct. Letters may be edited for length, clarity, and style. Authors
must include institution address, contact phone number, and a signature.

Volume 45 (3) December 2019. Submission guidelines 50
IV. Other Submissions
Reviews and informational submissions may be edited for clarity, length, general interest, and timeliness.
Guidelines for citations and references are the same for articles described above.
V. Manuscript Submissions
All manuscripts are to be sent to the editor electronically and must comply with the same guidelines for text,
figure and table preparation as described above. Authors must clearly designate which type of article they are
submitting (see Section I) or their manuscript will not be considered for publication. Emails should include
information such as the title of the article, the number of words in the manuscript, the corresponding author's
name, and all co-authors. Each author's name should be accompanied by complete postal and email addresses,
as well as telephone and FAX numbers. Email will be the primary method of communication with the editors of
Bioscene.
Communicating authors will receive confirmation of the submission. Manuscripts should be submitted either as
a Microsoft Word or RTF (Rich Text File) to facilitate distribution of the manuscript to reviewers and for
revisions. A single-email is required to submit electronically, as the review process is not necessarily blind unless
requested by an author. If the article has a number of high resolution graphics, separate emails to the editor may
be required. The editors recommend that authors complete and remit the Bioscene Author Checklist with their
submission in order to expedite the review process.
VI. Editorial Review and Acceptance
For manuscripts to be sent out for review, at least one author must be a member of ACUBE. Otherwise, by
submitting the manuscript without membership, the corresponding author agrees to page charges. Charges will
be the membership fee at the time of submission per page. Once the authors' membership or page charge status
has been cleared, the manuscripts will be sent to two anonymous reviewers as coordinated through the Editorial
Board. Reviewer names and affiliation will be withheld from the authors. The associate editors will examine the
article for compliance with the guidelines stated above. If the manuscript is not in compliance or the authors have
not agreed to the page cost provisions stated above, manuscripts will be returned to authors until compliance is
met or the page cost conditions have been met. Reviewers will examine the submission for:
Suitability: The manuscript relates to teaching biology at the college and university level.
Coherence: The manuscript is well-written with a minimum of typographical errors, spelling and
grammatical errors, with the information presented in an organized and thoughtful manner.
Novelty: The manuscript presents new information of interest for college and university biology educators
or examines well-known aspects of biology and biology education, such as model organisms or experimental
protocols, in a new way.
Once the article has been reviewed, the corresponding author will receive a notification of whether the article has
been accepted for publication in Bioscene. All notices will be accompanied by suggestions and comments from
the reviewers. The author must address all of the reviewers' comments and suggestions using the original
document and track changes for any consideration of a resubmission and acceptance. Revisions and resubmission
should be made within six months. Manuscripts resubmitted beyond the six-month window will be treated as a
new submission. Should manuscripts requiring revision be resubmitted without corrections, the associate editors
will return the article until the requested revisions have been made. Upon acceptance, the article will appear in
Bioscene and will be posted on the ACUBE website. Time from acceptance to publication may take between
twelve and eighteen months.
VII. Revision Checklist
Manuscripts will be returned to authors for failure to follow through on the following:
A. Send a copy of the revised article using track changes for text changes back to the associate editor,
along with an email stating how reviewers’ concerns were addressed.
B. Make sure that references are formatted appropriately in APA style format.
C. Make sure that recommended changes have been made or a clear explanation as to why they were not.
D. Figures and legends sent separately, but placement in manuscript should be clearly delimited.
VIII. Editorial Policy and Copyright
It is the policy of Bioscene that authors retain copyright of their published material.