volume 6 number 3 march 2019 pages 417–628 matersial …
TRANSCRIPT

COMMUNICATION Tong-Yi Zhang, Yunzhi Wang et al . Making metals linear super-elastic with ultralow modulus and nearly zero hysteresis
MaterialsHorizons
ISSN 2051-6347
rsc.li/materials-horizons
Volume 6 Number 3 March 2019 Pages 417–628

This journal is©The Royal Society of Chemistry 2019 Mater. Horiz., 2019, 6, 515--523 | 515
Cite this:Mater. Horiz., 2019,
6, 515
Making metals linear super-elastic with ultralowmodulus and nearly zero hysteresis†
Jiaming Zhu,ab Yipeng Gao,c Dong Wang,a Ju Li, d Tong-Yi Zhang*e andYunzhi Wang*c
We demonstrate a novel materials design approach to achieve
unprecedented properties by utilizing nanoscale chemo-mechanical
coupling. In particular, by using computer simulations we demon-
strate how to engineer ultralow modulus (12 GPa), nearly hysteresis-
free, and linear super-elastic metals with a giant elastic strain limit
(2.7%) by creating appropriate concentration modulations (CMs) at
the nanoscale in the parent phase and by pre-straining to regulate the
stress-induced martensitic transformation (MT). The nanoscale CMs
created via spinodal decomposition produce corresponding phase
stability modulations, suppress autocatalysis in nucleation, impose
nano-confinements on growth, and hinder long-range ordering of
transformation strain during the MT, which changes the otherwise
sharp first-order transition into a smeared, macroscopically conti-
nuous transition over a large stress range. The pre-straining generates
retained martensitic particles that are stable at the test temperature
after unloading and act as operational nuclei in subsequent load
cycles, eliminating the stress–strain hysteresis and offering an ultra-
low apparent Young’s modulus. Materials with a high strength and an
ultralow apparent Young’s modulus have great potential for applica-
tion in orthopaedic implants.
Reducing the modulus of the current generation of metallicorthopaedic implants (such as the Ti-alloys) to match that ofnatural bones (B20 GPa) is critical for avoiding the long standing‘‘stress shielding’’ problem in bone implant applications,1–3
but it imposes a great challenge to physical metallurgy.4–6
According to Frenkel,4 the ideal strength of a ductile materialis about 10% of the Young’s modulus and most metals yield at ahundredth of their ideal strength. The typical yield strength ofTi-alloys is in the order of 1000 MPa. Thus, a 20 GPa moduluswould imply that the alloy would yield at approximately 50% ofits ideal strength.
Besides true elasticity, however, an alternative recoverable-strain carrier in materials, which is free from such limits, is thepseudo- or super-elasticity related to reversible stress-inducedstructural phase transformations, such as martensitic trans-formations (MTs) in ferroelastic materials.7–9 Several break-throughs have been made recently10–14 in reducing the apparentmodulus of metallic alloys using these structural phase trans-formations. For example, the so-called Gum Metals,12 whilehaving a strength of approximately 1200 MPa, show a modulus aslow as B56 GPa, with a large recoverable strain limit of B2.5%.The other example is NICSMA13 (nanowire in situ compositewith shape memory alloy), that has a strength of B1650 MPa,
a Center of Microstructure Science, Frontier Institute of Science and Technology,
Xi’an Jiaotong University, Xi’an 710049, Chinab Department of Mechanical Engineering, Hong Kong University of Science and
Technology, Clear Water Bay, Kowloon, Hong Kong, Chinac Department of Materials Science and Engineering, The Ohio State University,
2041 College Road, Columbus, OH 43210, USA. E-mail: [email protected] Department of Nuclear Science and Engineering and Department of Materials
Science and Engineering, Massachusetts Institute of Technology, Cambridge,
MA 02139, USAe Materials Genome Institute, Shanghai University, 333 Nanchen Road,
Shanghai 200444, China. E-mail: [email protected]
† Electronic supplementary information (ESI) available. See DOI: 10.1039/c8mh01141a
Received 13th September 2018,Accepted 26th November 2018
DOI: 10.1039/c8mh01141a
rsc.li/materials-horizons
Conceptual insightsAn ideal orthopaedic implant should have an elastic modulus similar tothat of natural bones to ensure remodeling of the latter under physio-logical conditions. However, the current generation of orthopaedicimplants, such as the Ti-alloys, have a much higher modulus and, as aconsequence, much of the load is transmitted through the implantsrather than through the natural bones surrounding them, leading tobone degradation. On the other hand, the current generation of shapememory alloy actuators such as TiNi based alloys suffer from lowefficiency and a lack of precise position control caused by large hysteresisand strongly non-linear elasticity. In this study, we demonstrated a novelmaterials design concept to achieve a combination of unprecedentedproperties, including an ultralow-modulus matching that of natural bonesand almost zero hysteresis and linear super-elasticity, by intentionallycreating nanoscale composition modulations via spinodal decomposition,that help stabilize but also confine the growth and limit the retreat ofstress-induced martensitic domains. The compositional wavelength andamplitude are tuned such that after ‘‘training’’, the martensite nuclei canmarch and retreat in an ordered fashion upon loading/unloading, anddo not have to be nucleated a new each time.
MaterialsHorizons
COMMUNICATION
Ope
n A
cces
s A
rtic
le. P
ublis
hed
on 0
4 D
ecem
ber
2018
. Dow
nloa
ded
on 4
/10/
2019
9:5
6:28
PM
. T
his
artic
le is
lice
nsed
und
er a
Cre
ativ
e C
omm
ons
Attr
ibut
ion
3.0
Unp
orte
d L
icen
ce.
View Article OnlineView Journal | View Issue

516 | Mater. Horiz., 2019, 6, 515--523 This journal is©The Royal Society of Chemistry 2019
but shows a modulus of B28 GPa. Although these apparentmoduli are still higher than that of natural bones, and NICSMAis not suitable for orthopaedic applications owing to thetoxic Ni element, these studies13,15–19 have demonstrated a trueopportunity to engineer super-strong, almost hysteresis-free andlinear super-elastic, and ultralow-modulus materials throughMTs. In addition, MTs also offer many other novel physicaland functional properties that are absent in non-transformingmaterials, including the shape memory effect20 and Invar andElinvar anomalies.12,17 These extraordinary properties open upnew avenues, not only for biomedical applications, but alsofor many other important technological fields such as spacesciences,7 aviation and transportation,21 micro-electro-mechanicalsystems,22 and so forth.
Being first-order in nature, MTs usually exhibit a largehysteresis in stress–strain (SS) curves, consisting of an intrinsiclinear elasticity of the parent phase with a high Young’s modulus,followed by a stress-plateau before reaching the intrinsic linearelasticity of the martensitic phase. This large hysteresis is theorigin of low efficiency (less than 1%) of shape memory alloy(SMA) actuators, and the strong non-linearity makes preciseposition control of SMA actuators difficult.22 Obviously thisSS behaviour is completely opposite to the ultralow-modulus,hysteresis-free and linear super-elastic properties desired.Extensive efforts have been made in recent years to alterthe characteristics of MTs to achieve desirable mechanicalresponses. For example, it has been shown that the hysteresisand nonlinearity of the pseudo-elasticity of ferroelastic materialscould be reduced by cold-working,12,14,23–28 reducing the struc-tural anisotropy of the martensitic phase,29 introducing elastic
and inelastic strain matching in a nanocomposite,13 introducingnano-precipitates in the parent phase,30–33 suppressing the MTsinto the so-called strain glass transitions,34,35 improving thegeometrical compatibility between the parent and martensiticphases through alloying,36 and by using transformation pathwayengineering.37,38 Although the hysteresis and nonlinearity ofpseudo-elasticity are reduced effectively through these efforts,the apparent Young’s modulus is still significantly higher thanthat of the natural bone, the SS hysteresis loops are still far fromvanishing, and materials that can satisfy the cofactor conditionare rather limited. It should be noted that to distinguish thecombined intrinsic elasticity and pseudo-elasticity from theintrinsic elasticity, we refer to the elastic modulus associatedwith the former as the apparent Young’s modulus.
We have noticed that miscibility gaps widely exist in ferro-elastic systems, including Ti–Nb,18 Mn–Cu,39 Ti–V,40 andFe–Mn,41 in which spinodal decompositions in the parentphase produce concentration modulations (CMs) at nanoscale(with wavelengths ranging from several to several hundreds ofnanometres). Based on the fact that the MTs starting tempera-ture (Ms) is a strong function of the alloy composition,42,43 wehypothesize that the nanoscale CMs produced by spinodaldecomposition in the parent phase would behave like a three-dimensional (3D) interpenetrating multi-layer ‘‘nanocompo-site’’ (see Fig. 1b and 2(a2)) with a systematic variation in theMs and, hence, would effectively impose a nano-confinement tothe martensitic transformation (MT) and significantly alterits characteristics. As a matter of fact, our recent computersimulations44 have shown that the overall MT characteristicscan be tuned effectively from a typically first-order transition to
Fig. 1 Design of the nanoscale concentration modulated ferroelastic material (CMFM) and the effect of pre-straining. (a1) Schematic drawing of thenanoscale concentration variation in a CMFM. (a2) Dependence of Ms on the Nb concentration. (a3) Schematic drawing of the Ms modulation in theCMFM. Regions with Ms above the testing temperature are highlighted in green, within which martensite is thermodynamically stable. (b) Iso-surface Nbconcentration contours of a local region in the computational cell shown in Fig. 2(a2), revealing an onion-like CM structure. Schematic drawing of theSS curves for: (c) a ferroelastic system having a uniform Nb concentration; (d) CMFM; and (e) pre-strained CMFM. (f) The Landau free energy curves asfunction of Nb concentration.
Communication Materials Horizons
Ope
n A
cces
s A
rtic
le. P
ublis
hed
on 0
4 D
ecem
ber
2018
. Dow
nloa
ded
on 4
/10/
2019
9:5
6:28
PM
. T
his
artic
le is
lice
nsed
und
er a
Cre
ativ
e C
omm
ons
Attr
ibut
ion
3.0
Unp
orte
d L
icen
ce.
View Article Online

This journal is©The Royal Society of Chemistry 2019 Mater. Horiz., 2019, 6, 515--523 | 517
a high-order like continuous transition by a concentrationmodulation (CM) produced by spinodal decomposition, andrecent experimental observations18,39 also seem to support thishypothesis. However, the SS curves obtained in the previousstudy44 are far from linear, the hysteresis is far from zero andthe apparent Young’s modulus (for a single crystal) is limited to29.3 GPa (see Fig. S2, ESI†). In this study, we demonstrate howto simultaneously achieve an ultralow apparent Young’s mod-ulus (12 GPa), almost zero hysteresis and linear super-elasticitywith a large elastic strain limit (see Fig. S2 for comparison,ESI†) by taking advantage of a synergic effect between the CMand pre-straining, that is, by adjusting the CM to introduce pre-existing martensitic nuclei via pre-straining to circumvent thenucleation events during the MT.
The model alloy system considered in this demonstrationis the same as that considered in our previous study,44 that is,Ti2448 (short for Ti–24Nb–4Zr–8Sn–0.1O in wt%) and the con-centration dependent critical stress, sMs
, for the stress-inducedMT and stress-free transformation strains (SFTS) are availablein the literature43,45–49 and are shown in Fig. S3 (ESI†). CMs inthe parent phase of Ti2448 produced by spinodal decomposi-tion have been reported in recent studies.18,50 According tothese experimental studies, we first designed the amplitudesand wavelengths of the CMs by controlling the ageing tempera-ture and the time duration of the spinodal decomposition to:(i) produce a 3D interconnected, onion-like layered structure(as shown in Fig. 1b) at nanoscale in the parent phase; and(ii) ensure a small fraction of the parent phase has a Ms abovethe testing temperature, as illustrated in Fig. 1a and b. Thealloy of such a nonuniform composition will no longer have asingle value of sMs
(see Fig. S3, ESI†) and the corresponding
Landau free energy surface is shown schematically in Fig. 1f.The stress-induced MT will start from the layer having thelowest value of sMs
and spread gradually to the adjacent layersas the applied load increases. Thus, the stress-induced MT isexpected to take place continuously over a broad range of stress,which is in sharp contrast to the characteristics of MTs insystems having a uniform composition and thus a single-valueof sMs
, as shown in Fig. 1c. Furthermore, the transformed layerswill shed the load incrementally onto the un-transformed layersduring loading, realizing the elastic strain limits of the parentphase far beyond that at the yield point of a bulk counterpartthat has the same, but a uniform composition. This is similar tothe transformation strain–elastic strain matching achieved inNICSMA.13 In this way, the SS curve will show an integratedelastic and pseudo-elastic characteristic, as illustrated in Fig. 1d.
Furthermore, if the minimum value of sMscould be further
reduced, the elastic and pseudo-elastic deformation will occursimultaneously at the onset of loading and, thus, the SS curvewill become linear and hysteresis-free, and be accompaniedby an ultralow apparent Young’s modulus. This goal may beachieved if martensitic particles pre-exist in the alloy and serveas operational nuclei (i.e., over the critical nucleus size) and areready to grow when an external load is applied. This is becausethe critical stress required for growth (e.g., the Peierls stress forglissile interface migration51) is much lower than that requiredfor nucleation. Such pre-existing martensitic particles could beintroduced by: (i) ensuring a small fraction of the composi-tional nanodomains in the parent phase have a Ms above thetesting temperature (as illustrated in Fig. 1a and b); and (ii) pre-straining (similar to the pre-straining effect on NICSMA13)to help these domains to overcome their metastability and
Fig. 2 Comparison of the characteristics of MTs in Ti2448 single crystals having (a1) a uniform and (a2) a modulated Nb concentration. The Nbconcentration modulation shown in (a2) (represented by four iso-surface concentration contours marked by different colours) is obtained by spinodaldecomposition in the parent phase at 773 K for a reduced time of 1900. (b1 and b2) The corresponding first loading–unloading SS curves under uniaxialtension along [001]. (c1 and c2) The corresponding microstructures after the unloading of the first loading–unloading cycle shown in (b1) and (b2).(d1 and d2) The corresponding SS curves of the second loading–unloading cycle of the two systems. The first loading–unloading cycle is referred to aspre-straining in the present study.
Materials Horizons Communication
Ope
n A
cces
s A
rtic
le. P
ublis
hed
on 0
4 D
ecem
ber
2018
. Dow
nloa
ded
on 4
/10/
2019
9:5
6:28
PM
. T
his
artic
le is
lice
nsed
und
er a
Cre
ativ
e C
omm
ons
Attr
ibut
ion
3.0
Unp
orte
d L
icen
ce.
View Article Online

518 | Mater. Horiz., 2019, 6, 515--523 This journal is©The Royal Society of Chemistry 2019
become stable operating martensitic nuclei in subsequentloading–unloading cycles. Fig. 1e schematically shows the SScurve of a pre-strained and CM sample, exhibiting an ultralowmodulus, a linear pseudo-elasticity and an almost zero hysteresis.
To test the above hypothesis, phase field simulations werecarried out for a multifunctional b TiNb-base alloy, Ti2448, inwhich the b parent phase (BCC, point group m%3m) transformsinto an a00 martensite (orthorhombic, point group mmm) understress.52 A large miscibility gap exists in the Ti–Nb system,with a spinodal range between B10 to B90 at% of Nb.53 Inparticular, a concentration modulation of Nb between 8 and20 at% has been observed experimentally in Ti2448.18 Fig. S3(ESI†) shows the concentration dependences of sMs
and theSFTS of Ti2448,54,55 in which the amplitude of the Nb CM isobtained from the experimental measurements.18 Parametersin the free energy models, including the expansion coefficientsin the Landau free energy for the MT and in the chemical freeenergy of the parent phase for the spinodal decomposition, aredetermined by fitting the simulation results of: (i) the SS curveof a homogeneous system; and (ii) the CMs produced by thespinodal decomposition to the corresponding experimentalobservations (see ESI† for the development of the phase fieldmodel based on the combination of Landau theory,56 gradientthermodynamics,57 and Khachaturyan–Shatalov’s microelasti-city theory58).
Fig. 2(a1 and a2) show the Nb concentration in an initiallyhomogenous (before decomposition) and spinodally decom-posed Ti2448 single-crystal computational cell (with a size of128 � 128 � 128 nm), respectively. In the latter the CM corre-sponds to the spinodal decomposition in Ti2448 taking placeat 773 K for a reduced time of t* = 1900. The SS curve of theuniform system at room temperature obtained by uniaxialtension along [001] is shown in Fig. 2(b1), which is characterizedby a typical hysteresis with a stress plateau that is frequentlyobserved in experiments.59 In CMFM (Fig. 2(a2)), the Nb-lean andNb-rich regions form a typical interpenetrating domain networkfrom the spinodal decomposition. Owing to the CM in the parentphase, the hysteresis associated with the stress-induced MT isreduced drastically, as shown in Fig. 2(b2), indicating that themechanical behaviour of the alloy depends strongly on the CM.An interesting observation in Fig. 2(b2) is that the SS curve, afterthe stress plateau, becomes almost linear and hysteresis-free.This finding implies that an almost linear pseudo-elasticity in theentire stress or strain range could be achieved if the initialhysteresis could be eliminated. We demonstrate below that thiscan be achieved by pre-straining.
From Fig. 2(c1 and c2) and Fig. S4 (ESI†), we find a keydifference between the microstructures after the unloading ofthe first loading cycle in the compositionally homogeneousand modulated systems, that is, there are abundant retainedmartensitic particles in the latter, as shown in Fig. 2(c2) andFig. S4 (ESI†). Furthermore, the amount of retained martensiteafter the first loading–unloading cycle increases with increasingageing time held for the spinodal decomposition in the parentphase. This is because the martensitic phase is more stable inthe Nb-lean regions, as indicated in Fig. S3 (ESI†) and Fig. 1f,
and the volume fraction of the Nb-lean regions increases withincreasing ageing time (see Fig. S5 and S6, ESI†). A greateramount of retained martensite corresponds to a larger irrecover-able strain during the first loading–unloading cycle, as shown inFig. 2(b2) and 3a. However, if we use the first loading–unloadingcycle as pre-straining (or training), then the retained martensiticparticles will serve as operational nuclei and grow directly insubsequent loadings and, hence, eliminate the initial largehysteresis. This is exactly what we have observed from the SScurves obtained during the second loading–unloading cycleshown in Fig. 2(d2) and 3b. For example, these SS curves arealmost hysteresis-free and almost linear. Moreover, the SS curvesexhibit large elastic strains, for example, 2.7% at 400 MPa asshown in Fig. 2(d2). The stress-free transformation strain in theloading direction for a compositionally homogeneous system is2.9% (see Fig. 2(b1)). The elastic strain limit of the CM system isexpected to be even higher because, as mentioned earlier, theonion-like layered nanocomposite should be able to realizeelastic strain limits far exceeding that of the bulk counterpartthat has a uniform composition.
Fig. S7(b1–b10) and S8(c1–c10) (ESI†) show the microstruc-ture evolutions corresponding to the loading and unloadingpoints marked on the first and second loading–unloading SScurves of Fig. S7a and S8a (ESI†), respectively, for an alloy thathas an average CM wavelength of B44 nm after ageing at 773 Kfor t* = 1900. The detailed shapes, including the wavelengthsand amplitudes of the concentration waves in 1D obtained forall of the ageing times can be found in Fig. S6a (ESI†). TheSupplementary Movie (ESI†) shows the entire evolution processof the microstructure corresponding to the SS curves. As we cansee from these figures and the Supplementary Movie (ESI†), thealmost linear pseudo-elasticity is associated with gradual growth(by both extension of the existing disks of individual martensiticvariants) and addition of more disks in self-accommodation con-figurations (as shown in Fig. S8(e1–e4) and (e5–e8), ESI†), andshrinkage (in the opposite manner) of the self-accommodatingmulti-variant martensitic domains upon loading and unloading,respectively. Comparing Fig. S7(b4, b5) and S8(c3–c5) withFig. S7(b6, b7) and S8(c6–c8) (ESI†), we can see that the micro-structures corresponding to the five points on the unloadingcurves are almost the same as those corresponding to thefive points on the loading curves (Fig. S7a and S8a, ESI†). Uponloading there is always a retained parent phase, while uponunloading there is always a retrained martensite. This reversibleevolution of the microstructure underlies the almost hysteresis-free linear pseudo-elasticity. The hysteresis and nonlinearityseen in the first loading–unloading cycle are caused by the initialirreversible evolution of the microstructure (see, for example, theretained martensite in Fig. S7(b10) and S8(c1), which does notexist in Fig. S7(b1), ESI†).
Fig. 3a and b show the SS curves obtained during the first andsecond loading–unloading cycle, respectively, for systems aged fordifferent times during the spinodal decomposition, and Fig. 3cand d show the corresponding quantitative analyses of the SScurves, including the hysteresis area, residual strain, recoverablestrain, incipient modulus (see inset in Fig. 3d for the definition),
Communication Materials Horizons
Ope
n A
cces
s A
rtic
le. P
ublis
hed
on 0
4 D
ecem
ber
2018
. Dow
nloa
ded
on 4
/10/
2019
9:5
6:28
PM
. T
his
artic
le is
lice
nsed
und
er a
Cre
ativ
e C
omm
ons
Attr
ibut
ion
3.0
Unp
orte
d L
icen
ce.
View Article Online

This journal is©The Royal Society of Chemistry 2019 Mater. Horiz., 2019, 6, 515--523 | 519
and linearity. After the first load cycle (i.e., the pre-straining),the hysteresis area reduces dramatically (by one order ofmagnitude), and the residual strain drops to zero. The residualstrain increases rapidly as the ageing time (or CM amplitudeand wavelength) increases. The systems remain super-elastic,although the recoverable strain gradually decreases with increasingageing time. Ageing at 773 K for t* = 3500 (with an approximatewavelength of 50 nm) brings about the lowest incipient mod-ulus of 12 GPa. Comparison of the modulus, elastic strain limit,hysteresis area and linearity of the super-elasticity between thepredictions from the current study with those from state-of-the-art
systems reported in the literature is shown in Fig. 4. It is readilyseen that the CMFM outperforms the material systems reportedin existing studies in terms of the ultralow modulus, smallhysteresis area and linearity of the super-elasticity. The elasticstrain limit of CMFM is smaller than those of the Ti–Ni SMAs,NICSMA and NCATB because the CMFM, being a TiNb-basedSMA, has a smaller SFTS, as indicated by the difference in thesuper-elasticity between the Ti–Nb and Ti–Ni alloys shownin Fig. 4a. It is noteworthy that the CMFM exhibits a perfectcombination of ultralow modulus, almost zero hysteresis andlinear super-elasticity.
Fig. 4 (a) Comparison of the modulus and elastic strain limit between predictions from the current study with those from state-of-the-art systemsreported in the literature. Ti244823 is short for Ti–24Nb–4Zr–8Sn in wt%, NICSMA13 refers to nanowire in situ composite with SMA and NCATB68
represents Fe–28Ni–17Co–11.5Al–2.5Ta–0.05B in at%. (b) Comparison of the hysteresis ratio and linearity. The definition of the hysteresis ratio is theratio between the area encircled by the SS loop and the area under the SS curve, which is highlighted in blue in the inset of (b). The properties of CMFMare determined from the SS curve shown in Fig. 2(d2).
Fig. 3 Mechanical properties of CM Ti2448 systems obtained with different ageing times used for the spinodal decomposition heat treatment of theparent phase. SS curves of the various CM systems obtained for: (a) the first and (b) the second load cycle. The detailed shapes of the concentration wavesin 1D obtained for all of the ageing times can be found in Fig. S5 (ESI†). (c) The hysteresis area, residual strain and recoverable strain and (d) the incipientmodulus and linearity index found in the various CM systems. These properties are obtained from quantitative analyses of the SS curves presented in (a)and (b) for the first and second loading–unloading cycles. The incipient modulus and linearity are defined in the inset of (d). Note that the incipientmodulus and tangent modulus describe the modulus of different parts of the non-linear SS curves. When the SS curves are linear, these two modulibecome the same and are equal to the apparent Young’s modulus.
Materials Horizons Communication
Ope
n A
cces
s A
rtic
le. P
ublis
hed
on 0
4 D
ecem
ber
2018
. Dow
nloa
ded
on 4
/10/
2019
9:5
6:28
PM
. T
his
artic
le is
lice
nsed
und
er a
Cre
ativ
e C
omm
ons
Attr
ibut
ion
3.0
Unp
orte
d L
icen
ce.
View Article Online

520 | Mater. Horiz., 2019, 6, 515--523 This journal is©The Royal Society of Chemistry 2019
It should be noted that these simulation results wereobtained for a single crystal with a tensile axis parallel to [001].For polycrystalline systems, the incipient modulus will be higher.In a single crystal of Ti2448 considered in the current study, thepseudo-elastic strains (i.e., the transformation strains) along the[100], [110], and [111] directions are 1.4%, 2.2% and 0.8%,respectively.59 The intrinsic elastic strains along these directionsare 1.38%, 0.72%, and 0.46%, respectively, when loaded to400 MPa.59 Then, the apparent Young’s moduli in these direc-tions are 14.3 GPa, 13.7 GPa, and 31.7 GPa, respectively. Based onthe rule of mixtures, the apparent Young’s modulus of a poly-crystal of CM Ti2448 can be estimated via the average of thesethree moduli of a single crystal and it is approximately 19.9 GPa.Ti2448 alloys with such a low modulus may have great potentialfor use in biomedical applications. It should be noted that theincipient modulus and tangent modulus are used to describe theelastic/pseudo-elastic modulus of different parts of the non-linearSS curves. They become the same and can be simply termed asthe apparent Young’s modulus when the SS curves become linear(see Fig. 3b).
To examine the stability of the pre-strained (trained) alloy,the third loading–unloading SS curve obtained for the alloyaged for t* = 1900 is shown in Fig. 5a, together with the SScurves from the first two load cycles. The SS curve of the thirdcycle coincides with that of the second one (see the inset inFig. 5a), indicating that the mechanical behaviour of the alloy is
stable after the pre-straining (i.e., the first load cycle). Micro-structures at various loading–unloading states in the third cyclecan be found in Fig. S8(d1–d10) (ESI†). When comparing themicrostructures in Fig. S8(d1–d10) with those in Fig. S8(c1–c10)(ESI†), we found that the microstructures corresponding to thesame points on the SS curves of the third and second loading–unloading cycles are almost identical. This observation isconsistent with the quantitative comparison of the microstruc-ture evolution processes obtained for the third and second loadcycles shown in Fig. 5b, in which the volume fraction versusstress curve of the third load cycle coincides with that of thesecond cycle.
The retained martensitic particles shown in Fig. 2(c2) (and alsoFig. S4, ESI†) consist of multi-variants in self-accommodatingconfigurations. The degree of self-accommodation among differ-ent variants, determined by the number of variants that can bepacked effectively in a given size of space, determines the stabilityof these martensitic particles and the hysteresis of the loading–unloading cycles. The interconnected Nb-rich nanodomain net-work (having a high sMs
) imposes a strong confinement on the MTin the Nb-lean regions (having a low sMs
). If the confinement is toosmall, then single-variant martensitic particles60 may dominatethe microstructure because, in this case, it is too costly to form amulti-variant configuration with inter-variant boundaries (domainwalls).61 This is what was observed in a system with a spinodal CMwavelength B12 nm (see Fig. S9a, ESI†) and larger stresses are
Fig. 5 The stability of the pre-strained system and the influence of the CM wavelength. (a) SS curves and (b) normalized volume fraction of martensiteduring the first, second and third cyclic loading–unloading obtained for the CM system having a wavelength of B44 nm. The inset in (a) shows theseSS curves without the horizontal offset. (c) SS curves of the concentration modulated systems with different wavelengths L obtained during the secondloading cycle. (d) Variation of the hysteresis area of the SS curves shown in (c). The inset of (d) shows the distributions of martensitic domains havingdifferent numbers of variants in the pre-strained CM systems with different wavelengths L. CM in systems with different wavelength are shown in Fig. S11(ESI†), and the concentration waves in the 1D version of these systems can be found in Fig. S10 (ESI†). These CMs having different wavelength areobtained by changing the gradient coefficients in the free energy model for the spinodal decomposition in the parent phase.
Communication Materials Horizons
Ope
n A
cces
s A
rtic
le. P
ublis
hed
on 0
4 D
ecem
ber
2018
. Dow
nloa
ded
on 4
/10/
2019
9:5
6:28
PM
. T
his
artic
le is
lice
nsed
und
er a
Cre
ativ
e C
omm
ons
Attr
ibut
ion
3.0
Unp
orte
d L
icen
ce.
View Article Online

This journal is©The Royal Society of Chemistry 2019 Mater. Horiz., 2019, 6, 515--523 | 521
required for the formation of such non-self-accommodating,single-variant martensitic particles (compared to the SS curvesshown in Fig. S8a and S9b, ESI†). The single-variant martensiticparticles are able to induce the formation of self-accommodatingtwin variants only when the applied stress reaches a certain level,meaning that the size of the domains with sMs
below the appliedstress becomes sufficiently large. This leads to a relatively largehysteresis (Fig. 5d and Fig. S9b, ESI†).
By systematically varying the CM wavelengths (e.g., from12 to 110 nm, see Fig. S10, ESI†) (which can be easily realized inthe experiment by controlling the aging temperature and timeduration of the spinodal decomposition), we found that theconfigurations of the dominant martensitic particles retainedafter unloading during the first cycle change from a single-variant to a multiple-variant (inset of Fig. 5d) and that they arestable after unloading. The hysteresis of the correspondingSS curves (Fig. 5c) during the second loading–unloading cycle(i.e., after pre-straining) decreases monotonically towards zero(Fig. 5d) in the system with L B 110 nm. It is interesting to notethat only the self-accommodated 4-variant martensitic particleswith herringbone structures are found in such a system (see thestructure enclosed by a red circle in Fig. S11, ESI†). This isbecause a 4-variant herringbone configuration (Fig. S11, ESI†)has the highest geometric compatibility in this system52,62 (seeESI,† Geometric Compatibility Analysis), and all of the Nb-leanregions are large enough to accommodate the 4-variant parti-cles. Thus, different CMs will have different spatial confine-ments in terms of both the size (CM wavelength) and strength(CM amplitude) and are able to accommodate martensiticparticles with different degrees of geometrical compatibilities,offering the flexibility to control the size of the hysteresis loop.Furthermore, as the CMs set up the spatial partitioning of themartensitic domains and the same partition repeats itself in theloading–unloading cycles after pre-straining, in principle wecould precisely control this ‘‘seeding’’ process with well-orderedCM patterns produced by spinodal decomposition63 to form‘‘strain crystals’’ for the design of ferroelastic metamaterials.
It should be noted that the above simulations were carriedout without considering the effects of other extended defectssuch as dislocations and grain boundaries. These defects mayalso contribute to the broadly smeared characteristics andreversibility of the MT. In addition, the Peierls stress (fromlattice friction) for the migration of interfaces during the MTis ignored, which may make an additional contribution to thestress hysteresis when the interfaces are thin relative to thelattice spacing.9
Conclusions
In conclusion, we have demonstrated a novel approach tosimultaneously achieve ultralow apparent Young’s modulus,nearly hysteresis-free and linear super-elasticity with a largeelastic strain limit in ferroelastic materials via regulating themartensitic transformation (MT) through nanoscale concentra-tion modulations (CMs) generated by spinodal decomposition
in the parent phase and pre-straining. In addition to thespinodal decomposition, nanoscale CM could be achievable bymany other means, including multi-layer thin film processingtechniques64 for films, the accumulative roll-bonding process65
for bulk materials, and the additive manufacturing technique,66
for example, 3D printing, for components that have arbitraryand complicated shapes. Specifically, magnetron sputtering cangenerate films with a controllable CM along the thickness direc-tion (i.e., 1D CM), and the thickness of each layer ranges fromnanometres to microns. It is anticipated that a carefully designed1D nanoscale CM would work equally well as the 3D CMs shownin this study in tuning the characteristics of the MT and thecorresponding mechanical properties. Accumulative roll-bondingcould be used to develop bulk CM materials by accumulativelyrolling a set of sheets with different compositions. 3D printingproduces naturally CM components because of its extremely highcooling rate and severe solute segregation in the inter-dendriticregions during solidification.
As ferroelectric67 and ferromagnetic17 transitions sharemany common characteristics with the ferroelastic MTs, theapproach demonstrated in the current study may open up anew avenue for the design of ferroelectric and ferromagneticmaterials as well for unprecedented properties.
The ultralow apparent Young’s modulus achieved in thepresent study may have a great potential for solving the longstanding ‘‘stress shielding’’ problem in orthopaedic applica-tions, which is the main factor slowing the recovery of patientsand limiting the service life of the orthopaedic implants. Bonesundergo constant remodelling under physiological conditions,which is carried out by osteoblast and osteoclast cells. Boneremodelling will not work properly if the bone is not undernormal levels of load. The much higher modulus of the currentgeneration of bone implants means that most of the load istransmitted through the implant material rather than throughthe natural bones surrounding it, leading to bone degradation.The elastic modulus estimated for this CM Ti2448 alloy, B20 GPa,match exactly to that of natural bones and, thus, could eliminatecompletely this stress-shielding problem.
Finally, the linear super-elasticity with a large elastic strainlimit is attractive in a rich variety of applications, includingsensors and high-efficiency and high-precision actuators.
Conflicts of interest
There are no conflicts to declare.
Acknowledgements
YG and YW acknowledge the financial support of the US NaturalScience Foundation, Grant No. DMR-1410322, and the US Depart-ment of Energy, Grant No. DE-SC0001258; JL acknowledgessupport by NSF DMR-1410636; TY Zhang acknowledges thefinancial support of research grants (No. 15DZ2260300 andNo. 16DZ2260600) from the Science and Technology Commis-sion of Shanghai Municipality. D Wang acknowledges the
Materials Horizons Communication
Ope
n A
cces
s A
rtic
le. P
ublis
hed
on 0
4 D
ecem
ber
2018
. Dow
nloa
ded
on 4
/10/
2019
9:5
6:28
PM
. T
his
artic
le is
lice
nsed
und
er a
Cre
ativ
e C
omm
ons
Attr
ibut
ion
3.0
Unp
orte
d L
icen
ce.
View Article Online
522 | Mater. Horiz., 2019, 6, 515--523 This journal is©The Royal Society of Chemistry 2019
National Key Research and Development Program of China(Grants No. 2016YFB0701302, 2014CB644003), the NationalNatural Science Foundation of China (Grants No. 51671156)and the Innovative Research Team in the University (GrantsNo. IRT13034). The work was also supported by the 111 project(No. D16002) from the State Administration of Foreign ExpertsAffairs, PRC.
References
1 M. Long and H. Rack, Biomaterials, 1998, 19, 1621–1639.2 M. Niinomi and M. Nakai, Int. J. Biomater., 2011, 2011, 1–10.3 M. Geetha, A. K. Singh, R. Asokamani and A. K. Gogia, Prog.
Mater. Sci., 2009, 54, 397–425.4 J. Frenkel, Z. Phys., 1926, 37, 572–609.5 S. Ogata, Science, 2002, 298, 807–811.6 J. Li, MRS Bull., 2007, 32, 151–159.7 K. Otsuka and C. M. Wayman, Shape memory materials,
Cambridge University Press, Cambridge, UK, 1998.8 J. W. Christian, G. B. Olson and M. Cohen, Le J. Phys. IV,
1995, 5, C8-3–C8-10.9 E. K. H. Salje, Annu. Rev. Mater. Res., 2012, 42, 265–283.
10 D. Kuroda, M. Niinomi, M. Morinaga, Y. Kato and T. Yashiro,Mater. Sci. Eng., A, 1998, 243, 244–249.
11 M. Niinomi, JOM, 1999, 51, 32–34.12 T. Saito, T. Furuta, J.-H. Hwang, S. Kuramoto, K. Nishino,
N. Suzuki, R. Chen, A. Yamada, K. Ito, Y. Seno, T. Nonaka,H. Ikehata, N. Nagasako, C. Iwamoto, Y. Ikuhara andT. Sakuma, Science, 2003, 300, 464–467.
13 S. Hao, L. Cui, D. Jiang, X. Han, Y. Ren, J. Jiang, Y. Liu,Z. Liu, S. Mao, Y. Wang, Y. Li, X. Ren, X. Ding, S. Wang,C. Yu, X. Shi, M. Du, F. Yang, Y. Zheng, Z. Zhang, X. Li,D. E. Brown and J. Li, Science, 2013, 339, 1191–1194.
14 S. Guo, Q. Meng, X. Zhao, Q. Wei and H. Xu, Sci. Rep., 2015,5, 14688.
15 J. P. Cui, Y. L. Hao, S. J. Li, M. L. Sui, D. X. Li and R. Yang,Phys. Rev. Lett., 2009, 102, 1–4.
16 D. Wang, Y. Wang, Z. Zhang and X. Ren, Phys. Rev. Lett.,2010, 105, 205702.
17 D. Y. Cong, Y. D. Zhang, Y. D. Wang, M. Humbert, X. Zhao,T. Watanabe, L. Zuo and C. Esling, Acta Mater., 2007, 55,4731–4740.
18 Y. L. Hao, H. L. Wang, T. Li, J. M. Cairney, A. V.Ceguerra, Y. D. Wang, Y. Wang, D. Wang, E. G. Obbard,S. J. Li and R. Yang, J. Mater. Sci. Technol., 2016, 32,705–709.
19 R. J. Talling, R. J. Dashwood, M. Jackson and D. Dye, ActaMater., 2009, 57, 1188–1198.
20 J. W. Christian, The Theory of Transformations in Metals andAlloys, Pergamon Press, Oxford, UK, 3rd edn, 2002.
21 D. J. Hartl and D. C. Lagoudas, Proc. Inst. Mech. Eng., Part G,2007, 221, 535–552.
22 J. Mohd Jani, M. Leary, A. Subic and M. A. Gibson, Mater.Des., 2014, 56, 1078–1113.
23 Y. L. Hao, S. J. Li, S. Y. Sun, C. Y. Zheng and R. Yang, ActaBiomater., 2007, 3, 277–286.
24 T. Waitz, V. Kazykhanov and H. P. Karnthaler, Acta Mater.,2004, 52, 137–147.
25 T. Waitz, K. Tsuchiya, T. Antretter and F. D. Fischer, MRSBull., 2009, 34, 814–821.
26 A. Ahadi and Q. Sun, Acta Mater., 2015, 90, 272–281.27 H. Matsumoto, S. Watanabe and S. Hanada, Mater. Trans.,
2005, 46, 1070–1078.28 X. Zhang, W. Shyy and A. Marie Sastry, J. Electrochem. Soc.,
2007, 154, A910.29 W.-F. Rao, M. Wuttig and A. G. Khachaturyan, Phys. Rev.
Lett., 2011, 106, 105703.30 Y. Ji, X. Ding, T. Lookman, K. Otsuka and X. Ren, Phys. Rev.
B: Condens. Matter Mater. Phys., 2013, 87, 104110.31 G. S. Bigelow, A. Garg, S. A. Padula II, D. J. Gaydosh and
R. D. Noebe, Scr. Mater., 2011, 64, 725–728.32 C. Chluba, W. Ge, R. Lima de Miranda, J. Strobel, L. Kienle,
E. Quandt and M. Wuttig, Science, 2015, 348, 1004–1007.33 L. Kovarik, F. Yang, A. Garg, D. Diercks, M. Kaufman,
R. D. Noebe and M. J. Mills, Acta Mater., 2010, 58,4660–4673.
34 X. Ren, in Disorder and Strain-Induced Complexity in Func-tional Materials, ed. T. Kakeshita, T. Fukuda, A. Saxena andA. Planes, Springer, Berlin, 2012, pp. 201–225.
35 X. Ren, Phys. Status Solidi, 2014, 251, 1982–1992.36 R. D. James, Z. Zhang, R. D. James and Z. Zhang, in
Magnetism and Structure in Functional Materials, ed.A. Planes, L. Manosa and A. Saxena, Springer, Berlin,2005, pp. 159–175.
37 Y. Gao, L. Casalena, M. L. Bowers, R. D. Noebe, M. J. Millsand Y. Wang, Acta Mater., 2017, 126, 389–400.
38 Y. Gao, S. A. Dregia and Y. Wang, Acta Mater., 2017, 127,438–449.
39 K. Tsuchiya, H. Sato, S. Edo, K. Marukawa and M. Umemoto,Mater. Sci. Eng., A, 2000, 285, 353–356.
40 J. L. Murray, Bull. Alloy Phase Diagrams, 1981, 2, 48–55.41 F. Findik, Mater. Des., 2012, 42, 131–146.42 J. Frenzel, E. P. George, A. Dlouhy, C. Somsen, M. F. X.
Wagner and G. Eggeler, Acta Mater., 2010, 58, 3444–3458.43 K. Otsuka and X. Ren, Prog. Mater. Sci., 2005, 50, 511–678.44 J. Zhu, Y. Gao, D. Wang, T.-Y. Zhang and Y. Wang, Acta
Mater., 2017, 130, 196–207.45 H. Y. Kim, J. I. Kim, T. Inamura, H. Hosoda and S. Miyazaki,
Mater. Sci. Eng., A, 2006, 438–440, 839–843.46 E. W. Collings, A Sourcebook of Titanium Alloy Superconduc-
tivity, Springer US, Boston, MA, 1983.47 H. H. Wu, A. Pramanick, Y. B. Ke and X. L. Wang, J. Appl.
Phys., 2016, 120, 183904.48 S. G. Cao, Y. Li, H. H. Wu, J. Wang, B. Huang and T. Y.
Zhang, Nano Lett., 2017, 17, 5148–5155.49 H.-H. Wu, J. Zhu and T.-Y. Zhang, Nano Energy, 2015, 16,
419–427.50 H. L. Wang, Y. L. Hao, S. Y. He, K. Du, T. Li, E. G. Obbard,
J. Hudspeth, J. G. Wang, Y. D. Wang, Y. Wang, F. Prima,N. Lu, M. J. Kim, J. M. Cairney, S. J. Li and R. Yang, Scr.Mater., 2017, 133, 70–74.
51 R. Peierls, Proc. Phys. Soc., 1940, 52, 34–37.
Communication Materials Horizons
Ope
n A
cces
s A
rtic
le. P
ublis
hed
on 0
4 D
ecem
ber
2018
. Dow
nloa
ded
on 4
/10/
2019
9:5
6:28
PM
. T
his
artic
le is
lice
nsed
und
er a
Cre
ativ
e C
omm
ons
Attr
ibut
ion
3.0
Unp
orte
d L
icen
ce.
View Article Online

This journal is©The Royal Society of Chemistry 2019 Mater. Horiz., 2019, 6, 515--523 | 523
52 J. Zhu, H. Wu, D. Wang, Y. Gao, H. Wang, Y. Hao,R. Yang, T.-Y. Zhang and Y. Wang, Int. J. Plast., 2017, 89,110–129.
53 D. L. Moffat and U. R. Kattner, Metall. Trans. A, 1988, 19,2389–2397.
54 H. Y. Kim, Y. Ikehara, J. I. Kim, H. Hosoda and S. Miyazaki,Acta Mater., 2006, 54, 2419–2429.
55 T. Inamura, J. I. Kim, H. Y. Kim, H. Hosoda, K. Wakashimaand S. Miyazaki, Philos. Mag., 2007, 87, 3325–3350.
56 L. D. Landau and E. M. Lifshitz, Statistical physics, PergamonPress, Oxford, 1980.
57 J. W. Cahn and J. E. Hilliard, J. Chem. Phys., 1958, 28, 258.58 A. G. Khachaturyan, Theory of Structural Transformations in
Solids, John Wiley & Sons, New York, 1983.59 Y. W. Zhang, S. J. Li, E. G. Obbard, H. Wang, S. C. Wang,
Y. L. Hao and R. Yang, Acta Mater., 2011, 59, 3081–3090.60 L. Liu, X. Ding, J. Li, T. Lookman and J. Sun, Nanoscale,
2014, 6, 2067–2072.
61 G. B. Olson and A. L. Roitburd, in Martensite: a tribute toMorris Cohen, ed. G. B. Olson and W. S. Owen, ASM Inter-national, Materials Park, OH, 1992, pp. 149–174.
62 K. Bhattacharya, Microstructure of Martensite: Why It Formsand How It Gives Rise to the Shape-Memory Effect, OxfordUniversity Press, Oxford, 2003.
63 Y. Wang, L.-Q. Chen and A. G. Khachaturyan, Acta Metall.Mater., 1993, 41, 279–296.
64 P. J. Kelly and R. D. Arnell, Vacuum, 2000, 56, 159–172.65 Y. Saito, H. Utsunomiya, N. Tsuji and T. Sakai, Acta Mater.,
1999, 47, 579–583.66 D. C. Hofmann, J. Kolodziejska, S. Roberts, R. Otis, R. P.
Dillon, J.-O. Suh, Z.-K. Liu and J.-P. Borgonia, J. Mater. Res.,2014, 29, 1899–1910.
67 R. Xu, S. Liu, I. Grinberg, J. Karthik, A. R. Damodaran,A. M. Rappe and L. W. Martin, Nat. Mater., 2015, 14, 79–86.
68 Y. Tanaka, Y. Himuro, R. Kainuma, Y. Sutou, T. Omori andK. Ishida, Science, 2010, 327, 1488–1490.
Materials Horizons Communication
Ope
n A
cces
s A
rtic
le. P
ublis
hed
on 0
4 D
ecem
ber
2018
. Dow
nloa
ded
on 4
/10/
2019
9:5
6:28
PM
. T
his
artic
le is
lice
nsed
und
er a
Cre
ativ
e C
omm
ons
Attr
ibut
ion
3.0
Unp
orte
d L
icen
ce.
View Article Online

1
Supplementary Information
Rendering metals ultralow modulus and nearly hysteresis-free and linear super-elastic
Jiaming Zhu,a,b Yipeng Gao,c Dong Wang,a Ju Li e, Tong-Yi Zhang,*, d and Yunzhi Wang*,c
a Center of microstructure science, Frontier Institute of Science and Technology, Xi'an Jiaotong University, Xi'an 710049, China.
b Department of Mechanical Engineering, Hong Kong University of Science and Technology, Clear Water Bay, Kowloon, Hong Kong, China.
c Department of Materials Science and Engineering, The Ohio State University, 2041 College Road, Columbus, OH 43210, USA.
d Materials Genome Institute, Shanghai University, 333 Nanchen Road, Shanghai 200444, China.
e Department of Nuclear Science and Engineering and Department of Materials Science and Engineering, Massachusetts Institute of Technology, Cambridge, MA 02139, USA.
Electronic Supplementary Material (ESI) for Materials Horizons.This journal is © The Royal Society of Chemistry 2018

2
Development of phase field model
The phase field model is developed based on the combination of Landau theory1, gradient
thermodynamics2, and Khachaturyan–Shatalov’s microelasticity theory3. It should be pointed
out that the phase field model is tested (with a uniform Nb concentration of 15 at.%) by
producing a stress-strain curve that is consistent with the experimental result of Ti2448 that has
the same Nb concentration including the critical stress for the MT, stress hysteresis and
superelasticity (see Figure S1).
a) Symmetry breaking during MT in TiNb-based SMAs. The phase filed model is
formulated for the multifunctional β TiNb-based alloys. According to the Burgers lattice
correspondence4 for the β (BCC, point group ) to α martensite (orthorhombic, point 𝑚3𝑚
group mmm) transformation5
,[001]𝛽→[100]
𝛼'', [11̅0]𝛽→[010]𝛼'', [110]𝛽→[001]
𝛼''
and the symmetry operations in the point groups that preserve such a lattice correspondence,
only 8 operations (out of the 48 symmetry operations in )6 are left after the transformation, 𝑚3𝑚
leading to 6 (=48/8) crystallographic equivalent deformation modes (or correspondence
variants)7 characterized by 6 different transformation strain tensors. In fact, because internal
shuffle of {110}β atomic planes is also involved during the transformation8–10, which doubles
the deformation variants, there are total 12 deformation variants11. However, an internal shuffle
dose not contribute to the transformation strain12. Thus, if we choose the three orthogonal axes
of the cubic crystal of the parent phase as the reference coordinate system and follow the
Burgers correspondence, the transformation matrices that map the parent phase lattice onto that
of the martensitic variants by a uniform affine deformation read
, ,
𝑈1 = [𝜁 0 0
0𝛼 + 𝛾
4𝛾 - 𝛼
4
0𝛾 - 𝛼
4𝛼 + 𝛾
4] 𝑈2 = [𝜁 0 0
0𝛼 + 𝛾
4𝛼 - 𝛾
4
0𝛼 - 𝛾
4𝛼 + 𝛾
4]

3
, ,
𝑈3 = [𝛼 + 𝛾4
0𝛾 - 𝛼
40 𝜁 0
𝛾 - 𝛼4
0𝛼 + 𝛾
4] 𝑈4 = [𝛼 + 𝛾
40
𝛼 - 𝛾4
0 𝜁 0𝛼 - 𝛾
40
𝛼 + 𝛾4
], . (1)
𝑈5 = [𝛼 + 𝛾4
𝛾 - 𝛼4
0
𝛾 - 𝛼4
𝛼 + 𝛾4
0
0 0 𝜁] 𝑈6 = [𝛼 + 𝛾
4𝛼 - 𝛾
40
𝛼 - 𝛾4
𝛼 + 𝛾4
0
0 0 𝜁]
where , , , with , , and being the lattice parameters of 𝛼 = 2𝑏 𝑎0 𝜁 = 𝑎 𝑎0 𝛾 = 2𝑐 𝑎0 𝑎0 𝑎 𝑏 𝑐
the parent and martensitic phase. The corresponding stress-free transformation strain (SFTS)
of the p-th variant, , can be calculated directly from the transformation matrices given in 𝜀0𝑖𝑗(𝑝)
Eq. (1) according to the following equation
, (2)𝜀0
𝑖𝑗(𝑝) =12(𝑈𝑇
𝑝𝑈𝑝 - 𝐼), (𝑝 = 1~6)
where the superscript T indicates matrix transpose, and I is the identity matrix. The Green strain
tensor is more appropriate to describe the MT induced finite deformation and thus adopted in
this study, as shown in Eq. (2). As this, second Piola-Kirchhoff stress tensor is used here and
the constitutive equation is the generalized Hooke’s law, as indicated by Eq. (10).
Note that we are considering a compositionally non-uniform system in the current study and
the lattice parameters of the parent and martensitic phases are functions of local concentration,
which makes the SFTS in Eq. (2) a function of location as well. Both experimental
measurements13 and ab initio calculations14 show that the concentration-dependence of lattice
parameters of β and α phases in TiNb alloys can be approximated by linear functions (i.e.,
following the Vegard’s law). Therefore the variation of lattice parameters of β and α phases
with concentration is obtained by fitting the experimental and simulation data reported in
references5,13–16,
Å, (3a)𝑎0 = 3.296 + 1.3 × 𝑐𝑁𝑏 × 10 - 4
Å, (3b)𝑎 = 2.894 + 1.2 × 𝑐𝑁𝑏 × 10 - 2

4
Å, (3c)𝑏 = 5.167 ‒ 1.7 × 𝑐𝑁𝑏 × 10 - 2
Å, (3d)𝑐 = 4.748 ‒ 4.8 × 𝑐𝑁𝑏 × 10 - 3
where is the Nb concentration in atomic percent. Besides the SFTS, the Ms also depends 𝑐𝑁𝑏
on Nb concentration, which, according to existing data in the literature17–19, can be
approximated by the following linear relationship
K. (4)𝑀𝑠 = 550 - 24 × 𝑐𝑁𝑏
b) Free energy formulation. In our phase field approach, the parent and martensitic
phases in TiNb-based alloys are characterized by using six non-conserved structural order
parameters, (p=1~6), with representing the parent phase and 𝜂𝑝 (𝜂𝑝 = 1~6 = 0)
representing the p-th correspondence variant of the (𝜂𝑝 = ± 1, 𝜂𝑞 = 1~6, 𝑏𝑢𝑡 𝑞 ≠ 𝑝 = 0)
martensitic phase, where +1 and -1 denote atomic shuffles in two opposite directions in a
correspondence variant. The total free energy functional, F, of the system is formulated as the
following
, (5)𝐹 = ∫[1
2
6
∑𝑝 = 1
(∇𝜂𝑝)2 + 𝑓𝑐h(𝜂1, ⋯𝜂6) + 𝑓𝑒𝑥(𝜂1, ⋯𝜂6)]𝑑3𝑟 + 𝐸𝑒𝑙
where is the gradient energy coefficient for structural non-uniformities following the
gradient thermodynamics2, fch is the Landau free energy that describes the free energy of a local
volume element having a uniform structural state characterized by p(r) (p=1-6)20–23. In the
current study, the stress-free transformation strain tensor for a local volume element located at
r will be given by
(6)𝜀𝑀𝑇
𝑖𝑗 (𝑟) =6
∑𝑝 = 1
𝜀0𝑖𝑗(𝑝, 𝑟)𝜂2
𝑝(𝑟)
and the Landau free energy can be approximated by the following polynomial24

5
, (7)𝑓𝑐h(𝜂1, ⋯𝜂6) =
12
𝐴1(𝑇 - 𝑇0)6
∑𝑝 = 1
𝜂2𝑝(𝑟) -
14
𝐴2
6
∑𝑝 = 1
𝜂4𝑝(𝑟) +
16
𝐴3( 6
∑𝑝 = 1
𝜂2𝑝(𝑟))3
where A1, A2 and A3 are expansion coefficients. The Ms modulation induced by concentration
modulation (CM) is incorporated into the model by formulating T0 as a function of
concentration, i.e., K.𝑇0 = 493 - 24 × 𝑐𝑁𝑏
The free energy associated with an external stress, , (i.e., the work term by the external 𝜎𝑘𝑙
stress) in Eq. (5), is given by the following equation
. (8)𝑓𝑒𝑥(𝜂1, ⋯𝜂6) = ‒ 𝜎𝑘𝑙 ∙ 𝜀𝑀𝑇𝑘𝑙 (𝑟)
The last term in Eq. (5), Eel, is the coherency elastic strain energy of a structurally non-uniform
but coherent system (i.e., martensitic variants coherently embedded in the parent phase matrix)
characterized by p(r). According to the literature25, in which a new mathematical formulation
of the coherency elastic strain energy that accounts for CM is derived based on Khachaturyan–
Shatalov’s microelasticity theory (KS-theory)3, it has the following close form
, (9)𝐸𝑒𝑙 =
12
9
∑𝐾 = 1
9
∑𝐿 = 1
∫ 𝑑3𝑘
(2𝜋)3𝐵𝐾𝐿(𝑛){𝜃𝐾}𝑘{𝜃𝐿} *
𝑘
where the integral is taken in the reciprocal space, is a unit vector and is a vector with 𝑛 =
𝑘𝑘 𝑘
a modulus of in the reciprocal space (note that is to be excluded from the integration), 𝑘 𝑘 = 0
represents the Fourier transformation of , which is defined as {𝜃𝐾}𝑘 𝜃𝐾
(the indices i, j and K in this expression are correlated via a 𝜃𝐾(𝑟) =
6
∑𝑝 = 1
[𝜀0𝑖𝑗(𝑝, 𝑟) ∙ 𝜂2
𝑝(𝑟)]
generalized Voigt notation, i.e. 11 →1, 22 →2, 33 →3, 23 →4, 13 →5, 12 →6, 32 →7, 31
→8, 21 →9). Note that the transformation strain, , is a function of position because of 𝜀0𝑖𝑗(𝑝, 𝑟)
its dependence on local concentration13,16. For a system with a free boundary, in Eq. 𝐵𝐾𝐿(𝑛)
(9) reads
, (10)𝐵𝐾𝐿(𝑛) = { 0 𝑛 = 0
𝐶𝑖𝑗𝑘𝑙𝜀𝑛𝑒𝑤
𝑖𝑗 (𝐾)𝜀𝑛𝑒𝑤𝑘𝑙 (𝐿) - 𝑛𝑖𝜎
𝑛𝑒𝑤𝑖𝑗 (𝐾)Ω𝑗𝑘(𝑛)𝜎𝑛𝑒𝑤
𝑘𝑙 (𝐿)𝑛𝑙 𝑛 ≠ 0 �
6
where , , and 𝜎𝑛𝑒𝑤𝑖𝑗 (𝐾) = 𝐶𝑖𝑗𝑘𝑙𝜀
𝑛𝑒𝑤𝑘𝑙 (𝐾) Ω - 1
𝑖𝑗 (𝑛) = 𝐶𝑖𝑘𝑙𝑗𝑛𝑘𝑛𝑙
.𝜀𝑛𝑒𝑤
𝑘𝑙 (𝐾) = {1 𝑖𝑓 𝐾 𝑖𝑠 𝑉𝑜𝑖𝑔𝑡 𝑛𝑜𝑡𝑎𝑡𝑖𝑜𝑛 𝑜𝑓 𝑘𝑙 0 𝑜𝑡ℎ𝑒𝑟𝑤𝑖𝑠𝑒�
Note that such a boundary condition is required to simulate stress-controlled (constant
stress) uniaxial tension.
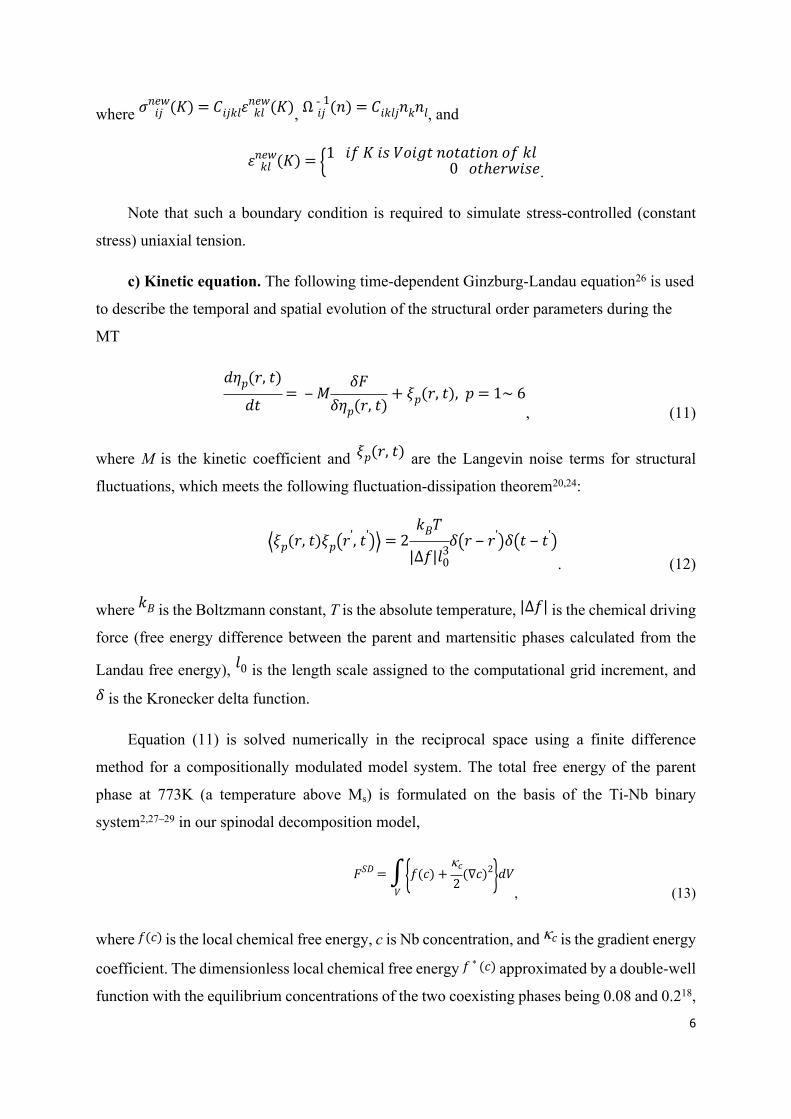
c) Kinetic equation. The following time-dependent Ginzburg-Landau equation26 is used
to describe the temporal and spatial evolution of the structural order parameters during the
MT
, (11)
𝑑𝜂𝑝(𝑟, 𝑡)
𝑑𝑡= ‒ 𝑀
𝛿𝐹𝛿𝜂𝑝(𝑟, 𝑡)
+ 𝜉𝑝(𝑟, 𝑡), 𝑝 = 1~ 6
where M is the kinetic coefficient and are the Langevin noise terms for structural 𝜉𝑝(𝑟, 𝑡)
fluctuations, which meets the following fluctuation-dissipation theorem20,24:
. (12)⟨𝜉𝑝(𝑟, 𝑡)𝜉𝑝(𝑟', 𝑡')⟩ = 2
𝑘𝐵𝑇
|∆𝑓|𝑙30
𝛿(𝑟 ‒ 𝑟')𝛿(𝑡 ‒ 𝑡')
where is the Boltzmann constant, T is the absolute temperature, is the chemical driving 𝑘𝐵 |∆𝑓|
force (free energy difference between the parent and martensitic phases calculated from the
Landau free energy), is the length scale assigned to the computational grid increment, and 𝑙0
is the Kronecker delta function.𝛿
Equation (11) is solved numerically in the reciprocal space using a finite difference
method for a compositionally modulated model system. The total free energy of the parent
phase at 773K (a temperature above Ms) is formulated on the basis of the Ti-Nb binary
system2,27–29 in our spinodal decomposition model,
, (13)𝐹𝑆𝐷 = ∫
𝑉{𝑓(𝑐) +
𝑐
2(∇𝑐)2}𝑑𝑉
where is the local chemical free energy, c is Nb concentration, and is the gradient energy 𝑓(𝑐) 𝑐
coefficient. The dimensionless local chemical free energy approximated by a double-well 𝑓 ∗ (𝑐)
function with the equilibrium concentrations of the two coexisting phases being 0.08 and 0.218,

7
respectively, e.g., . The dimensionless gradient energy coefficient is 𝑓 ∗ (𝑐) = (𝑐 ‒ 0.08)2(0.2 ‒ 𝑐)2
chosen to be . The reduced time is calculated via , where denotes ∗𝑐 = 0.691
𝑡 ∗ =𝑀𝑐|∆𝑓𝑐|
𝑙20
𝑡𝑀𝑐
chemical mobility of composition, is chemical driving force of spinodal decomposition, |∆𝑓𝑐| 𝑙0
is numerical grid size. The dimensionless time step is chosen to be 0.001. The interfacial ∆𝑡 ∗
energy between the solute-rich and solute lean phases at equilibrium is assumed to be ~0.01
J/m2, which yields a numerical grid size of ~1 nm. The temporal evolution of the 𝑙0
concentration field is governed by the Cahn-Hilliard equation30. The gradient energy
coefficient is, in general, a constant for a given material. To study the role of CM wavelength
in the linear super-elastic behavior, different dimensionless gradient energy coefficients (
0.058, 0.288, 0.461, 0.691, and 2.591) are used to generate systems with different CM ∗𝑐 =
wavelengths (12 nm, 30 nm, 37 nm, 44 nm, and 110 nm, respectively) in spinodal
decomposition. The relationship30 between gradient energy coefficients and CM wavelength,
L, is , where represents . It should be pointed out that such a range of 𝐿 = 2𝜋 ‒
2𝑐
𝑓''(𝑐) 𝑓''(𝑐)
𝑑2𝑓
𝑑𝑐2
spinodal wavelength is in consistence with experimental observations31.
d) Model parameters. The elastic constants of the parent phase, C11=57.2 GPa, C12=36.1
GPa and C44=35.9 GPa are obtained from the literature 5,32. Homogeneous modulus assumption
is adopted in this study, i.e. the α martensitic phase is assumed to have the same elastic
constants as that of the parent phase because of the lack of consistent experimental data for the
elastic constants of α martensites33. The expansion coefficients in the Landau free energy,
A1=1.3×10⁵ J/m3·K, A2=11.74×10⁷ J/m3, A3=17.39×10⁷ J/m3, are chosen in such a way that the
phase field model (with an uniform Nb concentration of 15 at.%) produces a stress-strain curve
that is consistent with the experimental result of Ti2448 that has the same Nb concentration 32,
including the critical stress for the MT, stress hysteresis and super-elasticity (see Figure S1).
The gradient energy coefficient for the structural non-uniformity is assumed to be =1.2×10-
12 J/m, which yields an interfacial energy between the parent and martensitic phases of ГAM
≈0.01 J/m2 (which falls in the range of the experimental values34) and a twin boundary energy
between different martensitic variants of ГMM≈0.02 J/m2 (ГMM≈2ГAM according to reference
35) with a length scale of ~1 nm. The structural mobility in Eq. (11) is chosen as M=1×10⁻⁴ 𝑙0

8
m4J-1s-1, estimated from v=M (-∆f )35,36, where v is the interface velocity between the parent
and martensitic phases during the MT (~103 m/s) and ∆f=-107 J/m3 37,38 is the typical driving
force for the MT. The amplitude of the Langevin noise is 0.3 in our simulations at 2
𝑘𝐵𝑇
|∆𝑓|𝑙30
=
300K. The system size used in the simulations is 128 ×128 ×128 . Periodical boundary 𝑙0 𝑙0 𝑙0
conditions are adopted in all three dimensions.

9
Fig. S1 Comparison between phase field model and experiment. Comparison between stress
strain curves obtained respectively from the phase field simulation and experiment32.

10
Fig. S2 Comparison of results between previous study (i.e. Reference 44) and this study in (a)
stress strain curve, (b) incipient modulus, hysteresis, (c) linearity and elastic strain limit. See
Figure 3 for the definition of incipient modulus and linearity.

11
Fig. S3 Dependence of and principle strains (λ1, λ2 and λ3) of the stress-free transformation 𝜎𝑀𝑠
strain of Ti2448 on Nb concentration.

12
Fig. S4 Residual martensites induced by pre-straining. The residual martensites after the first
loading-unloading cycle in CMFMs aged for (a) t*=1320 (L=38 nm), (b) t*=1500 (L=42 nm),
and (c) t*=7100 (L=73 nm).

13
Fig. S5 Statistical distributions of Nb concentration. Statistical distributions of voxels having
certain Nb concentration in the computational cell aged for different time.

14
Fig. S6 One dimensional and three dimensional plots of CM at different ageing time during
spinodal decomposition. (a) Concentration variation along a body diagonal of simulation
systems aged for different time. (b1)-(b8) Evolution of Nb-lean regions that are able to
accommodate retained martensites during spinodal decomposition.

15
Fig. S7 Stress strain curve and microstructure evolution of the first loading-unloading cycle,
i.e. pre-straining process. (b1-b10) show the microstructures at various stress levels marked by
(b1-b10) in (a), respectively, during first cyclic loading/unloading. The parent phase is set to
be transparent and the martensitic variants (Vs) are plotted as iso-surfaces with different colors,
as indicated in the color map at the bottom.

16

17
Fig. S8 Microstructural evolution during MT upon the second and third loading-unloading
cycles. Stress strain curves of a concentration modulated system having a wavelength of ~44
nm (after ageing at 773 K for t*=1900) during (a) second and (b) third loading-unloading
cycles. (c1-c10) and (d1-d10) show microstructures at various loading-unloading points
marked by (c1-c10) in (a) and (d1-d10) in (b), respectively, where the parent phase is set to be
transparent and the martensitic correspondence variants (Vi, i=1-6) are plotted as iso-surface
contours with different colors, as indicated in the legend at the upper right corner. Red arrows
in (e3), (e4), (e7) and (e8) indicate variants generated via local autocatalysis which is defined
as the autocatalytic effect happened in a Nb-lean region.

18
Fig. S9 Martensitic transformation in a system with a concentration wavelength of 12 nm. (a)
Microstructure and (b) stress strain curve of a system with a concentration wavelength of 12
nm. (c1)-(c14) are close observations of martensitic particles in a local region during loading
and unloading. Circled numbers in (c1)-(c4) indicate single variant martensitic particles of
corresponding colors.

19
Fig. S10 One dimensional plots of CM. Concentration variation along a body diagonal of
simulation systems having different concentration wavelength.

20
Fig. S11 Retained martensites and Nb-lean regions. (a)-(d) Residual martensites in systems
having different concentration wavelength after pre-straining. The red circle indicates a
herringbone structure. (e)-(h) Nb-lean regions of corresponding systems are represented by
green iso-surface concentration contours. Residual martensites in (a)-(d) are accommodated by
Nb-lean regions in (e)-(h).

21
Geometric Compatibility Analysis
Analysis of average strain of martensitic patterns
Fig. S12 Schematic drawing of self-accommodating martensitic patterns. (a) 2-variant and (b)
4-variant domain patterns. r denotes the volume fraction of a variant in a domain pattern.
The average strain of a 2-variant domain is
. (14)𝑟𝜀0(𝑖) + (1 ‒ 𝑟)𝜀0(𝑗)
Taking the type-I or type-II twin formed by variant 3 and variant 5 as an example
𝑟𝜀0(3) + (1 ‒ 𝑟)𝜀0(5) =
(15)
12[ 𝛼2 + 𝛾2
8‒ 1 (1 ‒ 𝑟)
𝛾2 - 𝛼2
8𝑟
𝛾2 - 𝛼2
8
(1 ‒ 𝑟)𝛾2 - 𝛼2
8(1 ‒ 𝑟)(𝛼2 + 𝛾2
8‒ 1) + 𝑟(𝜁2 ‒ 1) 0
𝑟𝛾2 - 𝛼2
80 𝑟(𝛼2 + 𝛾2
8‒ 1) + (1 ‒ 𝑟)(𝜁2 ‒ 1)
]The average strain of a 4-variant domain is
. (16)
12
[𝑟𝜀0(𝑖) + (1 ‒ 𝑟)𝜀0(𝑗) + 𝑟𝜀0(𝑘) + (1 ‒ 𝑟)𝜀0(𝑙)]
Taking the herringbone structure formed by variant 3, 4, 5 and 6 as an example
12
[𝑟𝜀0(3) + (1 ‒ 𝑟)𝜀0(5) + 𝑟𝜀0(4) + (1 ‒ 𝑟)𝜀0(6)] =

22
(17)
12[𝛼2 + 𝛾2
8‒ 1 0 0
0 (1 ‒ 𝑟)(𝛼2 + 𝛾2
8‒ 1) + 𝑟(𝜁2 ‒ 1) 0
0 0 𝑟(𝛼2 + 𝛾2
8‒ 1) + (1 ‒ 𝑟)(𝜁2 ‒ 1)
]Equation (15) demonstrates that, besides the dilation deformation, 2-variant martensitic
particles will induce shear deformation in matrix as well. However, 4-variant martensitic
particles only cause dilation deformation. Therefore, 2-variant retained martensitic particles
should be accompanied by higher elastic energy than 4-variant retained martensitic particles.

23
Supplementary References
1 L. D. Landau and E. M. Lifshitz, Statistical physics, Pergamon Press, Oxford, 1980.
2 J. W. Cahn and J. E. Hilliard, J. Chem. Phys., 1958, 28, 258.
3 A. G. Khachaturyan, Theory of Structural Transformations in Solids, John Wiley & Sons, New York, 1983.
4 W. G. Burgers, Physica, 1934, 1, 561–586.
5 J. Liu, Y. Y. Wang, Y.-L. Hao, Y. Y. Wang, Z. Nie, D. Wang, Y. Ren, Z. Lu, J. Wang, H. Wang, X. Hui, N. Lu, M. J. Kim and R. Yang, Sci. Rep., 2013, 3, 2156.
6 T. Hahn, Int. Tables Crystallogr. Vol. A Space-gr. symmetry, 2006, 2, 7–11.
7 Y. Gao, R. Shi, J.-F. F. Nie, S. A. Dregia and Y. Wang, Acta Mater., 2016, 109, 353–363.
8 T. Ahmed and H. J. Rack, J. Mater. Sci., 1996, 31, 4267–4276.
9 Y. Zheng, R. E. A. Williams, S. Nag, R. Banerjee, H. L. Fraser and D. Banerjee, Scr. Mater., 2016, 116, 49–52.
10 E. G. Obbard, Y. L. Hao, T. Akahori, R. J. Talling, M. Niinomi, D. Dye and R. Yang, Acta Mater., 2010, 58, 3557–3567.
11 Y. Gao, N. Zhou, D. Wang and Y. Wang, Acta Mater., 2014, 68, 93–105.
12 J. W. Christian, The Theory of Transformations in Metals and Alloys, Pergamon Press, Oxford, UK, Third., 2002.
13 H. Y. Kim, Y. Ikehara, J. I. Kim, H. Hosoda and S. Miyazaki, Acta Mater., 2006, 54, 2419–2429.
14 A. Pathak, S. Banumathy, R. Sankarasubramanian and a. K. Singh, Comput. Mater. Sci., 2014, 83, 222–228.
15 S. Banumathy, R. K. Mandal and a. K. Singh, J. Appl. Phys., 2009, 106, 093518.
16 T. Inamura, J. I. Kim, H. Y. Kim, H. Hosoda, K. Wakashima and S. Miyazaki, Philos. Mag., 2007, 87, 3325–3350.
17 Y. L. Hao, S. J. Li, S. Y. Sun and R. Yang, Mater. Sci. Eng. A, 2006, 441, 112–118.
18 Y. L. Hao, H. L. Wang, T. Li, J. M. Cairney, A. V. Ceguerra, Y. D. Wang, Y. Wang, D. Wang, E. G. Obbard, S. J. Li and R. Yang, J. Mater. Sci. Technol., 2016, 32, 705–709.
19 E. W. Collings, A Sourcebook of Titanium Alloy Superconductivity, Springer US, Boston, MA, 1983.
20 E. M. Lifshitz and L. P. Pitaevskii, in Course of Theoretical Physics, eds. L. D. Landau and E. M. Lifshitz, Pergamon Press, Oxford, 3rd edn., 1980, vol. 5.
21 Y. A. Izyumov and V. N. Syromyatnikov, Phase Transitions and Crystal Symmetry, Kluwer Academic Publishers, Boston, 1990.

24
22 P. Tolédano and V. Dmitriev, Reconstructive Phase Transitions, World Scientific, New Jersey, 1996.
23 Y. Wang and A. G. Khachaturyan, Mater. Sci. Eng. A, 2006, 438–440, 55–63.
24 Y. Wang and A. G. Khachaturyan, Acta Mater., 1997, 45, 759–773.
25 J. Zhu, Y. Gao, D. Wang, T.-Y. Zhang and Y. Wang, Acta Mater., 2017, 130, 196–207.
26 J. D. Gunton, M. S. Miguel and P. S. Sahni, in Phase Transitions and Critical Phenomena, eds. E. C. Domb and J. Lebowitz, Academic Press, London, 1983, vol. 8, pp. 269–466.
27 Y. Lu, C. Wang, Y. Gao, R. Shi, X. Liu and Y. Wang, Phys. Rev. Lett., 2012, 109, 086101.
28 L.-Q. Chen, Annu. Rev. Mater. Res., 2002, 32, 113–140.
29 J. Langer, M. Bar-on and H. Miller, Phys. Rev. A, 1975, 11, 1417–1429.
30 J. Cahn, Acta Metall., 1961, 9, 795–801.
31 F. Findik, Mater. Des., 2012, 42, 131–146.
32 Y. W. Zhang, S. J. Li, E. G. Obbard, H. Wang, S. C. Wang, Y. L. Hao and R. Yang, Acta Mater., 2011, 59, 3081–3090.
33 J. Zhu, H. Wu, D. Wang, Y. Gao, H. Wang, Y. Hao, R. Yang, T.-Y. Zhang and Y. Wang, Int. J. Plast., 2017, 89, 110–129.
34 G. B. Olson and M. Cohen, Metall. Trans. A, 1976, 7, 1897–1904.
35 D. Wang, S. Hou, Y. Wang, X. Ding, S. Ren, X. Ren and Y. Wang, Acta Mater., 2014, 66, 349–359.
36 C. Huang, D. Browne and S. McFadden, Acta Mater., 2006, 54, 11–21.
37 J. Khalil-Allafi, W. W. Schmahl and T. Reinecke, Smart Mater. Struct., 2005, 14, S192.
38 G. Olson and M. Cohen, Metall. Trans. A.