volume-8, issue-1, january-2019 • print issn no 2277
TRANSCRIPT

INTRODUCTIONGenerally, stock market across the globe replicates the �uctuation of the market's economy, and attracts the attention of millions of investors. The stock market is characterized by high risk and high yield; hence investors are concerned about the analysis of the stock market and are trying to forecast the trend of the stock market. There are two main schools of thought in the �nancial markets, technical analysis and fundamental analysis. Fundamental analysis attempts to determine a stock's value by focusing on underlying factors that affect a company's actual business and its future prospects. Fundamental analysis can be performed on industries or the economy as a whole. Technical analysis, on the other hand, looks at the price movement of a stock and uses this data to predict its future price movements.
TECHNICAL ANALYSISTechnical analysis is based on analyzing current demand-supply of commodities, stocks, indices, futures or any tradable instrument. Technical analysis involve putting stock information like prices, volumes and open interest on a chart and applying various patterns and indicators to it in order to assess the future price movements. Technical analysis helps to predict the direction of share price movement through the study of past market data, primarily price and volume.
STATEMENT OF THE PROBLEMEquity investments offer considerable returns to investors and is considered to be a major source of capital for most large �rms. However, these returns are subject to movement in share prices. Technical analysis is the study of historic price movements of securities. It helps in understanding the intrinsic value of shares and knowing whether the shares are undervalued or overvalued.
The stock market indicators would help the investor to identify major market turning points. Through technical indicators, investors can analyze the short-term price movement of the stock, the most important market turning points and project the price movement. This study made an attempt to apply technical analysis tools and techniques on selective top �ve companies particularly in the Information Technology (IT) sector. This study further, aims to assist investment decisions to the investors.
SCOPE OF THE STUDYThe Information technology (IT) sector has grown much faster
globally. The contribution of the IT sector to India's Gross Domestic Product (GDP) stood at 7.7 per cent in 2016. This clearly shows that information technology is a sector which will likely be one of the emerging markets in the days to come as India's economy requires more hardware, software and other IT services. So, this study aims to analysing the price movements of top �ve Information Technology companies.
OBJECTIVES OF THE STUDY1) To study the relevance of technical analysis in Indian capital
market;2) To analyses the price movement of shares of Information
Technology (IT) sector companies;3) To �nd out the performance of selected Information
Technology (IT) companies;4) To predict the future trends in the share prices through
Technical Analysis; and5) To suggesting the investors in making investment decisions.
METHODOLOGY OF THE STUDY SOURCE OF DATAThe study aims at analysing the share price movements of selected top �ve Information Technology (IT) sector. The research was descriptive and analytical in nature. The required data for the study were collected from the secondary sources.
DATA COLLECTIONFor Technical Analysis, Secondary Data the daily share price movements of the selected top �ve Information Technology (IT) sector in National Stock Exchange were absorbed for the six months i.e. 1st July 2017 to 31st December 2017. The closing prices of share prices were taken and the future price movement was analyzed using various tools. Data were collected from trading of equity market in NSE, various books, journals, magazines and websites. The sample top �ve Information Technology (IT) companies are (1) Tata Consultancy Service; (2) Infosys Limited; (3) Wipro Limited; (4) Hindustan Computers Limited; and (5) Cognizant Technology Solution.
STUDY PERIODThe study covers a period of six months from 1st July 2017 to 31st December 2017.
SHARE PRICE MOVEMENT THROUGH TECHNICAL ANALYSIS WITH SPECIAL REFERENCE TO INFORMATION TECHNOLOGY (IT) COMPANIES
Original Research Paper
Dr. R. Malini Assistant Professor, PG & Research Department of Commerce, Srimad Andavan Arts and Science College (Autonomous), Tiruchirappalli-05.
X 131GJRA - GLOBAL JOURNAL FOR RESEARCH ANALYSIS
Commerce
“Technical analysts believe that the historical performance of Stocks and markets are indications of future performance”.
Technical analysis is based on analyzing current demand-supply of commodities, stocks, indices, futures or any tradable instrument. It is a method of evaluating securities by analyzing the statistics generated by market activity, such as past prices and volume. It helps in understanding the intrinsic value of shares and knowing whether the shares are undervalued or overvalued. Through technical indicators, investors can analyze the short-term price movement of the stock, the most important market turning points and project the price movement. The Information technology (IT) sector has grown much faster globally. So, this study made an attempt to analysing the price movements of top �ve Information Technology companies (i.e.: Tata Consultancy Service, Infosys Limited, Wipro Limited, Hindustan Computers Limited and Cognizant Technology Solution). Secondary data were used for the purpose of technical analysis (i.e.: the daily share price movements of the selected top �ve Information Technology (IT) sector) in National Stock Exchange. This study covers a period of six months from 1st July 2017 to 31st December 2017.The major tools used in this study are Moving Average (MA), Rate of Change (ROC) and Relative Strength Index (RSI). Finally this study concludes that the investors who are willing to invest their investment in Information Technology (IT) Sector, the top performers are Tata Consultancy Services and Infosys Limited and also this study strongly suggests the investor, technical analysis was highly essential for deciding the suitable stock.
ABSTRACT
KEYWORDS : Securities, Share price, Technical Analysis, Information Technology, Tradable instrument, Moving Average, Rate of Change, and Relative Strength Index.
VOLUME-8, ISSUE-1, JANUARY-2019 • PRINT ISSN No 2277 - 8160

132 X GJRA - GLOBAL JOURNAL FOR RESEARCH ANALYSIS
TOOLS USED FOR ANALYSISThe major tools used in this study are:Ÿ Moving Average (MA)Ÿ Rate of Change (ROC)Ÿ Relative Strength Index (RSI)
MOVING AVERAGE (MA)A moving average is the average price of a security over a set amount of time. It is especially helpful in volatile markets. A simple moving average is formed by computing the average (mean) price of a security over a speci�ed number of periods.
For example: A 5 – day moving average is calculated by adding the closing prices for the last 5 days and dividing the total by 5.
RATE OF CHANGE (ROC)The rate of change (ROC) is the speed at which a variable changes over a speci�c period of time. ROC is often used when speaking about momentum and it can generally be expressed as a ratio
between changes in one variable relative to a corresponding change in another; graphically, the rate of change is represented by the slope of a line.
Rate of Change (ROC) = {(current value / previous value) - 1} x 100
RELATIVE STRENGTH INDEX (RSI)The relative strength index (RSI) is an extremely useful oscillating momentum indicator that was developed by J. Welles Wilder and is one of the most widely used indicators in technical analysis. RSI oscillates between zero and 100. The most popular is the 14 days RSI where the RSI is calculated based on 14 days values. Traditionally the stock is considered to be over bought when RSI is above 70 and over sold when RSI is below 30.
Relative Strength Index (RSI) = 100 – [100 / (1+RS)]Where, RS = Average Gain / Average Loss
TABLE – 1 ANALYSIS OF MOVING AVERAGE, RATE OF CHANGE AND RELATIVE STRENGTH INDEX OF TOP FIVE INFORMATION TECHNOLOGY COMPANIES FOR THE MONTH OF JULY 2017
Table 1 indicates that, the moving average of a sample top �ve Information Technology (IT) companies was gradually increased till the end of the month. In Tata Consultancy Services it gradually increased from 2396.69 to 2491.10. In Infosys limited it raise from 960.34 to 987.48. In a same manner Wipro limited moving average was gradually increased from 261.20 to 283.29. In Hindustan Computers Limited and Cognizant Technology Solution the moving average was raised from 845.30 to 893.81 and from 67.55 to 69.66. The result reveals that most of the days the entire sample IT company's share price shows the positive Rate of Change (ROC), it implies that these shares are outperformed the market in the short term. Further the analysis strongly pointed out that, during the month of July 2017 all the company's Relative Strength Index (RSI) value was shown the positive result and it implies that these companies provide greater yield to their investors.
Table 2 pointed out that the moving average of four IT Information Technology (IT) companies was gradually decreased till the end of
the month but Wipro limited moving average was gradually increased till the end of the month. In Tata Consultancy Services it gradually reduced from 2495.84 to 2494.31. In Infosys limited it falls from 981.83 to 921.26. In Wipro limited moving average was gradually increased from 289.51 to 290.56. In Hindustan Computers Limited and Cognizant Technology Solution the moving average was decreased from 879.47 to 867.98 and from 70.25 to 69.94. The result reveals that most of the days, out of �ve companies, four IT company's share price shows the negative Rate of Change (ROC), it implies that these shares are not outperformed the market in the short term. In Wipro limited most of the days share price shows the positive ROC, it implies that these shares are outperformed the market in the short term. Further the analysis strongly pointed out that, during the month of August 2017 except Wipro Limited remaining IT companies Relative Strength Index (RSI) value was negative result and it indicates that these companies provide moderate return to their investors.
VOLUME-8, ISSUE-1, JANUARY-2019 • PRINT ISSN No 2277 - 8160

Table 3 indicates that the moving average of four IT Information Technology (IT) companies was gradually increased till the end of the month but Wipro limited moving average was gradually decreased till the end of the month. In Tata Consultancy Services it gradually increased from 2470.77 to 2490.66. In Infosys limited it raises from 893.64 to 903.56. In Wipro limited moving average was gradually decreased from 296.63to 289.34. In Hindustan Computers Limited and Cognizant Technology Solution the moving average
was increased from 863.29 to 880.76 and from 71.57 to 72.08. The result shows that most of the days, out of �ve companies, four IT company’s share price shows the positive Rate of Change (ROC), it implies that these shares are outperformed the market in the short term. In Wipro limited most of the days share price shows the negative ROC, it implies that these shares are not outperformed the market in the short term. Further the analysis strongly pointed out that, during the month of September 2017 except Wipro Limited
TABLE – 2 ANALYSIS OF MOVING AVERAGE, RATE OF CHANGE AND RELATIVE STRENGTH INDEX OF TOP FIVE INFORMATION TECHNOLOGY COMPANIES FOR THE MONTH OF AUGUST 2017
TABLE – 3 ANALYSIS OF MOVING AVERAGE, RATE OF CHANGE AND RELATIVE STRENGTH INDEX OF TOP FIVE INFORMATION TECHNOLOGY COMPANIES FOR THE MONTH OF SEPTEMBER 2017
X 133GJRA - GLOBAL JOURNAL FOR RESEARCH ANALYSIS
VOLUME-8, ISSUE-1, JANUARY-2019 • PRINT ISSN No 2277 - 8160

remaining IT companies Relative Strength Index (RSI) value was positive result and it indicates that these companies provide greater return to their investors.
Table 4 indicates that the moving average of four IT Information Technology (IT) companies was gradually increased till the end of the month but Hindustan Computers Limited moving average was gradually decreased till the end of the month. In Tata Consultancy Services it gradually increased from 2486.79 to 2584.48. In Infosys limited it raises from 921.45 to 934.61. In Wipro limited and Cognizant Technology Solution the moving average was gradually increased from 287.64to 295.58 and from 73.44 to 74.75. In
Hindustan Computers Limited the moving average was gradually comes down from 908.78 to 894.43. The result shows that most of the days, out of �ve companies, four IT company’s share price shows the positive Rate of Change (ROC), it implies that these shares are outperformed the market in the short term. In Hindustan Computer Limited most of the days share price shows the negative ROC, it implies that these shares are not outperformed the market in the short term. Further the analysis strongly pointed out that, during the month of October 2017 except Hindustan Computers Limited remaining IT companies Relative Strength Index (RSI) value was positive result and it indicates that these companies provide greater yield to their investors.
TABLE – 4 ANALYSIS OF MOVING AVERAGE, RATE OF CHANGE AND RELATIVE STRENGTH INDEX OF TOP FIVE INFORMATION TECHNOLOGY COMPANIES FOR THE MONTH OF OCTOBER 2017
TABLE – 5 ANALYSIS OF MOVING AVERAGE, RATE OF CHANGE AND RELATIVE STRENGTH INDEX OF TOP FIVE INFORMATION TECHNOLOGY COMPANIES FOR THE MONTH OF NOVEMBER 2017
134 X GJRA - GLOBAL JOURNAL FOR RESEARCH ANALYSIS
VOLUME-8, ISSUE-1, JANUARY-2019 • PRINT ISSN No 2277 - 8160
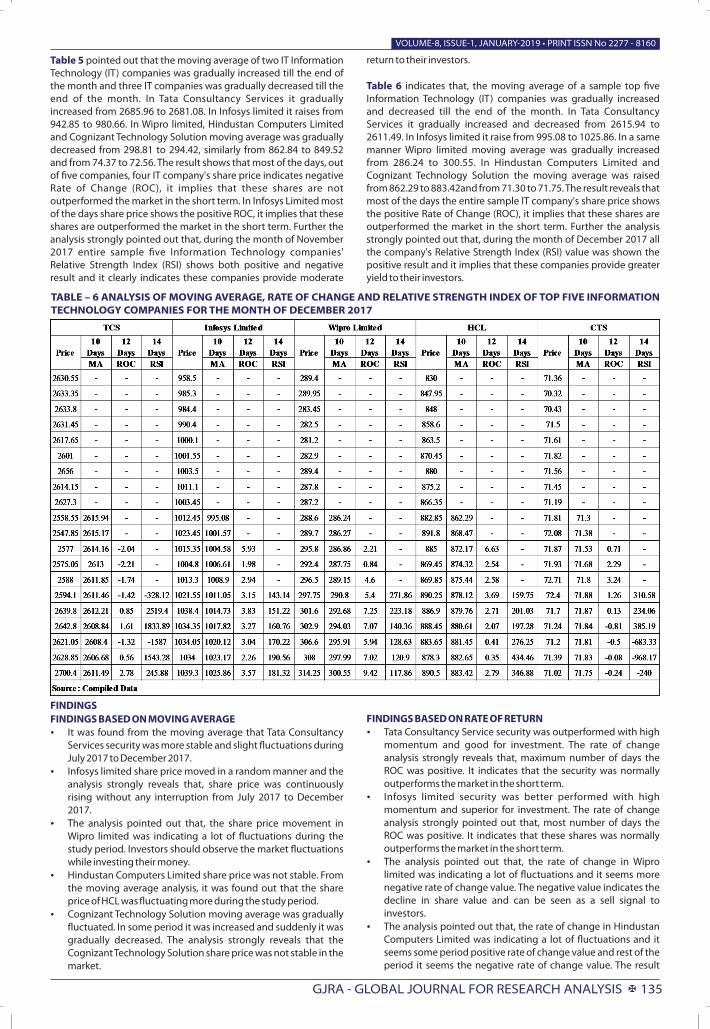
Table 5 pointed out that the moving average of two IT Information Technology (IT) companies was gradually increased till the end of the month and three IT companies was gradually decreased till the end of the month. In Tata Consultancy Services it gradually increased from 2685.96 to 2681.08. In Infosys limited it raises from 942.85 to 980.66. In Wipro limited, Hindustan Computers Limited and Cognizant Technology Solution moving average was gradually decreased from 298.81 to 294.42, similarly from 862.84 to 849.52 and from 74.37 to 72.56. The result shows that most of the days, out of �ve companies, four IT company's share price indicates negative Rate of Change (ROC), it implies that these shares are not outperformed the market in the short term. In Infosys Limited most of the days share price shows the positive ROC, it implies that these shares are outperformed the market in the short term. Further the analysis strongly pointed out that, during the month of November 2017 entire sample �ve Information Technology companies' Relative Strength Index (RSI) shows both positive and negative result and it clearly indicates these companies provide moderate
return to their investors.
Table 6 indicates that, the moving average of a sample top �ve Information Technology (IT) companies was gradually increased and decreased till the end of the month. In Tata Consultancy Services it gradually increased and decreased from 2615.94 to 2611.49. In Infosys limited it raise from 995.08 to 1025.86. In a same manner Wipro limited moving average was gradually increased from 286.24 to 300.55. In Hindustan Computers Limited and Cognizant Technology Solution the moving average was raised from 862.29 to 883.42and from 71.30 to 71.75. The result reveals that most of the days the entire sample IT company's share price shows the positive Rate of Change (ROC), it implies that these shares are outperformed the market in the short term. Further the analysis strongly pointed out that, during the month of December 2017 all the company's Relative Strength Index (RSI) value was shown the positive result and it implies that these companies provide greater yield to their investors.
TABLE – 6 ANALYSIS OF MOVING AVERAGE, RATE OF CHANGE AND RELATIVE STRENGTH INDEX OF TOP FIVE INFORMATION TECHNOLOGY COMPANIES FOR THE MONTH OF DECEMBER 2017
FINDINGSFINDINGS BASED ON MOVING AVERAGEŸ It was found from the moving average that Tata Consultancy
Services security was more stable and slight �uctuations during July 2017 to December 2017.
Ÿ Infosys limited share price moved in a random manner and the analysis strongly reveals that, share price was continuously rising without any interruption from July 2017 to December 2017.
Ÿ The analysis pointed out that, the share price movement in Wipro limited was indicating a lot of �uctuations during the study period. Investors should observe the market �uctuations while investing their money.
Ÿ Hindustan Computers Limited share price was not stable. From the moving average analysis, it was found out that the share price of HCL was �uctuating more during the study period.
Ÿ Cognizant Technology Solution moving average was gradually �uctuated. In some period it was increased and suddenly it was gradually decreased. The analysis strongly reveals that the Cognizant Technology Solution share price was not stable in the market.
FINDINGS BASED ON RATE OF RETURNŸ Tata Consultancy Service security was outperformed with high
momentum and good for investment. The rate of change analysis strongly reveals that, maximum number of days the ROC was positive. It indicates that the security was normally outperforms the market in the short term.
Ÿ Infosys limited security was better performed with high momentum and superior for investment. The rate of change analysis strongly pointed out that, most number of days the ROC was positive. It indicates that these shares was normally outperforms the market in the short term.
Ÿ The analysis pointed out that, the rate of change in Wipro limited was indicating a lot of �uctuations and it seems more negative rate of change value. The negative value indicates the decline in share value and can be seen as a sell signal to investors.
Ÿ The analysis pointed out that, the rate of change in Hindustan Computers Limited was indicating a lot of �uctuations and it seems some period positive rate of change value and rest of the period it seems the negative rate of change value. The result
X 135GJRA - GLOBAL JOURNAL FOR RESEARCH ANALYSIS
VOLUME-8, ISSUE-1, JANUARY-2019 • PRINT ISSN No 2277 - 8160

found that, investors are aware to observe the market �uctuations while investing their money.
Ÿ Cognizant Technology Solution security was better performed with high momentum and superior for investment. The rate of change analysis strongly pointed out that, majority period the ROC was positive. It indicates that these shares was normally outperforms the market in the short term.
FINDINGS BASED ON RELATIVE STRENGTH INDEXŸ The analysis strongly found out that, the Tata Consultancy
service relative strength index value was more than the signi�cant level. It highlights that a security is becoming overbought or overvalued. The investors are investing their investment in Tata Consultancy Service without any hesitation.
Ÿ Infosys limited relative strength index value was positive in the majority period. The positive value indicates that the share price was more stable and that security is becoming overbought or overvalued.
Ÿ The analysis pointed out that, the relative strength index in Wipro limited was indicating a lot of �uctuations and it seems more positive and less negative value. The negative value was commonly interpreted as indicating an oversold or undervalued condition that may signal a trend change or corrective price reversal to the upside.
Ÿ Hindustan Computer Limited relative strength index value was shown positive and also negative value during the study period. The positive value indicates that the share price was more stable and that security is becoming overbought and the negative value was indicating an oversold condition of the security.
Ÿ The analysis pointed out that, the relative strength index in Cognizant Technology Solution was indicating a lot of �uctuations and it seems more positive and less negative value. The investors are very careful to bought shares while investing their investment money.
CONCLUSIONInvestment is a �nancial activity that involves risk. It is the commitment of funds for a return expected to be realized in the future. Risk and Return are the two most important characteristics of any investment. Safety and liquidity are also important for an investor. The objective of an investor is speci�ed as maximization of return and minimization of risk. Generally, investor tries to maximize his welfare by choosing the optimum combination of risk and return in accordance with his preference and capacity. Investors who are willing to invest their investment in Information Technology (IT) Sector, the top performers are Tata Consultancy Services and Infosys. Finally the study concludes that, investor highly essential to do technical analysis for deciding the suitable stock.
REFERENCES1) Gordon and Natarajan, (2007), Financial Markets and Services, Himalaya Publishing
House, Third revised enlarged edition, Mumbai.2) Avadhani V.A, (2011), Investment and Securities Markets in India, 9th revised edition,
Himalaya Publishing House, Mumbai.3) Punithavathy Pandian, (2013), Security Analysis and Portfolio Management, 2nd
edition, Vikas Publishing House Private Limited, New Delhi.4) International Journal of Business and Administration Research, 2(4), 26-36.5) Paripex - Indian Journal of Research, 2 (2), 143-145.6) International Journal of Marketing, Financial Services and Management Research, 2
(5), 45-59.7) www.tcs.com accessed on 26.12.178) www.infosys.com accessed on11.01.189) www.wipro.com en-in accessed on19.02.1810) www.hcltech.com accessed on 24.02.1811) www.cognizant.com accessed on 10.03.1812) www.economicstime.com accessed on 15.03.18
136 X GJRA - GLOBAL JOURNAL FOR RESEARCH ANALYSIS
VOLUME-8, ISSUE-1, JANUARY-2019 • PRINT ISSN No 2277 - 8160