volume 9, number 6, june 2010 (serial number 84) · volume 9, number 6, june 2010 (serial number...
TRANSCRIPT

David Publishing Company
www.davidpublishing.com
PublishingDavid
Chinese Business Review
Volume 9, Number 6, June 2010 (Serial Number 84)

Publication Information: Chinese Business Review (ISSN1537-1506) is published monthly in hard copy and online by David Publishing Company located at 1840 Industrial Drive, Suite 160, Libertyville, Illinois 60048, USA. Aims and Scope: Chinese Business Review, a monthly professional academic journal, covers all sorts of researches on Economic Research, Management Theory and Practice, Experts Forum, Macro or Micro Analysis, Economical Studies of Theory and Practice, Finance and Finance Management, Strategic Management, and Human Resource Management, and other latest findings and achievements from experts and scholars all over the world. Editorial Board Members: ZHU Lixing (Hong Kong) Moses N. Kiggundu (Canada) Iltae Kim (Korea) LI Kui-Wai (Hong Kong) Jehovaness Aikaeli (Tanzania) Ajetomobi, Joshua Olusegun (Nigeria) Shelly SHEN (China) Chris TIAN (China) Ruby LI (China) Sherry ZHU (China) Manuscripts and correspondence are invited for publication. You can submit your papers via Web Submission, or E-mail to [email protected], [email protected]. Submission guidelines and Web Submission system are available at http://www.davidpublishing.com. Editorial Office: 1840 Industrial Drive, Suite 160 Libertyville, Illinois 60048 Tel: 1-847-281-9826 Fax: 1-847-281-9855 E-mail: [email protected] Copyright©2010 by David Publishing Company and individual contributors. All rights reserved. David Publishing Company holds the exclusive copyright of all the contents of this journal. In accordance with the international convention, no part of this journal may be reproduced or transmitted by any media or publishing organs (including various websites) without the written permission of the copyright holder. Otherwise, any conduct would be considered as the violation of the copyright. The contents of this journal are available for any citation, however, all the citations should be clearly indicated with the title of this journal, serial number and the name of the author. Abstracted / Indexed in: Database of EBSCO, Massachusetts, USA Chinese Database of CEPS, Airiti Inc. & OCLC Chinese Scientific Journals Database, VIP Corporation, Chongqing, P. R. China Ulrich’s Periodicals Directory ProQuest/CSA Social Science Collection, Public Affairs Information Service (PAIS), USA Subscription Information: Print $360 Online $300 Print and Online $560 David Publishing Company 1840 Industrial Drive, Suite 160, Libertyville, Illinois 60048 Tel: 1-847-281-9826. Fax: 1-847-281-9855 E-mail: [email protected]

Chinese Business Review
Volume 9, Number 6, June 2010 (Serial Number 84)
Contents Financial Forum
The influence of operating cash flow and investment cash flow to the accounting conservatism
measurement 1
Dwi Martani, Narita Dini
Thinking on the withdrawal mechanism of venture capital in China 7
YU Cheng-xuan
Comparative Economics The adoption of strategic marketing practices: A comparison between New Zealand and
Chinese manufacturers 18
Roger Brooksbank, Ron Garland, David Taylor, Patrycia Babis
A different view to two paired sample researches and an application 29
Çetin Ayhan Seyfullahoğullari
Enterprise Management Redesign of enterprise business model from structure perspective 36
DING Ning, DING Yi
Research on relationship between authentic leadership and employees’ work attitude 42
FU Yun-qi
The law of increasing of the final price and the law of management of the final price in the
practice in the today economic crisis 48
Momtchil Dobrev
Industrial Economics The study on Yangling farmer profession associations 53
WANG Zheng-bing, XU Ting, SUN Hao-jie, Allan Rae
SWOT analysis of the Shanxi agriculture intellectual property rights 59
SHI Xue-qiao

June 2010, Volume 9, No.6 (Serial No.84) Chinese Business Review, ISSN 1537-1506, USA
1
The influence of operating cash flow and investment cash flow to the
accounting conservatism measurement∗
Dwi Martani, Narita Dini (Departement of Accounting, Faculty of Economics, University of Indonesia, Depok 16424, Indonesia)
Abstract: This research investigates the influence of cash flow from operating and investing activities to conservative accounting practices. Cash flow from operating activities shows the performance of a firms and its earnings quality. Higher operating cash flow indicates better performance, and it is expected to produce better earnings in the future. Better earnings would be a positive signal for investor as a basic to predict the firm’s prospect. Investing activities will push or lowering operating assets. For firms that implementing the conservative accounting practices, changes in investment will influence the earnings’ quality. When the investment goes up, the conservative practices will cause lower reported earnings. The hypothesis for this research is that there is a positive relation between operating and investing cash flow to accounting conservatism practices about whether it uses market value or accrual measurement. The result of the first test using market value accounting conservatism as a proxy has shown a positive relation between operating and investing activities cash flow to accounting conservatism practices, but investing cash flow does not have a significant effect to accounting conservatism practices. The result from the second test, using accrual measurement accounting conservatism has shown a significant positive relation for both operating and investing cash flow to accounting conservatism practices. A positive relation between operating and investing cash flow to accounting conservatism practices indicates that accounting conservatism is one of the tools that can be used to measure firm’s financial performance and as an investment decision making tool for investor. Nevertheless those effects highly depend on the accounting conservatism proxy measurement used.
Key words: accounting conservatism; operating cash flow; investing cash flow
1. Introduction
Accounting conservatism is traditionally defined as the accounting guideline that understates assets and revenues and overstates liabilities and expenses (Hendriksen & Van Breda, 1992). Expenses should be recognized earlier than later while revenue should be recognized later than sooner. Thus, net income will result in a lower figure. Furthermore, conservatism holds that in financial report, it is preferable to be pessimistic than optimistic since there is less chance of financial readers being hurt by relying on prepared financial statements. It is also argued that pessimism is needed to counteract the optimism of management. However, excess conservatism may result in misguided decisions.
Despite criticism from many quarters, including standard-setters, conservatism appears not only to have survived in accounting for many centuries, but also to have increased in the recent years. Previous researches have
∗ This paper is part of Narita’s thesis in post graduate program in Finance, FEUI, and Dwi Martani is a supervisor.
Dwi Martani, Ph.D., lecturer, Departement of Accounting, Faculty of Economics, University of Indonesia; research field: accounting.
Narita Dini, Master, Departement of Accounting, Faculty of Economics, University of Indonesia; research fields: accounting and finance.
The influence of operating cash flow and investment cash flow to the accounting conservatism measurement
2
been done to test the accounting conservatism such as conflicting in dividend policy (Ahmed, Billings, Morton & Stanford-Harris, 2002), lowering the litigation and contract fee (Holthausen & Watts, 2001), corporate governance and ownership structure (Ball, Kothari & Robin, 2000) and auditor responsibility (Basu, 1997). In Indonesia, the investigation has been done to support the hypothesis saying that the rate of conservatism applied in a firm linearly effects on its market value (Mayangsari, Sekar & Wilopo, 2002).
This research has been put attention on the influence of firm cash flow as one of the financial performance to the accounting conservatism. Cash flow report provides the information on the amount of cash a firm generates from the revenues, excluding costs associated with long-term investment on capital items or investment in securities. It is comparable to the accrual information on profit-loss report. The firm’s profit and cash flow are closely observed by the investors.
Many researches have been done to determine the influence of cash flow report to the accounting conservatism from different point of views. Some of those views are firm market value and accounting data which is related to the cash flow operation (Feltham & Ohlson, 1995), influence of investing to the quality of firm’s profit when they apply the accounting conservatism principle (Penman & ZHANG, 2002), and influence of the change in cash investments and the change in lagged operating assets to the regression of returns on earnings levels and earnings changes when applying accounting conservatism principle (Easton & Pae, 2004).
After reviewing the accounting conservatism role on the cash flow reports of companies in Indonesia, a further research has been done by the author to study the influence of operating cash flow and investment with additional variables that are leverage, profitability, sales growth and firm size to the accounting conservatism level. This level is measured with two measurements, which are market value (Beaver & Ryan, 2000) and accrual measurement (Givoly & Hayn, 2000). The scope of the research is focused on the source of funds from firm operation, which is used to the investment.
2. Research methodology
The research samples were all firms, listed in Indonesian Stock Exchange (Bursa Efek Indonesia) from 2000-2006. They were taken using purposive sampling method. The financial performance data of each firm was taken from their balance of payment, profit loss and cash flow reports.
Table 1 Abbreviations CONMKT Accounting conservatism with market value measurement CONACC Accounting conservatism with accrual measurement CFO Operating cast flow CFI Investment cast flow LEV Leverage ROA Probability NPM Net profit margin ROE Return on equity SALESGROWTH Sales growth SIZE Firm size
In order to verify the effect of independent variables on the dependent variables, data was analysed statistically using multiple linear regression analysis by employing EVIEWS 5.1 software. The ordinary least square (OLS) was applied to do the estimation technique. Furthermore, cross section weight and robust test were prepared using STATA 8

The influence of operating cash flow and investment cash flow to the accounting conservatism measurement
3
software in order to avoid the heteroscedasticity. Other statistic tests to bring the best linier unbiased estimator (BLUE assumption) were as follows: multicollinearity, autocorrelation, goodness of fit t test, F test and R2 test.
Fig. 1 Model 1: Accounting conservatism with market value measurement
Fig. 2 Model 2: Accounting conservatism with accrual measurement
Empirical model equations, which were used in this research, are as follows: Model 1: Accounting conservatism with market value measurement:
CONMKTit = β0 + β1 CFOit + β2 CFIit + β3 LEVit + β4 ROAit + β5 SALESGROWTHit + β6 SIZEit + eit Model 2: Accounting conservatism with accrual measurement:
CONACCit = β0 + β1 CFOit + β2 CFIit + β3 LEVit + β4 ROAit + β5 SALESGROWTHit + β6 SIZEit + eit
Operating cash flow
Investment cash flow
Leverage
Profitability
Sales growth
+
+
+
-
Size
Accounting conservatism with accrual measurement
-
-
Operating cash flow
Leverage
Profitability
Sales growth
Size
+
+
+
+
+
+
Accounting conservatism with market value measurement
Investment cash flow

The influence of operating cash flow and investment cash flow to the accounting conservatism measurement
4
The abbreviations of the variables are showed in Table 1. The research framework charts for model 1 and model 2 are shown in Fig. 1 and Fig. 2 consecutively. As depicted in Fig. 1, all used variables were predicted to have a linear relation on the accounting
conservatism with market value measurement. While Fig. 2 assumed that some variables, for example, profitability, sales growth and firm size have an inverse relation on the accounting conservatism with accrual measurement.
3. Results and discussion
Table 2 summarizes the descriptive statistic of all samples for model 1 and model 2. It can be seen from Table 2 that the CONACC and CONMKT variables had average values of -0.020 and 1.16E-07 respectively. These average values are close to zero, therefore the number of firms applying accounting conservatism were still low.
Operating cash flow and investment cash flow had average values of 0.118 and -0.072. This indicated that the firm’s operating cash flow was used for funding the investment.
The model 1 test results are listed in Table 3. It is shown in Table 3 that the adjusted R2 value of 0.12 verified that 12% of the accounting conservatism with market value measurement could be explained by model’s independent variables. While the F Test value of less than 1% indicated that the all model’s independent variables had significant influence to the dependent variables. Furthermore, the BLUE assumption test has shown that the model did not demonstrate heteroscedasticity and multicollinearity.
The t test showed that the CFO, LEV and SIZE had positive effects on the accounting conservatism with market value measurement, and each of those variables had the significance level on 5%. While the SALES GROWTH with the level on 1% indicated the contrary effect.
Table 2 Descriptive statistic of sample population for model 1 and model 2
Variable Obs Mean Std. Dev. Min Max CONACC 126 -0.020 0.063 -0.308 0.123 CONMKT 126 1.16E-07 0.731 -2.407 0.742 CFO 126 0.118 0.078 -0.105 0.381 CFI 126 -0.072 0.110 -0.908 0.134 LEV 123 0.004 0.291 -0.929 0.822 ROA 126 0.076 0.118 -1.017 0.278 SALES GROWTH 126 0.014 1.615 -3.516 4.719 SIZE 126 29.250 1.309 26.500 31.690
The operating cash flow (CFO) variable with the coefficient of 1.88 indicated that the increase of current operating cash flow would be followed by future profit rising prospect. Therefore the investor’s expectation on the firm’s market value would be growing as well. This finding is aligned with the hypothesis and the previous research (Easton & Pae, 2004; Beaver & Ryan, 2000).
The investment cash flow (CFI) did not have the significant effect on the accounting conservatism with market value measurement. This might be resulted by the diverged condition of stock market and the sample characteristics in Indonesia. In addition, the length of the research might also affect the result.
The variable of leverage (LEV) with coefficient of 0.26 indicated that the rising of firm debt level would induce the bondholder to choose the conservatism practise to protect their interests in paying the debts.

The influence of operating cash flow and investment cash flow to the accounting conservatism measurement
5
Table 3 Model 1: Accounting conservatism with market value measurement test results CONMKTit = β0 + β1 CFOit + β2 CFIit + β3 LEVit + β4 ROAit + β5 SALESGROWTHit + β6 SIZEit + eit
Dependent variabel : CONMKT Independent Variable Sign Expectation Coefficient t-Stat Significance
Constant ? -3.36 -3.187610 0.0018 CFO + 1.88 2.159612 **0.0329 CFI + 0.56 0.929808 0.3544 LEV + 0.26 1.682304 ***0.0952 ROA + 0.19 0.401651 0.6887 SALES GROWTH + -0.17 -3.834916 *0.0002 SIZE + 0.10 3.045364 *0.0029 Prob (F-stat) 0.001642 Adj R2 0.121793
Notes: * Significance level 1%; *** Significance level 5%; **** Significance level 10%.
The profitability (ROA) variable and its substitute: Net profit margin (NPM) and return on equity (ROE) did not show any significant effect on the accounting conservatism with market value measurement.
The firm sales growth (SALES GROWTH) variable with coefficient of -0.17 was inconsistent with the hypothesis and pervious research (Ahmed, Billings, Morton & Stanford-Harris, 2002). This negative effect could be explained through the realisation of asset growth with the book to market ratio. There would be a disparity between old and new asset if the growth of selling and the buying of new asset increase. Therefore, the book value and market value of new assets would not be significantly different. Consequently, the application of conservatism with market value measurement would be lower.
The model of firm size variable (SIZE) indicated that a firm most likely to apply the accounting conservatism with market value measurement as its size grows.
The second model simulation results of accounting conservatism with accrual measurement are shown in Table 4. As can be seen from Table 4, the t test of CFO, CFI and LEV variables showed the positive effect toward the accounting conservatism with accrual measurement. While the other variables, namely ROA and SIZE indicated the opposing effects on the conservatism.
Table 4 Model 2: Accounting conservatism with accrual test measurement results CONACCit = β0 + β1 CFOit + β2 CFIit + β3 LEVit + β4 ROAit + β5 SALESGROWTHit + β6 SIZEit + eit
Dependent variabel: CONACC Independent variable Sign expectation Coefficient t-Stat Significance
Constant ? 0.404918 2.78047 0.00630 CFO + 0.275605 2.975981 *0.00360 CFI + 0.092784 2.909132 *0.00430 LEV + 0.082985 4.562475 *0.00000 ROA - -0.247974 -3.005075 *0.00330 SALES GROWTH - 0.003206 0.970288 0.33390 SIZE + -0.014818 -2.961717 *0.00370 Prob (F-stat) 0.000000 Adj R2 0.342186
Note: * Significance level 1%.
The operating cash flow (CFO) variable with coefficient value of 0.27 suggested that the increase of

The influence of operating cash flow and investment cash flow to the accounting conservatism measurement
6
operating cash flow would lower accrual value. Therefore, the firm becomes more conservatism. The investment cash flow (CFI) coefficient value of 0.09 showed that the increase of investment cash flow
would generate the firm to invest in NPV positive projects. As a consequence, the firm’s profit recognition would be delayed. This delay would induce the growth of accounting conservatism with accrual measurement.
The leverage (LEV) variable with coefficient of 0.08 indicated that the growth of firm debt level would lower the accrual value thus, increasing the accounting conservatism with accrual measurement.
Despite having positive sign, the sales growth (SALES GROWTH) variable did not have significant effect on the accounting conservatism with accrual measurement. This discrepancy might be because of the firm selling variation which was not based on its industry and the few numbers of observed samples.
The model of profitability (ROA) and firm size (SIZE) showed the negative sign of -0.24 and -0.01 respectively. The result of the SIZE variable model was not match with the hypothesis. This because in Indonesia, the small firm usually has conservative financial report in order to avoid the higher political cost.
4. Conclusions
(1) Cash flow report has a significant role in verifying the firm ability to fulfil their operating necessity. In relation to credit incentive, the bank requires detail information on cash flow to assess the firm ability in interest repayment.
(2) The operating cash flow (CFO) has a substantially positive influence on the accounting conservatism with market value measurement.
(3) Despite having positive sign, the investment cast flow (CFI) does not have a significant effect on the accounting conservatism with market value measurement.
(4) Both, CFO and CFI have an important impact on the accounting conservatism with accrual measurement. (5) By applying two different conservatism measurements, namely, market value and accrual measurements, it is
found that the influence of financial cash flow on the level of conservatism depends on the applied of its measurement. References: Ahmed, A. S., Billings, B. K., Morton, R. M. & Stanford-Harris, M.. (2002). The role of accounting conservatism in mitigating
bondholders-shareholders conflicts over dividend policy and in reducing debt costs. The Accounting Review, 77, 867-890. Ball, R., Kothari, S. P. & Robin, A.. (2000). The effect of international institutional factors on properties of accounting earnings.
Journal of Accounting and Economics, 29 (February), 1-51. Basu, S.. (1997). The conservatism principle and the asymmetric timeliness of earnings. Journal of Accounting and Economics, 24,
3-38. Beaver, W. H. & Ryan, S. G.. (2000). Biases and lags in book value and their effects on the ability of the book-to-market to predict
book return on equity. Journal of Accounting Research, 38, 127-148. Easton, P. & Pae, J.. (2004). Accounting conservatism and relation between returns and accounting data. Review of Accounting
Studies, 9, 495-521. Feltham, G. E. & Ohlson, J. A.. (1995). Valuation and clean surplus accounting for operating and financial activities. Contemporary
Accounting Research, 11, 689-731. Givoly, D. & Hayn, C.. (2000). The changing time-series properties of earnings, cash flow and accruals: Has financial reporting
become more conservative? Journal of Accounting and Economics, 29, 287-320. Hendriksen, E. & Van Breda, M.. (1992). Accounting theory (5th ed.). Homewood, IL: Irwin. Holthausen, R. W. & Watts, R. L.. (2001). The relevance of value relevance literature for financial accounting standard setting.
Journal of Accounting and Economics, 3, 305-360. Mayangsari, Sekar & Wilopo. (2002). Accounting conservatism, value relevance and discretionary accruals: Implications for
empirical model-Ohlson Feltham. (1996). Journal of Accounting Research Indonesia, 5(3), 291-310. (in Indonesian) Penman, S. H. & ZHANG, X.. (2002). Accounting conservatism, the quality of earnings and stock returns. The Accounting Review,
77(2), 237-264. (Edited by Ruby and Chris)

June 2010, Volume 9, No.6 (Serial No.84) Chinese Business Review, ISSN 1537-1506, USA
7
Thinking on the withdrawal mechanism of venture capital in China
YU Cheng-xuan (Wuhan University of Technology, Wuhan 430070, China)
Abstract: From the operating mechanism of venture capital, we can see that, the withdrawal mechanism of the venture capital plays a decisive role in the ultimate success or failure of the venture capital. One of the key issues affecting the development of China’s venture capital industry is that the withdrawal mechanism is not sound. In referring to the foreign successful experience, we must fully analyze it by integrating with the actual situations of China. Currently, the capital market, property market, venture capital system and legal system of China are not perfect, and the improvement of the mechanism can not be done overnight. We can first choose to withdraw in a practical way in the current stage to gain the time to develop, and then continue to pave the way to create conditions, and finally establish a perfect venture capital withdrawal mechanism.
Key words: venture capital; withdrawal mechanism; China
1. Introduction
Venture capital is an investment method which is popular worldwide. And its definitions by the international authoritative institutions are as follows: as defined by National Venture Capital Association (NVCA), venture capital is a kind of equity capital which is invested into the emerging enterprises (especially the SMEs) which develop rapidly and have great competition potential by professional financiers; By contrast, the definition by Organization for Economic Cooperation and Development (OECD) is wider, i.e., all investment based on hi-tech and knowledge and in innovative products or services with intensive production and management technologies can be seen as venture capital. From the perspective of investment behavior, venture capital is a process of investing capital into the field of hi-tech research and development bearing the risk of failure. From the perspective of operation mode, it refers to the process in which the investment intermediaries managed by the professionals invest venture capital into potential high-tech enterprises, and it is also an investment mechanism for coordinating the relation among the venture capital investors, technicians and the investors, and sharing interest and risks.
2. The withdrawal mechanism from the operating mechanism of venture capital
2.1 The operation of venture capital The operation of venture capital mainly involves investors, intermediaries (venture capital companies) and
investment objects (venture enterprises) which play their own roles in the operation of venture capital. Investors are providers of venture capital. They can be established with government investment, enterprise
investment, non-governmental privately-held capital, capital self-raised by the scientific research units, commercial bank loan and foreign investment, etc.
YU Cheng-xuan, Ph.D. candidate, Wuhan University of Technology; research field: theory of investment.
Thinking on the withdrawal mechanism of venture capital in China
8
Venture enterprises are the receivers of venture capital. They posses the hi-tech ideas or achievements, but lack the capital of industrializing the achievements. Once getting the capital support of the venture capital institutions, they industrialize the achievements, and obtain the economic return of technical innovation and achievement industrialization through the operation of the market mechanism.
Venture capital companies are the “bridge” of communicating the venture enterprises and the investors. They raise capital from the society one and one hand, and invest the capital to the venture enterprises with different strategies after strict investigation and screening, and actively participate in the operation management of the venture enterprises. When the right time comes, they withdraw the capital with added value from the venture enterprises in appropriate ways, so as to realize the rolling appreciation of the venture capital.
2.2 The key for the venture capital—the withdrawal mechanism By analyzing the whole operation process of venture capital, we are clear that, the key for the venture capital
to produce circulatory profit is the withdrawal mechanism of venture capital. If the link is lacked, the chain of the venture capital activities will be interrupted, the venture capital cannot realize investment appreciation and virtuous cycle, and cannot attract the social capital to join the rank of venture capital. Specially, the significance of the venture capital withdrawal mechanism can be mainly reflected in the followings: First, the withdrawal method of the venture capital is also a way of realizing profit. The venture capital and the investment in the general capital market have different methods of gaining profit. The investment of the general capital market mainly gains the profit by dividend payout and share appreciation, and the venture capital generally does not aim at enterprise dividend, but only takes share appreciation as the reward, necessarily requires a liquidation method capable of creating substantial capital appreciation, and thereby depending on a withdrawal channel capable of smoothly withdrawing. Second, the most fundamental characteristic of venture capital not only lies in the capital that is invested into products or fields with an uncertain future riskily, but also in the circulatory liquidity of capital and investment activities. Once got success, the investors can withdraw with high profit and have a new round of investment, which more require the venture capital to be withdrawn. Again, the venture capital withdrawal mechanism provides an objective evaluation method for the venture capital activities. The objects of the venture capital are the emerging enterprises with great development potential. Such enterprises are the comprehensive integration of new ideas, new technologies, new products and new markets. Their value cannot be determined by simple financial accounting, but only be found and realized by market evaluation. And the best standard for evaluating the investment value is to see if the venture capital is appreciated greatly when withdrawing.
Another issue highlighting the significance of the venture capital withdrawal mechanism is that, because the venture capital enterprises have inherent high risks, the venture capital programs are easier to fail comparing with the non-venture capital programs. Venture enterprises are difficult to keep rapid growth for a long time. To gain the highest return, the venture capital must withdraw before the rapid growth of the invested enterprises is over, so as to gain capital profit. Once the venture capital programs fail, not only the capital is not appreciated, and capital will be also difficult to be recovered. Therefore, a convenient and smooth withdrawal mechanism will help the venture capital to minimize the loss.
Clearly, venture capital and its withdrawal mechanism are inalienable. The high risk of the venture capital usually means high profit, and the key for obtaining profit and transferring risks is the withdrawal link. Withdrawal is a channel of gaining profit from venture capital, and it is the unique channel. Successful withdrawal not only means high return, but also is the basis for a new round of venture capital. Therefore, in order to develop

Thinking on the withdrawal mechanism of venture capital in China
9
venture capital, we must establish the sound withdrawal mechanism, so as to attract more capital to have venture investment.
3. Foreign venture capital withdrawal mechanism
From the foreign venture capital development modes, they mainly can be summed up as the Japan-Germany mode, with banks as the center, and the American mode, with the security market as the center. The venture capital systems of Japan and Germany take the banks as the center, and the venture enterprises are used to seeking capital sources from the investment companies and the banks belonging to groups. It is generally believed that, it is the best harvesting method of the venture capital if the enterprises issue shares to the public, because the withdrawal mechanism of the share issuance of the enterprises determines an implicit contract on the structure with the control right to the future enterprises between the capital suppliers and users. The implicit contract is effective to the interest conflict between the client and the agent under high-risk condition. Only to take the enterprise share issuance as the potential main withdrawal mechanism in a small cap stock market, a certain scale is realistic. In the Japan-Germany mode with large companies and large banks as the investors, the market structure is based on large enterprises and enterprise groups, and it is rather difficult if the venture enterprises want to meet the standards of the OTC market. Lacking an active small cap stock market with a certain scale, the withdrawal of the venture capital is mainly based on enterprise merger and share repurchasing, and the lacking of an incentive mechanism to the entrepreneurs restrains the development of the venture capital market to some degree.
The main experience for America to be succeed in venture capital lies in that its developed multi-level capital market and property market provide a multi-channel withdrawal method. America’s withdrawal methods are classified into three types, i.e., public listing, sale and asset liquidation. Also, some scholars classify them into four categories (CHENG, 1999) or six categories (CHENG, et al., 2000), and such categories are only the sub-division of the three types, so they do not have any substantial difference, thereby not affecting the research on relevant issues.
3.1 Public listing refers to IPO IPO is usually the best withdrawal method of venture capital. IPO can converts the non-negotiable shares
held by the venture capitalists into stocks of listed companies, to realize profit and liquidity, and the method can commonly gain quite high profit. IPO is a kind of confirmation of the financial market to the production achievements of the company, and the method keeps the independency of the company, and it is good for building the enterprise image and keeping sustainable financing channel. In America, about 30% venture capital adopts the withdrawal method. But the public offering and listing need the cooperation of the market environment and quite high access conditions, and the withdrawal cost is quite high. In addition, because the enterprise investment fund is considered as the insider, the held shares are strictly limited by Clause 144A of United States Securities and Exchange Commission, and only a small number of shares of the fund can be transferred after IPO, while other shares can be gradually transferred after a few years. Because the listing standard of the main-board market is quite high, the regulation is strict, the venture enterprises are generally medium-sized and small-sized hi-tech enterprises, and they are difficult to meet the requirements in continuous operation history, net assets, profit, etc., so it is usually very difficult to list in the main-board market. Therefore, many countries establish second-board market specially serving the hi-tech enterprises and venture capital, e.g., America’s NASDAQ market, growth

Thinking on the withdrawal mechanism of venture capital in China
10
enterprise market of Canada Vancouver Stock Exchange, Belgium EASDAQ Market and Britain’s AIM market. Compared with that in the main-board market, listing in the second-board market is a little easier, the listing scale is smaller, and mainly offers financing service to emerging SMEs and venture capital enterprises with growing potential, which enhance the attraction of withdrawing the investment through IPO.
3.2 Sale Sale includes two forms, i.e., sale and equity repurchasing. Sale is divided into general acquisition and
second phase of acquisition. Although IPO is the gold harvesting method of venture capital, because the venture capital supports a large number of enterprises and the market capacity is limited, various drawbacks also exist in public listing, so it is not the withdrawal method mostly used in practice. In fact, the sale method always occupies an absolutely important position in America’s venture capital history, in particular when the stock market is not in good conditions. In recent years, withdraw through the sale method accounts for larger and larger part in the rapidly developing venture capital. Statistics show that, as for the withdrawal method, general acquisition accounts for 23%, the second phase of acquisition accounts for 9%, stock repurchasing accounts for 6%, and the third accounts for a total of 38%, which is larger than the IPO part (WANG, 2008). In 1990s, the fifth merger wave arose in America, the merger and acquisition amount in every year is up to 300 billion US dollars, and the acquisition and merger market provides broad space for the venture capitalists to smoothly sell their equity. General acquisition mainly refers to the acquisition and merger among the companies. Because the buyers do not need to pay cash, it is easy to attract them, and the transaction is very flexible. But the profit is lower than that of public listing, and the venture companies cannot maintain their independence after being acquired by a large company and the management of the companies is affected.
The second phase of acquisition means a venture capital company transfers the equity of the venture enterprise to another venture capital company, and hands over the second phase of investment to it. If the original venture capital company only sells partial equity, part of the original investment flows, and forms the investment portfolio with the new investment. If the equipment is fully transferred, the original venture capital company fully withdraws. But the venture capital is not withdrawn from the venture enterprise, what is converted is only different venture capital investors, so the enterprise is not impacted by the investment withdrawal.
Equity repurchasing means a venture enterprise repurchases the equity of the company to the venture capital fund with cash. The venture capital can get the cash (or negotiable securities) but not only a kind of equity, and can quickly withdraw from the venture enterprise. In addition, equity repurchasing only involves the parties of the venture enterprise and venture capital, so the property relation is clear and the operation is easy. Furthermore, the external equity can be fully converted into internal equity, so that the venture enterprise keeps full independence, and possesses enough capital to preserve and increase the value.
3.3 Liquidation or bankruptcy It is a withdrawal method which is used when the venture enterprise is not expected to gain high profit in the
future. According to the statistics, among American enterprise which are supported by venture capital, 20% to 30% fully fail, about 60% are frustrated, and only 5% to 10% venture enterprises can succeed. In America, about 32% venture capital is withdrawn through this method. This method usually can recover 64% of the original investment (FAN, SHEN & CHEN, 2009). But if necessary, we must implement decisively. Otherwise, more losses will be brought, because the operation status of the enterprises may continuously go worse, and the capital invested into bad enterprises has a certain opportunity cost. Better that the capital is recovered in time and invested into more hopeful programs than that the original investment cannot play any active role.

Thinking on the withdrawal mechanism of venture capital in China
11
From the adoption proportion of the withdrawal methods, we can see that, according to the survey on America’s 442 venture capital programs, among the venture capital withdrawal methods, 30% venture capital is withdrawn through IPO, 23% through merger and acquisition, 6% through enterprise share repurchasing, 9% through share reselling, 6% through loss liquidity and 26% through share cancellation because of loss.
4. China’s venture capital withdrawal mechanism
From some perspective, China’s venture capital really developed after MJZY “Proposal No.1” in 1998. According to the statistics by Institute of China Science and Technology Finance, by September 2003, there had been a total of 92 venture capital enterprises in the whole country, and 7.4 billion yuan capital. And by the end of 2008, as reported by a Chinese news agency reporter in 2001 Chengdu Western Investment Forum, China had had nearly 200 venture capital companies, and the total invested capital had exceeded RMB30 billion yuan. It is clear that venture capital develops very rapidly. But we also see that, the venture capital of China is still in the initial stage. Data analysis shows that only fewer than 15% of more than 20,000 hi-tech achievements of provincial and ministerial levels or above can be really converted. Among the scientific and technological achievements which have been converted, capital self-raising accounts for 56%, national loan accounts for 26.8%, and venture capital only accounts for 2.3%. That shows that China’s venture capital has not assumed the right responsibilities. And one of the key issues affecting China’s venture capital industry development is that the withdrawal mechanism is not sound, and the withdrawal channel is not smooth. From the above international comparison, in establishing the venture capital withdrawal mechanism of China, we must refer to the foreign experience, in particular the America’s successful experience. However, the emerging of the venture capital must depend on the national situations and restraining conditions of China, so venture capital is also restrained and limited by such conditions. Therefore, we must establish the withdrawal mode suitable for China’s economic operation mechanism in exploration based on the current situations of China.
4.1 IPO 4.1.1 From the main-board market The main-board market with too high an assess threshold, has strict regulations on the listed companies in
history, scale, achievement, industry, etc., so that medium-sized and small-sized enterprises are difficult to meet the conditions. Therefore, the venture capital withdrawn through the main-board market is unlikely. The B-share market shall be an ideal withdrawal method for foreign investment. But because of the positioning, the B-share market has many defects and development obstacles. The biggest obstacle for the foreign investment to enter the domestic venture capital field is the openness of the financial market, RMB cannot be freely exchanged, and the exchange rate risk exists. Even if the foreign investment wants to enter the venture capital field, the issue of withdrawing also blocks the investment. In addition, the B-share market also has problems that the listed companies have small common cap, poor performance and high transaction expenses, and the information disclosure needs to be improved, the risks are high, etc., which affects the foreign investment to enter the venture capital field.
4.1.2 From the second-board market In the mentioned nine withdrawal methods, it is expected that the venture capital experts of China will
withdraw at most through the second-board market, which is the best method (up to 21%). In the country, many scholars also think we shall open up the second-board market. But I think it is not realistic for the current China to

Thinking on the withdrawal mechanism of venture capital in China
12
realize venture capital through the second-board market, that because: (1) The growth and development of the second-board market objectively depends on the conditions and the
environment of its growth and development, in particular, the standard degree of the securities market and the development degree of the hi-tech industry and venture capital.
First, from the development degree of the hi-tech industry and venture capital: The prosperity of America’s NASDAQ market mainly thanks to the highly developed IT industry and the perfect venture capital system. And currently, the conversion rate of scientific and technological achievements of China is low, and the hi-tech industry capital investment is low. Also, the venture capital system is very incomplete. According to the 1998 world’s international competitiveness evaluation, the market law supporting to the technical development and application research of China ranked the world’s No. 20, the new enterprise startup easiness ranked No. 28, the anti-monopoly competition policy evaluation ranked No. 36, the university and enterprise cooperation ranked No. 20, the scientific research achievement industrialization ranked No. 37, the new technology adoption and absorption ranked No. 46, and the intellectual property protection ranked No. 42. This relatively weak environment is clearly not good for the growth of the second board market. Second, from the standard degree of the securities market, the current main-board market of China has many problems, e.g., few institution investors, many medium-sized and small-sized investors, poor anti-risk capability, low transparency of the securities market, low standard degree of the listed companies, severe speculation, frequent illegal activities and immature regulation means. A basic open, fair and just environment has not been formed, and the legal right and interest of the medium-sized and small-sized investors are not protected. Under such circumstance, to open up the second-board market will add the difficulty in market regulation and the risks of the investors. Again, it still remains to be studied that the single second-board market is reasonable or not in structure. The scale of a single growth enterprise market may be not enough. America’s NASDAQ market also consists of the national market, small-sized capital market and over-the-counter market. Therefore, China’s venture capital system, capital market and hi-tech industry have not been well developed, particularly the securities market is not standard enough, and so rushing to open up the second-board market will bring high risks.
(2) The second-board market of China cannot be developed overnight. Even if in America, from 1946 when ARD was established, to 1971 when NASDAQ was formally opened, 25 years was experienced. The discussion about the second-board market of China has been lasted for long. The second-board market was almost certain, but until now, it has not been opened up which also proves that the conditions for its open-up have not been fully mature.
(3) Even if the second-board market is opened up, its way to become mature still needs quite a long time. In a short time, the market capacity and the expanded scale won’t be too large, which absolutely cannot fully meet the listing requirements of many venture capital enterprises.
(4) On the overseas second-board market, after years of brilliance, America’s NASDAQ market becomes more and more unstable. All main securities markets of Europe ever set up the second-board market based on the main-board market in the 1980s, but failed one by one; Japan, Korea and Hong Kong also put forward the second-board market, but the effect was not very ideal. This issue is worth our serious consideration. Moreover, the Mainland of China is still in a far distance from such countries or areas with very developed market economy.
Therefore, it is unlikely to withdraw the venture capital through the second-board market in the current stage. I am not denying the role of the second-board market, but only think to establish the second-board market of China after standardizing the operation mode of the main-board market and establishing quite reasonable and
Thinking on the withdrawal mechanism of venture capital in China
13
mature legal system, so that the venture capital can be withdrawn through the listing and issuance of the second-board market. After all, as an effective venture capital withdrawal method, the second-board market has its irreplaceable advantages. Vice Chairman CHENG Si-wei of China pointed out at the “2001 China (Hunan) Hi-tech Industry Development and Venture Capital International Forum” that, now the establishment of the growth enterprise market still has the problems of legislation and legal procedures as well as risk prevention and establish timing. So it still needs a period of time to establish the independent second-board market. That’s the analysis based on the basic conditions of China.
Nevertheless, IPO, such an internationally recognized gold withdrawal method, is not bad in the current realistic conditions of China, and can be changed indirectly according to the realistic situations.
4.1.3 Utilize the “shell” resource In view of the above analysis, the venture capital investors can make some modifications to IPO and gain
profit with the “shell resources”, and I think that is quite a practical venture capital withdrawal method currently. 14% experts select RTO. The venture capital investors can obtain the control right and dominating right to some “shell” listed companies in advance. Once the enterprises which receive the venture capital become mature, they can inject or transfer the invested venture capital or more capital into the “shell” listed companies, so as to complete the return and appreciation of venture capital, i.e., RTO. This method is currently quite common, and the main listing and financing method adopted by the domestic hi-tech venture enterprises in the domestic securities market, e.g., typical cases like the “Sichuan Changzheng” acquisition by “TOP software” and the “Acheng Iron and Steel” acquisition by “Clever”. In addition, many hi-tech enterprises obtain the shares of the listed companies by exchanging equity with them or directly injecting assets and programs to them to get their shares, so as to realize backdoor listing, and realize the capital realization and value adding by reorganizing the listed companies, operating the second-board market, increasing shares and financing. Such approach can be a choice for the realization and the withdrawal of the venture capital in the status quo that China’s current “shell” resources are relatively lacked. Even in the future, when China has its own second-board market, the listed resources will be not possible to be fully released in a short time, so that the “shell resources” will still have their own value of existing. In addition, this approach also saves many complicated procedures for listing application and the corresponding cost.
4.1.4 Overseas listing We can select the overseas venture capital withdrawal channel, i.e., to be listed in the overseas growth
enterprise market. For venture capital, what is important is to effectively withdraw the capital, and that withdrawal market is not important. In addition, many foreign markets hold an active and welcoming attitude to the listing of the companies of other countries. The venture capital of China can be directly listed in NASDAQ, Vancouver growth enterprise market and Hong Kong growth enterprise market, or shell listed in the overseas market. The venture capital of Israel and some European countries is always withdrawn with the America’s NASDAQ market. Now China have very few enterprises which meet the U.S. NASDAQ listing requirements, but we can fully make some of the growth enterprise market of some countries and areas around, e.g., the withdrawal of the venture capital in the growth enterprise markets in Singapore, Korea, Hong Kong, etc.
4.2 Sale A total of 38% experts select enterprise acquisition and merger, repurchasing and the second phase of
acquisition, i.e., the sale method, and the total number exceeds the proportion of selecting to withdraw through the second-board market. That well fits the America’s actual situations. But the author believes that although it has

Thinking on the withdrawal mechanism of venture capital in China
14
many advantages, the execution of the sale method in China still has a lot of obstacles, because: (1) The property right of the venture enterprises is unclear. In the property right trading market, what the
venture enterprises are selling is mainly their equity. So the property right problem must be solved if we want to withdraw the venture capital through the sale of the enterprises. In China, many hi-tech enterprises grow out of universities, research institutes or traditional enterprises, and their property right relation with the original units is vague, even for typical venture enterprises. For lacking appropriate legal and social bases, they can only be forced to apply the traditional mode of classifying enterprises implemented in the planned economy period, i.e., determine the types of the enterprises by the administrative relation and the nature of ownership, but cannot determine the right and obligations between the entrepreneurs and between the entrepreneurs and the investors with contract based on laws, so that the property right of them is unclear just like many SMEs. That is the root cause for the existence of the property right problem of the venture enterprises.
(2) The property right evaluation agencies and property right trading market are undeveloped. The enterprise property right trading of China is mainly completed in local securities trading markets. Such local securities markets are established by all local governments, and the original intention of the establishment is to substitute the functions of the governments, make an inventory of assets based on the markets and promote the economic structural adjustment. But because the operation of the property right trading agencies neither has any legal basis nor has any experience for reference, so that the development of the property right trading agencies is in a stagnant state, and have many problems, e.g., the property right trading is not marketized, and usually the property right sellers register and list in the property right trading agencies, and non-transferees or transferees seldom. Most property right trading agencies belong to different local administrative departments, and encounter strong resistance from other administrative departments in actual property right trading. Always, they promote the establishment of agreements of both parties with the help of the administrative power, and the management has low quality, most trading agencies are government officers or will become government officers without market pressure and innovation initiative. With regard to this, the government issued the “Notice on Clearing up and Rectifying the OTC Illegal Stock Market by Securities Regulatory Commission Forwarded by General Office of the State Council” in April 1998, and ordered to close the regional property right trading markets in principle. Under such circumstance, many SMEs can no longer carry out property right trading, so the approach for the venture enterprises to try to sell their equity through the property right trading markets, and withdraw is also cut off.
(3) The laws are incomplete. Now there is no law special for regulating the venture capital, and the Company Law and Securities Law related to the venture capital also have some clauses not good for establishing the venture capital system. For example, according to Articles 22 and Articles 35 of the Company Law, shareholders of limited liability companies must not freely transfer the contribution, which blocks the withdrawal of the venture capital. According to Article 147 of the Company Law, the initiators who hold the shares of the holding limited companies must not transfer their shares within three years from the establishment date of the company, which also blocks the venture capital withdrawal. According to Article 149 of the Company Law, the company must not repurchase its stocks, which resists the management repurchasing approach withdrawal. And the regulation in the Securities Law that the legal person shares cannot be circulated is also a realistic obstacle.
Therefore, we shall vigorously promote the sale approach, establish enterprises with clear property right in strict compliance with the requirements of the modern enterprise system at the very beginning of the establishment of the venture enterprises, to prevent problems brought by unclear property right from the very

Thinking on the withdrawal mechanism of venture capital in China
15
beginning on the one hand, and improve the enterprise property right trading market and establish the property right evaluation agencies on the other hand. To close the regional equity trading markets is not the best choice, and we shall establish and gradually open the national equity trading market for the SME financing service after clearing up and rectifying them, develop their most strong points, and remove the adverse impact. Meanwhile, it is necessary to establish the Venture Capital Law as soon as possible, and amend some existing laws.
4.3 Utilize the OTC market The author believes another feasible withdrawal approach is to establish the OTC market, and 10% experts
also make such a choice. OTC is the initial state of the development of the capital market. Before establishing a centralized securities exchange, the property right trading of most enterprises is realized by OTC. The OTC has the advantages that it is very flexible, has not listing standard, does not need strict trading regulation, provides an exchange and information communication channel for the investors and the venture enterprises, promotes the venture capital to replace industrial capital, and can effectively prevent financial risks because of its small scale. Therefore, now most securities exchanges of all countries keep such trading approach. The biggest problem of the OTC is that it cannot form a unified price, the traders look for quite high price and have quite high negotiation cost, and the market efficiency is far lower than that of the trading in the exchanges.
Looking at the current market conditions in China, there is nearly no any OTC market. Even if the scale is quite small and very irregular, it is still a property right trading approach quite suitable for the development status of China’s venture capital. We can consider to setting up the OTC of the venture capital programs and the venture capital enterprises within a certain range, as the piloting of a transitional period. We can use 26 securities trading centers (including automatic quotation system) of China to carry out non-public listing, so that the stocks of some venture capital enterprises are liquid. That can not only withdraw partial venture capital, but also prepare for the establishment of the second-board market in the future. To list the stocks of the venture capital enterprises trained in the OTC market can reduce the risks for such enterprises to be directly listed in the second-board market.
Now China is establishing similar property right trading centers. Trough the trading centers, the investors can fully or partially purchase the property right or the equity of the venture enterprises, to obtain their ownership or the status of the shareholders, and the venture enterprises get capital to develop their new technologies. Early in May 2000, Beijing put forward Zhongguancun Technology Exchange Center. The functions of the center are to provide technologies, capital and the information of the supplier and the buyer, release the government procurement and scientific and technological tendering information, and carry out technology and property right trading. The center is a market platform which offers information service for the connection of technology holders and capital holders, so as to create a channel for the venture capital through the property right trading of hi-tech enterprises.
4.4 Bankruptcy liquidation fully In addition, I notice that, among the researched 90 venture capital experts, no one choose to withdraw the
investment through bankruptcy liquidation. Of course, no one is willing to go bankrupt. But the basic characteristics of the venture capital are high risk and high return. High return is for overall and individual programs, and high risk means the investment failures of most programs. According to the statistics, about 20% to 30% of America’s venture capital programs are totally failed 60% experience varying degrees of frustration, and only 5% to 10% programs are successful (FAN, SHEN & CHEN, 1999). Failed programs and some frustrated programs can only withdraw the venture capital through liquidation. It shows that the time for the venture capital companies of China to engage in the venture capital business is very short, and the experts lack of knowledge of the characteristics of the “high risk” of the venture capital. Furthermore, China lacks correspondingly laws and
Thinking on the withdrawal mechanism of venture capital in China
16
regulations on the liquidation bankruptcy of the venture enterprises, and the bankruptcy procedures of other enterprises applicable to the Civil Procedure Law are obviously not conductive to the development of the venture capital industry. Without venture capital, the industrialization of scientific and technological achievements and the development of medium-sized and small-sized venture enterprises are difficult. And without a sound and complete withdrawal channel, the venture capital is not promising. We can refer to the foreign advanced experience and select the venture capital withdrawal approach, just after analyzing the domestic system, legal and human environments. Currently, China’s capital market, property right trading market, venture capital system, legal and system conditions are not complete, so some venture capital withdrawal approaches which are quite successfully adopted abroad are difficult to be achieved in China for the time being. Therefore, to establish a sound venture capital withdrawal mechanism of China cannot be completed overnight, but we must not rush.
Therefore, I think in such a special transition period, we can take some expedient measures to promote the development of the venture capital industry of China. The most feasible way is to first use the withdrawal approaches like “shell” resources, OTC and overseas listing, so that the venture capital industry will not remain stagnant because of the lack of the withdrawal mechanism. Meanwhile, we must see the defects and gaps of the internal operation mechanism of venture capital of China and the external environment, and keep creating conditions in talent, science and technology, social economy, laws, etc., gradually remove the obstacles, and promote the improvement of the withdrawal mechanism, for example, provide more relaxed and feasible legal, financial and accounting, tax and other policy environments, attract capital from many approaches and aspects and enter the venture capital market, establish the capital organization form meeting the legal and investment habits, improve the agency service institution system, including industry self-regulatory organizations, scientific and technological program evaluation agencies, technology brokerage agencies, venture capital consulting bodies, legal and accounting service agencies, etc., train adventurous innovation spirit, honest business credit environment and the human environment respecting personal value, right and interest. Once the conditions in all respects are mature, we shall lose no time in establishing the multi-level and multi-channel venture capital withdrawal mechanism, e.g., open up the second-board market, so that the venture capital can gain investment profit through wider and smoother approaches, and realize the joint development with the capital market and science and technology.
5. Conclusion
In summary, venture capital is an investment method which is popular worldwide. By analyzing the whole operation process of venture capital, we are clear that, the key for the venture capital to produce circulatory profit is the withdrawal mechanism of venture capital. Therefore, the venture withdrawal mechanism has a very important significance. Successful withdrawal not only means high return, but also is the basis for a new round of venture capital. In establishing the venture capital withdrawal mechanism of China, we must refer to the foreign experience, in particular the America’s successful experience. The main experience for America to be succeeded in venture capital lies in that its developed multi-level capital market and property market provide a multi-channel withdrawal method. America’s withdrawal methods are classified into three types, i.e., public listing, sale and asset liquidation.
While referring to the foreign experience, we must establish the withdrawal mode relying on the national situations and restraining conditions of China and change it indirectly according to the realistic situations, i.e., IPO, such an internationally recognized gold withdrawal method, from the main-board market, the main-board market has too high an assess threshold. From the second-board market, the author believes that it is not realistic for the
Thinking on the withdrawal mechanism of venture capital in China
17
current China to realize venture capital through the second-board market. Nevertheless, IPO is not bad in the current realistic conditions of China, i.e., utilize the “shell” resource and overseas listing etc. Moreover, the sale method has many advantages, and the execution of the sale method in China still has a lot of obstacles. Now China is establishing similar property right trading centers. Through the trading centers, the investors can fully or partially purchase the property right or the equity of the venture enterprises, to obtain their ownership or the status of the shareholders, and the venture enterprises get capital to develop their new technologies. In addition, bankruptcy liquidation, China lacks correspondingly laws and regulations on the liquidation bankruptcy of the venture enterprises, and the bankruptcy procedures of other enterprises applicable to the Civil Procedure Law are obviously not conductive to the development of the venture capital industry.
So, some venture capital withdrawal approaches which are quite successfully adopted abroad are difficult to be achieved in China for the time being. So, in such a special transition period, we can take some expedient measures to promote the development of the venture capital industry of China. The most feasible way is to first use the withdrawal approaches like “shell” resources, OTC and overseas listing etc. Once the conditions in all respects are mature, there will be no time left in establishing the multi-level and multi-channel venture capital withdrawal mechanism, and realizing the joint development with the capital market and science and technology.
References: CHENG, S. W.. (1999). Actively and steadily promote China’s venture capital career. Management World, 1. CHENG, S. W., et al. (2000). Venture capital in China (1st ed.). Beijing: National Press. FAN, B., SHEN, R. F. & CHEN, D. M.. (2009). Research on China venture capital withdrawal mechanism and related legal system.
Retrieved September 15, 2009 from http://www.drcnet.com.cn/DRCNET.Channel.Web/. LIU, S. B.. (1999). Venture capital (1st ed.). Guangzhou: Guangdong Economic Press. WANG, J. B.. (2008). Survey shows: Non-governmental fund accounts for a larger part in venture capital. Retrieved July 3, 2008
from http://www.drcnet.com.cn/DRCNET.Channel.Web/.
(Edited by Ruby and Chris)
(continued from Page 28)
Saunders, J. & Wong, V.. (1985). In search of excellence in the U.K. Journal of Marketing Management, 1 (Winter), 119-137. Schlegmilch, B. B., Boyle, K. M . & Therivel, S.. (1985). Marketing research in medium sized engineering companies in Britain and
the United States—Some preliminary findings. Edinburgh University, Working paper series No. 85/16. Shaw, V.. (1995). Successful marketing strategies: A study of British and German companies in the machine tool industry. Industrial
Marketing Management, 24(4), 329-339. Siu, W. S.. (2000). Marketing and company performance of Chinese small firms in Hong Kong. Marketing Intelligence & Planning
18(5), 292-230. Siu, W. S., Fang, W. & Lin, T.. (2004). Strategic marketing practices and the performance of Chinese small and medium-sized
enterprises (SMEs) in Taiwan. Entrepreneurship & Regional Development, 16(2), 161-178. Siu, W. S. & Liu, Z.. (2005). Marketing in Chinese small and medium enterprises (SMEs): The state of the art in a Chinese socialist
economy. Small Business Economics, 25, 333-346. Thomas, M. J.. (2002). Editorial. Marketing Intelligence & Planning, 20(7), 393. Walker, O. C., Mullins, J. W., Boyd, H. W. & Larréché, J. C.. (2006). Marketing strategy. New York: McGraw-Hill Irwin. Wang, X. & Yin, P.. (2005, November 11). More efforts needed for firms to go global. China Daily, (7). Zhao, X. S., Tong, C. S. P. & Qiao, J.. (2002). China’s WTO accession, state enterprise reform, and spatial economic restructuring.
Journal of International Development, 14(4), 413-433.
(Edited by Ruby and Chris)
June 2010, Volume 9, No.6 (Serial No.84) Chinese Business Review, ISSN 1537-1506, USA
18
The adoption of strategic marketing practices: A comparison between New
Zealand and Chinese manufacturers
Roger Brooksbank, Ron Garland, David Taylor, Patrycia Babis (Department of Marketing, Waikato Management School, University of Waikato, Hamilton 3240, New Zealand)
Abstract: This article compares the extent to which ten basic “textbook” strategic marketing practices are being used among manufacturing firms in New Zealand and China. Data was collected via questionnaire and a total of 145 and 89 usable responses were received from firms employing more than 50 people in each country respectively. The results indicate that many of the basic strategic marketing practices which are typically advocated in the mainstream academic literature have been similarly and quite widely adopted by manufacturers in both countries. However, the results also suggest that, albeit in different areas, there is still scope for manufacturers in both New Zealand and China to embrace strategic marketing more fully.
Key words: strategic marketing; manufacturers; New Zealand; China
1. Introduction
Over recent decades, an appreciation of marketing’s contribution to a firm’s competitive success has undergone a sea-change. No longer is its role seen as being restricted to a set of tactical, essentially short-term activities associated with the various elements of the marketing mix such as undertaking promotional campaigns, making sales or providing an after sales service. On the contrary, marketing has now become firmly established as an important and necessary strategic level activity concerned with decisions about which markets to target, how best to deploy the firm’s resources and capabilities to build superior customer value and how the firm can position itself for competitive advantage over the longer-term (Hooley, Piercy & Nicoulaud, 2008). In short, the term “strategic marketing” has gone into the vernacular. It has become synonymous with an on-going, company wide and customer-led planning approach that enables the firm to successfully adapt to, and take advantage of, the fast changing and increasingly volatile modern business environment.
Interest in strategic marketing reached its peak in the early-mid 1980s when there was also an explosion of prescriptive and research-based manuals, textbooks and articles on the subject (Romano & Ratnatunga, 1995; Brooksbank, Kirby, Taylor & Jones-Evans, 1999), creating a momentum that has seen it continue onwards into the new millennium as an ever-evolving topic that still attracts a good deal of scholarly attention. Indeed, over the years numerous “success” studies from around the world have, in one way or another, illuminated our
Roger Brooksbank, Ph.D., associate professor of marketing, Department of Marketing, Waikato Management School, University
of Waikato; research field: strategic marketing. Ron Garland, Ph.D., associate professor of marketing, Department of Marketing, Waikato Management School, University of
Waikato; research field: services marketing. David Taylor, Master, honorary fellow, Department of Marketing, Waikato Management School, University of Waikato; research
field: marketing competitiveness. Patrycia Babis, Master, research assistant, Department of Marketing, Waikato Management School, University of Waikato;
research field: business effectiveness.
The adoption of strategic marketing practices: A comparison between New Zealand and Chinese manufacturers
19
understanding of marketing’s contribution to firm performance as a strategic discipline. Although this body of work includes research studies that examine different types and sizes of firms operating in different markets/countries at different points in time, and in different ways, they all, nonetheless, share the same basic aim— “to profile the marketing practices of successful firms, and compare them against those of less successful firms in order to offer insights to researchers and managers into ways of improving firm performance” (Gray, Matear, Deans & Garrett, 2007, p.72). One substantive point of difference, however, relates to the perspective on the topic at hand. In fact in this respect, it is useful to view this body of work as being largely made up of two separate sub-categories of “research genre”, both of which have been running in parallel with one another since the 1980s. The first and more prominent of these can be referred to as the “market orientation” genre (see for example, Peters & Waterman, 1982; Narver & Slater, 1990; Jaworski & Kohli, 1993; Deng & Dart, 1994; Gray, Matear, Boshoff & Matheson, 1998; Matear, Osborne, Garrett & Gray, 2002). In essence, this research genre seeks to identify and understand all those activities that combine to enable a firm to be market-driven, as well as the degree to which this orientation differentiates the high performers. To this extent, the practice of strategic marketing is implicit rather than explicit within the overall approach, adopting what might be called a “holistic” perspective on the topic. Furthermore, research within this genre is often inductive in nature and it thereby serves to inform us about how marketing as a strategic discipline is evolving and what is new. The second, smaller, research genre within the marketing “success” literature can be referred to as the “strategic marketing practices” genre (see for example, Hooley, West & Lynch, 1985; Doyle, Saunders & Wong, 1985; Brooksbank, Kirby & Wright, 1992; Brooksbank, Kirby, Taylor & Jones-Evans, 1999; Siu, Fang & Lin, 2004; Huan, Brooksbank, Taylor & Babis, 2008). In contrast to the “market-orientation” genre, this research tends to focus almost exclusively on assessing organizational decision-making as it relates to various aspects of the normative model of strategic marketing planning, i.e., situation analysis, objective-setting, strategy formulation and implementation, and control procedures. As such, this research adopts a perspective on the topic that is more explicit. Furthermore, research within the “strategic marketing practices” genre is often more deductive in nature—theorizing from existing knowledge (textbooks, articles, etc.) about what is successful strategic marketing practice and then setting out to validate it based on hypothesis testing and experimentation. Notably, Day and Montgomery (1999), Thomas (2002) and others have pointed to the importance of such research, arguing that some of the most fundamental questions that marketing academics should be continuously asking themselves relate to the extent to which managers actually practice what is taught by marketing educators, as well as the degree to which it actually has a positive influence on organizational performance.
Set within the context of the “strategic marketing practices” genre, an examination of the incidence of “textbook” strategic marketing practices in manufacturing firms operating in New Zealand and China can be viewed as an interesting research focus for a variety of reasons. With regard to New Zealand, although the manufacturing sector plays a significant role in the national economy, the topic of strategic marketing and the extent to which it is practiced in manufacturing firms has received relatively little attention by marketing academics. Research undertaken in New Zealand over recent years has investigated only service organizations (see for example, Matear, et al., 2002; Matear, Garrett & Gray, 2004). Moreover, it seems strategic marketing is currently a ‘hot topic’ in New Zealand marketing circles. Recent research has revealed that among New Zealand marketing practitioners—working at all levels and in all types and sizes of firms—strategic marketing is perceived as the first most essential area of marketing knowledge to possess (Gray, Ottesen, Bell, Chapman & Whiten, 2007). Meantime, with regard to China, since the launch of its Open Door Policy in 1979 aimed at attracting foreign

The adoption of strategic marketing practices: A comparison between New Zealand and Chinese manufacturers
20
investors and becoming a socialist market economy in which individual enterprises have greater autonomy, China has emerged as a new economic power in the global economy (Bayley & Boozman, 2005), with a manufacturing industry that already ranks 4th in the world (Yang & Yin, 2005). Yet, when compared with European and North American countries, relatively little is known about the extent to which strategic marketing is being practiced in China and until recently, it is generally believed that “Western World” strategic marketing is still only in its early stages of development (Zhao, Tong & Qiao, 2002; Ambler & Wang, 2003).
2. Objectives: Marketing practices
With these above observations in mind, this research aims to examine the adoption levels of “textbook” strategic marketing in New Zealand and China in order to:
Gauge the extent to which basic strategic marketing practices are being used among New Zealand and Chinese manufacturers respectively.
Compare and contrast the extent to which basic strategic marketing practices are being used among manufacturers in both countries.
To meet these twin fold objectives, ten specific strategic marketing practices were identified on the basis of a review of both the normative, and the empirical “success” literature from the mid 1980s onwards. In essence, the emphasis of the literature review was to identify those “evergreen” practices which have been most commonly prescribed or reported. For the purpose of presenting these practices, it is convenient to divide them into subsets relating to the key stages in the strategic marketing process, namely: the conducting of a strategic situation analysis, the development of marketing objectives, the formulation of a marketing strategy, and the use of strategic control procedures. Within this framework, the ten practices are as follows:
2.1 Practices relating to strategic situation analysis Practice 1 (P1): The use of formal marketing planning. Several prescriptive works (McDonald, 1999; Walker,
Mullins, Boyd & Larreche, 2006), along with the empirical findings of Saunders and Wong (1985), Hooley and Jobber (1986), Lysonski and Pecotich (1992), Putendran, Speed and Widing II (2003) and Huan, et al. (2008) all suggest the importance of formal marketing planning.
P2: The undertaking of a comprehensive situation analysis. Most of the prescriptive literature stresses the importance of conducting a thorough ‘situation analysis’ as the necessary basis for developing effective marketing strategies and plans (Aaker, 2004; Piercy, 2000). Similarly, marketing “success” researchers such as Modiano and Ni-Chionna (1986), Brooksbank, Kirby and Wright (1992) and Siu and Liu (2005) have provided strong support for the need to undertake a comprehensive situation analysis: an internal (company) analysis, competitor analysis, market analysis, customer analysis, and an analysis of the wider business environment.
P3: The adoption of a pro-active approach to the future. Research by Saunders and Wong (1985), Hooley and Jobber (1986), Lai, Huang, Hooley, Lynch and Yau (1992), Doyle and Wong (1998) and Huan, et al. (2008) found a more pro-active rather than reactive approach to the future to be an important feature of successful strategic marketing. Similarly, this perspective is commonly prescribed in the mainstream strategic marketing textbooks (see for example, Hooley, Piercy & Nicoulaud, 2008).
P4: The use of market research. Implicit within most textbooks and prescriptive writing is the notion that competitive success necessitates informed, marketing research—based decision making. Accordingly, research by Schlegmilch, Boyle and Therivel (1985), Baker, Hart and Black (1988), Joseph, Joseph, Poon and Brooksbank

The adoption of strategic marketing practices: A comparison between New Zealand and Chinese manufacturers
21
(2001) and Panayides (2004) has shown that higher performing companies make a greater use of market research in their planning activities.
2.2 Practices relating to marketing objectives P5: The setting of profit objectives that relate to a longer-term time horizon. Research by Doyle, Saunders
and Wong (1985), Hooley and Lynch (1985), Shaw (1995), Siu (2000), Baker and Leidecker (2001), and Siu and Liu (2005) has shown that successful strategic marketing necessitates the setting of longer-term strategic objectives (i.e., short-run profits are not sought at the expense of longer-run strategic objectives). Notably, virtually all the prescriptive strategic marketing literature emphasises an effective strategy as being concerned with longer-term time horizons.
P6: The setting of offensive objectives. Research by Hooley and Lynch (1985), McBurnie and Clutterbuck (1987), Lai, et al. (1992), Siu (2000), and Siu and Liu (2005) indicates that successful strategic marketing usually necessitates the setting of offensive objectives rather than those that reflect a more defensive competitive stance.
2.3 Practices relating to marketing strategy P7: The adoption of a strategic priority of raising volume. Research by Doyle, et al. (1985), along with
Hooley and Beracs (1997), Brooksbank, et al. (1999) and Huan, et al. (2008) has shown that effective strategic marketing accords a higher priority to raising volume rather than to securing productivity improvements.
P8: The use of an innovation approach. The prescriptive writing of Hamel and Prahalad (1991) and Cravens and Piercy (2009) suggest that in order to be successful over the longer-term, all firms should innovate. Additionally, research by Hooley and Lynch (1985), Berry (1996), Siu, Fang and Lin (2004) and Huan, et al. (2008) has identified innovation as one of the hallmarks of effective strategic marketing. These findings generally refer to both product innovation as well as the introduction of new ways of doing business.
P9: The adoption of a strategy based on value-to-the-customer rather than price. Along with most textbooks (for example, see Hooley, Piercey & Nicoulaud, 2008), studies by Hooley and Jobber (1986), Lai, et al. (1992), Hooley and Beracs (1997), Siu (2000) and Siu and Liu (2005), indicate that effective marketing necessitates a competitive approach based on providing superior value-to-the-customer, than just price alone.
2.4 Practices relating to marketing control P10: The use of marketing information systems. The need to monitor, evaluate and control the firm’s
strategic marketing effort is widely advocated in the prescriptive literature (Cravens & Piercy, 2009). In addition, research studies by Hooley and Jobber (1986), Boag (1990), Knuckey, Leung-Wai and Meskill (1999), Matear, et al. (2002) and Siu, Fang and Lin (2004), point to the importance of executing marketing control through making use of various types of marketing information and intelligence-gathering systems.
3. Methodology
The findings reported in this paper are based on separate questionnaire surveys conducted in New Zealand and China. The questionnaire was originally developed for a similar study designed to assess the marketing practices of UK companies in 1987 and 1992 (for a full discussion see Brooksbank, Kirby & Wright, 1992). It was then updated, so that it would be suitable for the purposes of conducting the surveys reported in this paper. In New Zealand, the questionnaire was mailed to a list of 5,808 businesses with more than 20 employees, drawn from a commercial database. The target recipient was the managing director and this person was addressed by name. Of the questionnaires dispatched in late 2007, a total of 337 were returned by NZ post as undeliverable, and 789 fully

The adoption of strategic marketing practices: A comparison between New Zealand and Chinese manufacturers
22
completed questionnaires were received. Thus, the effective mail out was to 5,471 companies, yielding an effective response rate of 14.4%. A subset of 145 self reported “manufacturing” firms with 50 or more employees was subsequently identified. At the 95% confidence level, this sample (N=145) has a maximum margin for error of plus or minus 8.1 percentage points. For the survey conducted in China, the same questionnaire was put into a web-based format and in order to offer respondents a language choice, it was then translated into Chinese. To ensure that the questionnaire would be entirely meaningful to target recipients, a process of back translation was employed (Bernard, 1995), involving a number of Chinese bilingual management students. Differences in interpretations were then re-translated until a reasonable level of equivalency was eventually reached. Finally, the Chinese version of the questionnaire was pilot tested with two New Zealand based Chinese business people to test for both literal understanding and the appropriateness of the questions in a cultural context. An invitation to participate was then emailed to a total of 1,475 Chinese manufacturing firms with over 50 employees. The companies were randomly selected from “Alibaba.com”—a website based business directory designed to provide information to potential foreign customers and investors. The email was addressed to “The Managing Director”. Of the invitations sent out in late 2005, a total of 89 completed questionnaires were received, representing a response rate of 6 per cent. At the 95% confidence level, this sample (N=89) has a maximum margin for error of plus or minus 10.7 percentage points. In view of the level of response, it was considered necessary to make some estimation of the study sample in terms of its representativeness of the larger population. For this purpose, an invitation to answer four selected questions from the questionnaire was emailed to the remaining 1,386 non-respondents on the original mailing list. Responses to these questions were subsequently received from 33 companies and when the profiles of these responses were compared with those of the study sample using a chi-square test, no statistical differences were found. Nevertheless, the extent to which the findings based on our sample can be extended to all Chinese manufacturers is unknown.
For both the New Zealand and China samples, responses given regarding the ten selected strategic marketing practices previously outlined were subsequently tested using cross-tabulation and Chi-square tests within SPSS. Chi-square tests are a widely used technique for examining the relationship between two categorical sets of variables.
3.1 Sample characteristics
Table 1 Sample characteristics: NZ v. China
NZ (2007)
China (2005)
Average number of full-time employees 371 1,547
Average number of full-time employees working in a marketing role 29 (= 8% of total)
65 (= 4% of total)
Average sales turnover in last financial year NZ$73m NZ$322m* Principal ownership NZ = 70% China = 70%
Note: * Translated from RMB into NZ$ for comparative purposes.
An exposition of the internal composition of both study samples is shown in Table 1. While all respondent companies in both countries reported that they had 50 or more employees and that their primary activity was manufacturing, Table 1 clearly illustrates a difference in average company size and scale in operations between the two samples. Given that New Zealand is a much smaller country it is not surprising that the average Chinese manufacturer is more than four times greater in size; both in terms of number of employees and sales turnover. It is interesting to note nonetheless, that the average New Zealand firm reported that the proportion of employees

The adoption of strategic marketing practices: A comparison between New Zealand and Chinese manufacturers
23
that work in a “marketing role” to be double that of their Chinese counterpart.
4. Findings
For the purposes of this study, it is convenient to present the ten practices and their hypotheses in subsets relating to key stages in the strategic marketing process. Thus, the research findings are presented accordingly.
4.1 Strategic situation analysis (Practices 1-Practices 4) In order to examine the use of formal marketing planning (P1), respondents were asked in the questionnaire
whether their marketing planning was annual or longer-term, limited to annual budgeting, or restricted to little or no formal planning at all. The findings are presented in Table 2, which reveal that more than half of all respondents in New Zealand and China (75% and 55% respectively) reported that they undertake annual and longer-term marketing planning. However, as Table 2 also shows, there is a significant difference (at the 1% level) in the overall pattern of response between the two samples, indicating a greater appreciation of the importance of doing formal marketing planning among New Zealand firms. For the purpose of examining the extent to which firms conduct a comprehensive situation analysis (P2), in the questionnaire respondents were asked to report the degree of importance their company attached to carrying out five types of situation analysis: (1) internal company, (2) competitor, (3) market, (4) customer, (5) wider business environment. When the responses across the five types of situation analysis are summarized (see Table 2), it can be seen that there is little difference between the profiles of response between the two countries, with more than three quarters of all respondents in New Zealand and China (83% and 75% respectively) viewing a comprehensive situation analysis as being important. It should be noted that nonetheless that due to the nature of the research instrument employed, the level of detail with analyses which are actually carried out remains unknown.
Table 2 Strategic situation analyses: NZ v. China
NZ
(n = 145) China
(n = 84) Chi-square df p
Extent of formal planning (P1) f % f % Annual/longer term marketing planning 108 75 46 55 Annual budgeting only/little or no marketing
planning 37 25 38 45 9.13 1 <0.001
Importance attached to undertaking a comprehensive situation analysis (P2) f % f %
Average/high importance 120 83 63 75 Low importance 25 17 21 25
1.87 1 <0.150
Approach to the future (P3) f % f % Forecast/project the future & plan accordingly 36 25 52 63 Monitor/react to events & adapt our plans to match 109 75 32 37
29.58 1 <0.001
Use of self-generated market research (P4) f % f % Often/sometimes 130 90 76 90 Seldom/never 15 10 8 10
0 1 1.000
Use of commissioned market research (P4) f % f % Often/sometimes 68 47 47 56 Seldom/never 77 53 37 44
1.51 1 <0.250
With regard to the adoption of a pro-active approach to the future (P3), Table 2 reveals a statistically significant difference between the two samples (at the 1% level), with the Chinese manufacturers being more
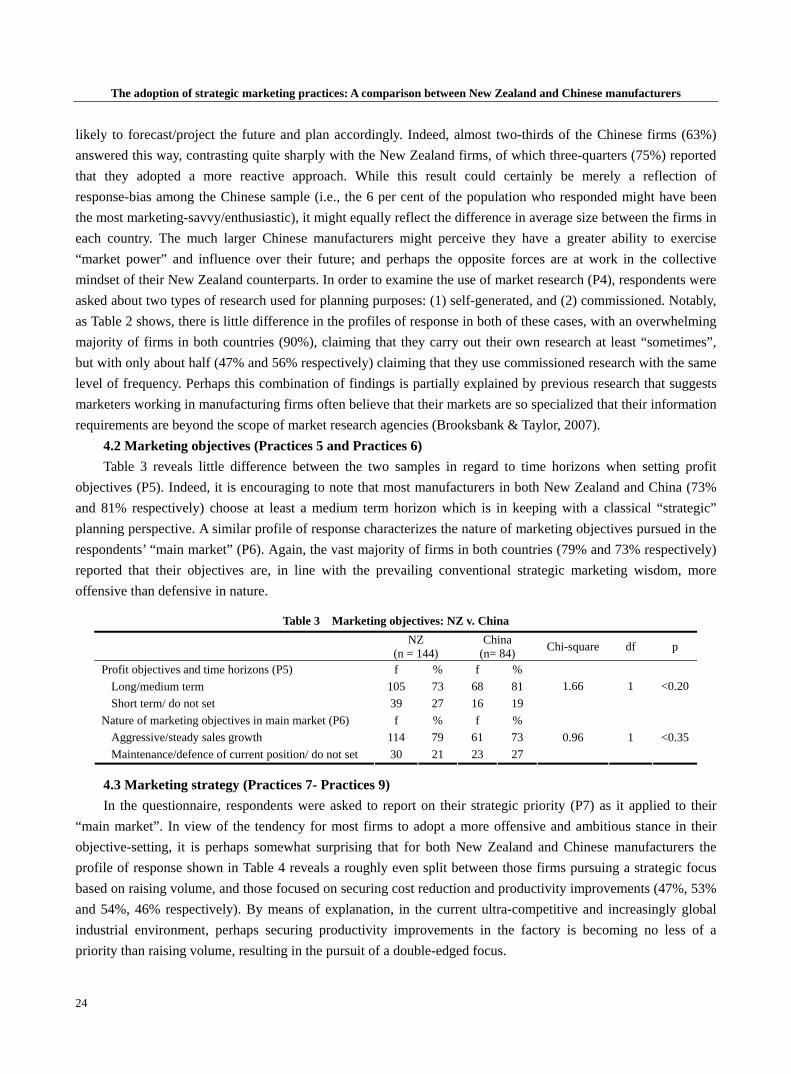
The adoption of strategic marketing practices: A comparison between New Zealand and Chinese manufacturers
24
likely to forecast/project the future and plan accordingly. Indeed, almost two-thirds of the Chinese firms (63%) answered this way, contrasting quite sharply with the New Zealand firms, of which three-quarters (75%) reported that they adopted a more reactive approach. While this result could certainly be merely a reflection of response-bias among the Chinese sample (i.e., the 6 per cent of the population who responded might have been the most marketing-savvy/enthusiastic), it might equally reflect the difference in average size between the firms in each country. The much larger Chinese manufacturers might perceive they have a greater ability to exercise “market power” and influence over their future; and perhaps the opposite forces are at work in the collective mindset of their New Zealand counterparts. In order to examine the use of market research (P4), respondents were asked about two types of research used for planning purposes: (1) self-generated, and (2) commissioned. Notably, as Table 2 shows, there is little difference in the profiles of response in both of these cases, with an overwhelming majority of firms in both countries (90%), claiming that they carry out their own research at least “sometimes”, but with only about half (47% and 56% respectively) claiming that they use commissioned research with the same level of frequency. Perhaps this combination of findings is partially explained by previous research that suggests marketers working in manufacturing firms often believe that their markets are so specialized that their information requirements are beyond the scope of market research agencies (Brooksbank & Taylor, 2007).
4.2 Marketing objectives (Practices 5 and Practices 6) Table 3 reveals little difference between the two samples in regard to time horizons when setting profit
objectives (P5). Indeed, it is encouraging to note that most manufacturers in both New Zealand and China (73% and 81% respectively) choose at least a medium term horizon which is in keeping with a classical “strategic” planning perspective. A similar profile of response characterizes the nature of marketing objectives pursued in the respondents’ “main market” (P6). Again, the vast majority of firms in both countries (79% and 73% respectively) reported that their objectives are, in line with the prevailing conventional strategic marketing wisdom, more offensive than defensive in nature.
Table 3 Marketing objectives: NZ v. China
NZ
(n = 144) China
(n= 84) Chi-square df p
Profit objectives and time horizons (P5) f % f % Long/medium term 105 73 68 81 Short term/ do not set 39 27 16 19
1.66 1 <0.20
Nature of marketing objectives in main market (P6) f % f % Aggressive/steady sales growth 114 79 61 73 Maintenance/defence of current position/ do not set 30 21 23 27
0.96 1 <0.35
4.3 Marketing strategy (Practices 7- Practices 9) In the questionnaire, respondents were asked to report on their strategic priority (P7) as it applied to their
“main market”. In view of the tendency for most firms to adopt a more offensive and ambitious stance in their objective-setting, it is perhaps somewhat surprising that for both New Zealand and Chinese manufacturers the profile of response shown in Table 4 reveals a roughly even split between those firms pursuing a strategic focus based on raising volume, and those focused on securing cost reduction and productivity improvements (47%, 53% and 54%, 46% respectively). By means of explanation, in the current ultra-competitive and increasingly global industrial environment, perhaps securing productivity improvements in the factory is becoming no less of a priority than raising volume, resulting in the pursuit of a double-edged focus.

The adoption of strategic marketing practices: A comparison between New Zealand and Chinese manufacturers
25
For the purposes of examining the extent to which firms in both countries embrace the practice of innovation (P8), survey respondents were asked about two types of innovation: (1) their approach to developing and marketing new products, and (2) their approach to developing and introducing new ways of doing business. Interestingly, the results shown in Table 4 reveal a statistically significant difference in the profile of response between the two samples (at the 1% level) indicating that the New Zealand manufacturers are more likely to develop and market new products ahead of the competition and as well, introduce new ways of doing business. Indeed, an overwhelming proportion (88% and 70% respectively) answered this way, suggesting that the national trait that typifies New Zealanders in the global psyche, i.e., their “number 8 wire” mentality—alive and well within its manufacturing sector! Indeed, just as the mother of necessity gave rise to this quintessentially “Kiwi” trait (New Zealand is a tiny Pacific Island on the edge of the world, where improvisation, ingenuity and a “make do” style of creativity have always been a necessity), then perhaps a corresponding, competitive imperative, similarly explains this combination of findings: New Zealand manufacturers cannot compete with their larger-scale Chinese rivals with “me-too” offerings, so instead are forced to compete by offering innovative new products, in innovative new ways.
In order to examine the adoption of a competitive approach based on providing value-to-the-customer, in the questionnaire respondents were asked to indicate how their firm’s offerings in their main market compared with those of their major competitors. As Table 4 reveals, in this respect, a statistically significant difference emerged between the activities of firms in the two countries (at the 1% level) indicating that the Chinese manufacturers are more likely to compete on the basis of value-to-the-customer than are their New Zealand counterparts. Nevertheless, in absolute terms, it seems that not even the Chinese manufacturers are particularly focused on delivering superior customer value since a large proportion of them (44%) reported that they compete on some other (unknown) basis.
Table 4 Marketing strategy: NZ v. China
NZ
(n = 145) China
(n = 82) Chi-square df p
Strategy priority in main market (P7) f % f % Expanding total market/increasing sales 68 47 42 54 Focusing on cost reduction & productivity
improvement 77 53 40 46 1.83 1 <0.18
Approach to developing new products (P8) f % f % Develop & market new products ahead of the
competition 127 88 57 70
Imitate the competition/do not do 18 12 25 30
9.97 1 <0.01
Approach to developing new ways of doing business (P8) f % f %
Lead the market in introducing new ways of doing business 101 70 33 40
Stick to traditional methods/imitate the competition 44 30 49 60
21.38 1 <0.001
Basis of competitive approach (P9) f % f % Superior product/service quality & performance
at same or higher price than competitors 33 23 46 56
Do not claim this position 112 77 36 44
24.27 1 <0.001
4.4 Marketing control (Practice 10) To investigate the use of marketing information systems (P10), in the questionnaire, respondents were asked
to report the extent to which their company used a system to monitor developments in four areas: (1) customer
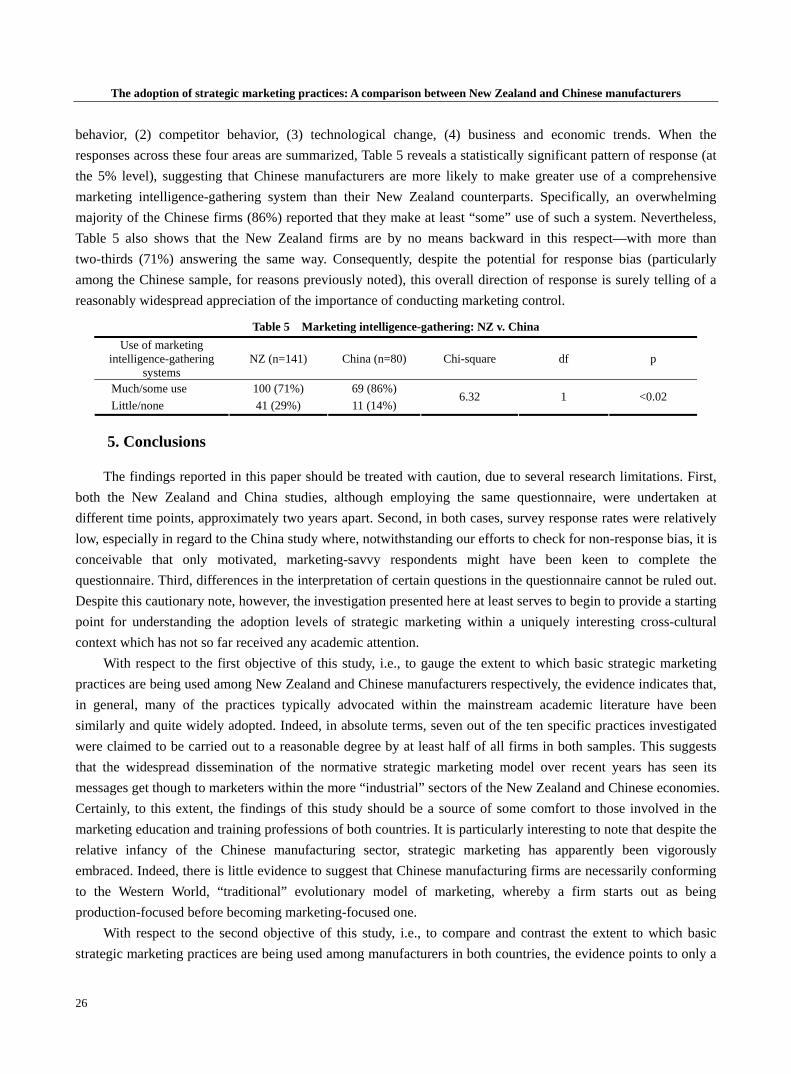
The adoption of strategic marketing practices: A comparison between New Zealand and Chinese manufacturers
26
behavior, (2) competitor behavior, (3) technological change, (4) business and economic trends. When the responses across these four areas are summarized, Table 5 reveals a statistically significant pattern of response (at the 5% level), suggesting that Chinese manufacturers are more likely to make greater use of a comprehensive marketing intelligence-gathering system than their New Zealand counterparts. Specifically, an overwhelming majority of the Chinese firms (86%) reported that they make at least “some” use of such a system. Nevertheless, Table 5 also shows that the New Zealand firms are by no means backward in this respect—with more than two-thirds (71%) answering the same way. Consequently, despite the potential for response bias (particularly among the Chinese sample, for reasons previously noted), this overall direction of response is surely telling of a reasonably widespread appreciation of the importance of conducting marketing control.
Table 5 Marketing intelligence-gathering: NZ v. China Use of marketing
intelligence-gathering systems
NZ (n=141) China (n=80) Chi-square df p
Much/some use 100 (71%) 69 (86%) Little/none 41 (29%) 11 (14%)
6.32 1 <0.02
5. Conclusions
The findings reported in this paper should be treated with caution, due to several research limitations. First, both the New Zealand and China studies, although employing the same questionnaire, were undertaken at different time points, approximately two years apart. Second, in both cases, survey response rates were relatively low, especially in regard to the China study where, notwithstanding our efforts to check for non-response bias, it is conceivable that only motivated, marketing-savvy respondents might have been keen to complete the questionnaire. Third, differences in the interpretation of certain questions in the questionnaire cannot be ruled out. Despite this cautionary note, however, the investigation presented here at least serves to begin to provide a starting point for understanding the adoption levels of strategic marketing within a uniquely interesting cross-cultural context which has not so far received any academic attention.
With respect to the first objective of this study, i.e., to gauge the extent to which basic strategic marketing practices are being used among New Zealand and Chinese manufacturers respectively, the evidence indicates that, in general, many of the practices typically advocated within the mainstream academic literature have been similarly and quite widely adopted. Indeed, in absolute terms, seven out of the ten specific practices investigated were claimed to be carried out to a reasonable degree by at least half of all firms in both samples. This suggests that the widespread dissemination of the normative strategic marketing model over recent years has seen its messages get though to marketers within the more “industrial” sectors of the New Zealand and Chinese economies. Certainly, to this extent, the findings of this study should be a source of some comfort to those involved in the marketing education and training professions of both countries. It is particularly interesting to note that despite the relative infancy of the Chinese manufacturing sector, strategic marketing has apparently been vigorously embraced. Indeed, there is little evidence to suggest that Chinese manufacturing firms are necessarily conforming to the Western World, “traditional” evolutionary model of marketing, whereby a firm starts out as being production-focused before becoming marketing-focused one.
With respect to the second objective of this study, i.e., to compare and contrast the extent to which basic strategic marketing practices are being used among manufacturers in both countries, the evidence points to only a
The adoption of strategic marketing practices: A comparison between New Zealand and Chinese manufacturers
27
few areas of difference. In fact, with regard to the following five practices, no statistically significant differences emerged: the undertaking of a comprehensive situation analysis; the use of market research; the setting of profit objectives that relate to a longer term time horizon; the setting of offensive objectives; and a strategic priority of raising volume. By contrast, however, the pattern of data regarding the use of formal marketing planning and frequent innovation indicates that statistically, the New Zealand manufacturers are likely to be doing more. Yet, with regard to the adoption of a proactive approach to the future and the use of marketing information systems, the data indicates that statistically, the Chinese manufacturers are likely to be doing more. To some extent at least, it is contended that these differences can be explained as much as by the size and scale of operations of the average responding firm in each country as by anything else. Certainly, smaller firms with fewer resources and less propensity to exercise “market power” might be expected to plan more conscientiously and strive to compete by offering something different. Conversely, larger firms might be expected to approach the future with greater confidence and a sense of control, and be inclined to spend more time, money and effort on intelligence-gathering, especially when competing with other larger manufacturers head-on.
It is interesting to note that there is one other remaining area of difference between the strategic marketing practices of manufacturing firms in the two countries that particularly stands out, and this is in regard to the firm’s choice of its competitive advantage. Since the cornerstone concept of modern strategic marketing is to deliver superior customer value (see for example, Hooley, Piercy & Nicouloud, 2008), it is somewhat ironic that of all the practices surveyed in this study, perhaps it is here where there is the most scope for improvement. Despite the fact that the Chinese manufacturers were found to be more likely to adopt this approach than their New Zealand counterparts, the data suggests that for many firms (44% and 77% respectively), and there is still much scope for becoming more customer-focused when choosing how to compete in the marketplace.
Looking to the future, this type of research could clearly be improved through seeking to gain higher response rates. Further, the survey could be usefully extended to include a wider range of strategic marketing practices and additional questions designed to uncover more information about the true nature of decision-making regarding the firms’ choice of competitive advantage. Above all, it would be interesting to incorporate measures of competitive performance, so that the profile of successful strategic marketing decision-making across varying sizes and types of manufacturers operating in different markets and cultures could be more fully examined.
References: Aaker, D. A.. (2004). Strategic market management (7th ed.). New York: Wiley. Ambler, T. & Wang, X.. (2003). Measures of marketing success: A comparison between China and the United Kingdom. Asia Pacific
Journal of Management, 20(2), 267-281. Ang, H. A. & Schmitt, B. H.. (1999). Introduction to special issue: Marketing in the Asia Pacific. Asia Pacific Journal of
Management, 16(12), 3-8. Baker, G. & Leidecker, J.. (2001). Does it pay to plan? Strategic planning and financial performance. Agribusiness, 17, 355-364. Baker, M. J., Hart, S. J. & Black, C. D.. (1988). The competitiveness of British industry: What really makes the difference? European
Journal of Marketing, 22(2), 70-85. Bamberger, P., Bacharach, S. & Dyer, L.. (1989). Human resource management and organizational effectiveness: High technological
entrepreneurial startup firms in Israel. Human Resource Management, 28(3), 349-436. Bayley, H. & Boozman, J.. (2005). An emerging China and the transatlantic economy. Retrieved March 10, 2006, from NATO
Parliamentary Assembly 2005 Annual Session, http://www.nato-pa.int/Default.asp?SHORTCUT=674. Bernard, H. R.. (1995). Research methods in anthropology-qualitative and quantitative approaches. London: AltaMira Press. Berry, M.. (1996). Technical entrepreneurship, strategic awareness and corporate transformation in small high-tech firms,
Technovation, 16(9), 187-198. Boag, B.. (1990). Winners and losers—The crucial differences. Industrial Marketing Digest, 15, 19-26. Brooksbank, R., Kirby, D. A. & Wright, G.. (1992). Marketing and company performance: An examination of medium sized
manufacturing firms in Britain. Small Business Economics, 4(3), 221-236.

The adoption of strategic marketing practices: A comparison between New Zealand and Chinese manufacturers
28
Brooksbank, R. & Taylor, D.. (2002). The adoption of strategic marketing and its contribution to the competitive success of New Zealand companies. Marketing Intelligence and Planning, 20(7), 452-461.
Brooksbank, R. & Taylor, D.. (2007). Strategic marketing in action: A comparison of higher and lower performing manufacturing firms in the UK, Marketing Intelligence and Planning, 25(1), 31-44.
Brooksbank, R., Kirby, D. A., Taylor, D. & Jones-Evans, D.. (1999). Marketing in medium sized manufacturing firms. European Journal of Marketing, 33(1-2), 103-120.
Cravens, D. & Piercy, N.. (2009). Strategic marketing (9th ed.). New York: McGraw Hill. Day, G. S. & Montgomery, D. B.. (1999). Charting new directions for marketing. Journal of Marketing, 63, 3-13. Deng, S. & Dart, J.. (1994). Measuring market orientation: A multi-item approach. Journal of Marketing Management, 10, 725-742. Dess, G. G. & Robinson Jr, R. B.. (1984). Measuring organizational performance in the absence of objective measures: The case of
privately held firms and conglomerate business units. Strategic Management Journal, 5, 265-273. Doyle, P., Saunders, J. & Wong, V.. (1985). A comparative investigation of Japanese marketing strategies in the British market.
Report to the Economic and Scientific Research Council, Ref: F20023203, January. Doyle, P. & Wong, V.. (1998). Marketing and competitive performance: An empirical study. European Journal of Marketing, 32(5),
514-535. Gray, B. J., Matear, S., Boshoff, C. & Matheson, P.. (1998). Developing a better measure of market orientation. European Journal of
Marketing, 32 (9), 884-903. Gray, B. J., Matear, S., Deans, K. R., & Garrett, T.. (2007). Assessing sources of competitive advantage in a service-dominant world,
Australasian Marketing Journal, 15(1), 69-75. Gray, B. J., Ottesen, G. G., Bell, J., Chapman, C. & Whiten, J.. (2007). What are the essential capabilities of marketers? A
comparative study of managers’, academics’ and students’ perceptions. Marketing Intelligence and Planning, 25(3), 271-295. Hamel, G. & Prahalad, C. K.. (1991). Corporate imagination and expeditionary marketing. Harvard Business Review, 69(4), 81-92. Hooley, G. & Beracs, J.. (1997). Marketing strategies for the 21st century: Lessons from the top Hungarian companies. Journal of
Strategic Marketing, 5(3), 143-165. Hooley, G. J. & Jobber, D.. (1986). Five common factors in top performing industrial firms. Industrial Marketing Management, 15(2), 89-96. Hooley, G. J. & Lynch, J. E.. (1985). Marketing lessons from the UK’s high-flying companies. Journal of Marketing Management, 1,
65-74. Hooley, G. J., Piercy, N. F. & Nicoulaud, B.. (2008). Marketing strategy and competitive positioning (4th ed.). London: Prentice-Hall. Hooley, G. J., West, C. J. & Lynch, J. E.. (1985). Marketing in the UK: A survey of current practice and performance. Institute of
Marketing, Berks: Cookham. Huan, G., Brooksbank, R., Taylor, D. & Babis, P.. (2008). Strategic marketing in Chinese manufacturing companies. Asia Pacific
Journal of Marketing and Logistics, 20(3), 276-288. Huang, T.. (1997). The effect of participative management on organisational performance: The case of Taiwan. International Journal
of Human Resource Management, 8(5), 677-689. Jaworski, B. J. & Kohli, A. K.. (1993). Market orientation: Antecedents and consequences. Journal of Marketing 57(3), 53-70. Joseph, M., Joseph, B., Poon, S. & Brooksbank, R.. (2001). Strategic marketing processes of Australian companies: A preliminary
investigation. European Business Review, 13(4), 234-240. Knuckey, S., Leung-Wai, J. & Meskill, M.. (1999). Gearing up: A study of best manufacturing practice in New Zealand. NZ Ministry
of Commerce. Lai, W. B., Huang, J. Y., Hooley, G. J., Lynch, J. & Yau, O.. (1992). Effective marketing in Taiwan: Profiles of the top
performers. European Journal of Marketing, 26(3), 5-17. Lysonski, S. & Pecotich, A.. (1992). Strategic marketing planning, environmental uncertainty and performance. International Journal
of Research in Marketing, 9, 247-255. Matear, S. M., Osborne, P., Garrett, T. & Gray, B.. (2002). How does market orientation contribute to service firm performance?
European Journal of Marketing, 36 (9/10), 1058-1075. Matear, S. M., Garrett, T., & Gray, B. J.. (2004). Market orientation, brand investment, new service development, market position,
and performance for service organization. International journal of Service Industry Management, 15(3), 284-301. McBurnie, T. & Clutterbuck, D.. (1987). The marketing edge. London: Penguin Books. McDonald, M. H. B.. (1999). Marketing plans: How to prepare them, how to use them. London: Butterworth Heinemann. Modiano, P. & Ni-Chionna, O.. (1986). Breaking into the big time. Management Today, November, 82-84. Narver, J. C. & Slater, S. F.. (1990). The effect of a market orientation on business profitability. Journal of Marketing 54(4), 20-35. Panayides, P. M.. (2004). Marketing in Asia-Pacific logistics companies: A discriminant analysis between marketing orientation and
performance. Asia Pacific Journal of Marketing and Logistic, 16(1), 42-68. Peters, T. J. & Waterman, R. H.. (1982). In search of excellence. New York: Harper Row. Piercy, N. F.. (2000). Market led strategic change (2nd ed.). London: Butterworth Heinemann. Powell, T. C.. (1992). Organizational alignment as competitive advantage. Strategic Management Journal, 13, 119-134. Putendran, S., Speed, R. & Widing II, R. E.. (2003). Marketing planning, market orientation and business performance. European
Journal of Marketing, 37(4), 476-497. Romano, C. & Ratnatunga, J.. (1995). The role of marketing: its impact on small enterprise research. European Journal of Marketing
29(7), 9-30.
(to be continued on Page 17)

June 2010, Volume 9, No.6 (Serial No.84) Chinese Business Review, ISSN 1537-1506, USA
29
A different view to two paired sample researches and an application
Çetin Ayhan Seyfullahoğullari (Vocational School of Social Sciences, Marmara University, Istanbul 34722, Turkey)
Abstract: Hypothesis test is a function of decision making. With samples data, the author has got konwledge about population. It analysis the difference between two dependent or independent samples significance or not. Hypothesis test measures the difference of estimation from real values. This article resarches probability of these differences. In this study, difference and similarities between nonparametric wilcoxon t test and parametric t test will be searched, and application is about basic rights and freedom of the students. These findings are in line, the normalization of the data due to dissolution of the test theory as non-parametric implementation, will be more even in terms of statistical theory. However, the implementation of parametric test does not show the absolutely wrong to deliver results.
Key words: t test; Wilcoxon t test
1. Introduction
Broad sense population, all units in a research framework defined in the cluster is formed. The numerical properties that set the characteristics of the population is called parameter. For example population, average of variance or standard deviation of population parameter is shown as an example. Variance of population, requires some assumptions that we should make relation with the hypothesis tests about the average, about parameters of population (Glass & Hopkins, 1984).
Some assumptions for parametric tests are applied (Kalaycı, 2008). These assumptions are often assumptions for population to know the distribution (normal, binomial, uniform distribution, etc.). Calculating confidence intervals about the average of population or hypothesis tests based on methods for making t divided to normal or near normal as the division population is assumed. Similarly, the regression analysis might be able to generalize the normal distribution with two variables assumed need to have assumed (Mills, 1987). Appropriate and robust parametric techniques for data would be more accurate to use.
Nonparametric tests do not require such strict requirements, even for parameters, which do not reveal population assumptions about the distribution. Nonparametric tests, effective parametric tests are less sensitive and therefore the differences between existing groups may be insufficient to find (Kalaycı, 2008). Nonparametric test for nominal (categorical) and ordinal (ordered) scaled data are used. Parametric test is suitable for the continuous data.
For the purpose of this study, the conditions applied is not right nonparametric test (Wilcoxon test), instead, the t test in parametric test is applied, to show similar results which can be obtained. In this study secondly, parametric t test and t test in which nonparametrik been described as the Wilcoxon test theory, and then thirdly,
Çetin Ayhan Seyfullahoğullari, Ph.D., assistant professor, Vocational School of Social Sciences, Marmara University; research
fields: statistics, econometrics.

A different view to two paired sample researches and an application
30
similarities and differences between the two tests in the view of the fundamental rights and freedoms of students to address an application were examined by the expansion.
2. t Test
t distribution with zero average and the single-mode distribution is symmetrical. This distribution is similar to the shape of the normal distribution, while the shape variability is greater. The sample size (n), while the standard deviation is smaller and closer to the t distribution, is the standard normal distribution (Hamburg, 1987). There are three types of tests. The single-group t test (one-sample t test), an independent test of the differences between the two groups (independent samples t test), compared the two groups (paired-samples t test) between the t test of the difference is to be investigated (Altunışık, Coşkun, Yıldrım & Bayraktaroğlu, 2002).
This study examined the application of variable under different conditions determined by differences in the reactions used for the paired t test with two groups nonparametric that taken account of Wilcoxon t test, and thus only these two tests is not the theoretical content.
2.1 Parametric paired two-sample t test Dependent sample t test is used to investigate whether there is or not difference between the average for two
sample groups. The average is calculated before the events which occurred after the observation of an increase or decrease for the average which had been searched. There are no two different sample groups. Applying the same sample group (training, treatment, etc.), process analysis on the average before and after the hypothesis is tested.
Dependent t test, a group of the unit at different times, different modes of operation from two data sets the difference in action before and after the resulting values of the difference or the twins different from the values of the differences between zero, with the average of the random samples which will be test using a certain method (Özdamar, 2004).
Hypothesis two-way is established: H0 : µ1 = µ2 H1 : µ1 ≠ µ2 Usually, after the application process, an increase or decrease is expected on average. For example, a training
class, the next test is expected to increase in the success, or a group of patients are treated, blood pressure and cholesterol are expected to fall. In this case, it will be appropriate to establish two-way hypothesis.
Growth is expected: H0 : µ1 = µ2 H1 : µ1 < µ2 Decrease is expected: H0 : µ1 = µ2 H1 : µ1 > µ2 should be established.
Test statistics: F
F
Sn*Xt = .
In this formula, the average of the difference, S is the standard deviation of differences. This formula is derived from the value of t test statistics, t table, n-1 (observation-1) degrees of freedom and significance level of

A different view to two paired sample researches and an application
31
α values is found by looking at the hypothesis against the acceptance or rejection of the given decision. 2.2 Wilcoxon test Wilcoxon test, two-sample test is dependent. Nonparametric paired two-sample t test is alternative. Unlike
the parametric t test, the comparison instead of average, Wilcoxon test, the value to sort and compare two different time zones and converts between the two time periods, for a change in whether the test (Heiman, 1996).
Testing will be used to perform the following steps to obtain the criteria is followed: (1) Each Di = Xi-Yi difference values are calculated. (2) Take the absolute value of the difference from small to large is the right order. (3) Results rank each of the absolute value of the difference signal is assigned to this rank. (4) T+: positive signs rank sum;
T-: negative signs are obtained as the total rank; T+ or T-, depending on the alternative hypothesis is the test criteria.
Hypothesis is two sided; T+ or T-, the value of which is a small test criterion (T) is used as (Turanlı, 1988). One-sided hypothesis, and greater than (>) is, T- is used as criteria for testing. One sided of hypothesis and less than (<) are T+ value is used as the test criteria. Ordinal table is used
critical values for the determination of the critical value of Wilcoxon sign.
3.Research and methods
3.1 Research methodology 3.1.1 Purpose of the study The general, trend in the direction of the implementation of parametric methods are used in order to apply
statistical methods. However, in some cases, certain assumptions and conditions are not right, alternative methods are applied. In this study, parametric statistical methods with the paired t test, non-parametric Wilcoxon t test statistical methods will be reviewed. Considering similarities and differences between the two tests, a sample application is to be revealed by investigation.
3.1.2 Preparation of survey questions Used for application data, fundamental rights and freedoms of students to address 21 questions of perspective
that attitude in the scale consists of basic rights and freedoms. 21 questions were a variety of statistical and technical content, according to the filters which are divided into 4 factors:
(1) Basic rights and freedoms awareness factor, (2) The use of fundamental rights and freedoms factor, (3) Limits of fundamental rights and freedoms, (4) Mutual respect. 3.1.3 Scope of the survey Questions, each of the SPSS environments as a variable range (scale) level is measured. Numeric variable
types (numeric) is defined as value. The observations of 103 high school students are included. Students complete the first questionnaire of 21 questions and received answers are the first data was obtained. Then students were given training on basic rights and freedoms, and the various documents and sources of support and training will

A different view to two paired sample researches and an application
32
increase the students’ rights to information about the topic. After 21 questions scale of this application is completed again and the received answer was obtained from the latest data. Reliability of 0.919 is applied before the scale; then, the reliability of the training scale was found to be 0.694.
3.1.4 Data analysis This application of the same observation before and after the application was made in the form of two
between the two applications and progresses an intervention such as the recorder, because it is perceived as paired samples. SPSS 15.0 was implemented to help the research on the process of statistical analysis. The results obtained from the table in the comments section. Research answers to all questions to the participants, missing or lost will not be observed. P = 0.05 significance level to investigate all the findings and has been tested with one-way. One-sided test is the reason, and education is expected to increase as the application, then the theory.
3.1.5 Previous studies Parametric paired t test and non-parametric Wilcoxon test with the use of work in the field of medicine is
focused in particularly. Because of the existing data set in this field, patient-control group (later) in the form of two pre-implementation requires the test. Coronary angiography in patients with the procedure before the substances captoprilin contrast effect on neftropaticy to investigate; coronary angiography before the captopril group 5 patients (8.3%), control group 1 patients (3%) neftropaticy contrast materials was developed, and this difference, both tests were used (t test and Wilcoxon test) in order to test. The result was significant and it is mentioned that (Toprak, Cirit, Bayata, Yeşil & Aslan, 2003). University of California Hodges, J. L. and Lehmann, E. L.—The efficiency of some of the t test, nonparametric competitors named in the article, t test results obtained with the Wilcoxon test will be approximately. However, in the field of medicine to Cazeau, Leclercq and others published in 2001 New England Journal of Medicine—Effects of multisite pacing in patients with biventricular heart failure and intraventicular, a t test or Wilcoxon test was used in the article studies.
3.2 Normal distribution test Before applying the data analysis, the normal distribution should be checked. Kolmogorov-Smirnov Z
statistics for testing the normal distribution is used for. Used for the normal distribution hypothesis: H0 : The data is normally dispersed. H1 : The data is not normal dispersion. If the data is scattered normal parametric t test, nonparametric Wilcoxon signed rank test normally does not
disintegrate that will be appropriate for application.
Table1 Kolmogorov-Smirnov normal distribution table
Number of observations Kolmogorov-Smirnov Z SignificanceAwareness of fundamental rights and freedoms (before) 103 1.590 0.013 Use of fundamental rights and freedoms (before) 103 1.479 0.025 Limits of fundamental rights and freedoms (before) 103 2.277 0.000 Mutual respect factor (before) 103 3.405 0.000 Awareness of fundamental rights and freedoms (after) 103 3.509 0.000 Use of fundamental rights and freedoms (after) 103 3.611 0.000 Limits of fundamental rights and freedoms (after) 103 2.252 0.000 Mutual respect factor (after) 103 4.403 0.000
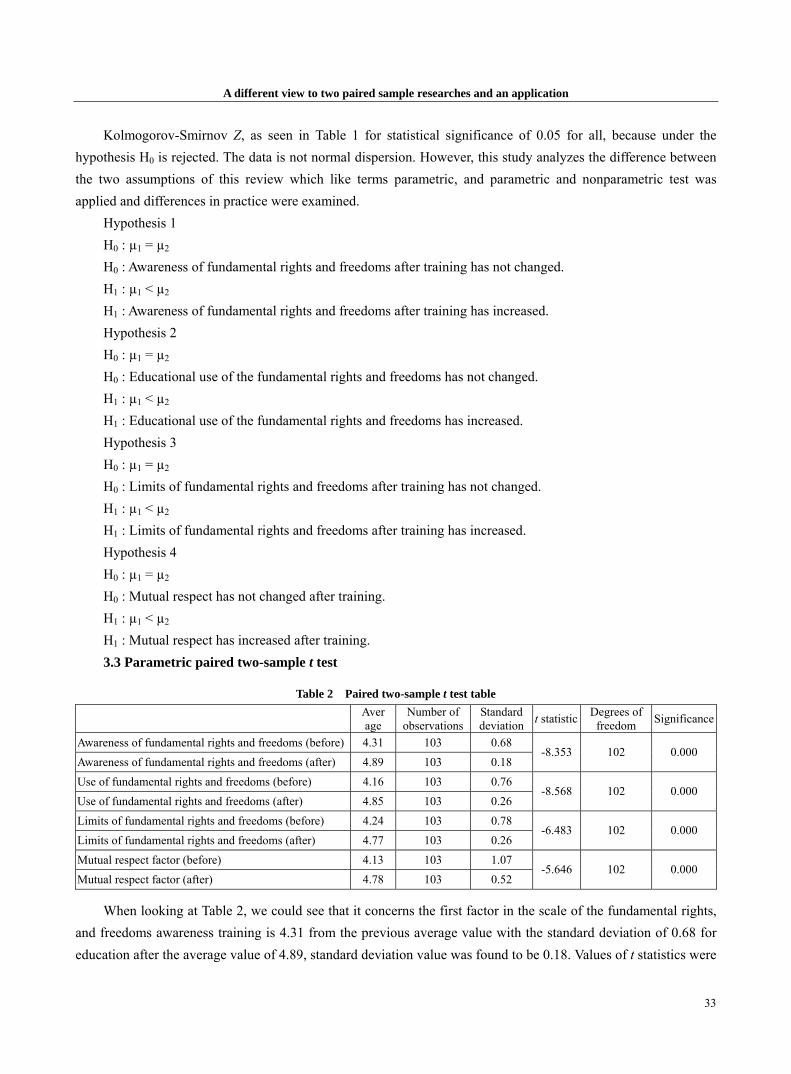
A different view to two paired sample researches and an application
33
Kolmogorov-Smirnov Z, as seen in Table 1 for statistical significance of 0.05 for all, because under the hypothesis H0 is rejected. The data is not normal dispersion. However, this study analyzes the difference between the two assumptions of this review which like terms parametric, and parametric and nonparametric test was applied and differences in practice were examined.
Hypothesis 1 H0 : µ1 = µ2 H0 : Awareness of fundamental rights and freedoms after training has not changed. H1 : µ1 < µ2 H1 : Awareness of fundamental rights and freedoms after training has increased. Hypothesis 2 H0 : µ1 = µ2 H0 : Educational use of the fundamental rights and freedoms has not changed. H1 : µ1 < µ2 H1 : Educational use of the fundamental rights and freedoms has increased. Hypothesis 3 H0 : µ1 = µ2 H0 : Limits of fundamental rights and freedoms after training has not changed. H1 : µ1 < µ2 H1 : Limits of fundamental rights and freedoms after training has increased. Hypothesis 4 H0 : µ1 = µ2 H0 : Mutual respect has not changed after training. H1 : µ1 < µ2 H1 : Mutual respect has increased after training. 3.3 Parametric paired two-sample t test
Table 2 Paired two-sample t test table
Average
Number of observations
Standard deviation t statistic Degrees of
freedom Significance
Awareness of fundamental rights and freedoms (before) 4.31 103 0.68 Awareness of fundamental rights and freedoms (after) 4.89 103 0.18
-8.353 102 0.000
Use of fundamental rights and freedoms (before) 4.16 103 0.76 Use of fundamental rights and freedoms (after) 4.85 103 0.26
-8.568 102 0.000
Limits of fundamental rights and freedoms (before) 4.24 103 0.78 Limits of fundamental rights and freedoms (after) 4.77 103 0.26
-6.483 102 0.000
Mutual respect factor (before) 4.13 103 1.07 Mutual respect factor (after) 4.78 103 0.52
-5.646 102 0.000
When looking at Table 2, we could see that it concerns the first factor in the scale of the fundamental rights, and freedoms awareness training is 4.31 from the previous average value with the standard deviation of 0.68 for education after the average value of 4.89, standard deviation value was found to be 0.18. Values of t statistics were

A different view to two paired sample researches and an application
34
found to be -8.353. t statistic at the significance value 0.000 <0.01 critical value, because H0 was rejected. After applying the training there has increased awareness of fundamental rights and freedoms.
The second factor in the scale of the fundamental rights and freedoms use the average value of 4.16 before training. The standard deviation is 0.76 for education after the average value of 4.85, and standard deviation value was found to be 0.26. Values of t statistics were found to be -8.568. t statistic at the significance value 0.000 <0.01 critical value, because under H0 was rejected. After applying the training, there has increased use of fundamental rights and freedoms.
The third factor in the scale of fundamental rights and freedoms limits the average value of 4.24 before training. Standard deviation of 0.78 for education after the average value of 4.77, standard deviation value was found to be 0.26. Values of t statistics were found to be -6.483. t statistic at the significance value 0.000 <0.01 critical value, H0 was rejected. Application after the training has increased boundaries of fundamental rights and freedoms.
The fourth factor scale mutual respect factor average value of 4.13 before training, the standard deviation of 1.07 for education after the average value of 4.78, standard deviation value was found to be 0.52. Values of t statistics were found to be -5.646. t statistic at the significance value 0.000<0.01 critical value, H0 was rejected. Mutual respect grew after the applicable training.
3.4 Wilcoxon test
Table 3 Wilcoxon test table
Number of observations
Average of ranks
Total of ranks
Wilcoxon Z statistic Significance
Negative ranks 12 16.46 197.50 Positive ranks 72 46.84 3,372.50 Equal value 19
Awareness of fundamental rights and freedoms (after)-awareness of fundamental rights and freedoms (before) Total 103
-7.089 0.000
Negative ranks 12 23.71 284.50 Positive ranks 75 47.25 3,543.50 Equal value 16
Use of fundamental rights and freedoms (after)-use of fundamental rights and freedoms (before)
Total 103
-6.905 0.000
Negative ranks 23 28.09 646.00 Positive ranks 67 51.48 3,449.00 Equal value 13
Limits of fundamental rights and freedoms (after)-limits of fundamental rights and freedoms (before)
Total 103
-5.650 0.000
Negative ranks 12 17.00 204.00 Positive ranks 45 32.20 1,449.00 Equal value 46
Mutual respect factor (after) -mutual respect factor (before)
Total 103
-4.973 0.000
Table 3 is taken into account in the first scale factor, the fundamental rights and freedoms of the negative factors consciousness rank number 12, the negative rank average is 16.46, its total is 197.50 negative rank, positive rank number is 71, a positive average rank is 46.84, total is 3,372, positive rank as found to be 50. The number 19 has been found to be of equal value. Wilcoxon Z statistic value was found to be -7.089. Wilcoxon Z
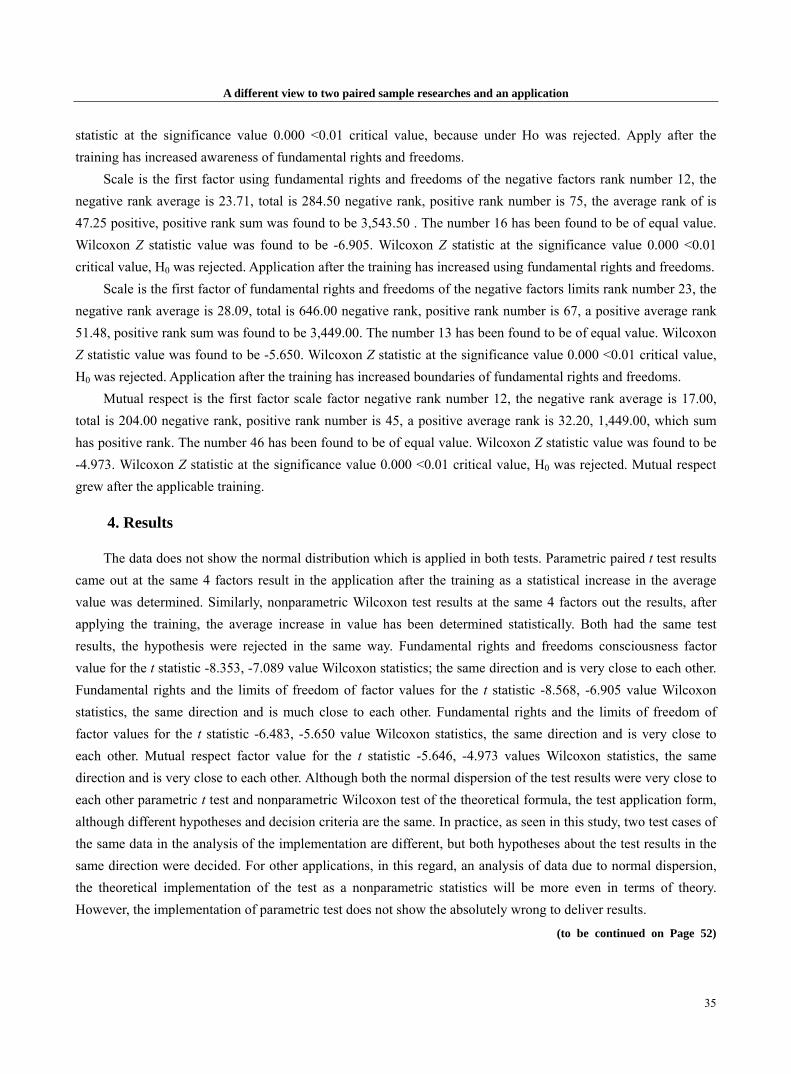
A different view to two paired sample researches and an application
35
statistic at the significance value 0.000 <0.01 critical value, because under Ho was rejected. Apply after the training has increased awareness of fundamental rights and freedoms.
Scale is the first factor using fundamental rights and freedoms of the negative factors rank number 12, the negative rank average is 23.71, total is 284.50 negative rank, positive rank number is 75, the average rank of is 47.25 positive, positive rank sum was found to be 3,543.50 . The number 16 has been found to be of equal value. Wilcoxon Z statistic value was found to be -6.905. Wilcoxon Z statistic at the significance value 0.000 <0.01 critical value, H0 was rejected. Application after the training has increased using fundamental rights and freedoms.
Scale is the first factor of fundamental rights and freedoms of the negative factors limits rank number 23, the negative rank average is 28.09, total is 646.00 negative rank, positive rank number is 67, a positive average rank 51.48, positive rank sum was found to be 3,449.00. The number 13 has been found to be of equal value. Wilcoxon Z statistic value was found to be -5.650. Wilcoxon Z statistic at the significance value 0.000 <0.01 critical value, H0 was rejected. Application after the training has increased boundaries of fundamental rights and freedoms.
Mutual respect is the first factor scale factor negative rank number 12, the negative rank average is 17.00, total is 204.00 negative rank, positive rank number is 45, a positive average rank is 32.20, 1,449.00, which sum has positive rank. The number 46 has been found to be of equal value. Wilcoxon Z statistic value was found to be -4.973. Wilcoxon Z statistic at the significance value 0.000 <0.01 critical value, H0 was rejected. Mutual respect grew after the applicable training.
4. Results
The data does not show the normal distribution which is applied in both tests. Parametric paired t test results came out at the same 4 factors result in the application after the training as a statistical increase in the average value was determined. Similarly, nonparametric Wilcoxon test results at the same 4 factors out the results, after applying the training, the average increase in value has been determined statistically. Both had the same test results, the hypothesis were rejected in the same way. Fundamental rights and freedoms consciousness factor value for the t statistic -8.353, -7.089 value Wilcoxon statistics; the same direction and is very close to each other. Fundamental rights and the limits of freedom of factor values for the t statistic -8.568, -6.905 value Wilcoxon statistics, the same direction and is much close to each other. Fundamental rights and the limits of freedom of factor values for the t statistic -6.483, -5.650 value Wilcoxon statistics, the same direction and is very close to each other. Mutual respect factor value for the t statistic -5.646, -4.973 values Wilcoxon statistics, the same direction and is very close to each other. Although both the normal dispersion of the test results were very close to each other parametric t test and nonparametric Wilcoxon test of the theoretical formula, the test application form, although different hypotheses and decision criteria are the same. In practice, as seen in this study, two test cases of the same data in the analysis of the implementation are different, but both hypotheses about the test results in the same direction were decided. For other applications, in this regard, an analysis of data due to normal dispersion, the theoretical implementation of the test as a nonparametric statistics will be more even in terms of theory. However, the implementation of parametric test does not show the absolutely wrong to deliver results.
(to be continued on Page 52)

June 2010, Volume 9, No.6 (Serial No.84) Chinese Business Review, ISSN 1537-1506, USA
36
Redesign of enterprise business model from structure perspective
DING Ning, DING Yi (College of Transportation Management, Dalian Maritime University, Dalian 116026, China)
Abstract: This article mainly expounds how to design the model of enterprise business on the basis of the general theory on enterprise business. The analysis of design structure and constituent elements enable us to have a basic design for innovative model or transformation of the existing enterprise business model so as to avoid business operation failure resulted from lack of constituent elements.
Key words: enterprise business model; structure; methods analysis
1. The connotation of enterprise business model
Enterprise business model design is a process under the system of business model, with the understanding of the true nature of enterprise business model, which is formed by dividing enterprise business model evolution. The design of enterprise business model is centered on value,which makes a complex combination including two mechanisms value creation and value acquisition. Therefore, enterprise business model is a comprehensive concept, it doesn’t mean a simple profit model, or discard value acquisition either, but a perfect combination of value creation and value acquisition. And then within the enterprise, the balance will be formed between the two, on which the design will also be stressed. In designing process, one important consideration is that the innovation ability of the enterprise and the competitive power won’t be stable, but will be formed by the knowledge accumulation from “learning by doing”. For this reason, the enterprise business model itself is dynamic, to cope with the changes of enterprises interior or external environment, we should adjust, amend, innovate the model constantly in order to provide the enterprise with sustainable, rapid and healthy development.
2. Design process of enterprise business model
After a careful analysis of every kind of enterprise business models, we can see some similarities demonstrating some common characteristics of enterprise business models. Through further analysis on development process of enterprise business model, we can find the inherent laws of the business model evolution.
2.1 Creativity of enterprise business model The value which enterprises participate in about each part of the chain value creation is not equal. In fact,
only specific value activities can create the true value. If the enterprises want to remain competitiveness, they will give full scope to their advantages on these specific parts of the value chain to create new value. Therefore, entrepreneurs and administrators should think of design and business model innovations correspond with the value chain. A new model may begin with an idea, but the idea could not take place of the business logic, it must be
DING Ning, Ph.D., professor, College of Transportation Management, Dalian Maritime University; research fields: service
management, strategic management, production management, the organization structure and management system. DING Yi, Master candidate, College of Transportation Management, Dalian Maritime University; research fields: service
management, strategic management, the organization structure and management system.
Redesign of enterprise business model from structure perspective
37
developed into a practical frame for enterprise. This process is not just to fine-tune for enterprise business models, but to rethink the model in non-traditional way basically, in order to design a new business model. The corporate, for example, Dell, Starbucks, Wal-Mart, Focus Media etc., select a new enterprise business model, and bring them a huge return. The reason that few people can have a creative and dimensional view on enterprise business model design in real-world business is that few administrators are able to give a specific description of enterprise business model for their corporate. Normally, there will be several or even dozens programs of business ideas for implement, not all of them can become enterprise business model, the real innovative model is by screening many different kinds of business ideas. For businesses, the most important issue is not what they are now, but what they will be in the future. A business idea comes from entrepreneurs and administrators’ more keen awareness of opportunity, acknowledgement about the existing model and judgment of potential demand of the market.
2.2 Form of enterprise business model structures The model developed from the ideas must form the new structure scheme—any ideas must be tested in practice.
Hamel (2002) said: new wealth and opportunity are in direct proportion to the model having been created and model combination having been tested. The form of business model structures is a process by which an innovative idea becomes structure formation, there are so many combinations of models, so the corporation needs to examine structure design in practice, and then the innovative model will become a practical structure and process. However, not all of the innovative models can be designed, and the structure design is much more than the innovative ideas, which are concerned about the needs of their customers, supplier organization form, value distribution of stakeholder and resource allocation, etc. As the most important innovative action, there are five basic steps to form the enterprise business model. The first step is producing innovative idea, which is on the foundation of the model, and business innovation represents the nursery of model innovative idea; The second step, structure design, describes creativity as a structural blueprint matching a perfect business idea, structure organization process and the way to coordinate each part; The third step is model running, the model adjusts to the external environment and creates value for enterprise, customers and other stakeholders in the use of corporation internal resources and external environment; Fourthly, evaluation and amendment, it is the further improvement of business model, and it will indicate the model whether to have continued profitability and potential, and in addition to feasibility based on performance of enterprise business model running; The last step is about how large scale the model will be, through test structure and improvement,the model will be developed into the sum of model and support of business operations, as shown in Fig. 1.
Fig. 1 Formation of enterprise business model structures
2.3 Development of enterprise business model Enterprise business model is not static but develops constantly. Because of the uncertain enterprise environment,
the competitive advantage obtained from the new model will be further strengthened, to maintain the stability of model structure and against other competitors’ innovative model, and the enterprises tend to develop their own enterprise business model by various means. During these means, internalization model have become the main path of model development due to many advantages within itself. On one hand, internalization model provides a bigger value for the customer; On the other hand, enterprises can improve the model of barriers and strengthen the competition. Internalizing make disordered organizational elements to be re-integration, enhance the matching of internal elements
Produce innovative
idea
Model running
Evaluation and
amendment
Model normalization
Structure design

Redesign of enterprise business model from structure perspective
38
in enterprises and environmental elements, and the system lock-in to get the elements and environmental elements of organizations solidify at a value network, so that the value from a linear plane is a three-dimensional network, at last patterns of the main companies will receive a wider range of competitive advantages (Peter, 2007).
3. Enterprise business model structure design
Through the all-wave review and abstract summary of enterprise value creation activities and based on many foreign enterprise business reference model elements, this paper provides a new framework for enterprise business mode—four components and nine elements. Four components are units value proposition, value network, value protection and value actualization; Nine elements are target customer segments, value intension, web form, business line, partnerships, control mode, prevention mechanism, revenue model and cost control, which are interconnected with each other. In essence, component system of enterprise business mode is a kind of the three-dimensional structure to comprehensive review of enterprise business mode, as shown in Fig. 2.
Fig. 2 Structural system of enterprise business mode
4. Analysis of enterprise business model
Component system of enterprise business mode is a logical concept, which can give a comprehensive idea on enterprise value creation activities, however, the problem is that enterprise business model is very complicated. The limitation of a conceptual framework could cause them difficultly to grasp it well, and then reduce the practicality of corporate business model system. To have a better understanding and good usage, this paper made the following interpretations.
4.1 Basis of enterprise business model structural design (1) External reality and assumptions. Accurate analysis and grasp of the external environment condition, can
make the enterprise find opportunities and threats in market, also can be more clearly about whether the enterprise’s resources and ability respond to market demand, as well as the trend of the market. External assumptions based on knowledge of some basic issues and assumptions, which are the basis of enterprises in business activities, must be known clearly (Bossidy & Charan, 2005). In concrete contents, external reality and hypothesis can be divided as the external reality and assumptions in two parts.
(2) Internal resource and competence. Resource and competence is the base of business, as well as the most
External reality and assumptions
Enterprise business modeFeedback
with evaluation
Improvement and innovation
Value proposition
Value network
Value protection
Value actualization
Internal resources and capabilities

Redesign of enterprise business model from structure perspective
39
fundamental for the construction of enterprise business model. It contains wealth, assets and human resources of the enterprise, research and development ability, and integrates capabilities, particularly in the enterprise’s core competitiveness. To make the selection of enterprise business mode, one must be clear about the enterprise’s own resources and competence—there is constraint in enterprise business model, which is the precondition. From the concrete contents, internal resources and abilities can be divided into two parts—internal resources and core competence.
4.2 Value composition (1) Customer value. It is a particular alignment of interests which the enterprise delivers to the customer, and
formed by value proposition and value network. It is value of the enterprise to achieve the prerequisite and basis for customer value, enterprise should around value proposition construct value network, which serves for value proposition. As while as the enterprise put forward the value proposition, the feasibility of value network is also considered (Kotler, 1999).
(2) Partners’ value. It is a particular alignment of interests which the enterprise delivers to the partners, and formed by value network and value maintenance. Only by creating and sharing values with partners, one can achieve the efficient functioning of the value network to achieve “win-win”; However partner’s value of high or low depends on the role of both the value network and value maintenance.
(3) Enterprise value. That is the ultimate profit of enterprises, and formed by value realization and value maintenance. Corporate earning ability is resulted from the combination of corporate itself, partners and competitors. To obtain a higher profit level, in doing its own operations, we must also note these two aspects.
4.3 Inscape (1) Value proposition. A successful enterprise business model should be a clear, unique and consistent value
proposition which should match strategic resources and core competencies, through new elements combination and application to achieve value innovation. At the same time, enterprises also must pass the value innovation, for their own core competencies and strategic resources to strengthen continuously and re-training (ZHANG, 2007). Value proposition can be divided into two elements—the target groups and the value of content.
(2) Value network. It constructs the rational value network to ensure enterprise to deliver value content to target customers efficiently, according to well-designed value proposition. When the enterprise constructs the value network, it should at first, act upon the principle of giving priority to efficiency to design the network morphology, and then, determine its business orientation based on the enterprise’s core competence of strategic resources. Value network can be divided into two elements: network morphology and scope of business.
(3) Value maintenance. After enterprises design value proposition and value network, it should also maintain the value of customer, partners and enterprise. Enterprise business model will have a result of the rapid loss of value, or even a complete failure, because of lack of strong support from partner or imitate of competitor. A large number of cases at home and abroad show that failure of many enterprise business model is because that there is no establishment of effective value maintenance, as a result, creation value activities can not be sustained. Maintenance can be divided into three elements of the partnerships, management and control model and precautionary mechanism.
(4) Implementing value. Through the creation of business value, enterprise business model achieves customer value, and any enterprise business model must eventually focus on the most original subject about how corporate earns profit? Why Chinese enterprise has short life cycles? With a large number of enterprises being established, at the same time, there are a large number of enterprises have been eliminated? The root reason for the failure is the absence of a complete, effective enterprise business model or ignoring implementing value factors of the

Redesign of enterprise business model from structure perspective
40
enterprise business model. Implementing value can be divided as income pattern and cost control. 4.4 Analysis on elements On the basis of enterprise business model in cell division, this paper defines the key elements constituting
each unit, the relationship between the unit and elements can be seen in Table 1. The constituent elements of enterprise business model is formed by the further division to unit of enterprise business model, so that people may have a deeper and more clearly understanding about enterprise business model design. The nine key elements of enterprise business model design are focal point which should be given a clear definite and exclusive attention as companies building enterprise business model. There is interrelation between the nine key elements. The good function of enterprise business model runs, benefits from the various elements of the corporate business model to play their own role as well as synergies, because the company’s business model is a system, the function of there are the results of working between the various elements and various units.
Table 1 The elements of enterprise business model meaning Unit Element Content
Target group Company’s products or service target, the segmentation of the market, to determine which target markets, and then focus on target customers. Value
proposition Embedded value
Enterprises through which products and services to create value for customers, corporate prepared to deliver what kind of the value to the target customers.
Network type To realize resource combination and ability which are necessary for value proposition, enterprises should build what kind of networks to make the value creation activities in the most efficient way. Value
network Business scope Description for scope of business enterprise networks, enterprises should distinguish which services should be outsourced and which should be completed by the enterprises themselves.
Partnerships The overall arrangements of the product flow, revenue flow and information flow between enterprise and partner, and how enterprises deal with cooperation to achieve “win-win situation” in the value creation of enterprises and partners.
Management control mode
Enterprise to realize the organizational structure and governance model established by strategies and modalities for the operation, the enterprise how to optimize process, and how to improve their management ability and executive level.
Value maintenance
Prevention mechanisms
The value proposition and value network from erosion and damaging makes institutional arrangements, how isolated saboteurs and imitators, in order to protect the value creation activities from being damaged by external factors.
Revenue model Enterprises income approach, which is how companies callback the created value. Value realization Cost control The approach of business management costs, that is how companies conduct cost-layout and cost
control.
It should also be noted that obviously, the enterprise business model design is affected by a number of other factors, such as macroeconomic operation, the behavior of competitors and the market structure and others. However, the impact of the enterprise business model is shown through a variety of factors, because the effect factors are the elements of enterprise business model structure, it is not as the main structure of enterprise business model. Business formation and operation of business model is a dynamic process, which is not only matching market changes, but also optimizing enterprise business model, improving and inaugurating those which determine the structure of the enterprise business model design to be a loop upgrading process. This is shown in Fig. 2, the value of enterprise business model is used to provide direction for other elements of comprehensive reform as feedback, while other elements of enterprise business model innovation will further promote the improvement of value generation.
5. The core strategy of the enterprise business model design implementation
5.1 Value innovation is the soul of the design The soul of enterprise business model is value innovation. Taking advantage of the enterprise business model

Redesign of enterprise business model from structure perspective
41
enterprise ought to create, maintain and provide value, so as to realize the maximization of enterprise value. Successful enterprise business model should answer the following questions: What kind of customers may provide value? How to provide value to customers? How to achieve business value? We should pay attention to three facets to enhance innovation capability, that is, firstly, pay attention to soft power of companies, and then structure enterprise value networks and the last is to create value for the broad customers.
5.2 Winning over the customer is the center of the design Business model design must depend on customer focus, from enterprise-based to customer-based, from the
occupation market of the occupation customer, at last, from creating value to customer. Give serious consideration to customer expectations, and make the perspective of competition deep into the level of the create value for users, so that they can enter competition room with skill and ease (QIAN, 2007). By implementation of customer focus, we should focus on three main points, well-researched customer needs, the implementation of customer interaction management and to create new added value.
5.3 Economic union is a vehicle/carrier of design According to statistics, 1/3 of the value curves of enterprises are from enterprises’ interior, and 2/3 from business
to business. The enterprise already from strove for the survival to fight single-handedly moves towards altogether sought the livelihood, the business model must be based on alliance, continues the develop economy. By working together, polymerization of core competencies in the value chain of each other to create greater value and stronger competitive groups (WU, 2007). We should keep in mind three primary points to develop union economic, that is, strengthen the supply chain management, build enterprise’s core competitiveness and outsource non-core businesses.
5.4 Flexibility is the key to the design If the enterprise business model determines the success or failure of enterprises, then adaptability is the key
to success or failure of enterprise business model. Strain capacity is the foundation for competitiveness, which is adaptability and consistency strategy facing the complex and changeable market. Adaptability and strain is competitive. Enterprises need to focus on three points to enhance adaptability, stressing the concept of time, JIT being changed with demand and design of personal customization.
5.5 Information network is a platform of design The new enterprise business models must pay attention to the power of information networks, in the age of
information economy. Enterprises will be uncompetitive without the information network platform. Network platform can bring up countless myths. Enterprises must possess good business acumen, seize business opportunities, and gallop in the online world, and relates to the reality. Enterprises need to build superior, agile, and innovative flat of “dynamic network” structure, and set up learning organizations. Taking information network as a platform, we should take the following measures—constructing virtual economic competitiveness, accelerating the pace of e-commerce and promoting process reengineering.
References: Bossidy, L. & Charan, R.. (2005). Transition. Beijing: China Citic Press. Hamel, G.. (2002). Leading the revolution. Beijing: Posts & Telecom Press. Kotler, P.. (1999). Marketing management (9th ed.). Shanghai: Shanghai People’s Publishing House. Peter, F. D.. (2007). The practice of management. Beijing: Mechanical Industry Press. QIAN, Z. X.. (2007). Analysis of innovative business models. Modern Management Science, 8. WU, B. F.. (2007). What is the business model? 21st Century Business, 33. ZHANG, S. W.. (2007). Business model design and research of value proposition. Science & Technology Progress and Policy, 24(6).
(Edited by Ruby and Chris)
June 2010, Volume 9, No.6 (Serial No.84) Chinese Business Review, ISSN 1537-1506, USA
42
Research on relationship between authentic leadership and employees’
work attitude
FU Yun-qi (School of Humanities and Economic Management, China University of Geosciences in Beijing, Beijing 100086, China)
Abstract: Research on relationship between authentic leadership and employees’ work attitude is helpful for leaders to improve their leading ability and behaviors and influence workers’ attitude and behaviors, establish sound relationship between leaders and workers, promote enterprise surviving and developing. To research the relationship, this article has used and formulated questionnaire and preliminary investigation in particular to prove scientific value of the methods by researching on relationship between authentic leadership and employees’ work attitude.
Key words: questionnaire; preliminary investigation; relevant relationship This article conducted relevant variables questionnaire written by domestic and foreign scholars, invited
professors majoring in English to translate and interpret to reduce false, made a survey about some key problems of relationship between authentic leadership and employees’ work attitude. Authentic leadership is a new concept, since its proposal, scholars conducted active discussion about its mechanism of action, the existing researches show that authentic leadership will influence subordinate’s attitude, behaviors and work performance. But existing researches mainly establish the relationship between authentic leadership and subordinate’s attitude and behaviors based on theory.
The questionnaire designed including four variables, which are authentic leadership, theory exchange between leaders and members, work attitude (work satisfaction and organization commitment) and psychological capital. But because this article emphasizes on relationship between authentic leadership and employees’ work attitude, the following parts are developing about the two variables.
1. Variables description
1.1 Authentic leadership In recent years, researches have developed the following several definitions about authentic leadership. Ilies,
et al (2005) put forward more refined four factors model of authentic leadership, including self-awareness, unbiased processing; authentic behaviors/action and authentic relationship direction. Shamir and Eilam (2005) define authentic leadership as such kind of people who play a core role and keeping stronger than average people in self problem solutions and self-awareness abilities with self-consistent goals and show actions in accordance with willingness. Meanwhile, Avolio and Gardner (2005), Luthans and Avolio (2003) and May, et al (2003) maintain the opinion that authentic leadership includes active morality perspective. Walumbwa (2008) group
FU Yun-qi, Ph.D. candidate, School of Humanities and Economic Management, China University of Geosciences in Beijing;
research field: HRM.

Research on relationship between authentic leadership and employees’ work attitude
43
based on predecessors’ researches, define authentic leadership as a kind of leading behaviors method which is to foster and improve leaders to have better self-awareness, inner morality perspective, balance information process and relationship transparency degree, enhance active psychological ability and create active ethics atmosphere, so to promote pursuers to actively develop themselves. Of them, self-awareness refers to people’s understanding about the origin and meaning of the world and the influence of the understanding on their self-awareness as time goes on. Relationship transparency refers to show their true feelings before others without any false or secrete, and increase mutual trust through behaviors such as sharing information openly and expressing their own true thoughts and feelings. Balance information processing refers to that leaders can analyze objectively all relevant statistics before they make any decision. About inner morality perspective, inner and integrated self-adjustment, such self-adjustment is not guided by a group, organization or society, but by inner moral standards and values.
In short, the author has analyzed scientific value and accuracy of various definitions, at last, the author takes definition made by Walumbwa (2008) in this article, which includes four dimensions: relationship transparency, inner morality perspective, balance information processing and self-awareness.
1.2 Work satisfaction and organization commitment In practical operation field of science of organizational behaviors and human capital management, work
attitude is thought as including work satisfaction, organizational commitment and turnover intention. In order to reflect workers devotion to work and acknowledgement degree by organization better, this article emphasizes on the two variables as work satisfaction and organization commitment.
Work satisfaction refers to the psychological status expressed in work itself and its relevant aspects during their work time in an organization, including work environment, work status, work style, work stress and personnel relationship, etc. This research has conducted survey through five dimensions as work itself, supervisor, colleagues, promotion and payment. Organizational commitment refers to the willingness degree of workers believing and accepting organizational goals and staying in their organizations, which has three dimensions in this article, including emotional commitment, sustainable commitment and normative commitment. “Emotional commitment” indicates individuals’ willingness degree to accept and take part in a particular organization, belief and acceptance to the goal and values of an organization; willingness to make efforts for an organization and stay in the organization. “Sustainable commitment” refers to the lost attached interests once a worker leave the organization, when the worker realizes this point, he will stay in the organization. “Normative commitment” means individuals’ value is consistent with that of organizations or their attitude toward the organizations. Employees’ emotional commitment shows that the employees want to be worked for the organization continuously, employees with high level emotional commitment want to stay in their organizations; sustainable commitment refers to cost awareness for workers leaving their organizations, employees with high level sustainable commitment think that they must stay in their organizations; While normative commitment reflects employees’ responsible emotion of sustainable employment, employees with high level normative commitment feel that they should stay in their organizations.
2. Questionnaire design
2.1 Interviewing method Interviewing method is man-to-man interview, it may have structure or not, the process of formulating the
questionnaire is mainly interview about authentic leadership. We mainly target at investigating interviewees’

Research on relationship between authentic leadership and employees’ work attitude
44
thinking process about the questionnaire and their suggestions. Initial interview outline has formed through the document researches. To interview 10-20 workers and experts, then analyze according to cluster procedure. The specific steps are as following: Based on document retrospection and theory evidence, through semi-structural interview and getting key words together, initially confirm contents of authentic leadership. For example, in order to discuss items of psychological capital variable, we can ask interviewee: “What personalities do you think authentic leaders usually have?”
2.2 Interviewing plan The interviewing was conducted in six companies in Henan and Beijing with semi-structural method mainly.
The contents are around authentic leadership behaviors of supervisors, based on four dimensions of authentic leadership which are relationship transparency, inner morality perspective, balance information process and self-awareness.
(1) Management interview Emphasizing to choose 5 workers with average interviewing time as 30-60 minutes, the main aim is to know
what aspects management of a company always think an authentic leader’s behaviors should be shown at. (2) General stuff interview Sampling 10 workers with average interviewing time as 50-60 minutes, the main aim is to know supervisors’
daily performance in a company, and how workers evaluate their leaders’ authentic leadership behaviors, what kind of leaders they think should be authentic leaders.
(3) Experts interview Inviting five experts in this field, the average interview time is about 30-60 minutes. The main aim is to know
experts’ initial advice on survey projects of authentic leadership. 2.3 Interviewing process The author conducted interviewing in the office which was arranged by the company in particular, avoiding
outside disturbing, making sure both interviewer and interviewee can ask and answer questions carefully. The author is the master of the interview, except for records tools, and there are special workers to record interview process. Besides, there are trained initially interviewees about how to describe key incidents about authentic leaders before the formal interviewing.
2.4 Projects filtering of questionnaire scales We made up initial authentic leadership questionnaire through interviewing and relevant records, meanwhile,
the author also conducted initial inspection targeting at other scales. Because work attitude scale is formulated according to foreign scale, bi-directional translation is needed.
Researchers invited 10 experts and scholars, one professor, two vice-professors, four Doctors, three Masters. First, we chose two people translate and interpret the English questionnaire, then made up initial questionnaire through discussion and altering at meetings, then graduate and undergraduate conducted back-translation, which is, to translate from Chinese to English, according to the difference between the original English copies and translated English copy, altered Chinese questionnaire.
Subsequently, the author invited 7 businessmen and 5 management science experts to evaluate translated questionnaire, the author explained meaning of core concept of each scale to them, so that they can understand and give suggestions about whether the contents of each project is suitable and clear, then the author altered the questionnaire according to their suggestions.
The experts combined items with same meaning, then compressed and extracted the items with different

Research on relationship between authentic leadership and employees’ work attitude
45
meaning, obeying the following principles: (1) relevant with the aim of this research; (2) keeping ethological items; (3) keeping items with clear language which are easily to be understood; (4) Try not to change the meaning of initiated items.
The author made up employees’ initiated questionnaire through combination and compression. The questionnaire includes authentic leadership, four parts of work attitude (not including demography information), of them, there are 16 items in authentic leadership and 37 items in work attitude.
3. Questionnaire preliminary test
3.1 Structure of initial questionnaire This initial questionnaire includes two parts: basic information to be tested, including sex, age, education,
etc.; survey scales of each research variable, they are authentic leadership scale and work attitude scale. 3.1.1 Authentic leadership scale Authentic leadership scale consists of four dimensions: relationship transparency, inner morality perspective,
balance information processing and self-awareness. Authentic leadership questionnaire is mainly made up according to that of Bruce J. Avolio with 16 projects, of them. There are 5 projects about relationship transparency, four projects about inner morality perspective, three projects about balance information processing, and four projects about self-awareness. All the projects take Likert five points scale, each project is divided into 0-4 grades, 0 represents for no; 1 represents for once in a while; 2 represents for sometimes; 3 represents for often; 4 represents for always. Higher scores represent higher authentic leadership degree of leaders.
3.1.2 Work attitude scale Work attitude scale includes two sub-scales, which are work satisfaction scale and organizational
commitment scale. Work satisfaction scale includes five dimensions as work itself, supervisors, colleagues, promotion and
payment. 19 projects together take Likert five points’ scales. Each project is divided into five grades, 1 represents “strongly disagree”, 2 represents “somewhat disagree”; 3 represents “no apparent attitude”, 4 represents “agree”, 5 represents “agree very much”. Higher scores represent higher work satisfaction of workers.
Organizational commitment scale is made up based on the three-dimension organizational commitment scale created by Allen and Meyer (1990), including emotional commitment, sustainable commitment, normative commitment, 18 projects altogether, allocating on each dimension at average. Taking Likert five points scale, each project is divided into 5 grades, 1 represents “strongly disagree”, 2 represents “somewhat disagree”; 3 represents “no apparent attitude”, 4 represents “agree”; 5 represents “agree very much”. Higher scores represent higher organizational commitment of workers.
3.2 Questionnaire preliminary test To ensure scientific value and effectiveness of large sample questionnaire inspection outcome, we had to
conduct preliminary test of small sample to initiated questionnaire before formal questionnaire being issued. We chose one private enterprise in Wuhan to conduct this. We chose 96 samples stochastically and conducted the test in written form.
3.2.1 Reliability investigation of initial questionnaire Reliability refers to dependability or consistency of survey outcome according to inspection tools reflecting
index of real degree of tested projects. In this research, the author uses SPSS17.0 to test and use Cronbach’s α

Research on relationship between authentic leadership and employees’ work attitude
46
Ratio to conduct internal consistency analysis. More than Cronbach’s α 0.6 is acceptable reliability, more than Cronbach’s α 0.7 is higher reliability, and more than Cronbach’s α 0.8 represents great reliability.
(1) Reliability investigation of authentic leadership scale
Table 1 Reliability investigation of authentic leadership scale
Relationship transparency
Inner morality perspective
Balance information processing Self-awareness
Cronbach’s α ratio 0.872 0.863 0.648 0.812 Overall consistency ratio 0.942
We can see from Table 1, the overall consistency ratio of authentic leadership scale is 0.942, which is more than 0.8, representing that the reliability of the scale is very high.
(2) Reliability investigation of work satisfaction scale
Table 2 Reliability investigation of work satisfaction scale
Work Supervisors Colleagues Promotion Payment Cronbachα ratio 0.837 0.785 0.840 0.817 0.928 Overall consistency ratio 0.929
We can see from Table 2, the overall consistency ratio of work satisfaction scale is 0.929, which is more than 0.8, representing that the reliability of work satisfaction scale is very high.
(3) Reliability investigation of organizational commitment scale
Table 3 Reliability investigation of organizational commitment scale
Emotional commitment Sustainable commitment Normative commitment Cronbach α ratio 0.747 0.762 0.821 Overall consistency ratio 0.913
We can see from Table 3, the overall consistency ratio of organizational commitment scale is 0.913, which is more than 0.8, representing that the reliability of organizational commitment scale is very high.
3.2.2 Validity inspection of initial questionnaire Validity refers to authenticity degree of a research, it is also called correctness, which is related closely with
the aim of the research, it is valid only when the outcome of a research complies with its aim, so validity equals to degree of reaching goals.
There are usually three methods to survey validity: content validity, criterion validity and structure validity. In this research, the author uses SPSS17.0 to test the structure validity of questionnaire. First, we have to conduct KMO and Bartlett’s spheroid test, higher KMO value shows that the questionnaire is more suitable for factors analysis, with the standard of more than 0.5; Besides, when Bartlett’s spheroid test reaches to prominent level, it shows that it is suitable for factors analysis. Then, analysis with PCA method is needed.
(1) Validity test of authentic leadership scale KMO and Bartlett’s spheroid test outcome shows, KMO value of authentic leadership scale is 0.907, and has
passed Bartlett’s spheroid test, therefore, we can conducted factors analysis with PCA method. The author sampled four common factors through the analysis, loading of each factor is more than 0.5, total cluster variation of all common factors is 74.332%, representing that the scale has higher structure validity.
(2) Validity test of work satisfaction scale

Research on relationship between authentic leadership and employees’ work attitude
47
KMO and Bartlett’s spheroid test outcome shows, KMO value of authentic leadership scale is 0.865, and has passed Bartlett’s spheroid test, therefore, we can conducted factors analysis with PCA method. The author sampled five common factors through the analysis, loading of each factor is more than 0.5, total cluster variation of all common factors is 76.377%, representing that the scale has higher structure validity.
(3) Validity test of organizational commitment scale KMO and Bartlett’s spheroid test outcome shows, KMO value of authentic leadership scale is 0.849, and has
passed Bartlett’s spheroid test, therefore, we can conducted factors analysis with PCA method. The author samples three common factors through the analysis, loading of each factor is more than 0.5, total cluster variation of all common factors is 63.540%, representing that the scale has higher structure validity.
4. Summary
To ensure a formal questionnaire about the scientific research being issued, the following two stages are dispensable: questionnaire design and questionnaire preliminary test. During the design, we often face altering problem, we usually use interviewing method and experts’ suggestions method to summarize initiated items into exact and short ones. While questionnaire preliminary test is mainly about reliability and validity of initiated questionnaire, we usually sample small samples to test: questionnaire reliability and validity are related closely to the accuracy of statistics collected at last, which are the key points for the success of research. In this research, the author takes SPSS17.0 to test questionnaire statistics of the 96 small samples which we issued, the outcome shows that both reliability and validity of six sub-scales included in this questionnaire are very high. Therefore, the above questionnaire design has strong scientific value, which is helpful to research on relationship between authentic leadership and employees’ work satisfaction, and get scientific conclusion.
References: Avolio, B. J. & Gardner, W. L.. (2005). Authentic leadership development: Getting to the root of positive forms of leadership.
Leadership Quarterly, 16(3), 315-340. Ilies, R., Morgeson, F. P. & Nahrgang, J. D. (2005). Authentic leadership and eudemonics well-being: Understanding leader-follower
outcomes. Leadership Quarterly, 16(3), 373-394. Luthans, F. & Avolio, B. J.. (2003). Authentic leadership: A positive developmental approach. In: Cameron, K. S., Dutton, J. E. &
Quinn, R. E. (Eds.), Positive organizational scholarship. San Francisco: Barrett-Koehler. Luthans, F., & Youssef, C. M.. (2004). Human, social, and now positive psychological capital management: Investing in people for
competitive advantage. Organizational Dynamics, 33(2), 143-160. May, D. R., Chan, A., Hodges, T. & Avolio, B. J.. (2003). Developing the moral component of authentic leadership. Organizational
Dynamic, 32, 247-260. Shamir, B. & Eilam, G. (2005). What’s your story? A life-stories approach to authentic leadership development. Leadership
Quarterly, 16(3), 395-417. Walumbwa, F. O., Avolio, B. J., Gardner, W. L., et al. (2008). Authentic leadership: Development and validation of a theory-based
measure. Journal of Management, 34(1), 89-126.
(Edited by Ruby and Chris)

June 2010, Volume 9, No.6 (Serial No.84) Chinese Business Review, ISSN 1537-1506, USA
48
The law of increasing of the final price and the law of management of the
final price in the practice in the today economic crisis
Momtchil Dobrev (Institute Dobrev & Halachev, Sofia 1404, Bulgaria)
Abstracts: The two described economic laws which are developed by the author before 10 years are very important for the marketing process in the economic crisis nowadays. Different methods and procedures developed by the author on the ground of his observations of many years on the market and formed respectively in theory and laws and practices to be applied in the contemporary life of every company acting on the market in the today economic worldwide crisis have been presented.
Key words: economic law; management; economic crisis In current economic crisis, there are many possibilities for each company to protect its reached market share.
The current economic crisis is purposeful plan of people that made superfluous profit in the trading operation around the world with oil, weapons and invested in the real estates. The purpose of these people is to take the profit money from the rest of the people from the middle and small business.
Below describes two economic laws and their practices developed by the author, which are useful for each company from big to small business.
1. A law of management of the final price and its application in the practice (Dobrev, 2001)
In the economic practice, many countries have appeared recently on the packing of some products the terms like “advisable price”. This notion does not impose itself accidentally by the producers. Every such step has its economic explanation. In the process of birth of the market economics and in its following stages, a great changeability of the realization channel could be observed, to which the goods and the products were sold and distributed. This big variety has composed also a special control. This was imposed by the fact that the same product sold on different places, on different markets, in different shops by different dealers—both retail dealers and merchants at different prices. To the final, customer is offered the same product at different price. And this different price depends only on the wish and aspiration of the retail dealer about how much surplus charge to put on and how much to earn. This unscrupulous pricing put a series of problems not at anybody but at the producers. They were faced with the dilemma—how much to produce, how much of their products to distribute in definite region and at what price. Bulgarian customer has not yet learned to look for and to find the most acceptable for price, especially when we speak about the same product, with the same quality, packing, weight, etc. More often he will be led by purchase from the nearest shop.
Different prices some retail dealers still sell create an internal competition and a lot of conflicts in
Momtchil Dobrev, Lord of Lochater, Master, professor, Institute Dobrev & Halachev; research fields: economics, new energy
technologies, new technologies in gravity.

The law of increasing of the final price and the law of management of the final price in the practice in the today economic crisis
49
distributing the products of a company. The higher end price leads for its part to smaller turnovers, to bigger profit for the retail dealers, but also to decrease the confidence of the end customer to the respective product.
The problem arising for the producer affect also the market share, the intentions for investments and enlargement of the production, the strivings to increase market share, to bigger success in the fight with the competition both on price and product level.
Many financial means are thrown for advertisement, in promotions with the purpose for increase of the market share of the respective company. With this law, the feed back from every advertisement really gives a concrete answer of the size of market share increase. Thus, the sale management and the influence of the other elements of the company’s communication policy is controlled.
The realization channels for various goods are different. Let’s take instance for the realization channels for food-stuffs, and more concrete for mayonnaise. The
distribution of the good mayonnaise begins from the produce and passes thought different stages between reaching the end customer. The concrete realization channels are as follows:
(1) Merchant—retail dealer; (2) Distribution for a definite region-merchant-retail dealers; (3) Distribution for a definite town-merchants-retail dealers; (4) Distributor—a chain of supermarkets, cash and carry chains of shops. When a producer holds a definite sphere of sales of definite goods, he is interested to guarantee the sales of
his production and step-by-step to increase his market share. The production scale is associated with the relation of the producer and with all kinds of dealers with the purchase of definite minimum quantities of the good produced. At this realization channels thus listed however the law of management of the final price states:
By means of exact concretizing of the final recommended price of a product over its packing the control and the management on the whole chain from the production up to the sale of the product to the end customer are realized.
Consequences of the law of management of the final price (Dobrev, 2001): (1) Over the sales, control and management; (2) Direct influence on the vital cycle of the product. The distribution process of the product may be directly managed depending on the vital cycle. Different systems of promotions and stimulation of the sales may be included, for a better management of
this process, for a better control. Availabilities are already to most adequate results, depending on the influence of the market for the concrete product.
On the realization channels and their self-organization selection. They are optimized independently. An internal mechanism of self-organization of the realization channels is available here. The unnecessary one is thrown away of the chain. This which loads the price and slows down the process of sales, putting a higher price is simply pushed out of the realization channels, or it is forced to confirm with the concrete facts and to consider the “recommended price”.
On the sales management. The management of the sales becomes more real, more transparent, and more visible. From here follow concrete measures, connected with increase of the sales, increase of the market share of the respective product.
On the physical distribution of the goods. The physical distribution is optimized. The expenditures drop away and the expenses in the physical distribution are managed better.

The law of increasing of the final price and the law of management of the final price in the practice in the today economic crisis
50
For the planning of the sales of the trade company. The sales are managed and plant thus better. The feed back gives more exact and concrete information and they are planned better in every following step at the planning of the sales. A better causal and consequences connection and causal relation by plan aims, and realized sales is received. The correspondence in the management has a higher value. The risk is reduced.
For the production planning. There received better results for planning of the production. The feed back of quantity made production and sold production to the end consumer is more exact and more concrete. The production process itself may be managed better in this way, and the process to storage the goods, the process for connection of the products produced with the durability of a product, the warehouse would be availability both in the company and at the distribution. In this way, a clear picture about season goods, priority of product consumption and then better management of these sales would be received.
For the market share. In the long run, more exact and concrete data about the concrete market share of the company is received at very time of the year. Then, the more concrete results and measures are also to be taken to increase the market share. Simply every concrete measure to raise the respective market share shall have a concrete result and effect and this effect may be managed, controlled and concrete results, parameters, percents of increase of the market share may be reached. The stability of this process is raised, and the respective error at the whole process is diminished.
For the competition. Managing better to sales and the production process, controlling better the whole process, receiving more exact result, this gives respectively and leads to better management decisions in the fight with the competition to be reached.
On the expenditures for advertisement. More exactly are controlled the expenditures for advertisement. They receive a more concrete expression in an increased or decreased market share. Feed back by the control of the whole process gives a much bigger accuracy than the effect and result from a given advertisement activity.
Manifestations of the law of the management of the final prices: (1) Text—advisable price; (2) Text—special price; (3) Label with the price. The label is usual with a color being in contrast with the packing of the good. The effect of this law is on the end buyers, on the degree of confidence of the customers, on the development
of the economics, on the better control and management of the market share of the respective company, on the more favorable and higher risk development of the respective company to a long period of time.
2. Law of increasing of the final price and its application in the practice
The rise in the price of a product on the contemporary stage of development of market economics is always connected with some ebb and loss of definite percent of market share of the last reached one by to company. The rise in price of a given product is always connected with some ebb of the purchasing power, with an ebb of customers, loss of market share and market position reached.
However, there is a method according to which a rise of the price of a product is possible and this is not connected with some ebb and loss of customers, and respectively with loss of definite market share. The product as realization represents the materialization of the idea in a concrete subject or to become embodies in concrete activity.
Let’s examine initially what characterizes a product. The product is characterized with the following basic
The law of increasing of the final price and the law of management of the final price in the practice in the today economic crisis
51
parameters: qualitative characteristics, qualitative characteristics, weight, and net, gross etc., functions, design, style, product or trade-mark, packing, advertisement, label.
Characteristics of the product are as follows: size, weight, firm, color, consistence, taste, age, quality, exclusiveness, taste, age, durability, actuality, versatility.
Every product possesses also has the following characteristics: Use of the product and usage of the product, and respectively connected with this field of use, place of use,
time of use, durability of use. For every product exists also the respective consumer.
3. Law of rise of the price states
We may rise the price of the product without losing any respective percent of the market share and respective percent of the constant clientele of the respective product only if we change every of the indices of the product and mainly the weight and/or the packing, but without price-reduction of the product.
Proceeding from the qualities of the product, it is based on the fact which parameters may be changes aiming the rise of the price. Thence, there received also the respective product variants and product elimination. In this way a development of the product is reached. This includes both the technical development of the product and the development of the network of shops. We may change the presentation of the product. This happens with the change of the name and trade-mark or the packing. Typical for this law is its application mainly in economics being in recessions and whose gross product diminishes with years.
An example for the application of this law could be seen in Republic of Bulgaria. Examples on which concrete purposes and strivings in following of this law available are Danone Company,
Products of Nestle, Waffle of Craft Jackobs, Nestle, Coca Cola and Croissants. Typical for these products is a constant reduction of the weight of the product offered, accompanied by a new
packing of product trade-mark, aiming not to be noted by the customer, or not to be paid any attention by him. However, with the weight reduction of the product its price is not lowered. There remains simply the old price, no matter that for example the weight of the product is reduced almost by 10%. This is rise of the price of the product is reached.
As a comparison, we shall give the example with the croissants in 1993-1994, when their weight was 90-100 gr. At the present, 2003 the weight of a croissant is between 65-75 gr. The price however in absolute expression has remained the same. In comparison however with 1993-1994 the competition of the row materials is larger and respectively the prices of the row materials are lower. Thus is rise of the price the end product reached.
Another example is the MORENI, which are with much smaller weight. Company DANONE applies very well this law, introducing initially one product on the market with a weight of 250 gr., it changes only the packing and respectively the weight to 185 gr. During this time, the price of the product remains the same, as well as the quality characteristics of the product.
Law of rice in price is connected with a dynamic replacement of a product by another product. Including the technical stimulating the sales with the development of the product, imposition of price through
the methods of sale stimulation, keeping prices up, striving to maximal profits are the methods to keep up the respective market share.
The application of this law should be connected also with the following additional activities, before replacing one product by another one, or before going to application of this law, namely:

The law of increasing of the final price and the law of management of the final price in the practice in the today economic crisis
52
Dynamic consequence of the development of the concrete product. Dynamic including of the techniques to stimulate the sales in management of the vital cycle of the product
and aiming maximal rise of the profit looked for. On the other hand, following the statistical data about the motion of the concrete product, its demand and
market saturation, the residual values of the production demanded, depending on the vital cycle of the product. The effect of the application of this law for every company both trade or production one leads to larger gains
for the company, and then to larger possibilities for attack to increase the market share of the company, the offer of new products, overtaking the competition in another ones.
References: Dobrev, M.. (2001). Three important basic laws in the marketing and in the economics. Alternativi, 7-8, 58-61.
(Edited by Ruby and Chris) (continued from Page 35)
References: Aloba, B. K.. (1985). Statistical analysis methods. Istanbul: Caglayan Publishing, 251. Altunışık, R., Coşkun, R.,Yıldrım, E. & Bayraktaroğlu, S..(2002). Social science research methods. Sakarya Bookstore, 159. Glass, G. V. & Hopkins, K..(1984). Statistical methods in education and psychology. New Jersey: Prentice Hall, 124-128. Hamburg, M.. (1987). Statistical analysis for decision making (4th ed.). San Diego: Harcourt Brace Jovanovich, 93-95. Heiman, G. W.. (1996). Basic statistics for the behavioral sciences. Boston: Houghton Mifflin Company, 105-108. Hinkle, D. E. & Wiersma, W.. (1998). Applied statistics for the behavioral sciences. Boston: Houghton Mifflin Company, 54-56. Kalaycı, Ş.. (2008). Applied multivariate statistical techniques SPSS (3rd ed.). Ankara: Asil Publishing, 73-85. Kıroğlu, G.. (2001). Applied nonparametric statistical methods. Istanbul: Pamaş, 142-144. Mills, T. W., (1987). Statistics for applied economics and business. Tokyo: McGraw-Hill Company, 206. Özdamar, K.. (2004). Packages with the statistical data analysis. Eskisehir: Kaan Bookstore, 321. Siegel, Sidney & Castellan, J. J.. (1988). Nonparametric statistics, Singapore. Mc Graw Hill International Editions. Toprak, Ö., Cirit, M., Bayata, S., Yeşil, M. & Aslan, L..(2003). Given before the procedure in patients with coronary angiography
kaptoprilin investigation of contrast effects on substance neftropatisi. Izmir, Anatolian Journal of Cardiologists, 98-103. Turanlı, M.. (1988). Marketing management decision making. Istanbul: Beta Yayın Dağıtım, 143.
(Edited by Ruby and Chris)

June 2010, Volume 9, No.6 (Serial No.84) Chinese Business Review, ISSN 1537-1506, USA
53
The study on Yangling farmer profession associations*
WANG Zheng-bing1, XU Ting2, SUN Hao-jie3, Allan Rae4 (1. College of Economics and Management, Wuhan Polytechnic University, Wuhan 430023, China;
2. Entrepreneurship Commercialization and Innovation Center, The University of Adelaide, Adelaide SA 5005, Australia;
3. College of Economics and Management, Chang’an University, Xi’an 710061, China;
4. Department of Applied and International Economics, Massey University, Palmerston, North 4410, New Zealand)
Abstract: Yangling farmer profession associations are developing quickly. The members of associations account for 11% of the total peasant households. The speed of the members’ income increase is higher three percentage points than the speed of the non-members. However, some problems still exist in the associations, such as the members are not enough much, the mechanism is not sound, the scope of business is small. In order to promote the associations to develop, the authors put forward to improve the one person a ticket system, establish the member funds account, make democratic management sound and let experts guide the associations.
Key words: association; democracy; supervise
1. Introduction
Yangling is located in Wugong County, Shaanxi province. In 1997, it was approved by the State Department as a state-level agricultural high-tech industries demonstration zone. The region of 94 square kilometers hosts 4 regional rural towns and 71 villages with a total population of 120,000 including an agricultural population of 80,000. In recent years, Yangling demonstration zone has engaged in a range of demonstrations in agricultural science and technology as well as agricultural economic management. Professional associations are one of the important aspects of the region.
Northwest A&F University and Yangling Vocational and Technical College Agricultural Schools provided a consulting service and actively explored, established and promoted professional peasant farmer associations in Yangling. However, the development of these associations has been problematic. This research examines the problems and achievements of these associations.
2. Yangling farmer associations
At present, there are 19 professional farmer associations in Yangling regions. There are more than 2,200 members accounting for 11 percent of the total rural regional households. An overview of these 19 associations
* Acknowledgement: The authors acknowledge the financial support of Program for New Century Excellent Talents in University (grant NCET-05-0859) and National Natural Science Foundation of China (grant 70273035).
WANG Zheng-bing, Ph.D., professor, College of Economics and Management, Wuhan Polytechnic University; research fields: agriculture economics, rural sociology.
XU Ting, Ph.D., Entrepreneurship Commercialization and Innovation Center, The University of Adelaide, Australia; research field: agriculture economics.
SUN Hao-jie, Ph.D., lecturer, College of Economics and Management, Chang’an University; research field: agriculture economics. Allan Rae, professor, Department of Applied and International Economics, Massey University; research field: agriculture policy
analysis.
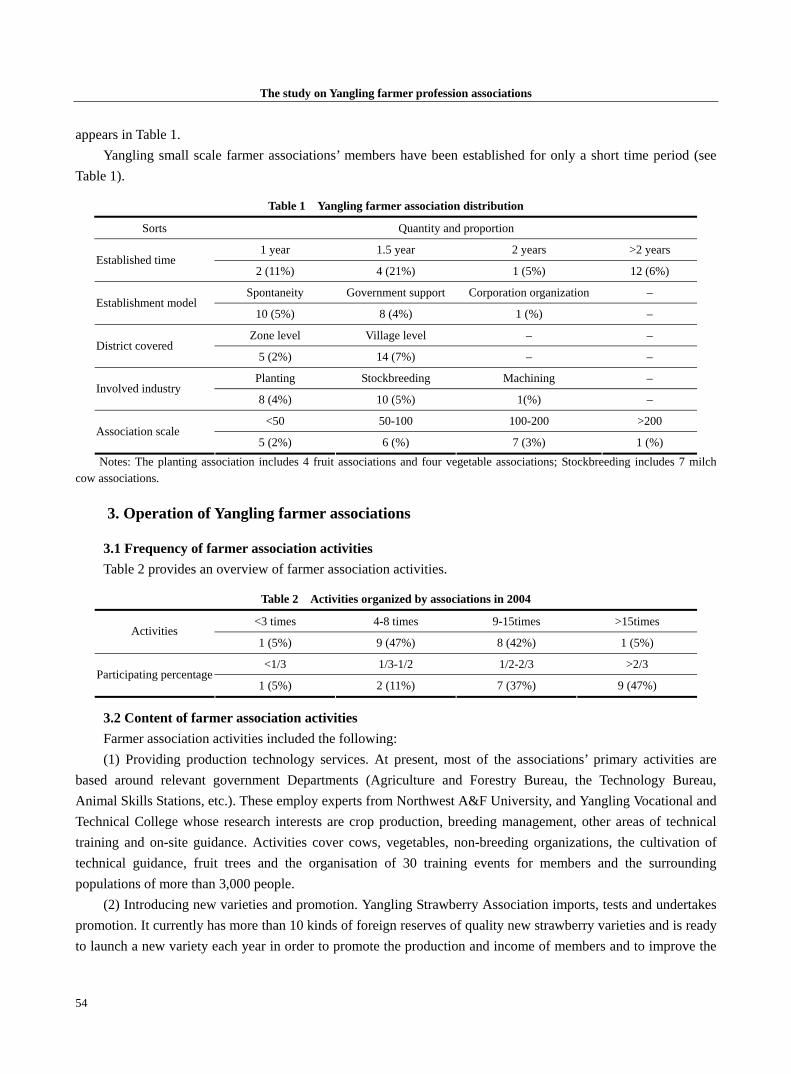
The study on Yangling farmer profession associations
54
appears in Table 1. Yangling small scale farmer associations’ members have been established for only a short time period (see
Table 1).
Table 1 Yangling farmer association distribution
Sorts Quantity and proportion
1 year 1.5 year 2 years >2 years Established time
2 (11%) 4 (21%) 1 (5%) 12 (6%)
Spontaneity Government support Corporation organization – Establishment model
10 (5%) 8 (4%) 1 (%) –
Zone level Village level – – District covered
5 (2%) 14 (7%) – –
Planting Stockbreeding Machining – Involved industry
8 (4%) 10 (5%) 1(%) –
<50 50-100 100-200 >200 Association scale
5 (2%) 6 (%) 7 (3%) 1 (%) Notes: The planting association includes 4 fruit associations and four vegetable associations; Stockbreeding includes 7 milch
cow associations.
3. Operation of Yangling farmer associations
3.1 Frequency of farmer association activities Table 2 provides an overview of farmer association activities.
Table 2 Activities organized by associations in 2004
<3 times 4-8 times 9-15times >15times Activities
1 (5%) 9 (47%) 8 (42%) 1 (5%)
<1/3 1/3-1/2 1/2-2/3 >2/3 Participating percentage
1 (5%) 2 (11%) 7 (37%) 9 (47%)
3.2 Content of farmer association activities Farmer association activities included the following: (1) Providing production technology services. At present, most of the associations’ primary activities are
based around relevant government Departments (Agriculture and Forestry Bureau, the Technology Bureau, Animal Skills Stations, etc.). These employ experts from Northwest A&F University, and Yangling Vocational and Technical College whose research interests are crop production, breeding management, other areas of technical training and on-site guidance. Activities cover cows, vegetables, non-breeding organizations, the cultivation of technical guidance, fruit trees and the organisation of 30 training events for members and the surrounding populations of more than 3,000 people.
(2) Introducing new varieties and promotion. Yangling Strawberry Association imports, tests and undertakes promotion. It currently has more than 10 kinds of foreign reserves of quality new strawberry varieties and is ready to launch a new variety each year in order to promote the production and income of members and to improve the
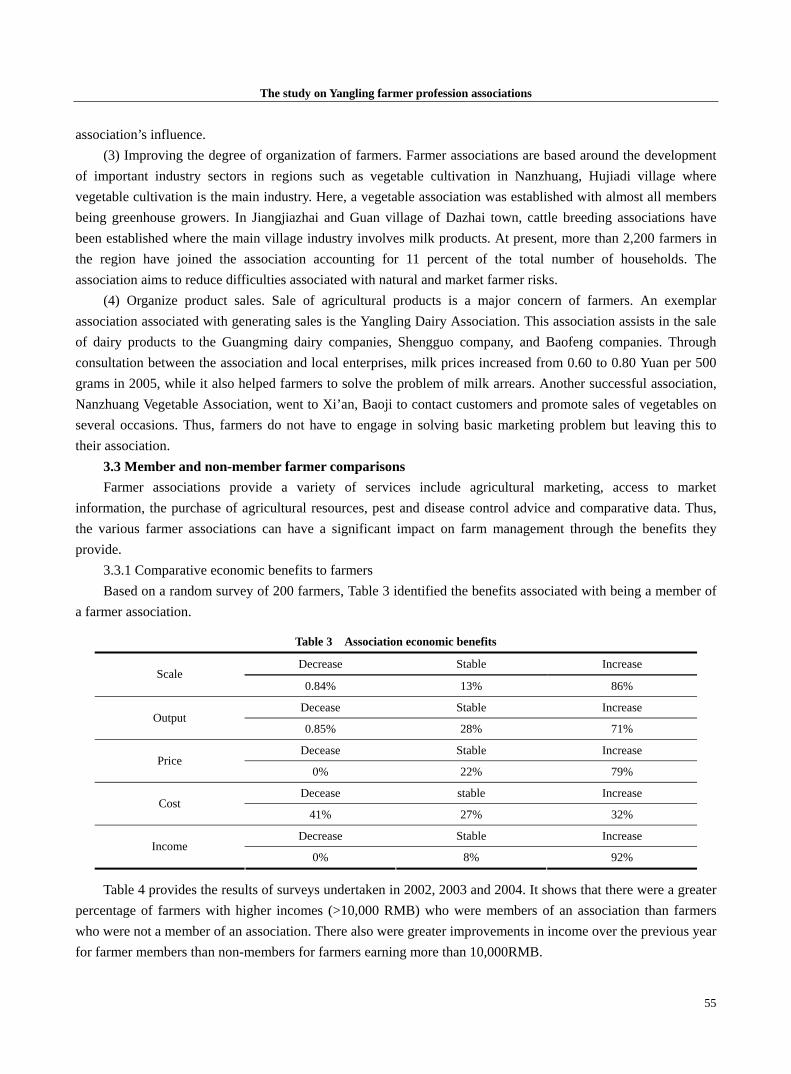
The study on Yangling farmer profession associations
55
association’s influence. (3) Improving the degree of organization of farmers. Farmer associations are based around the development
of important industry sectors in regions such as vegetable cultivation in Nanzhuang, Hujiadi village where vegetable cultivation is the main industry. Here, a vegetable association was established with almost all members being greenhouse growers. In Jiangjiazhai and Guan village of Dazhai town, cattle breeding associations have been established where the main village industry involves milk products. At present, more than 2,200 farmers in the region have joined the association accounting for 11 percent of the total number of households. The association aims to reduce difficulties associated with natural and market farmer risks.
(4) Organize product sales. Sale of agricultural products is a major concern of farmers. An exemplar association associated with generating sales is the Yangling Dairy Association. This association assists in the sale of dairy products to the Guangming dairy companies, Shengguo company, and Baofeng companies. Through consultation between the association and local enterprises, milk prices increased from 0.60 to 0.80 Yuan per 500 grams in 2005, while it also helped farmers to solve the problem of milk arrears. Another successful association, Nanzhuang Vegetable Association, went to Xi’an, Baoji to contact customers and promote sales of vegetables on several occasions. Thus, farmers do not have to engage in solving basic marketing problem but leaving this to their association.
3.3 Member and non-member farmer comparisons Farmer associations provide a variety of services include agricultural marketing, access to market
information, the purchase of agricultural resources, pest and disease control advice and comparative data. Thus, the various farmer associations can have a significant impact on farm management through the benefits they provide.
3.3.1 Comparative economic benefits to farmers Based on a random survey of 200 farmers, Table 3 identified the benefits associated with being a member of
a farmer association.
Table 3 Association economic benefits
Decrease Stable Increase Scale
0.84% 13% 86%
Decease Stable Increase Output
0.85% 28% 71%
Decease Stable Increase Price
0% 22% 79%
Decease stable Increase Cost
41% 27% 32%
Decrease Stable Increase Income
0% 8% 92%
Table 4 provides the results of surveys undertaken in 2002, 2003 and 2004. It shows that there were a greater percentage of farmers with higher incomes (>10,000 RMB) who were members of an association than farmers who were not a member of an association. There also were greater improvements in income over the previous year for farmer members than non-members for farmers earning more than 10,000RMB.
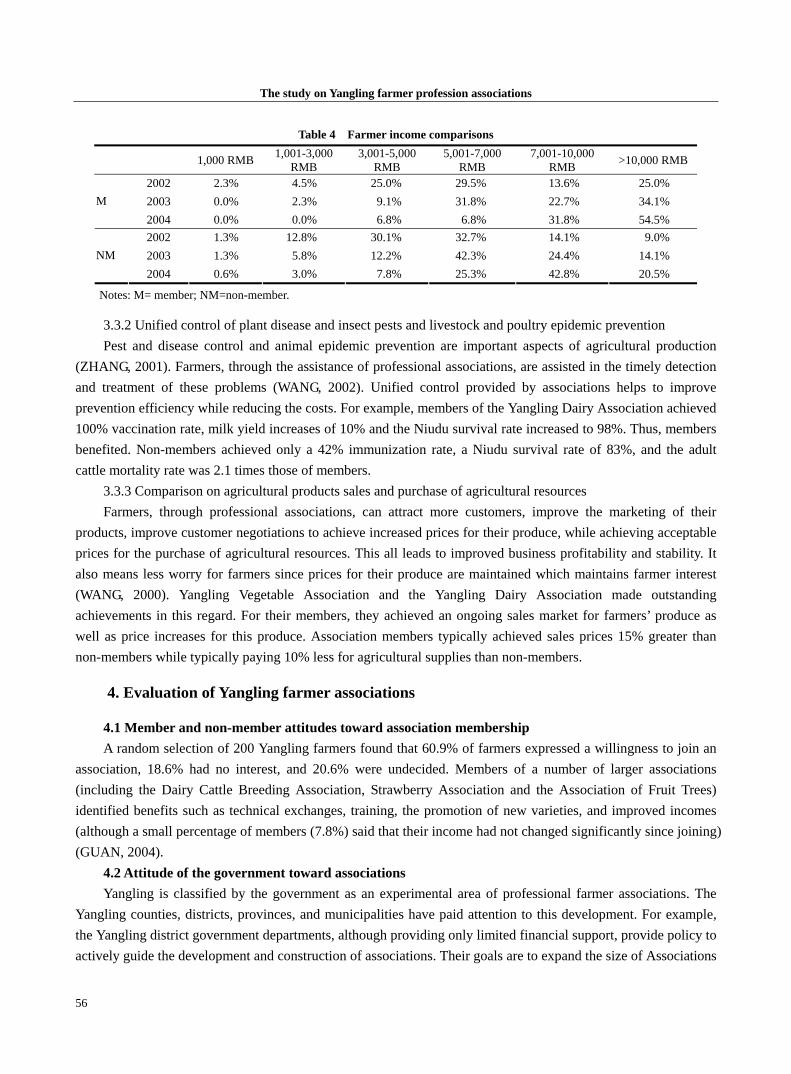
The study on Yangling farmer profession associations
56
Table 4 Farmer income comparisons
1,000 RMB 1,001-3,000 RMB
3,001-5,000 RMB
5,001-7,000 RMB
7,001-10,000 RMB >10,000 RMB
2002 2.3% 4.5% 25.0% 29.5% 13.6% 25.0% 2003 0.0% 2.3% 9.1% 31.8% 22.7% 34.1% M 2004 0.0% 0.0% 6.8% 6.8% 31.8% 54.5% 2002 1.3% 12.8% 30.1% 32.7% 14.1% 9.0% 2003 1.3% 5.8% 12.2% 42.3% 24.4% 14.1% NM 2004 0.6% 3.0% 7.8% 25.3% 42.8% 20.5%
Notes: M= member; NM=non-member.
3.3.2 Unified control of plant disease and insect pests and livestock and poultry epidemic prevention Pest and disease control and animal epidemic prevention are important aspects of agricultural production
(ZHANG, 2001). Farmers, through the assistance of professional associations, are assisted in the timely detection and treatment of these problems (WANG, 2002). Unified control provided by associations helps to improve prevention efficiency while reducing the costs. For example, members of the Yangling Dairy Association achieved 100% vaccination rate, milk yield increases of 10% and the Niudu survival rate increased to 98%. Thus, members benefited. Non-members achieved only a 42% immunization rate, a Niudu survival rate of 83%, and the adult cattle mortality rate was 2.1 times those of members.
3.3.3 Comparison on agricultural products sales and purchase of agricultural resources Farmers, through professional associations, can attract more customers, improve the marketing of their
products, improve customer negotiations to achieve increased prices for their produce, while achieving acceptable prices for the purchase of agricultural resources. This all leads to improved business profitability and stability. It also means less worry for farmers since prices for their produce are maintained which maintains farmer interest (WANG, 2000). Yangling Vegetable Association and the Yangling Dairy Association made outstanding achievements in this regard. For their members, they achieved an ongoing sales market for farmers’ produce as well as price increases for this produce. Association members typically achieved sales prices 15% greater than non-members while typically paying 10% less for agricultural supplies than non-members.
4. Evaluation of Yangling farmer associations
4.1 Member and non-member attitudes toward association membership A random selection of 200 Yangling farmers found that 60.9% of farmers expressed a willingness to join an
association, 18.6% had no interest, and 20.6% were undecided. Members of a number of larger associations (including the Dairy Cattle Breeding Association, Strawberry Association and the Association of Fruit Trees) identified benefits such as technical exchanges, training, the promotion of new varieties, and improved incomes (although a small percentage of members (7.8%) said that their income had not changed significantly since joining) (GUAN, 2004).
4.2 Attitude of the government toward associations Yangling is classified by the government as an experimental area of professional farmer associations. The
Yangling counties, districts, provinces, and municipalities have paid attention to this development. For example, the Yangling district government departments, although providing only limited financial support, provide policy to actively guide the development and construction of associations. Their goals are to expand the size of Associations

The study on Yangling farmer profession associations
57
and for them to play a leading role in radiation, the better serve the broad masses of farmers. Several of the larger, stronger potential for the development of the association, a focused strategy of support to the smaller associations provide policy guidance and organize the exchange of experience and technical training.
4.3 Yangling association leadership The survey revealed that farmers hold democratic elections for association leadership. Attitudes toward
elections vary depending on association size. Large-scale associations tend to be helped by government and the enthusiasm for leadership of these associations is generally higher than in smaller associations which tend to be more conservative. The Government believes that assistance from associations will reduce market risk and increase farmer income (Mackinnon & Ish, 2004).
5. Yangling farmer association problems
5.1 Largest obstacles: Small, scattered and uncoordinated There are two major problems that confront the various farmer associations. The first problem is that the
majority of smaller farmer associations are uninfluential. Most associations have several decades’ members. The exceptions are the Yangling Dairy Cattle Breeding Association, the Yangling District Strawberry Association the Yangling District Vegetable Association, and several fruit tree associations which tend to be larger scale.
A second problem is a lack of coordination and overlap across some associations. For example, there are five Dairy Associations and the vegetable and fruit tree associations undertake similar activities. All this results in a failure to coordinate and creates “clutter” in the market.
5.2 Nature of association is unclear Some of the associations act outside their powers (ultra vires). Norms on management can be unclear. Many
heads members of associations who do not know what rights they should have and what obligations they should do and what the associations can do and what they can’t do.
5.3 Incomplete organization and management system mechanisms It is important that there is a sound organizational structure and management system for the protection of
members (Barton, 2004). However, many Yangling farmer associations did not set up in accordance with, for example, the provisions of the General Assembly or the Governing Council. As such, their management systems are unsound. This deprives members of supervision and management decision-making powers and the right to not have a standardized constitution with appropriate rules and regulations.
5.4 Supervision and restraint mechanisms incomplete Farmer associations are non-profit and members do not have any residual claim (members cannot claim as
their own any property of an association) (Marion, 1985). Because there is a lack of supervision from overseeing bodies in many associations, some association managers may use their positions to pursue private interests. This make many members have no positivity to take part in associations’ activities. So many associations are only shape.
5.5 Narrow scope of business The majority of Yangling farmer associations have a relatively narrow business scope. This can include areas
of activity and restrictions in the villages and rural areas, and a focus on Chunnong Hu-particularly those engaged in traditional production rather than commodity production. Some are limited to the provision of quality seeds and seedlings and the dissemination of information. Some provide only individual services such as technical training. Others provide only market development, product marketing, and agricultural product processing services.

The study on Yangling farmer profession associations
58
6. Yangling farmer association countermeasures
6.1 Improvements in farmer association democracy There is a move toward a democratic management mechanism with “one person, one vote”. This approach
equates to equality and fairness. However, the “one person, one vote” approach is not the only model. The adoption of a weighted voting system as has been used in the United States is an alternative approach (Poole, Gomis, Igual & Gimenez, 1998). For example, the total amount of Gujin, in particular, the contribution of prominent members can lead to prominent member’s votes carrying more weight—Though their contributions should be limited (for example, having no more than 20% of the total votes of the right to vote).
A second democratic control mechanism is associated with membership of the general assembly. This is the highest organ of power. Once a year, the members of associations hold a congress with a 2/3 majority of members required.
6.2 Improvements in farmer association mechanisms for the distribution of interests Farmer associations generally adhere to the principle of distribution of profits to members based on the
volume of transactions. However, this approach ignores the fact that some members contribute more than others. Thus, the profit distribution should be made on the basis of other factors. These include “distribute dividend by shares” combined with the return of profits and the “one-two systems” format.
6.3 Clarity of property within the association of property rights Generally speaking, farmer association property consists of three parts. The first part is member or investor
shares; The second part is the accumulation of inputs; The third part is public property. However, no member can really exercise property ownership. Thus, members only enjoy dividends.
6.4 Farmers improve the market mechanism of associations Farmer associations in general only transact between members. The implementation of closed-end services
are not market-oriented and are not available to non-members to provide solidarity. However, with the commodity economy, the development of a market economy and the division of labour, there is a need to deepen cooperation amongst all farmers.
There are shackles of the traditional guidelines of development because in a modern market economy economic organization that cannot be closed from outside market development. Farmers must adhere to market-oriented membership services and the implementation of the commercialization business, and then foreign profits can not be questioned.
7. Conclusions
Yangling farmer associations have achieved quickly development than the past. However, there are many problems in their developing, for example, most associations are small, scattered and uncoordinated; The associations’ nature of association is unclear; the associations’ supervision and restraint mechanisms are incomplete; etc. In order to promote the development of Yangling farmer associations, the farmer associations democracy should be improved, and association mechanisms for the distribution of interests and market mechanism of associations should be done better, and more agricultural economic management experts should help the associations to manage the associations.
(to be continued on Page 64)
June 2010, Volume 9, No.6 (Serial No.84) Chinese Business Review, ISSN 1537-1506, USA
59
SWOT analysis of the Shanxi agriculture intellectual property rights
SHI Xue-qiao (College of Economics and Management, North University of China, Taiyuan 030051, China)
Abstract: In the development of agricultural intellectual property in Shanxi Province, obvious “advantages” including significant resources and a good foundation are accompanied by beneficial “opportunities”, i.e., Shanxi regards the development of distinctive agriculture and dominant agricultural products as an important direction for economic restructuring in agriculture, with unprecedented support. But, at the same time, “weaknesses” and “threats” thereof will be “fatal simultaneous bottlenecks”. Shanxi provincial governments at all levels should “pave the way” for a positive policy and regulatory platform, exert the three effects of agricultural products in innovation, brand and the leading position, and constantly promote the development of agricultural intellectual property rights.
Key words: SWOT; agricultural intellectual property rights; geographical indications
1. Raising the problem
Central Rural Work Conference in 2010 proposed to “firmly strengthen the fundamental standpoint, i.e., the “three rural issues”, and firmly grasp the important focal point, i.e., promoting the allocation of resources towards the rural areas”. In Shanxi Province’s Rural Work Conference, the general requirement for the provincial agricultural and rural work in 2010 was proposed to “... thoroughly implement the scientific concept of development, regard the urban and rural development as a fundamental requirement, and consider the development of modern agriculture as a major task”. Distinct agricultural products possess comparative advantages and potential advantages. Agricultural intellectual property such as geographical indication protection of agricultural products is deeply linked with “three rural issues” (YIN, GUO & GUO, 2007). How to promote the development of agricultural products through agricultural intellectual property has been a recent issue which Shanxi is facing currently. The paper makes an overall analysis of the current situation of Shanxi agricultural intellectual property rights using the SWOT method.
2. SWOT analysis for agricultural intellectual property development in Shanxi
2.1 Strength 2.1.1 Obvious strengths in resources Shanxi Province is rich in distinctive agricultural products, and it is the most favorable area for development
of intellectual agricultural property rights as it has an obvious advantage in resources. Shanxi Province’s traditional agricultural products show the following three major features: Firstly, variety—According to a survey carried out by authorities, there are as many as 580 varieties of agricultural products; Secondly, wide distribution—agricultural products are widely distributed in virtually every county and city; Thirdly,
SHI Xue-qiao, professor, College of Economics and Management, North University of China; research fields: intellectual property rights and regional economic development, intellectual property rights and innovation.

SWOT analysis of the Shanxi agriculture intellectual property rights
60
fruitfulness—According to statistics, in 2008, Shanxi Province had a total output of 3.4 billion kilograms of fruit, including apple production of 2.23 billion kilograms, ranking third all over the country; jujube 0.2 million kilograms, ranking third; Walnut 0.06 billion kilograms, ranking third as well.
The Shanxi livestock like meat, eggs and milk production have also had considerable share of the overall livestock products in the nation.1 In particular, the following 4 distinctive agricultural products have important positions in the domestic market.
(1) Grains. Statistically in 2006, 3.2481 million mu (15mu=1hectare) of foxtail millet area, ranked first in nation, with 381.9 thousand tons of production, ranked second in nation. As for sorghum, 578.3 thousand mu of area with 112 thousand tons of output, both ranked sixth in nation. Oats, millet, buckwheat and bean production are all topping the whole country.2
(2) Dried and fresh fruit. Shanxi is located within an optimum cultivation area for the production of jujube walnuts but also within an optimum ecological region for the production of high-quality apples and other dried fruits.
Moreover, Shanxi has stepped into the list of China’s most important agricultural areas, and it is one of five main provinces for jujube production, which playing an important role in the country’s production of jujube.
More than 80 out of the total of 111 counties covering jujube distribution, Linxian county, has the national largest production base, but also been named as the “Home of jujube” by the State Forestry Administration.
Fenyang city’s annual walnut output exceeds 2,500 tons, ranking first across the nation, one of the largest distributing centers of walnuts with the largest export base.
Yuncheng city’s juice production has reached 300 thousand tons, accounting for one quarter of that of the whole nation.
Linyi county has the world’s largest production base of fruit juice concentrate with 10 million tons of annual output, accounting for the national 1/10 and the world’s 1/16.3
(3) Vegetables. At the end of 2008, there were 18 counties with more than 100 thousand mu of annual vegetables planted in Shanxi Province, and 136 townships with more than 10 thousand mu of the annual vegetables planting.4
A number of varieties thereof are in a pivotal situation, such as asparagus. According to statistics, as of the end of 2009, Shanxi Province has developed an export asparagus planting area of up to 180 thousand mu, involving more than 20 cities and counties across the province, becoming the world’s largest asparagus cultivation, production, processing and export base. Especially during the five-year period from 2003 to 2007, Shanxi asparagus maintained a good situation for production and exports, with an annual of 30 thousand-ton export volume, accounting over 40% of the national canned asparagus export volume.5
(4) Chinese herbal medicine. Due to Shanxi’s complex topography, landforms, climate, hydrology and soil’s conditions, it is a suitable place for the plantation of Chinese herbal medicines and has become China’s major province in herbal medicine production. Shanxi’s total amount of its resources and production thereof are both topping across the nation. The annual output of medicinal herbs such as codonopsis, astragalus, forsythia, huangqi,
1 Shanxi distinctive agricultural products are rising. Shanxi Economic Daily, October 22, 2009. 2 LI, Y. Y.. (2007). How to get out of narrow lane for development for Shanxi grain. Shanxi Agriculture, 10, 23-25. 3 Retrieved from http://www.sxgov.cn. 4 Retrieved from http://www.xinhuanews.com and Shanxi Daily, October 22, 2009. 5 Retrieved from http://www.cqn.com.cn/.

SWOT analysis of the Shanxi agriculture intellectual property rights
61
bupleurum, polygalaceae and anemarrhena covers 30%-45% of the state’s total annual consumption. 2.1.2 Good foundation for development Since 1990s, Shanxi Province has put the development of special agriculture as the main focus of the
adjustment of the agricultural economic structure, and regarded grains, grazing livestock, fruits and vegetables as the four main characteristic industries, focusing on building three major advantageous agricultural areas: Yanmenguan ecological animal husbandry economic zone, Central-and southern-area pollution-free fruit and vegetable industry zone, and Mountainous-area cereals and dried fruits industry zone. In 2007, Shanxi Province established the “eleventh five-year plan on the development of processing industry of farming and animal products”, putting forward the idea of building nine main industrial chains for agriculture industrialization. In 2008, the Shanxi Provincial Party Committee proposed “Four Plans” and “Six Projects” to promote modern agriculture, vigorously implementing the leading enterprise incubation program, the key construction projects of leading enterprises. In 2007, Shanxi Province demonstration of base construction on advantageous agricultural products was officially launched, selecting 33 counties for key construction projects based on their natural resources, forming a series of characteristic farming and animal husbandry bases. Currently Shanxi Province has built a number of leading enterprises for agricultural product processing and characteristic agriculture base, initially forming the three major modern agriculture demonstration zones.
2.2 Weakness Generally speaking, the situation of Shanxi agricultural intellectual property rights doesn’t allow for much
optimism. 2.2.1 Fewer number of agricultural intellectual property rights Because geographical indication as intellectual property rights in agriculture is divided into 10 categories,
and 307 items are related to agricultural products, accounting for 95% of the total, it is the intellectual property rights most closely linked with the “three rural issues”. Let us take the geographical indication for an example, to compare the central six provinces (see Table 1).
Table 1 Comparison on geographical indication of central six provinces
Province Shanxi Anhui Henan Hunan Hubei Jiangxi
General administration of quality supervision (377 geography indications, July 2005-June 2009) 7 7 20 11 28 14
State Trademark Bureau (666 certification marks) 8 16 14 28 19 24 Ministry of Agriculture (360 geographical indications for agricultural products) 22 3 13 14 17 24
Notes: As of June 2009, December 2009, June 2010 separately for geography indications, certification marks, geographical indications for agricultural products.
Date source: www.npgi.com.cn, www.sbj.saic.gov.cn, www.aqsc.gov.cn.
As can be seen from Table 1, except for the number of geographical indications of agricultural products in the central six provinces in the first, the other two are minimal. This is because the main advantages haven’t been played out, while the disadvantages have exerted great adverse impact.
2.2.2 Single method for intellectual property protection Shanxi’s intellectual property protection in agricultural products in new plant varieties, trademarks, patents,
trade secrets, firms and so on, is not enough. One reason for this is due to the agricultural products themselves. Agricultural production cannot be refined, hence the industry chain is not complete, and the complete intellectual

SWOT analysis of the Shanxi agriculture intellectual property rights
62
property system is difficult to form. The other reason is the mindset of grassroots agricultural producers for intellectual property protection and an indifferent sense of rights.
2.2.3 Few laws and regulations and inadequate support Shanxi Province has not introduced local policies and regulations with regards to protection of agricultural
intellectual property, which will adversely affect its works on agricultural technology innovation and protection of agricultural intellectual property. Furthermore, there’s a lack of supporting policies for Shanxi’s export enterprises on agricultural products from the national authorities and the provincial authority, apart from Shanxi Inspection and Quarantine Bureau.
2.3 Opportunity Before obtaining intellectual property protection, agricultural products processing can only be in the hands of
workshop stage. However, with agricultural trademarks, geographical indications and other intellectual property protection is expected to scale operations. Building integrated agricultural industry mode from planting, primary processing to manufacturing, optimizing agricultural trademarks and geographical indications, and strengthening the protection of new plant varieties, can promote the development of characteristic agriculture and ecological agriculture. In 2009, Shanxi Province promulgated the “Shanxi Provincial People’s Government Views on Making Agricultural Product Processing Enterprises Bigger and Stronger”, implementing the “513 project”, i.e., in accordance with the principle of provincial, municipal, and county levels overall planning, sub-level progress, supporting fiscal points, respectively selecting 50, 100, 300 leading enterprises as a provincial-level echelon with emphasized cultivating, a municipal-level echelon and a county-level echelon with nurturing and guidance, through supporting these enterprises, focusing on creating Shanxi Province’s eight industrial chains such as food, livestock, dairy products, fruit, vegetables, potato, oil, Chinese herbal medicine.6 Shanxi’s key points in restructuring plan for agricultural development are to develop Shanxi’s distinctive agriculture and advantageous agricultural products, which will provide very favorable opportunities for agricultural growth.
2.4 Threat As reckoned above, agricultural intellectual property is influenced by agricultural products, but factors
influencing agricultural products exist in lots of aspects. The current financial crisis is curbing the healthy development of the entire economy, especially agricultural development. In international trade, many countries have raised the threshold for imports of Chinese agricultural products. For example, health standards and technical standards of the European Union and Japan were strict, even almost harsh. However, many agricultural products processing enterprises in Shanxi Province found that it is difficult to achieve their standards in health conditions and technologies in the short term. In domestic market, on the one hand, Food Safety Law coming into operation on June 1, 2009, puts forward higher requirements in food safety for provincial SMEs, while Shanxi enterprises in agricultural products processing, mainly SMEs, are undoubtedly facing fierce challenge; On the other hand, the rapid development of other province’s distinctive agricultural products is bound to put pressure on Shanxi Province.
3. Countermeasures to promote the development of Shanxi agricultural intellectual property rights
According to the above analysis, we can see that Shanxi has favorable “opportunities” and obvious 6 Retrieved from http://www.shanxinewsnet.com.

SWOT analysis of the Shanxi agriculture intellectual property rights
63
“strengths” in development of agricultural intellectual property rights, but “weaknesses” and “threats” could be an adverse “bottleneck” for the development of agricultural intellectual property rights in Shanxi. We think that we should focus on “SO” strategy, complemented by WT strategy, expanding advantages, exploiting opportunities, overcoming weaknesses and eliminating threats. Through building a platform, making full use of the following three effects, we should constantly promote the development of Shanxi agricultural intellectual property rights.
3.1 Building a platform The government must change its function, do a better job in planning, guidance, support and protection for
agricultural intellectual property rights, and set up a platform for policies and regulations. First, we must publicize local policies or regulations on protection of agricultural intellectual property as soon as possible, such as regulations on protection of geographical indications, regulations of promotion of new plant varieties; Second, the government should give vigorous support and guidance. Works on protection of agricultural intellectual property have been started later than in developed provinces, with incomplete service system for intellectual property, and less guidance from governments. “Shanxi Province People’s Government’s View on Making Agricultural Product Processing Enterprises Bigger and Stronger” pointed out that 450 agricultural product processing enterprises will be especially supported in the financial capital, finance, tax and other key aspects, which will be the best agricultural policy platform, but the key issue is how to put the so-called “key support and preferential terms” into effect.
3.2 Exerting the three effects (1) Innovation effect The level of development of agricultural products in Shanxi Province presents “three more three less”
features, i.e., more primary products, less processed goods, more traditional products, less innovative products, more single products, less derivatives, which is mainly due to low capability in technological innovation of the majority of agricultural processing enterprises in Shanxi Province and the low technical content of their products. First, we must rely on the relevant universities and institutes to do targeted R&D on “513 project” on grain, livestock, dairy, fruits, vegetables, potatoes, oil, traditional Chinese medicine eight industry chains, products with urgent need to develop international markets such as asparagus tea, asparagus drinks, medicine and health products, or derivatives, to improve value-added products and recycling capabilities. Second, we must support the agricultural processing enterprises in Shanxi Province to set up R & D institutions so that more and more enterprises can own independent intellectual property rights.
(2) Brand effect Shanxi agricultural products suffer from lack of brands, even with rich types and large quantities. Although
the asparagus industry in Shanxi Province has 10-year history, the asparagus processing companies are all foreign-invested enterprises, local enterprises are almost with no license, no international orders, no product brands, low economic efficiency. Up to January 2010, Shanxi Province has had only 7 national well-known trademarks relevant to agriculture out of 39. It is obvious that Shanxi hasn’t yet exerted its competitive advantage and market advantage in distinctive agricultural products which derive from their famous features. Therefore, Shanxi should actively develop products with geographical indications, agricultural products trademarks and so on, create Shanxi’s own brands in agricultural products, and change advantages in resources into that in brands and competition.
(3) Leading enterprises effect According to statistics from the office of Shanxi agricultural industry, in 2008 agricultural products
SWOT analysis of the Shanxi agriculture intellectual property rights
64
processing enterprises in Shanxi Province were up to a total of 3,836, with 43.9 billion yuan of assets and 39.8 billion yuan of sales income, of which 25 enterprises had investments of over 100 million yuan, less than 600 enterprises over 50 million yuan, and the majority were small-scale enterprises with annual sales income below 5 million yuan.
Overall, small quantity, small scale and separate layout are three obvious features of leading enterprises. Most of the agricultural exporting enterprises lack their own agricultural production bases, and their raw materials are mainly supplied by farmers. Therefore, we should focus on cultivating agricultural products processing enterprises, to promote small and medium agro-processing enterprises, and professional cooperative units. Shanxi Province has developed three-level overall planning (province-city-country), and worked out development goals to make 450 agricultural product processing enterprises bigger and stronger, and encourage resource-based enterprises to transform and absorb outer capitals, which is a very useful trial, but will take time to be tested.
References: LIU, G.. (2008, December 21). Shanxi agricultural products breaking through international markets. Chinese Commercial New. WU, J. P.. (2009, April 28). Shanxi agricultural products export encountering four major “bottlenecks”. Shanxi Peasant News. YAN, G. Z. & WANG, F. H.. (2009). Shanxi implementing 513 project, promoting agricultural leading enterprises bigger and
stronger. Retrieved October 30, 2009 from http://news.qq.com/a/20091030/001423.htm. YIN, H. S., GUO, F. H. & GUO, Z.. (2007). The current situation and strategy on Shanxi distinctive agricultural products. Journal of
Shanxi Agricultural Science, 35(1), 8-10.
(Edited by Ruby and Chris)
(continued from Page 58)
References: Barton, D. G.. (2004). Agricultural cooperatives: An American economic and management perspective. International Symposium on
Institutional Arrangements and Legislative Issues of Farmer Cooperatives. May 13-18, 2004, Taizhou, Zhejiang, China. GUAN, C. Y.. (2004). Selection of economic cooperative mode to develop villages, China Cooperative Economic, 4, 9-10. Mackinnon, M. P. & Ish, D.. (2004): A model of Government-stakeholder collaboration: New Canadian federal cooperative
legislation. International Symposium on Institutional Arrangements and Legislative Issues of Farmer Cooperatives, May 13-18, Taizhou, Zhejiang, China.
Marion, B. W.. (1985). The organization and performance of the U.S food system. Lexington MA: Lexington books. Poole, N. D., Gomis, D. C., Igual, J. & Gimenez, F. V.. (1998). Formal contracts in fresh produce markets. Food Policy, 23(2),
131-142. WANG, Z. B.. (2000). Agricultural management model and conversion tendency of developed countries. World Agriculture, 6, 3-5. WANG, Z.B.. (2002). Research on model of china agriculture management. China Scientific Culture Press, 130-140. ZHANG, X. J.. (2001). Historical contribution of the Japanese Agricultural Association, existing problems and tendency. China Rural
Economics, 3, 13-17.
(Edited by Ruby and Chris)