volume ii: advanced technology maturity assessment...grid architecture. volume ii, “advanced...
TRANSCRIPT

MODERN DISTRIBUTION GRID: VOLUME I │ 0
MODERN DISTRIBUTION GRID
Volume II: Advanced Technology
Maturity Assessment
Version 1.1
March 27, 2017
MODERN DISTRIBUTION GRID: VOLUME I │ 1
ACKNOWLEDGMENTS Modern Distribution Grid Report, Volume II was sponsored by the U.S. Department of Energy’s (DOE)
Office of Electricity Delivery and Energy Reliability (OE) and the Office of Energy Policy and Systems
Analysis (EPSA). This report was developed at the request and with guidance from the California Public
Utilities Commission (CPUC), the New York Public Service Commission (NYPSC), the District of Columbia
Public Service Commission (DCPSC), the Hawaii Public Utilities Commission (HPUC) and the Minnesota
Public Utilities Commission (MPUC). The cognizant project leads are Joe Paladino, a Technical Advisor
within the DOE-OE’s Transmission Permitting and Technical Assistance Division, Merrill Smith, a Program
Manager for DOE-OE, and Thomas Pearce, a Senior Policy Advisor within the DOE-EPSA Office of State,
Local, and Tribal Policy Analysis. The co-project managers of the next generation distribution system
platform (DSPx) initiative are Paul De Martini, Newport Consulting, and Jeffrey Taft, Pacific Northwest
National Laboratory (PNNL).
This volume was principally developed by Paul De Martini and the ICF team of Surhud Vaidya, Rick Geiger,
Paul Duncan, Brenda Chew and Annie Howley. Material contributions were also provided by the PNNL
and National Renewable Energy Laboratory (NREL) Grid Modernization Lab Consortium distribution
planning project team, the Electric Power Research Institute (EPRI) and Chuck Newton of Newton-Evans
Research.
Guidance and review of this report were provided by the DSPx Core Team, which includes: Tim Heidel,
formerly Advanced Research Projects Agency-Energy (ARPA-e); Ron Melton, PNNL and GridWise
Architecture Council; Donna Attanasio, Energy Law Programs at George Washington University; Jay
Griffin, Hawaii Natural Energy Institute, Matthew Tisdale, More Than Smart and Carolyn Brouillard, ICF.
Core Team would also like to thank industry experts from the following organizations for participating in
the review webinars and providing feedback on Volume II:
❖ Advanced Microgrid Solutions
❖ Arizona Public Service (APS)
❖ AVANGRID
❖ California Independent System Operator (CAISO)
❖ Cisco Systems
❖ Consolidated Edison
❖ Electric Reliability Council of Texas (ERCOT)
❖ Edison Electric Institute (EEI)
❖ General Electric (GE)
❖ Grid Modernization Laboratory Consortium (GMLC)
❖ Hawaiian Electric Company (HECO)
❖ Institute of Electrical and Electronics Engineers (IEEE)
❖ Integral Analytics
❖ New York Independent System Operator (NYISO)
❖ NRG Energy
❖ Pacific Gas & Electric (PG&E)
❖ Pepco Holdings, an Exelon Company
❖ Southern California Edison (SCE)
❖ San Diego Gas & Electric (SDG&E)
❖ Smart Electric Power Alliance (SEPA)
❖ Smarter Grid Solutions
❖ SolarCity
❖ Xcel Energy

MODERN DISTRIBUTION GRID: VOLUME I │ 2
DISCLAIMER This report was prepared as an account of work sponsored by an agency of the United States Government.
Neither the United States Government nor any agency thereof, nor any of their employees, makes any
warranty, express or implied, or assumes any legal liability or responsibility for the accuracy,
completeness, or usefulness of any information, apparatus, product, or process disclosed, or represents
that its use would not infringe privately owned rights. Reference herein to any specific commercial
product, process, or service by trade name, trademark, manufacturer, or otherwise, does not necessarily
constitute or imply its endorsement, recommendation, or favoring by the United States Government or
any agency thereof. The views and opinions of authors expressed herein do not necessarily state or reflect
those of the United States Government or any agency thereof.

MODERN DISTRIBUTION GRID: VOLUME II │ 3
TABLE OF CONTENTS ACKNOWLEDGMENTS ........................................................................................................................1
DISCLAIMER .......................................................................................................................................2
TABLE OF CONTENTS ...........................................................................................................................3
GLOSSARY .........................................................................................................................................5
1. MAPPING OF TECHNOLOGY TO FUNCTIONS AND ELEMENTS ........................................................9
1.1. Overview ....................................................................................................................................... 9
1.1.1. Distribution System Planning ....................................................................................... 10
1.1.2. Distribution Grid Operations ........................................................................................ 13
1.1.3. Distribution Market Operations ................................................................................... 15
2. TECHNOLOGY ADOPTION ASSESSMENT ..................................................................................... 16
2.1. Distribution System Planning ...................................................................................................... 18
2.1.1. Forecasting ................................................................................................................... 18
2.1.2. Power Flow Analysis ..................................................................................................... 21
2.1.3. Power Quality Analysis ................................................................................................. 25
2.1.4. Fault Analysis ................................................................................................................ 27
2.1.5. Advanced Optimization ................................................................................................ 30
2.2. Distribution Grid Operations....................................................................................................... 32
2.2.1. Distributed Resource Management ............................................................................. 32
2.2.2. Field Automation .......................................................................................................... 36
2.2.3. Substation Automation ................................................................................................ 41
2.2.4. Operational Communications Infrastructure ............................................................... 44
2.2.5. Sensing and Measurement ........................................................................................... 52
2.2.6. Operational Analytics ................................................................................................... 56
2.2.7. Optimization Analytics .................................................................................................. 60
2.3 Distribution Market Operations .................................................................................................. 62
2.3.1 Distribution Operational Market ....................................................................................... 62
3. SUMMARY ............................................................................................................................... 65
3.1. Overview ..................................................................................................................................... 65
3.2. Findings ....................................................................................................................................... 65
REFERENCES .................................................................................................................................... 68

MODERN DISTRIBUTION GRID: VOLUME II │ 4
INTRODUCTION
The U.S. Department of Energy is working with state regulators, the utility industry, energy services
companies and technology developers to determine the functional requirements for a modern
distribution grid that are needed to enhance reliability and operational efficiency, and integrate and utilize
distributed energy resources. The objective is to develop a consistent understanding of requirements to
inform investments in grid modernization. The requirements include those needed to support grid
planning, operations and markets.
This report represents Volume II of a three-volume set that is intended to support additional discussions
on evolving grid structure and function. Volume I, “Customer and State Driven Functionality,” provides a
taxonomy of functional requirements derived from state policy objectives, and includes a discussion of
grid architecture. Volume II, “Advanced Technology Maturity Assessment,” examines the maturity of
technology needed to enable the functions presented in Volume I. Volume III, “Decision Guide,” presents
considerations for the rational implementation of advanced distribution system functionality.
This volume contains a survey of current commercial technologies mapped against the functions
associated with distribution grid planning, operations and markets. Each technological category is
described briefly and assessed with respect to the level of market adoption. The purpose of Volume II is
to stimulate a discussion on the application of advanced technology and addressing the remaining
technological gaps.

MODERN DISTRIBUTION GRID: VOLUME II │ 5
GLOSSARY
Advanced Distribution Management Systems (ADMS) are software platforms that integrate numerous
operational systems, provide automated outage restoration, and optimize distribution grid performance.
ADMS components and functions can include distribution management system (DMS); demand response
management system (DRMS); automated fault location, isolation, and service restoration (FLISR);
conservation voltage reduction (CVR); and Volt-var optimization (VVO).1
Advanced Metering Infrastructure (AMI) typically refers to the full measurement and collection system
that includes meters at the customer site, communication networks between the customer and a service
provider, such as an electric, gas, or water utility, and data reception and management systems that make
the information available to the service provider.2 It is also referred to as a smart meter system. AMI
communications networks may also provide connectivity to other types of end devices such as distributed
energy resources (DER).
Customer Information System (CIS) is the repository of customer data required for billing and collection
purposes. CIS is used to produce bills from rate or pricing information and usage determinants from meter
data collection systems and/or manual processes.3
Customer Relationship Management (CRM) is a system that provides tools for documenting and tracking
all customer interactions. CRM also provides analytical tools to track and adjust marketing campaigns,
forecast participation rates, and move customers from potential participants to fully engaged customers.4
Conservation Voltage Reduction (CVR) is an operating strategy of the equipment and control system used
for VVO that reduces energy and peak demand by managing voltage at the lower part of the required
range.5
Demand Response Management System (DRMS) is a software solution used to administer and
operationalize DR aggregations and programs. Building on a legacy of telephone calls requesting load
reduction, DRMS uses a one-way or two-way communication link to effect control over and gather
information from enrolled systems, including some commercial and industrial loads, and residential
devices such as pool pumps, air conditioners and water heaters.6 DRMS allows DR capacity to be scaled in
a cost-effective manner by automating the manual events that are typically used to execute DR events, as
well as most aspects of settlement.
Distribution Management System (DMS) is an operational system capable of collecting, organizing,
displaying, and analyzing real-time or near real-time electric distribution system information. A DMS can
also allow operators to plan and execute complex distribution system operations to increase system
efficiency, optimize power flows, and prevent overloads. A DMS can interface with other operations
applications, such as geographic information systems (GIS), outage management systems (OMS), and CIS
to create an integrated view of distribution operations.7
Distributed Energy Resource Management System (DERMS) is a software-based solution that increases
an operator’s real-time visibility into the status of DER, and allows for the heightened level of control and
flexibility necessary to optimize DER and distribution grid operation.8 A DERMS can also be used to

MODERN DISTRIBUTION GRID: VOLUME II │ 6
monitor and control DER aggregations, forecast DER capability, and communicate with other enterprise
systems and DER aggregators.9
Distribution SCADA (DSCADA) is the application of supervisory control and data acquisition software to
the distribution grid. SCADA is defined below.
Energy Management System (EMS) is a system to monitor, control, and optimize the performance of the
transmission system and in some cases primary distribution substations.10 The EMS is the transmission
system’s analog to the DMS.
Fault Location, Isolation and Service Restoration (FLISR) includes the automatic sectionalizing, restoration
and reconfiguration of circuits. These applications accomplish distribution automation operations by
coordinating operation of field devices, software, and dedicated communications networks to
automatically determine the location of a fault, and rapidly reconfigure the flow of electricity so that some
or all customers can avoid experiencing outages.11 FLISR may also be known as Fault Detection, Isolation
and Restoration (FDIR).
Geographic Information System (GIS) is a software system that maintains a database of grid assets,
including transmission and distribution equipment, and their geographic locations to enable presentation
of the electric power system or portions of it on a map.12 GIS may also serve as the system of record for
electrical connectivity of the assets.
Global Positioning System (GPS) is a system of satellites and receivers that determines the position
(latitude, longitude and altitude) of a receiver on Earth.13 GPS is also used as a source of precision time
signals for device synchronization.
Internet Protocol (IP) Packet Communication uses IP digital protocol to handle data in variable length
packets that are routed digitally to their destinations asynchronously rather than making a fixed circuit
connection or relying on fixed time intervals.14
Land Mobile Radio System (LMRS) is a central radio communication system that provides voice and data
communications to a variety of endpoints including push-to-talk, walkie-talkies, and data modems for
digital devices. They operate on licensed radio frequencies.15
Microgrid Interface is the set of power electronics at the Point Of Interconnection (POI)1 between the
“island-able” portions of a grid, and the larger distribution grid, that support the essential microgrid16
functions of islanding and reconnection.17 The microgrid interface may also have the capability to provide
services to the macro grid including Volt-var control.18 As services are dropped from the distribution grid
side of the interconnection, the microgrid interconnect disconnects, and the microgrid continues to
provide service to critical loads in the islanded area.
Microwave Radio communications are high frequency radio systems that may be point-to-point or point-
to-multipoint systems. They are widely used for substation and SCADA communications.19
1 Transitions at the POI are managed by the microgrid controller, see IEEE p2030.7.

MODERN DISTRIBUTION GRID: VOLUME II │ 7
Optical Fiber communication systems send data via modulated light through a transparent glass or plastic
fiber. Optical fiber systems are capable of very high bandwidths and form the backbone of high capacity
communication systems.20
Outage Management System (OMS) is a computer-aided system used to better manage the response to
power outages or other planned or unplanned power quality events.21 It can serve as the system of record
for the as-operated distribution connectivity model, as can the DMS.
Peer-to-Peer Communication (P2P) may be a network service or standalone capability that permits two
devices to communicate with one another. As a network service, the central part of the system responds
to a request by providing each device the information and resource necessary to establish direct
communication. As a standalone capability, P2P becomes synonymous with point-to-point and is a
dedicated channel between devices.22
Reclosers are electro-mechanical devices that can react to a short circuit by interrupting electrical flow
and automatically reconnecting it a short time later. Reclosers function as circuit breakers on the feeder
circuit and are located throughout the distribution system to prevent a temporary fault from causing an
outage.23
Reliability Metrics24 are used to assess the operational performance of the distribution system in terms of
reliability and resilience. Some of the more commonly used metrics are:
• SAIDI (System Average Interruption Duration Index) – the total duration of interruptions for the
average customer during a given time period. SAIDI is normally calculated on either monthly or
yearly basis; however, it can also be calculated daily, or for any other time period.
• SAIFI (System Average Interruption Frequency Index) – the average number of outages a customer
experienced during a year.
• CAIDI (Customer Average Interruption Duration Index) – if a customer experienced an outage
during the year, the average length of time the customer was out of power, in hours.
• MAIFI (Momentary Average Interruption Frequency Index) – the average number of outages a
customer experienced during the year that are restored within five minutes.
Satellite Radio Frequency Communications is one of the services provided by the more than 2,000
communication satellites in orbit around the Earth. Satellites have the advantage of unobstructed
coverage requiring only a suitable ground station. Satellite radio is used in remote locations where the
construction of radio towers or other land-based infrastructure is cost-prohibitive.25
Supervisory Control and Data Acquisition (SCADA) is a system of remote control and telemetry used to
monitor and control the transmission system.26
Time Division Multiplex Communication (TDM) is a method of transmitting and receiving independent
signals over a common signal path by means of synchronized switches at each end of the transmission
line so that each signal appears on the line for a fraction of time in an alternating pattern. This form of
signal multiplexing was developed in telecommunications for telegraphy systems in the late 19th century,
but found its most common application in digital telephony in the second half of the 20th century.27

MODERN DISTRIBUTION GRID: VOLUME II │ 8
Worldwide Interoperability for Microwave Access (WiMAX) is a standards-based radio technology
enabling the delivery of wireless broadband access to system end points.28
Wireline Communication is communication using twisted pair or coaxial cable as the transport medium.
Some usages of “wireline” include optical fiber to distinguish from wireless (radio) communication. Use
of the physical wire, coax, or fiber in communications can be any of a wide range of technologies including
analog, digital, TDM, or IP technologies. 29

MODERN DISTRIBUTION GRID: VOLUME II │ 9
1. MAPPING OF TECHNOLOGY TO FUNCTIONS
AND ELEMENTS
1.1. OVERVIEW
Volume II provides an overview of key technologies that will be necessary for the operation of the modern
distribution grid to ensure reliable, safe operation while enabling customer choice and increasing
integration of DER. Commissions and industry can use Volume II to identify distinct technology categories,
systems, analytics, and tools as they embark on grid modernization and DER integration activities within
their jurisdictions.
The technology groupings and hierarchical structures identified herein result from research performed by
the Core Team, as well as discussions and input from stakeholders in the initiative. In the following
sections, technologies are organized into “technology categories” within the three broad functional areas
described in Volume I: 1) Distribution System Planning, 2) Distribution Grid Operations, and 3) Distribution
Market Operations. These groupings are illustrated in the form of a relational hierarchy. While this
structure is used to simplify the presentation in this volume, several of the technologies identified may
support multiple functions across the three areas. The one-to-many functional relationships are discussed
further in Volume III, “Decision Guide.”
The following information is provided for each technology category: a) definition of the identified
technologies, b) assessment of the current state of the respective technology’s adoption on the U.S.
distribution grid, and c) identification of technology gaps associated with supporting the functionalities
covered in Volume I.
In the following diagrams, each technology category is named and connected via a colored line to one of
the three functional areas. Within each technology category, specific grid modernization technologies are
listed to the right and connected by same-colored lines.

MODERN DISTRIBUTION GRID: VOLUME II │ 10
1.1.1. Distribution System Planning
Distribution system analysis tools and technologies are identified within their respective technology
categories in Chapter 2. Section 2.1 assesses the technologies required by the functional elements of
Distribution System Planning described in Volume I.2 A discussion of the capital budgeting and
expenditures required to acquire or develop these planning technologies is not within the scope of this
report. Furthermore, not all of the technologies mentioned below are required to conduct a distribution
system planning analysis. These analyses vary based on the electrical topography of a region and reliability
and service requirements among other reasons. The mapping below in Figure 1 groups relevant
technologies, in order for them to be responsive to the functions and elements presented in Volume I:
Figure 1: Distribution System Planning
For context, the functions in Volume I and the technology categories described in this volume are mapped
to an overall planning process. An Integrated Distribution Planning (IDP) framework30 as discussed in
several states includes the functional components illustrated in Figure 2 below.
2 See Section 5.1, Distribution System Planning

MODERN DISTRIBUTION GRID: VOLUME II │ 11
Figure 2: Integrated Distribution Planning
Current Distribution System Assessment
An assessment of current feeder and substation reliability, condition of grid assets, asset loading and
operations is needed, along with a comparative assessment of current operating conditions against prior
forecasts of load and DER adoption. The following technology categories map to this functional area:
• Power Flow Analysis,
• Power Quality Analysis, and
• Fault Analysis.
Multiple DER and Load Scenario Forecasts
The uncertainty of the types, amount, and pace of DER expansion make singular deterministic forecasts
ineffective for long-term distribution planning. Also, the changing nature of customer demand and related
net demand requires more granularity than in the past. Additionally, the use of multiple DER growth and
demand scenarios is recognized as beneficial. The following technology categories map to this functional
area:
• Forecasting.

MODERN DISTRIBUTION GRID: VOLUME II │ 12
Hosting capacity
Hosting capacity methods3 quantify the engineering factors that increasing DER penetration introduces
on the grid within three principal constraints: thermal, voltage/power quality, and protection limits. These
methods can be applied to interconnection studies and long-term distribution planning. Hosting capacity
utilizes a combination of tools identified above and the following specialized tools:
• Advanced Optimization.
Interconnection Studies and Procedures
Interconnection engineering studies utilize the tools in the categories above and are expected to use the
following specialized tools as variable DER adoption increases:
• Dynamic Analysis.
Annual Long-term Distribution Planning
The annual distribution planning effort involves two general efforts: 1) multiple DER and load forecast
scenario-based studies of distribution grid impacts leveraging a combination of the tools above to identify
“grid needs,” and 2) a solutions assessment including potential operational changes to system
configuration, needed infrastructure replacement, upgrades and modernization investments, and
potential for non-wires alternatives.
Integrated Resource, Transmission and Distribution Planning
At high levels of DER adoption, the net load characteristics on the distribution system can have material
impact on the transmission system and bulk power system operation.4 Today, distribution planning is
typically done outside the context of integrated resource planning and transmission planning. To the
extent DER is considered in resource and transmission planning, it is essential to align those DER growth
patterns, timing and net load shape assumptions and plans with those used for distribution planning. Over
the next five-year scope of this volume, an integrated transmission and distribution planning tool is not
expected to be available. Instead, an iterative process between resource, transmission and distribution
planning is beginning to be employed.
3 Staff, The Integrated Grid: A Benefit-Cost Framework, EPRI, 2015, and T. Lindl, et al., Integrated Distribution Planning Concept
Report, Interstate Renewable Energy Council, Inc. and Sandia National Laboratory, 2013. 4 “Net load” here refers to the amount of load that is visible to the TSO at each T-D interface, which can be expected to be much
less than the total or gross end-use consumption in local areas with high amounts of DERs. The term “net load” is also used at the transmission system level to refer to the total system load minus the energy output of utility-scale variable renewable generation, as illustrated by the CAISO’s well known “duck curve.” In this report we are focusing mainly on the first sense of the term—i.e., the impact of DERs on the amount of load seen at each T-D interface.

MODERN DISTRIBUTION GRID: VOLUME II │ 13
Locational Net Benefits Analysis
The value of DER on the distribution system is locational in nature associated with a distribution
substation, an individual feeder, a section of a feeder, or a combination of these components. The
distribution system planning analyses, described above, identify incremental infrastructure or operational
requirements (grid needs) and related potential infrastructure investments. The cost estimates of these
investments form the potential value that may be avoided by sourcing services from qualified DERs, as
well as optimizing the location of DERs on the distribution system.
1.1.2. Distribution Grid Operations
Grid modernization is changing distribution grid operations from a model that was largely passive, relying
on robust design margins to accommodate normal operational variations, to a new model that
accommodates DER, multi-way power flows, and active management of the distribution grid to achieve
reliability and greater efficiency. Operating the grid under the new paradigm will require a wide variety of
new analytics and simulation solutions and will rely on robust and secure communications to bring
situational awareness of the distribution grid much closer to real time. Volume I developed the need for
and presented an architectural approach for control federation and control disaggregation.
Section 2.2 assesses the technologies required by the functional elements of Distribution Grid Operations
described in Volume I.5 These technologies are grouped together into technology categories as depicted
in Figure 3. The groupings, based on discussion and review with industry experts, show the primary and
most direct relationships:
• Distributed Resource Management,
• Field Automation,
• Substation Automation,
• Operational Communications Infrastructure,
• Sensing and Measurement,
• Operational Analytics, and
• Optimization Analytics.
5 See Volume 1, Section 5.2, Distribution Grid Operations

MODERN DISTRIBUTION GRID: VOLUME II │ 14
Figure 3: Distribution Grid Operations
MODERN DISTRIBUTION GRID: VOLUME II │ 15
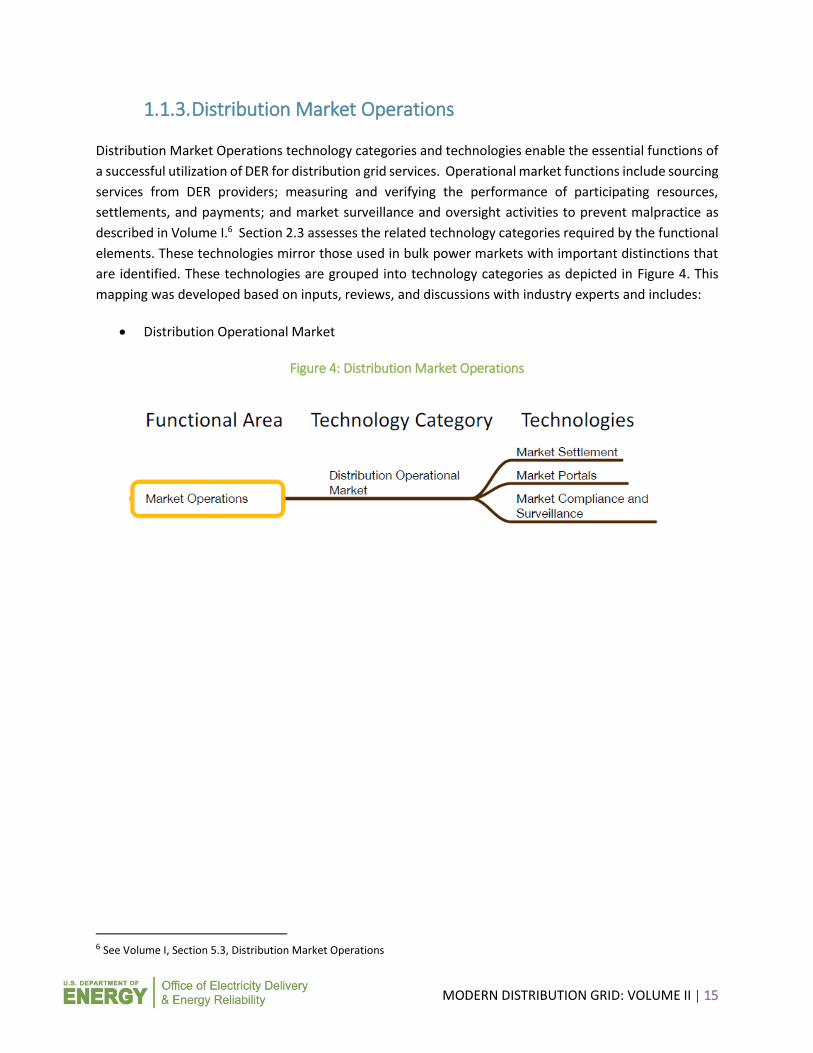
1.1.3. Distribution Market Operations
Distribution Market Operations technology categories and technologies enable the essential functions of
a successful utilization of DER for distribution grid services. Operational market functions include sourcing
services from DER providers; measuring and verifying the performance of participating resources,
settlements, and payments; and market surveillance and oversight activities to prevent malpractice as
described in Volume I.6 Section 2.3 assesses the related technology categories required by the functional
elements. These technologies mirror those used in bulk power markets with important distinctions that
are identified. These technologies are grouped into technology categories as depicted in Figure 4. This
mapping was developed based on inputs, reviews, and discussions with industry experts and includes:
• Distribution Operational Market
Figure 4: Distribution Market Operations
6 See Volume I, Section 5.3, Distribution Market Operations

MODERN DISTRIBUTION GRID: VOLUME II │ 16
2. TECHNOLOGY ADOPTION ASSESSMENT
The following sections assess each technology’s position on the technology adoption cycle. Figure 5 shows
the typical progression of the technology adoption cycle from research and development (R&D) through
mature deployment and eventual obsolescence. The modern grid technologies identified in this volume
are used to plan and operate critical electric delivery services with reliability and safety as key
performance metrics. This drives a technology adoption cycle that is, of necessity, fairly conservative,
meaning the technology must be demonstrated or proven to be reliable. This is similar to other industry
sectors with critical infrastructure and services that demand very high levels of operational performance,
such as the airline industry.
Figure 5: Technology Adoption Cycle
The technology adoption cycle X-axis, “Current Adoption,” identifies the stage of adoption for a specific
technology. The horizontal dashed line represents the crossover point from stages that are Pre-
Operational (i.e., under test and/or evaluation) to those designated as Operational (i.e., proven and in
production use). This happens as a technology is recognized as “proven” through referenceable
implementations of comparable operational use and scale. The transition is evaluated as having occurred
when two conditions are met:

MODERN DISTRIBUTION GRID: VOLUME II │ 17
1) More than three reference operational production implementations of similar scale and scope
exist; and
2) Sufficient market choice exists. This occurs when more than two vendors offer commercially
available products that meet most the requirements.
Placement along the Current Adoption axis also normalizes the time horizons of different technologies.
For example, communication technologies generally have much shorter lifecycles than electric power
technologies, but both follow the same cycle of adoption from R&D through mature deployment and
obsolescence. Hence, to compare technologies with different life cycle lengths, the axis is normalized to
total life.
R&D (including Pilots): This is the initial stage during which technology concepts are developed into initial
working products. Features, functions, and implementations change rapidly as initial lab testing and
limited field pilots identify deficiencies, weaknesses, additional functional requirements, and other
related applied R&D activities.
Operational Demonstrations: This stage occurs when technical feasibility has been established and the
actual or projected cost will provide an economic, policy or regulatory benefit. The pace of product change
slows. At this point, demonstrations of product suitability begin, as potential implementers conduct final
testing prior to purchase and operational deployment. The operational demonstrations stage exposes the
technology to the rigors of production deployment, allowing parties to assess operational viability,
technical reliability, and the value provided.
Early Commercial Deployment: This stage represents the initial operational deployment of commercially
available technology. For any technology category, this will often represent fewer than five operational
deployments and fewer than three vendors offering commercially available technology products.
Mature Deployment: This stage is characterized by multiple vendors each supplying their respective
commercially available technology products and support to multiple customers. Planning for technology
replacement cycles begins as the prospect of obsolescence and entrance of new technologies into R&D
and pilots brings the likelihood of replacement into typical planning horizons.
Obsolete and Replace: This stage may occur as a specific event when a manufacturer announces end of
life of a product and eventually end of support or cessation of service for a service provider. In other cases,
it is an attrition that takes place over time as the number of vendors dwindles, production of critical parts
or software support diminishes, and eventually new or replacement products and spare parts are no
longer available.

MODERN DISTRIBUTION GRID: VOLUME II │ 18
2.1. DISTRIBUTION SYSTEM PLANNING
The information in this section focuses on the software modules of distribution grid analysis tools, and is
based on a structure drawn from a Grid Modernization Lab Consortium report authored by staff at PNNL
and NREL entitled, “Summary of Electric Distribution System Analyses with a focus on DERs,” which is
expected to be published in April 2017.31
2.1.1. Forecasting
2.1.1.1. TECHNOLOGY CATEGORY DESCRIPTION
The development of forecasts is the foundation of distribution system planning and forms the basis for
the identification of system needs, based on demographics, customer usage trends, and civic planning. A
comprehensive load forecasting process often involves complicated data requirements, reliable software
packages, advanced statistical methods, and solid documentation to explain the potential future energy
use of customers. Load forecasting for the high DER distribution grid must consider the impact of DER
output on customer electricity demand, geographic diversity, data quality, forecast horizons, forecast
origin, and customer segmentation.
Forecasting DER growth requires estimates of DER type, quantity, location, timing, and other attributes.
Several factors impact DER forecasting, including historical adoption rates, economic return for the
customer, available DER incentives and procurement programs, typical size of DER generation facilities,
influence of weather, regulatory mandates, and DER capital cost trends. Increased adoption of DER
introduces new challenges for maintaining forecasting accuracy due to uncertainties associated with the
variability of DER output, its evolving correlation with net load, and the impact of geographic diversity on
aggregate DER output. DER have locational-specific impacts determined in part by the ways in which
penetration rates evolve in each part of the distribution system. Multiple forecasts or scenarios may be
employed to assess a range of potential changes in DER adoption.
The results presented by the load and DER forecasting functions are integrated in an analysis of the impact
of DER on customer electricity net demand. These functions are supported by analytical tools and
methods that include the use of software tools that draw on data from various external inputs, and by
established tools that use econometric and predictive models.
2.1.1.2. TECHNOLOGY DESCRIPTIONS
Load Forecasting
Load forecasting for the distribution grid involves the use of computer software that integrates
mathematical models, statistical analyses such as linear regressions, and artificial intelligence techniques
such as neural networks and fuzzy logic. The data inputs to a load forecasting tool include weather,
geographic, economic, demographic, DER and DR data. The load forecast tool must be capable of
MODERN DISTRIBUTION GRID: VOLUME II │ 19
providing load profiles across circuits, banks, and sub-sections of the circuit, with the necessary temporal
and spatial granularity in order to consider the impacts from various scenarios over the planning horizon.32
DER Forecasting
DER operational forecasting tools are software solutions that can be used for near-term operational
forecasts. This tool assesses the "hidden load" challenge faced today, which hinders operational ability to
distinguish between supply resources (distributed generation and storage) and gross demand to
accurately forecast impacts under various operating conditions, such as routine switching or outage
restoration.33,34
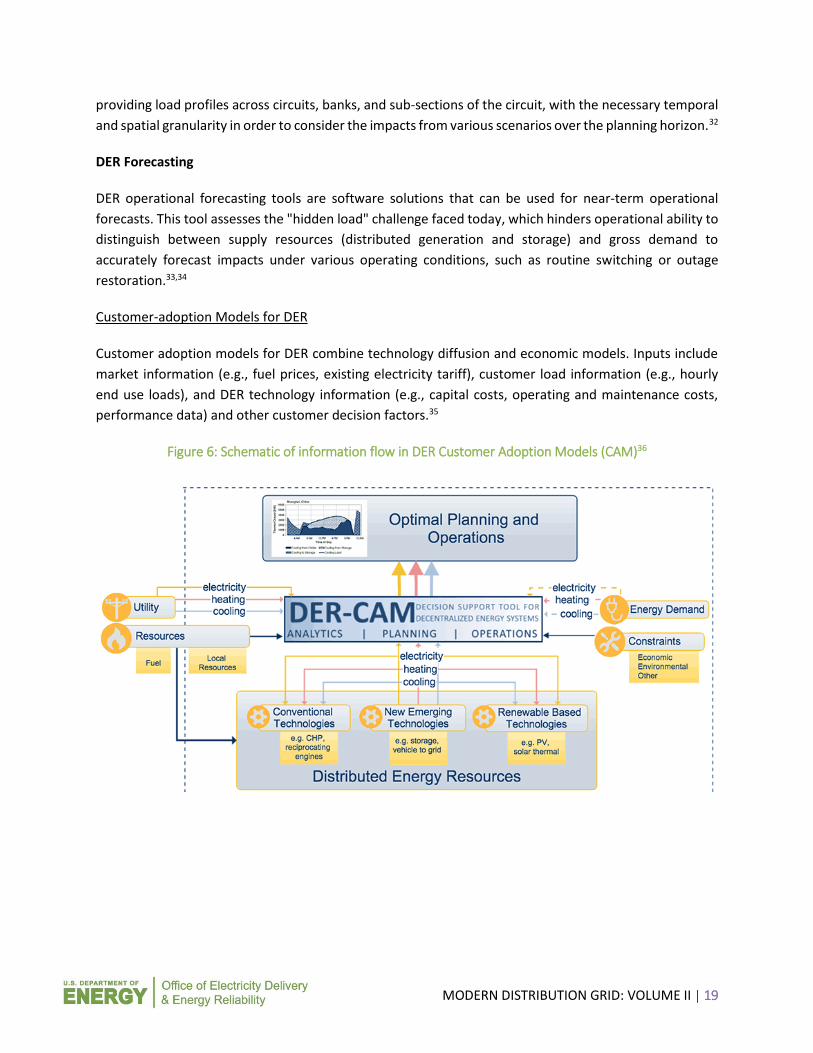
Customer-adoption Models for DER
Customer adoption models for DER combine technology diffusion and economic models. Inputs include
market information (e.g., fuel prices, existing electricity tariff), customer load information (e.g., hourly
end use loads), and DER technology information (e.g., capital costs, operating and maintenance costs,
performance data) and other customer decision factors.35
Figure 6: Schematic of information flow in DER Customer Adoption Models (CAM)36

MODERN DISTRIBUTION GRID: VOLUME II │ 20
2.1.1.3. ADOPTION MATURITY ANALYSIS
Figure 7: Forecasting DER and Demand
The application of demand forecasting techniques and DER operational forecasts to high DER penetration
systems is inherently different from traditional top-down forecasting models. For high DER distribution
systems, the need for granular circuit level accuracy becomes very important, as does alignment of
traditional top-down forecasts with bottom-up customer adoption models. Granular, location-based,
circuit-level accuracy is a function of the grid’s distribution system design; system and locational
information; modeling capabilities; and internal roadmaps for forecasting, including improved tools,
methodologies and data resources. The varying availability of this data across disparate distribution
systems is a hindrance to the technology vendors who seek to develop of a cost effective technical
solutions. Detailed load forecasting tools for distribution grid planning is in the operational demonstration
stage.
Likewise, customer adoption models for DER have largely been custom developed and not fully
commercialized. The several tools used to-date have largely been developed by consulting firm and not
as commercial tools. As such, these tools have been deployed in limited use. As a result, these are in a
state of operational demonstrations.37
DER operational forecasting tools are in the R&D stage.

MODERN DISTRIBUTION GRID: VOLUME II │ 21
2.1.2. Power Flow Analysis
2.1.2.1. TECHNOLOGY CATEGORY DESCRIPTION
Power flow analysis is a core component of distribution system planning that analyzes how system
characteristics change in response to different operating scenarios. Power flow analysis includes steady
state snap-shot and time-series simulations. The output of power flow analysis is a power flow study that
calculates voltages, currents, real and reactive power flows, and losses in the distribution feeder. This
analysis is used to identify potential constraints on the system and scope the need for system upgrades
based on violations of planning criteria, such as voltages outside acceptable limits or the overloading of
equipment.
A comprehensive power flow analysis software includes the following functions and studies:
• Peak Capacity Planning,
• Voltage Drop,
• Ampacity,
• Contingency and Restoration,
• Reliability,
• Time Series Power Flow Analysis,
• Balanced and Unbalanced Power Flow Analysis,
• Load Profile,
• Stochastic Analysis, and
• Volt-var Study.
2.1.2.2. TECHNOLOGY DESCRIPTIONS
Peak Capacity Planning Study
Peak capacity planning study tools examine load growth over a planning horizon. This is done to determine
whether there is a need to upgrade transformers or other grid equipment to meet load growth and keep
the system operating reliably and safely. Multiple snap-shot power flow analyses (often one for each year)
are run to see how the system performs and what needs to be upgraded or changed. The analysis can also
consider commissioning and decommissioning dates for network components. Absolute or relative load
changes can be assigned to individual loads, groups/types of loads, or loads in graphically selected areas.
Commissioning and decommissioning data for grid assets can be entered, which allows for taking new
elements, including loads, transformers and lines, into service and existing ones out of service at future
points in time. The analytical result is an entire load flow calculation with an evaluation of minimum and
maximum values (e.g., voltages or loading levels). Finally, the analysis can provide diagrams with
information on power requirements and overloaded lines, as well as additional information if limits have
been violated during the calculation.

MODERN DISTRIBUTION GRID: VOLUME II │ 22
Voltage Drop Calculator
A voltage drop calculation tool helps investigate the possibilities of voltage limit violation, and plan the
operations of regulators and capacitors. A voltage drop calculation is one of the basic power flow functions
in distribution grid software tools. Industry standards such as ANSI C84.1 provide guidelines for acceptable
voltage ranges. To the extent that voltage violations are identified during the study, these can be mitigated
by leveraging the ability of tap changers, regulators, and capacitors to regulate feeder voltages within the
defined ranges. A voltage drop study may be performed as part of an integrated power flow study.
Ampacity Calculator
Ampacity studies are used to calculate the minimum conductor size and cable configuration required
based on the design requirements and expected load. Because the ampacity of a conductor is affected by
ambient temperature, ampacity ratings under different temperatures are usually calculated. Key inputs
to a calculation include conductor temperature, ambient temperature, conductor resistance, and thermal
resistance and related loss factors.38,39
Contingency and Restoration Tool
The contingency and restoration module of a distribution grid software tool allows the simulation of
multiple “what-if” scenarios in a batch Monte-Carlo type analysis. These “what-if” cases represent the
loss and/or disconnection of a device. Several contingencies can be concurrently defined to represent
network operation under a variety of scenarios, such as the modification of loads and DER generation, the
connection and disconnection of line sections, and the addition and removal of induction and synchronous
motors.
Reliability Study Tool
This software tool is designed to assess the reliability of electric distribution networks. The tool computes
a set of predictive reliability indices for the overall system and their corresponding protection zones such
as SAIFI, SAIDI, and CAIDI. It also computes customer point indices, such as the frequency of interruption
and duration for each customer. The tool can also calibrate a predictive model based on historical data.
This functionality can be useful in adjusting the failure rates and repair time for the overhead lines and
cables, in order to match the simulated model with historical indices. A future-focused reliability study
tool should include modules to plan and optimize the placement of new distribution automation (DA)
devices to maximize their reliability benefit. Additionally, it should support a risk-based reliability planning
module that compares the benefits of different reliability improvement programs (tree trimming, cable
replacement, DA, inspection/maintenance, etc.) on an individual feeder basis and produces a plan on how
to spend reliability improvement budgets to maximize impact.

MODERN DISTRIBUTION GRID: VOLUME II │ 23
Time Series Power Flow Analysis7
A time series power flow analysis tool is used for multiple steady-state load flow calculations with user-
defined time step sizes between each power flow, with simulation periods ranging from seconds to hours
or years. It analyzes the impacts of variations in solar irradiance or wind on power system controls, such
as regulators, load tap changers, and switched capacitors. A time series power flow tool can help verify
the sequence and performance of automatic switching, voltage control, and protection system
operations. It may include the effects of end-use load components turning on or off, which can create
short-term overloads or voltage disturbances. In conjunction with other tools, the time series power flow
analysis may enable the study of grid interactions with markets (e.g., DR and transactive energy) and
communication systems in the future. In addition, a time series power flow analysis can be used in power
quality studies.
Balanced and Unbalanced Power Flow Analysis
The load flow or power flow calculation analysis tool is the software module for the analysis and
optimization of existing networks for network planning. Various solution algorithms (e.g., Newton-
Raphson, Gauss-Seidel, and current iteration) are available for calculating the distribution of currents,
voltages, and loads in the network, even under difficult circumstances (such as when several in-feeds,
transformer taps and poor supply voltages are involved). Balanced network models can be easily
transformed into unbalanced network models by changing model parameters.8
Load Profile Study Tool
Load profile software modules evaluate actual customer consumption curves from interval metering or
typical customer load curves developed from historical data. A load profile study tool allows the user to
define the time period for which loading patterns are to be analyzed. This tool allows the user to
determine peak and off-peak load days, feeder loading patterns, transformer loading and line losses. The
tool can also be used to estimate future electricity generation requirements.40
Stochastic Analysis Tool
Stochastic analysis tools are distribution grid software tools that model the impact of random variations
of load, DER changes, and changes to the distribution system on system operation. The model operates
on a defined set of input variables (e.g., the number, size ranges and locations of solar photovoltaic (PV)
7 Formally known as a Quasi-Static Time Series Analysis (QSTS) 8 In a symmetric three-phase power supply system, three conductors each carry an alternating current of the same frequency
and voltage amplitude relative to a common reference but with a phase difference of one third the period. The common reference is usually connected to ground and often to a current-carrying conductor called the neutral. Due to the phase difference, the voltage on any conductor reaches its peak at one third of a cycle after one of the other conductors and one third of a cycle before the remaining conductor. This phase delay gives constant power transfer to a balanced linear load. It also makes it possible to produce a rotating magnetic field in an electric motor and generate other phase arrangements using transformer.

MODERN DISTRIBUTION GRID: VOLUME II │ 24
systems) and then performs a large number of simulations. Each Monte-Carlo simulation uses a random
selection of different variable choices in accordance with statistical rules for these choices.41
Volt-var Study Tool
Volt-var optimization analysis focuses on system design considering voltage and reactive power
compensation controls in order to optimize system losses and demand reduction. The analysis takes into
account system criteria such as power factor, reactive power, and voltage limits, as well as varying loading
conditions and the operation of system assets such as voltage regulators and load tap changers (LTC).
2.1.2.3. ADOPTION MATURITY ANALYSIS
Figure 8: Power Flow Analysis
All of the power flow analyses listed below are frequently used by planners, and can be considered to be
in a state of mature deployment:
• Peak capacity planning study,
• Voltage drop study,
• Ampacity study,
• Contingency and restoration study,
• Reliability study,

MODERN DISTRIBUTION GRID: VOLUME II │ 25
• Load profile study, and
• Volt-var study.
A steady-state power flow study is a central component of distribution system planning. The increasing
penetration of DER and its impact on load curves will challenge the ability of traditional system analyses
to accurately identify system needs. In particular, as DER with time-varying power outputs are integrated,
time-series simulations for load profile studies are preferable, and will become a key part of a distribution
system power flow analysis. In turn, this will increase the volume of data that grid planners need to
analyze. Intermittent DER will also require stochastic power flow analyses, which require an accurate
network model (including interconnected DER).
As DER penetration increases, a single distribution system software tool to calculate single phase, three
phase, balanced, and unbalanced power flows may be required. The lack of software tools with the ability
to perform this function is a key barrier. In addition, most distribution systems do not presently have
phase models nor separate telemetry for all three conductors of a three-phase circuit. The ability of a
software tool to work in both modes, where phasing is unknown on a segment or feeder but known in the
broader sense, or when telemetry is present only on one of three phases of a transformer or segment, is
presently quite limited.
2.1.3. Power Quality Analysis
2.1.3.1. TECHNOLOGY CATEGORY DESCRIPTION
Power quality is defined as maintaining voltage, frequency, and waveform to defined standards.42 Power
quality analysis evaluates the operating conditions that can cause power quality disturbances, finds the
equipment affected by disturbances, and supports the identification of strategies to eliminate the causes
and mitigate the impacts of disturbances. Electrical disturbances caused by low power quality can result
in economic losses and potential damage to end-use equipment such as sensitive industrial equipment43
and also decrease the power delivery efficiency of the distribution system. Due to the increased
penetration of DER and other intermittent sources of power generation on the distribution grid, there is
potential for harmonic content and injections to increase. This potential could be reduced via
interconnection standards and advanced controls, i.e., letting inverters act as active filters.
Historically, power quality studies have been performed by dedicated equipment and on an ad-hoc basis.
Concerns for the hosting of DER and distribution grid planning are driving further evaluation and
development in this area. Power quality analyses are enabled by software tools for voltage sag and swell
studies and harmonic studies.

MODERN DISTRIBUTION GRID: VOLUME II │ 26
2.1.3.2. TECHNOLOGY DESCRIPTIONS
Voltage Sag and Swell Study Tool
Software tools used for this purpose assess the voltage stability of a network using the Power-Voltage (P-
V) study9 technique. This is achieved by scaling up all the loads by bus, areas, zones or globally in user-
defined steps for a given network, base case, and all defined contingencies. The steady-state P-V approach
dictates that for each load increase, pertinent generators within the system should be re-dispatched to
match this load increase. Voltage calculations result from several studies, such as power flow and fault
analyses. In most cases, post-processing of voltage data is needed for accurate voltage sag and swell
studies, based on the duration of over-voltage and under-voltage conditions.
Harmonics Study Tool
A harmonics study analyzes the disruptions to a current or voltage waveform. This software tool features
analyses such as frequency scan, voltage and current distortion calculations, capacitor rating and filter
sizing analysis, and K-Factor10 calculations. The module allows the user to model non-linear loads and
other sources of harmonic currents such as converters and arc furnaces, and to detect resonant
frequencies due to capacitor banks.
9 When considering voltage stability, the relationship between transmitted Power (P) and receiving end Voltage (V) is of interest.
The voltage stability analysis process involves the transfer of power, P from one region of a system to another, and monitoring the effects to the system voltages, V. This type of analysis is commonly referred to as a P-V study.
10 K-factor is a weighting of the harmonic load currents according to their effects on transformer heating, as derived from ANSI/IEEE C57.110.,A K-factor of 1.0 indicates a linear load (no harmonics), The higher the K-factor, the greater the harmonic heating effects.

MODERN DISTRIBUTION GRID: VOLUME II │ 27
2.1.3.3. ADOPTION MATURITY ANALYSIS
Figure 9: Power Quality Analysis
Several distribution grid software tools are capable of voltage sag and swell studies. As a result, this
module of the tools is in mature deployment. However, poor quality and availability of network model
data from Geographic Information Systems (GIS) or other systems may pose challenges to the effective
support for routine voltage sag and swell studies.
Distribution system harmonics studies are seldom performed and are usually in response to customer
complaints. DER integration may increase harmonics on a distribution feeder necessitating increased
adoption of software modules that can perform harmonics studies. Software modules for harmonic
studies are currently in a state of early commercial deployment.
2.1.4. Fault Analysis
2.1.4.1. TECHNOLOGY CATEGORY DESCRIPTION
A power fault is any abnormal flow of current. A fault analysis evaluates fault current conditions and the
ability of the system to quickly isolate faults and power system failures. Fault analyses can help design the
settings and locations of protective devices, based on the calculated fault current. Power system failures
occur due to lightning or switching surges, insulation contamination, or other mechanical or

MODERN DISTRIBUTION GRID: VOLUME II │ 28
environmental causes. Protective equipment is installed in the system to quickly eliminate faults that
cause abnormally large current flows, such as a short circuit.
The tools that support fault analysis include software modules for arc flash hazard analysis, protection
coordination study, and fault probability analysis.
2.1.4.2. TECHNOLOGY DESCRIPTIONS
Arc Flash Hazard Analysis Tool
The arc flash hazard analysis tool allows users to evaluate the risk of arc flash hazards on any part of a
network. It calculates the short-circuit fault current using a short-circuit calculation algorithm, finds the
clearing time from a library of device specific time-current curves, and calculates the resulting incident
energy and risk level. These tools can also be run to allow the analysis for every bus in the network in one
single simulation.
Protection Coordination Study Tool
A protection coordination study determines the optimum characteristics, ratings, and locations of power
system protective devices. The associated software tool draws on a library of protective decisions, which
stores several thousand device characteristics, time-current curve plots and device settings reports. The
tool may offer a screen editor that allows the user to build a line diagram with the desired circuit devices,
by choosing them from the device library. The program is capable of generating all the necessary study
benchmarks, such as cable and conductor damage curves, motor starting curves, transformer withstand
curves, inrush, and thermal points. It also offers comprehensive graphical and tabular means for verifying
the curve clearances at any fault current or system voltage level.
Fault Probability Analysis
Fault analysis in the context of the planning process involves determining the probable location of future
fault events and momentary outages in the distribution grid. The associated software tool takes into
account the actual switching configuration of the network, as well as the load flow. The grid planner can
place possible line faults and vary their location on a line in order to ascertain their impact to the grid. A
number of fault and conductor interruption types (single and three phase) can be simulated on lines.

MODERN DISTRIBUTION GRID: VOLUME II │ 29
2.1.4.3. ADOPTION MATURITY ANALYSIS
Figure 10: Fault Analysis
Software modules can be used for arc flash hazard studies and protection coordination studies. Arc flash
hazard studies are needed to define the danger to people working on or near live equipment. Arc flash
models, based on Institute of Electrical and Electronics Engineers (IEEE) 1584 standard, are used to
estimate the incident heat energies that a person near an arc fault is exposed. Protection coordination
studies are necessary to determine the optimum characteristics, ratings, and locations of power system
protective devices. Based on the feeder topology and manufacturer’s data of the protective devices, such
as time current curve settings, the optimal relay and recloser settings that provide the best protection for
the system are determined. Results include settings and ratings of each protective device. These features
of the software tools are in mature stage of adoption.
Detecting temporary and high impedance faults and failures, including voltage dips and sags and
distortions, quickly and accurately will help distribution companies increase the reliability of their systems
at lower costs. Very few existing distribution software tools can be used for the purposes of planning,
analyzing and identifying potential fault locations; new tools are being developed to address the following
scenarios:
• Location of “nagging” temporary faults causing momentary outages;
• Detection of high impedance faults; and

MODERN DISTRIBUTION GRID: VOLUME II │ 30
• Reduced patrol time to locate faults on inaccessible facilities (including rural and underground).
Some newer fault analysis tools are capable of improved system analysis and are in operational
demonstrations. These fault analysis tools must also be capable of interfacing with existing software
systems, and the available communications infrastructure. The routine use of fault analysis tools on every
circuit, which will be needed due to great proliferation of DER, is not yet common and will be impeded by
the lack of accurate model network model data.
2.1.5. Advanced Optimization
2.1.5.1. TECHNOLOGY CATEGORY DESCRIPTION
Advanced optimization tools are used to identify and select the optimal sizes and locations for
interconnection of DER to the distribution grid, within acceptable accommodation limits, to meet
economic objectives. Optimized DER can mitigate load relief needs on a circuit by transmission and
distribution (T&D) capital infrastructure deferral, resolve power quality issues, reduce emissions impacts,
and provide societal and other benefits while maintaining acceptable voltage profiles along the feeder
with minimized costs. Such optimization tools can capture the economic potential and size of DER
planners may build a portfolio of DER to provide grid services, or identify locational value, or to enable
policy makers and planners to assess policy options in relation to DER adoption and locational
deployment.
The modules of a distribution grid software tool that can carry out an advanced optimization study are
DER impact evaluation tools.
2.1.5.2. TECHNOLOGY DESCRIPTIONS
DER Impact Evaluation Tool
The DER impact evaluation tool enables DER interconnection studies and hosting capacity analysis. Relying
on a simplified or detailed model of the DER installation, the module allows the creation of various study
cases by combining grid loading conditions (e.g., peak and minimum load) with minimum and maximum
DER contributions (e.g., 0% and 100%), all defined as simulation parameters. Controlled load flow analyses
are then executed on each scenario to assess the impacts on the distribution system in terms of steady-
state voltage, transient voltage variations (flicker), thermal overloads, and reverse power flow to assess
protection issues. The studies performed by such a tool can also ensure that the hosting capacity limits of
grid infrastructure are not exceeded due to the integration of DER.

MODERN DISTRIBUTION GRID: VOLUME II │ 31
2.1.5.3. ADOPTION MATURITY ANALYSIS
Figure 11: Advanced Optimization
While most distribution system analysis tools have software modules with the capability to conduct basic
distribution engineering studies and time-series simulations with the integration of DER, notable gaps
exist in the ability to conduct advanced engineering optimization studies, and to reconcile these with
hosting capacity analyses in an automated fashion. A significant challenge is the ability of a single solution
or tool to address the full range of issues (e.g., voltage, thermal and protection issues) that arise from DER
interconnection due to the highly location-specific value of DER. These tools will also require detailed,
accurate network models to reflect the system at the appropriate point in time. Optimizations could be
required at a more local, granular level or a system-wide level. The software tool should be capable of
simultaneously processing both system level and local level optimizations. DER impact evaluation tools
are considered to be in the operational demonstration stage.
MODERN DISTRIBUTION GRID: VOLUME II │ 32
2.2. DISTRIBUTION GRID OPERATIONS
2.2.1. Distributed Resource Management
2.2.1.1. TECHNOLOGY CATEGORY DESCRIPTION
Distributed Resource Management is the set of capabilities and technologies necessary to have visibility
into and control over DER integrated into the operation of the distribution system, including energy
storage, generation, smart inverters, and responsive load.
The technologies discussed in this section are differentiated from the technologies used for Distribution
Automation, which are covered in the next section. In the context presented within Volume II, Distribution
Automation relates to the visibility and control of the distribution grid. Technologies supporting
distributed resource management include:
• Distributed Energy Resource Management System (DERMS),
• Demand Response Management System (DRMS), and
• Microgrid interface.
2.2.1.2. TECHNOLOGY DESCRIPTIONS
Distributed Energy Resource Management Systems (DERMS)
A DERMS is a software solution that incorporates a range of operations to adjust the production and/or
consumption levels of disparate DER directly or through an aggregator. The visibility of a DERMS within
the distribution grid is typically from the substation downward (or outward) to the low-voltage secondary
transformer, and includes different levels of aggregation, such as at the substation bank, individual
feeders, segments comprising a feeder, and distribution transformers. A DERMS may individually address
disparate DER at the edge of the distribution grid by communicating directly with smart inverters, DC
converters, or other equipment, or communicating with third-party providers who have aggregated DER
in an operational area and are presenting the aggregated DER as a combined controllable resource.
DERMS may be deterministic or predictive in behavior. Deterministic behavior generally waits until an
alarm event occurs, after which the DERMS immediately initiates a power flow analysis, using the most
recent telemetry, to determine the type and magnitude of a voltage or power violation. Based on this
output, a DERMS recruits the necessary DER assets to perform whatever functions are necessary to
mitigate the affecting alarm.
Predictive DERMS uses advanced analytics to perform forecasts to anticipate voltage or power flow
violations. Advanced capabilities use weather forecasts, historical loading, and known profiles of DR, as
well as committed schedules for smart inverter (storage and solar) systems. Anticipated violations are
identified and schedules are created to pre-position DER systems to specific levels of operation (and notify
customers of pending obligations).

MODERN DISTRIBUTION GRID: VOLUME II │ 33
DERMS can also be used for non-violation operations. Specifically, when combined with optimization
analytics, DERMS can provide optimal economic and energy management schedules that allow reliable
operation of increased amounts of DER growth more cost-effectively than traditional wires upgrades. By
integrating with established systems such as a Distribution Management System (DMS) and DRMS, a
DERMS can be used to monitor, optimize and dispatch DERs, including energy storage, DR and electric
vehicles.44 This requires standardized protocols, telemetry and control interfaces. The functions described
above are depicted in Figure 12.
Figure 12: Key DERMS Capabilities45
Demand Response Management System (DRMS)
The specific functions or modules of a DRMS may include support for the following administrative and
business functions for DR management:
• Program creation • Customer enrollment
• Marketing program performance tracking • Device installation
• Scheduling • Device asset management
• Work order management of field installation
of the DR devices
• Capacity forecasting
• Dispatch optimization • Event creation

MODERN DISTRIBUTION GRID: VOLUME II │ 34
• Customer event notification • Event dispatching
• Tracking of customers’ participation • Real-time performance monitoring
• Measuring and verifying participation • Calculating settlements
• Providing reports • Acting as the system of record for all activities
As shown in Figure 13, the DRMS coordinates several key systems involved in DR. The DRMS may
potentially interact with the EMS or DMS operational systems, responding to a request for reduction in
demand. However, today that is rare and more typically involves a human operator interface. The DRMS
also relies on the customer information contained within the Customer Information System (CIS) for
customers enrolled in DR programs, so that it may communicate with commercial, industrial, and
residential customers, and with aggregators, to deliver the results required by the operational systems.
Not all customers are necessarily enrolled in a DRMS.
Figure 13: Demand Response Management System
Microgrid Interface
A microgrid is a group of interconnected loads and DER within clearly defined electrical boundaries that
acts as a single controllable entity with respect to the grid. A microgrid can connect and disconnect from
the grid to enable it to operate in grid-connected mode or island mode.46 As such, the microgrid interface
includes load disconnect/reconnect capability; measurement; communications; protection devices that
can enable seamless interoperability between interconnected, islanded modes; and synchronized
reconnection.47 Figure 14 conceptually illustrates a microgrid interface to the distribution grid. The
microgrid and its internal systems and controls are not within the scope of Volume II.

MODERN DISTRIBUTION GRID: VOLUME II │ 35
Figure 14: Microgrid Interface Framework48
2.2.1.3. ADOPTION MATURITY ANALYSIS
Figure 15: Distributed Resource Management

MODERN DISTRIBUTION GRID: VOLUME II │ 36
DRMS functionality to aggregate and programmatically manage DR assets is at a mature stage with wide
adoption. Multiple vendors’ commercial products are available in the market and have been operationally
deployed over the past decade.49 It should be noted that current solutions rarely coordinate with
transmission system or distribution system operations technologies. This is an area of future concern as
the number of subscribers in DR programs increases. Also, as the use of other types of DER for grid
operations increase, it may be necessary to consider a single software system to optimize the use of all
DER and third-party aggregations of DER, which currently installed DRMS’ are not able. As such, it is
possible that DRMS will be subsumed by DERMS.
DERMS is in an early stage of operational demonstration with market and operational factors driving the
various levels of maturity of DERMS products. The power industry grapples with a single, unified definition
of DERMS. This is due to varying opinions of the operational and technical capabilities envisioned. DERMS
that have been deployed to date are also highly dependent on protocols and custom interfaces specific
to each project, as the uniform application and availability of certain interoperability standards is a
significant gap. 50, 51, 52 53
Currently, a DRMS and DERMS may coexist in transition, but the industry is moving toward a single unified
system to manage all DER providing grid services, including those in DR programs, individual assets and
third-party aggregated resources. Irrespective of this evolution, both alternatives drive similar needs in
grid modernization as described in Volume I.
Microgrid interfaces are in the operational demonstrations stage. At present, each microgrid interface is
specifically defined according to the uniqueness of each implementation for each respective distribution
system and microgrid. IEEE interconnection standards are being updated to address DER and microgrid
interfaces. Commercialized technology solutions for distribution grid interfaces to support microgrid
islanding and reconnection are needed to achieve a microgrid per the DOE definition. There are relatively
few microgrids that fit the DOE definition, and hence commercial support and industry adoption is pre-
operational.54, 55, 56, 57, 58, 59
2.2.2. Field Automation
2.2.2.1. TECHNOLOGY CATEGORY DESCRIPTION
Power delivery functions can be more efficiently monitored and controlled in real time with field
automation assistance. Field devices such as reclosers, switches, capacitors, and transformers can all be
monitored—if not controlled or operated—remotely. Automation devices can also remotely measure
voltage, current, power factor, and phase balance, as well as identify faults. Taken together, this
information provides system operators with the current conditions of the power delivery system.
Adjustments to optimize operating efficiencies are more easily made, and increases in power delivery
reliability are provided. When system failures occur, automation of the distribution network enables an
enhanced ability to pinpoint outage locations and causes and to restore power swiftly, thus minimizing
the frequency and duration of unplanned power outages.60
MODERN DISTRIBUTION GRID: VOLUME II │ 37
The technologies that can support field automation include:
Distribution Automation
Distribution automation enables the monitoring, coordination, and operation of distribution system
components in real-time mode, while adjusting to changing loads and failure conditions of the distribution
system, usually without interventions. These functions require telemetry, analytics, and control, which in
turn, require communication and computational resources.
Volt-var Management
The objectives of a Volt-var management system include minimizing distribution system and customer
voltage variation, reducing system-wide losses, reducing maintenance costs, and increasing the power
delivery hosting capacity of existing equipment.61
Power Flow Controllers
The power flow controller is an electrical device comprised of power electronics, control software and
communication interfaces used for providing fast-acting reactive power compensation. The controllable
parameters of the power flow controller are reactance in the line, phase angle and voltage. The power
flow controllers can also provide harmonic cancellation, power quality functions and typically include
sensing and measurement capability.
2.2.2.2. TECHNOLOGY DESCRIPTIONS
Distribution Automation
Distribution SCADA
Distribution SCADA is the extension of SCADA capabilities to distribution substations and basic distribution
automation (DA) functions, such as capacitor bank control, recloser control, switches, and protection
devices. DSCADA installations also support data acquisition from pole-top and line-mounted DA devices.
DSCADA platforms are typically—but not always—limited in the extent to which they can perform
advanced or complex DA (Advanced DA) functions such as switching analysis and FLISR. In many
installations, the SCADA platforms are used for monitoring and control of field devices, with additional
applications implemented to provide coordination and control of automated field devices.
Advanced Switches
Conventional switches have rudimentary capabilities to be opened or closed by manual operation or via
remote control, or to automatically open or close under certain conditions including fault conditions, or
under de-energized conditions. Advanced switches contain sensors, analytics and control software,
microprocessors, and communication interfaces, with the ability to act as a control hub in a distributed
control scheme to enhance reliability and DER integration through improving distribution flexibility. This

MODERN DISTRIBUTION GRID: VOLUME II │ 38
is done though coordination of power measurement, fault identification, and distributed circuit
control/reconfiguration coordination. Measurements and event information and actions are transmitted
in real-time to other devices on its circuit and adjacent circuits, to the originating substation, and to the
operations control center.62
Distribution Management System
The DMS is a decision support tool that assists with monitoring, control, and optimization of the
distribution system. The advanced iteration of the DMS represents an evolution of the control room
technology by integrating the DMS, Outage Management System (OMS) and SCADA operational systems
into one comprehensive network management solution. While the functionality and capabilities are
inconsistent among the advanced DMSs in development, new feature modules may include but are not
limited to: distribution network modeling, unbalanced load flow and network topology processing,
centralized FLISR (automated restoration), integrated Volt-var optimization, load forecasting, and
dispatcher training simulation. 63, 64, 65, 66
Volt-var Management
Integrated Volt-var Optimization (IVVO)
An IVVO application includes analytics models to determine which grid devices to adjust and by how much
for optimal performance. The software system, in a centralized or decentralized arrangement sends
control setting adjustments to devices such as load tap changers, voltage regulators, capacitor banks,
power flow controllers, and smart inverters.
Distribution-STATCOM
The distribution-static compensator (distribution-STATCOM) is a fast-response, power electronics-based
device that provides flexible voltage and reactive power control at the point of connection for improving
the power quality in distribution systems. The distribution-STATCOM system’s control logic monitors
distribution system performance (voltage and load current), and adjusts reactive power on a cycle-by-
cycle basis if necessary. The distribution-STATCOM connects in shunt to the distribution three-phase
feeder circuit via a coupling transformer. It can exchange reactive power with the distribution system by
varying the amplitude and phase angle of an internal voltage source with respect to the line terminal
voltage, resulting in controlled current flow through the coupling transformer. 67, 68
Power Flow Controllers
Distribution Power Flow Controllers
Distribution power flow controller (DPFC) controls both real and reactive power flow enabled by power
electronics, which is the application of semiconductor switching devices to the conversion and control of
electric power. DPFCs typically can operate autonomously or controlled within an IVVO system and may

MODERN DISTRIBUTION GRID: VOLUME II │ 39
provide voltage regulation, reactive power compensation, harmonic cancellation, power quality functions
as well as sensing and measurement.
Solid-state Transformer
Next generation solid-state transformers (SST) are engineered with intelligent power electronics, as
opposed to traditional, static coil-based transformers. A typical SST consists of an AC-DC rectifier, a DC-
DC converter, a high frequency (HF) transformer, and a DC-AC inverter, as well as a communications
interface. A key use for SSTs are as service transformers and may include other functions, such as grid
sensing, Volt-var management, and switching.69, 70
2.2.2.3. ADOPTION MATURITY ANALYSIS
Figure 16: Field Automation
Smart distribution and field automation technologies enable new capabilities to automatically locate and
isolate faults using automated feeder switches and reclosers; dynamically optimize voltage and reactive
power levels; and monitor asset health to effectively guide the maintenance and replacement of
equipment. In addition, field automation can enhance reliability and resilience while improving
operational efficiency and DER integration.

MODERN DISTRIBUTION GRID: VOLUME II │ 40
Distribution SCADA (DSCADA) devices are widely deployed and mature in modules with basic distribution
automation functions. A wide number of vendors offer devices with DSCADA capability71 with a range of
capabilities. Advanced features differ in maturity by function (such as field equipment management and,
identification of feeder fault events) as indicated in the other technology categories in this document.72
A number of DMS implementations are underway, each with a unique definition of the functionalities that
the new system should enable. Most commercialized advanced DMSs contain analytics modules that can
model the distribution system components and switching activities and conduct distribution power flow
simulations. However, the implementation of a comprehensive DMS requires seamless integration with
OMS, GIS and CIS systems. The term ADMS is often used to include a combination of these systems with
a DMS from a single vendor. While the adoption of these new DMSs has been increasing, DSCADA systems
are often used to manage a growing portfolio of distribution automation functions. These systems are in
a stage of early commercial deployment, but expected to move into mature deployment over the next
five years as identified in the figure below.73
Figure 17: ADMS Deployment Survey74
Advanced switches are being installed on distribution systems. These are more likely to be installed at
voltages above 4 kV. The higher the feeder voltage, the more likely it is that at least some of the feeders
would be fully automatic and have SCADA-controlled sectionalizing switches and reclosers installed.75
Advanced switches within a FLISR scheme reduce customer downtime, improve SAIDI performance,
provide faster and more accurate localization of faults, and reduce repair time and expenses. Advanced
switches are in early commercial deployment.
IVVO systems have not been widely deployed, as traditional voltage management techniques can be used
to achieve most of the efficiency gains from conservation voltage reduction. Today, the driver for the
installation of IVVO systems is often the increasing levels of variable DER that impact voltage quality and
require more sophisticated approaches to manage.
9%
20%16%
55%
Yes Not yet, but plan to byYear End 2019
Not yet, but plan toafter 2019
No, and no plans forADMS
Do you have an Advanced DMS (ADMS)? (i.e., Does it provide SCADA, DMS and OMS together in
one user interface?)
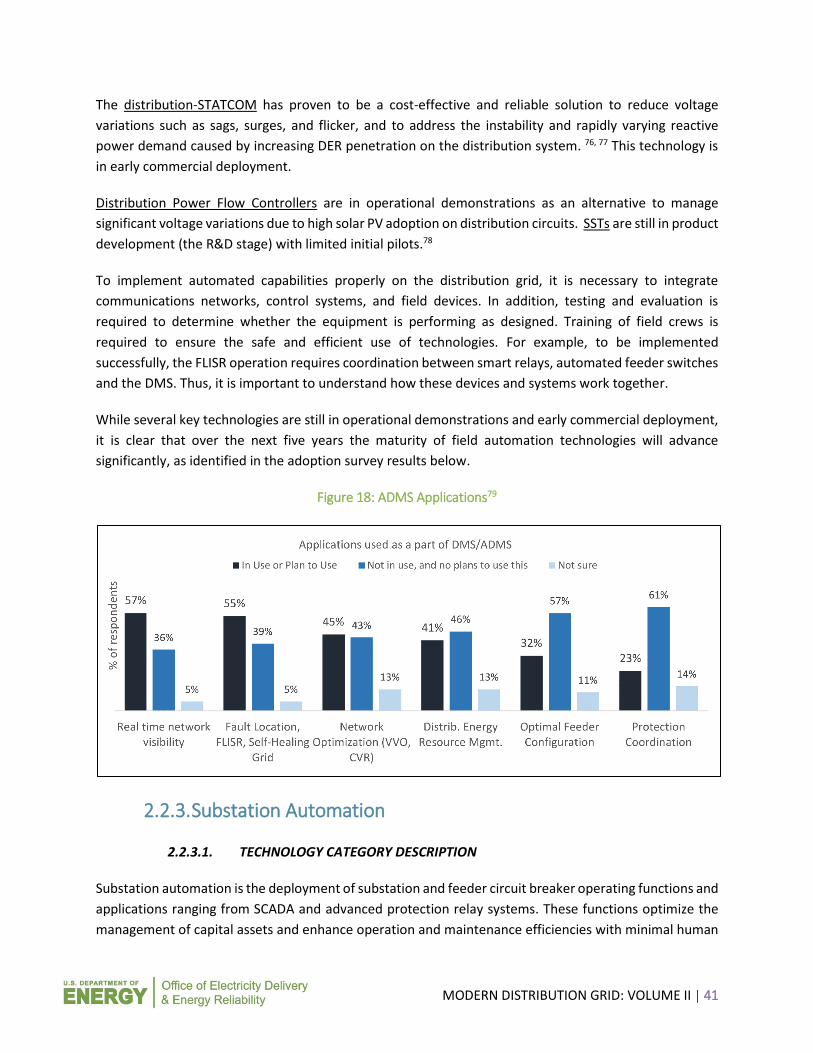
MODERN DISTRIBUTION GRID: VOLUME II │ 41
The distribution-STATCOM has proven to be a cost-effective and reliable solution to reduce voltage
variations such as sags, surges, and flicker, and to address the instability and rapidly varying reactive
power demand caused by increasing DER penetration on the distribution system. 76, 77 This technology is
in early commercial deployment.
Distribution Power Flow Controllers are in operational demonstrations as an alternative to manage
significant voltage variations due to high solar PV adoption on distribution circuits. SSTs are still in product
development (the R&D stage) with limited initial pilots.78
To implement automated capabilities properly on the distribution grid, it is necessary to integrate
communications networks, control systems, and field devices. In addition, testing and evaluation is
required to determine whether the equipment is performing as designed. Training of field crews is
required to ensure the safe and efficient use of technologies. For example, to be implemented
successfully, the FLISR operation requires coordination between smart relays, automated feeder switches
and the DMS. Thus, it is important to understand how these devices and systems work together.
While several key technologies are still in operational demonstrations and early commercial deployment,
it is clear that over the next five years the maturity of field automation technologies will advance
significantly, as identified in the adoption survey results below.
Figure 18: ADMS Applications79
2.2.3. Substation Automation
2.2.3.1. TECHNOLOGY CATEGORY DESCRIPTION
Substation automation is the deployment of substation and feeder circuit breaker operating functions and
applications ranging from SCADA and advanced protection relay systems. These functions optimize the
management of capital assets and enhance operation and maintenance efficiencies with minimal human

MODERN DISTRIBUTION GRID: VOLUME II │ 42
intervention.80 Substation automation systems are designed to behave in a coordinated and integrated
fashion. Unlike transmission substations, distribution substations in many cases are largely analog with
1980’s era communications, electromechanical relays and no SCADA control. This has been changing over
the past decade, but given the very large number of distribution substations and cost considerations it
will take some time to upgrade, absent a need such as DER integration.
The specific underlying components considered are substation SCADA devices and advanced protection
relays.
2.2.3.2. TECHNOLOGY DESCRIPTIONS
Substation SCADA
Several manufacturers supply substation SCADA for use in electrical substations that are compliant with
well-established standards.81 These SCADA measurement, controls and computing platforms are available
in a wide range of processing power and capacity. The distributed computing capability in a substation
provides support for several functions, such as analytics, control functions, physical security and
cybersecurity, and sensor and data management.
Advanced Protection
Advanced protection relays are digital and software-driven with standards-based communication
interfaces. This contrasts with traditional electro-mechanical relays that are still prevalent in distribution
substations. Advanced protection has the capability to remotely change settings (e.g., current, voltage,
feeders, and equipment) both periodically and in the future, as needs may dictate, in real time based on
signals from local sensors or a central control system. For example, a change in settings preserves the
protective function of the relay while preventing false trips (i.e., disconnects or activations) despite
changing conditions that result from the varying output of DER. 82, 83, 84

MODERN DISTRIBUTION GRID: VOLUME II │ 43
2.2.3.3. ADOPTION MATURITY ANALYSIS
Figure 19: Substation Automation
Substation SCADA is mature and widely deployed, although primarily in larger distribution substations.
Installations in distribution substations are growing in response to the need for distributed analytics and
advanced DMS.85 Figure 20 below illustrates the level of adoption.
Figure 20: Distribution Substation Automation86
0
500
1000
1500
2000
2500
3000
3500
4000
with no automation some automation full automation
# o
f su
bst
atio
ns
Level of automation for Distribution Substations(North America respondents)
Now in operation
To be retrofit by YE 2016
New to be built by YE 2016

MODERN DISTRIBUTION GRID: VOLUME II │ 44
Additionally, research survey results indicate that the majority of distribution substations have a single
computing platform as shown by Figure 21 below. Substations that do not have an established computing
platform have Remote Terminal Unit (RTU) installations that perform data acquisition tasks and transmit
operating data back to a control center-based computing platform. Few substations have two or more
computing platforms.
Figure 21: Computer Platforms per Substation87
Advanced protection relays are beginning to be deployed as part of aging infrastructure replacement and
as required for reliability enhancement and DER integration. 88
2.2.4. Operational Communications Infrastructure
2.2.4.1. TECHNOLOGY CATEGORY DESCRIPTION
Communication technologies may be considered from two aspects:
1. The way in which data is conveyed, which for the purposes of Volume II falls into one of two
general groups: Internet Protocol (IP) packet technologies (which includes Multiprotocol Label
Switching (MPLS) and Carrier Ethernet), and Time Division Multiplex Communication
(TDM)/analog technologies.
2. The physical media that carries the signal. Physical media may be wireline, such as optical fiber,
twisted pair/cable, or coax or wireless. Wireless physical media may include satellite, Worldwide
Interoperability for Microwave Access (WiMAX)/ LTE, microwave, cellular mobile, land mobile
radio (LMR), or other radio services such as paging that may also be referred to as radio or radio
frequency (RF). In many cases, a physical link may be used for either IP packet or TDM
communications by changing the telecommunications equipment at each end.
13
29
930
5
10
15
20
25
30
35
0 1 <10 unknown
# o
f re
spo
nd
ents
Number of computing platforms used per substation (North America respondents)

MODERN DISTRIBUTION GRID: VOLUME II │ 45
Operational communication infrastructures for the distribution grid include wide area networks (WAN),
field area networks (FAN) and neighborhood area networks (NAN).89 The diagram in Figure 22 is an
idealized representation of such a hierarchical network architecture. Some network designs may have a
flattened architecture with one or two tiers. Larger networks over wider geographies may have multiple
dedicated networks for siloed applications using a variety of transport technologies and infrastructures.
Figure 22: Operational Communications Infrastructure90
WAN91
There is generally a business (enterprise) WAN as well as an operations WAN. The business network
transport infrastructure may overlap with the operations WAN. Material differences exist between
business and operational networks related to performance quality, reliability and cybersecurity. This
volume is focused on operational networks. Within the context of the distribution grid, the WAN spans
up to an entire service area, linking substations, and operating or control centers. Older implementations
of WAN may consist of multiple networks. The WAN may also provide the two‐way network needed for
SCADA, and points of presence for interconnection of FANs and specific high bandwidth and/or low
latency applications (e.g., teleprotection92).
FAN93
As with WAN, a FAN may be multiple siloed purpose-built networks. FAN connects the NAN with the WAN
by providing backhaul services for NAN concentrators or access points to WAN points of presence.
Interconnection between substations is provided by the WAN. Substations may provide the physical

MODERN DISTRIBUTION GRID: VOLUME II │ 46
location of a WAN point of presence used by the FAN. FAN services also include low latency and peer-to-
peer (P2P) communications for protection and control.94
NAN95
A NAN supports information flow for grid edge devices (e.g., smart meters or DA devices) and the FAN. It
enables data collection from customers in a neighborhood for transmission to a control center. NAN
enables a range of smart grid applications, such as smart metering, service disconnect switches, and
power outage notification messages. The typical technology deployed for NAN is narrowband mesh radio
supporting P2P connection among edge devices to route information to access or collection points with
FAN communication.
Because meters are located in a wide diversity of environments, there is no single technology that is
capable of reaching every meter cost-effectively. In order to communicate with meters in particularly
challenging environments, technologies generally used for FAN or WAN may be used for NAN
applications on a specific basis.
Other Radio Services (including Paging)
There are a multitude of fixed and mobile radio systems that operate at different frequencies and different
licensed or unlicensed Federal Communications Commission (FCC) requirements. It is beyond the scope
of Volume II to cover these in any depth. The Utilities Technology Council96 (UTC) provides a wealth of
information on communications on both private infrastructure as well as telecommunications service
provider (SP) offerings.
Communications Network Management Systems97, 98
Communication Network Management Systems provide insight into the touch points between power and
communications equipment to configure networks, monitor performance, and manage behavior. 99 In
addition to managing network devices, the same tools can manage and view multiple networks.
2.2.4.2. TECHNOLOGY DESCRIPTIONS
WAN
Multiprotocol Label Switching (MPLS)
MPLS is an IP packet-based data-carrying technique for high-speed, high-performance telecommunication
networks and enterprise users. MPLS uses packet labeling for faster packet forwarding on networks,
rather than long network addresses. The labels identify virtual links (paths) between distant nodes rather
than endpoints. MPLS is a multi-services network technology that facilitates transport of most forms of
traffic, from traditional serial-based technologies such as SCADA RTUs to International Electrotechnical
Commission (IEC) 61850 packet-based microprocessor-based devices. 100,101, 102
MODERN DISTRIBUTION GRID: VOLUME II │ 47
MPLS is often regarded as more costly and complex than single service technologies, and may require
skills more commonly found in information technology (IT) rather than operational technology (OT).
SP MPLS is MPLS service provided by telecommunication service providers to their customers. Private
MPLS is MPLS technology implemented on communication infrastructure.
Carrier Ethernet
Carrier Ethernet (CE) is IP Ethernet presented without exposing the complexity (or flexibility) of the
underlying technology that is used to provide the service, such as MPLS. CE is available from
telecommunication service providers or may be deployed on private network infrastructure.
TDM and Analog
TDM and analog are two families of communication technology that form the legacy infrastructure of grid
communications. TDM is a method of transmitting different signals over a common path by synchronized
timing of when each signal appears. This provides easy access to timing and synchronization that has been
useful for a number of grid applications, such as SCADA control of switches or relays and coordinating
actions between substations. Analog communications are direct circuit connects, including dedicated
lines, between two or more points that may carry voice or encoded data.
Public Switched Telephone Network (PSTN) is the circuit-switched analog network that provided
telephony, leased lines and modem lines before telecommunication carriers converted to digital packet
switched infrastructure.
Paging Systems
Traditional paging involves the sending of a one-way signal from a central station to a device that alerts
the user when it arrives with a short text or data message. When used for load shed programs, the
receiving device activates a load shed device(s) based on the contents of the message. Some paging
systems also provide limited two-way communication with the capability for a message to be
acknowledged, or for the receiver to send a short reply.
Satellite Communication
Satellite communication is seen in many aspects of wide-area communication. Direct digital satellite
communications can be established via a satellite telecommunications service provider and a satellite
antenna such as a Very Small Aperture Terminal (VSAT)103 at the ground site. Satellite communication has
the distinct advantage of being available anywhere, independent of any ground infrastructure apart from
the satellite antenna.

MODERN DISTRIBUTION GRID: VOLUME II │ 48
FAN
Mobile
Broadband mobile telephony services (i.e., cellular) can be provided by infrastructure that is owned and
operated by a telecommunications service provider, or by infrastructure that is owned and operated by a
non-SP entity. Mobile service from a telecommunications service provider is referred to as “SP LTE.”
Mobile infrastructure owned by a non-SP entity is referred to as “Private LTE.”
Applications of mobile services include:
• Backup communication for one of the other WAN technologies;
• Substation communication for remote or small substations, if in the coverage area;
• FAN communication connecting NAN mesh networks to the distribution company’s WAN or
directly to the company’s data or control center;
• FAN communication to specific devices on the distribution network such as sensors (see Sensing
and Measurement section); and
• Voice and data communication with the mobile workforce.
Mobile services currently include 3G, 4G, LTE and LTE Advanced.104 5G105 is under development, with
service providers targeting deployment by 2020 or 2021.
Private mobile telephony technologies include the same 3G, 4G, LTE and LTE Advanced but on licensed
radio spectrum and infrastructure (cell towers and central communications equipment) owned by the
distribution company. This will very likely be the case for 5G as well.
Land Mobile Radio (LMR)106
These systems are primarily used for mobile workforce communication, and occasionally for device data.
These may be either owned by the distribution company or contracted from a telecommunications service
provider.
Peer-to-Peer (P2P) Systems
P2P communications enable direct connection of one device to another. P2P may be a network service or
standalone capability. As a network service, the central part of the system responds to a request by
providing each device the information and resource necessary to establish direct communication. As a
standalone capability, P2P becomes synonymous with point-to-point (PTP) and is a dedicated
communication link between devices.

MODERN DISTRIBUTION GRID: VOLUME II │ 49
WiMAX/LTE
Worldwide Interoperability for Microwave Access (WiMAX) is a standards-based technology enabling the
delivery of wireless broadband (high bandwidth) access to endpoint devices.107 The family of standards is
based on the IEEE 802.16 set of standards.
WiFi
WiFi and WiFi mesh11 are high bandwidth systems that use unlicensed radio frequencies, which are also
available to personal computers, tablets, and smart phones for data communication. Applications of WiFi
within the distribution grid are identical to those listed for mobile telephony.
NAN
Radio Frequency (RF) Mesh
Mesh networks are typically narrow bandwidth and useful for transmitting operational data, event
information and control signals. Mesh networks enable end devices at each network node or point to
communicate to a collector or collection point via multiple RF “hops.” The collector may also be called a
concentrator, gateway or network access point. This characteristic of mesh networks allows for a cost-
efficient way to deploy and build a network that encompasses greater distances while requiring less
transmission power per device. Second, it improves system reliability since each end device can register
with the collector via another communication path if the present communication path becomes
inoperable. Third, by allowing end devices to act as repeaters, it is possible to deploy more nodes around
a collector, thereby reducing the number of back haul paths. 108, 12 While RF mesh technologies are the
most common service for NAN, there are a few other technologies that are also used to support grid edge
communication to field automation, direct load control devices and AMI applications.
Other RF Systems
There are a variety of specialty, proprietary RF systems in use by providers of grid equipment such as
protection devices109 and by AMI vendors.110 These include both PTP and point-to-multipoint systems.
Power Line Carrier (PLC)
Power Line Carrier (PLC) technology is narrow bandwidth and utilizes the same wires that carry electric
power to carry communications from smart meters to an aggregation point, usually located at the low
voltage distribution transformer. Communication from the aggregation point may be via an RF mesh
network, if there is one present in the area, or via one of the FAN technologies used to connect RF Mesh
and other NAN technologies back to the data center.
11 ABB Tropos WiFi Mesh 12 It should be noted that WiSUN is an industry group working to develop standards for RF mesh communications systems that
include interoperability

MODERN DISTRIBUTION GRID: VOLUME II │ 50
Broadband over Power Line (BPL)
BPL is out of scope for this paper. At one time BPL was regarded as having the potential for wide area
communication and the ability to provide broadband internet services. However, BPL remains a niche
solution and is no longer regarded as viable for industry WAN or the provision of internet services.
Communication Network Management Systems
Communication network management system technology is a set of software tools that provide visibility
to devices attached to the network and control network parameters, including configuration and security.
Virtually every communication equipment supplier and numerous third parties offer a wide range of tools.
2.2.4.3. ADOPTION MATURITY ANALYSIS
Figure 23: Communications Infrastructure
The need for ubiquitous communication in the modern distribution grid stems from all the goals and
objectives set forth in Volume I. Secure and reliable communication is essential to the operation of a
modern distribution grid.
MPLS is a mature technology used in multiple industries. It is the core technology of telecommunication
service provider networks. It is widely deployed for both IT and operational networks. However, the cost
and complexity of a private, enterprise MPLS implementation needs to be considered.

MODERN DISTRIBUTION GRID: VOLUME II │ 51
PSTN infrastructure is considered obsolete; carrier revenue for these circuits is declining as carriers choose
to move to technologies such as VOIP and LTE. Service providers either have discontinued or have filed
regulatory notices to discontinue PSTN communications. PSTN used for the power grid must be
replaced.111, 112 PSTN carrier “private-line,” “non-switched” or “leased-line” services have been used for
SCADA, protection and control. These are the services that PSTN carriers have made obsolete and are
replacing with MPLS or CE, both of which are viable options.
TDM and analog include technologies such as Synchronous Optical Networking (SONET)/ Synchronous
Digital Hierarchy (SDH), which were widely used as the backbone of transmission networks in smart grids
as well as in carriers. For the purposes of Volume II, TDM/ analog technologies can be considered obsolete.
The increased performance and richer features of IP networking technologies such as MPLS have led to
SONET/ SDH being almost completely displaced by IP networking in corporate IT WANs. SP backbone
networks are now almost exclusively MPLS.
For process control automation, TDM may be considered by some industries to be a legacy technology
that is not entirely obsolete. A couple of original equipment manufacturers (OEM) vendors have recently
brought new TDM equipment to market to serve such industries. However, because there is no longer a
critical mass of R&D investments in new capabilities, security or performance, TDM is likely to become
obsolete.
Paging systems have dramatically declined in popularity and commercial importance since the availability
of short messaging services in mobile telephony. Paging is widely regarded as obsolete and is rapidly
disappearing as paging vendors have gone out of business and systems have been turned off. Most direct
load control programs, which had been using paging systems since the 1980s, have recently been
converting to mobile services or NAN connectivity.
Satellite communication is in mature deployment; however, important tradeoffs and limitations include
high latency due to connectivity with satellites in geosynchronous equatorial orbit and recurring cost
based on data usage and recurring cost based on data usage.
Microwave communications is in mature deployment, used especially in areas where it is cost prohibitive
to construct physical communications infrastructure.
WiMAX is a mature technology with limited adoption for grid communications. Deployments on the U.S.
distribution grid have been hampered by lack of licensed spectrum, especially after the change in
designation of the 3.65 GHz band from “lightly licensed” to “unlicensed” by the FCC. Also, large carrier
deployments of WiMAX have been abandoned (e.g., ClearWire in the US) as the technology lost in the
marketplace to LTE. OEM vendors have pivoted to Wireless Internet Service Providers (WISP)113 and
enterprise deployments.
SP LTE or mobile services from SPs have been used as the WAN backhaul for most AMI deployments to-
date, as wells as an option for replacing paging services for direct load control programs. However, mobile
services are not widely used in field automation given the availability, reliability and other performance

MODERN DISTRIBUTION GRID: VOLUME II │ 52
requirements. This is because commercial mobile services are based on consumer needs that do not have
the same service level requirements. For example, this lower level of service is sufficient for meter
reading.
Private LTE networks have been deployed in limited numbers and are in a stage of early commercial
deployment. Private LTE networks can be used for supervision and communication with grid automation
devices and NAN applications such as AMI.114, 115, 116, 117, 118
RF Mesh networks have emerged as the leading technology for AMI and DA deployments in North
America. The tradeoffs are latency (data transmission timing) and throughput (bandwidth). This requires
careful design to balance cost with the number of devices to manage the latency and bandwidth required
for grid applications. According to the criteria used for Volume II, RF mesh is in mature commercial
deployment for AMI and early commercial deployment for field automation.119 However, it is important
to note that RF mesh systems are not interoperable. Wi-SUN Alliance120 is an industry organization
(modeled after the WiFi Alliance121) whose goal is to provide industry standards, interoperability and third-
party certification.
PLC is primarily used in areas inaccessible to RF. PLC is much more cost-effective for European type
distribution grids as they have much larger low voltage transformers serving 20 to as many as 150
residential customers. There are several standards for PLC communication, including G3 and Prime in
Europe and IEEE 1901.2 in the U.S. PLC is a mature technology, available from multiple vendors and
deployed in production at a number of distribution companies.
2.2.5. Sensing and Measurement
2.2.5.1. TECHNOLOGY CATEGORY DESCRIPTION
Sensing allows for observation of the distribution grid and DER, as well as environmental factors that
influence DER performance and grid operations and sensing for cyber and physical security. Sufficient
sensing and data collection can help to assemble an adequate view of the grid state. Measurement refers
to the ability to record and monitor grid parameters such as three-phase voltage, current, phase angle,
and power factor, as well as DER output and performance. 122, 123, 124, 125 Sensing and measurement data is
also utilized in distribution and system planning. The underlying technology components within sensing
and measurement are:
• Advanced Customer Metering,
• Production Metering,
• Grid Asset Sensors,
• Environmental Sensors, and
• Grid Sensors.

MODERN DISTRIBUTION GRID: VOLUME II │ 53
2.2.5.2. TECHNOLOGY DESCRIPTIONS
Advanced Customer Metering
Advanced Smart Meters
Smart meters are typically digital, solid-state meters that are used to measure a customer’s consumption
during configured time intervals through a periodic polling mechanism. Advanced customer metering
consists of technologies that can measure and communicate customer energy use or production, power
characteristics, operational events, and notifications at time intervals sufficiently granular and latent to
support grid and market operations. Advanced meters may include other capabilities such as real and
reactive power measurement and power quality (harmonic distortion) measurement.126 These advanced
smart meters can be used as grid sensors to support more complex field automation and DER integration.
Production Metering
Production meters provide the telemetry, software and tools necessary for the metering and monitoring
of DER assets that supply power to the grid.
Grid Asset Sensors
Grid asset sensing technologies are health monitoring devices that automatically measure and
communicate characteristics related to the health and maintenance of the equipment, such as
temperature, dissolved gas and loading. These devices can also automatically generate alarm signals if the
equipment characteristics reach critical or dangerous levels.127
Environmental Sensors128
Environmental sensors are devices that provide real-time data on a variety of environmental factors
ranging from solar irradiance, temperature, humidity, wind, geomagnetic disturbances and earthquakes
to the presence of chemicals such as methane and hydrogen. Sensors may also monitor coronal discharge
and capture thermal images from infrared cameras trained on substation transformers. Sensors also
provide physical and cybersecurity situational awareness via measuring and monitoring parameters,
including cell phone signals, presence of drones, sensor network cyber intrusion attempts, and physical
intrusion detection. This information can then be fed back into the operations systems over the
appropriate communications channels.129
Thermal Sensors
Temperature or thermal sensors can take temperature values directly from built-in device temperature
monitors, or use voltage and current profiles built up from near real time meter data to estimate circuit
hot spots.130

MODERN DISTRIBUTION GRID: VOLUME II │ 54
Weather Sensors
Weather sensors are deployed at substations according to local geography and microclimates. These
sensors supplement commercial weather telemetry available from commercial sources.
Solar Irradiance Sensors
These sensors measure solar irradiance at the installation location. As the variability in output from solar
PV installations is largely driven by local climatic conditions, such sensors can help develop a knowledge
of location-specific solar variance, which in turn can help maintain safe and reliable grid operations.131
Grid Sensors
Grid sensors (usually called line sensors) are devices that provide real-time visibility into the operation
and performance of the grid, including DER operations, thus allowing for the quick identification of
normal, abnormal or emergency situations and preventing interruptions of power. The two primary types
of grid sensors are voltage sensors and current sensors. Coupling these sensors with analytical tools
enables observability into normal operation, while also improving the ability to locate and de-energize
fault locations, such as live electrical wires, which could create public and worker safety risks.132
Line Sensors
Line sensors can be used on the distribution grid to measure voltage, load current, fault current, power
factor, phase angles, harmonics, sags and surges, among other metrics.
Voltage Sensors
Electrical voltage sensors measure AC and/or DC voltage levels. They receive voltage inputs and provide
outputs as analog voltage signals, switches or audible signals. Voltage sensors vary in terms of
performance specifications, optional features and environmental operating conditions.
Current Sensors
Current sensors measure AC and/or DC current levels. Different sensors can have different characteristics
for different applications, and current sensors can use a variety of technologies in order to measure
current.

MODERN DISTRIBUTION GRID: VOLUME II │ 55
2.2.5.3. ADOPTION MATURITY ANALYSIS
Figure 24: Sensing and Measurement
The development of advanced customer smart meters that can fulfill the requirements of a grid sensor is
in operational demonstration. Advanced meters and their associated infrastructure require significant
investment, and adoption barriers such as an unclear business case for such infrastructure or prior
investments in older metering technology.
The adoption of production meters for DER are in the early commercial deployment stage given the
limited use since it is typically only installed above a certain size threshold.
The development of equipment health sensors is in early commercial deployment largely in substation
applications, such as, transformer dissolved gas monitoring. Increasingly these sensors are being
incorporated into the equipment and not a retrofit device.
Environmental sensors have primarily been deployed on transmission systems; their adoption on the
distribution grid remains low. As a result, they are in the operational demonstrations stage. Exposure to
extreme weather-related events along with large-scale proliferation of intermittent DER may drive the
need for cost-effective installation of environmental sensors.133,134

MODERN DISTRIBUTION GRID: VOLUME II │ 56
Line, voltage and current sensors and technologies for monitoring grid parameters have been deployed
by a number of utilities over the years and are approaching mature deployment.
2.2.6. Operational Analytics
2.2.6.1. TECHNOLOGY CATEGORY DESCRIPTION
The analog-to-digital transformation of the distribution grid enables improved awareness of the current
grid configuration, asset information and condition, power flows, and events. This may include visibility
into all steady-state grid conditions, such as criteria violations, equipment failures, customer outages, and
cybersecurity. DER situational awareness is also required to operate a grid with high DER and optimize
DER services to achieve maximum system benefits. As such, operational analytics transform historical and
real-time data for the electrical grid into actionable insights for improving operational reliability and
efficiencies. This section focuses on the data aggregation and analysis tools that are used to provide clarity
and context for operational decision making and support for business processes.135 The underlying
components that support operational analytics are:
• Field Data Management,
• Electrical Network Connectivity Model,
• Distribution State Estimation,
• OMS, and
• GIS.
Field Data Management
Meter Data Management
Meter data management consists of processes and tools for securely storing, organizing, and normalizing
data from advanced meters, integrating data from other meters, and making the data available for
multiple applications including customer billing, analysis for grid control, and outage management.
Advanced meter data management systems include integrated applications for analytics and interfaces
for integration with other operational systems such as GIS and OMS.
Meter data management systems have specific provisions for both data security and data privacy.136
Sensor Data Management
Typical industry functions operate in an independent or siloed fashion. Modern distribution grid sensor
data management systems will use advanced “Big Data” analytics and multiple protocols and information
silos to integrate disparate data sources and create a single, comprehensible source of data. In order for
sensor-based data management to support Big Data analytics, a system or process model must not only

MODERN DISTRIBUTION GRID: VOLUME II │ 57
define the context of a sensor within a process and operation, but also provide context management that
allows data to be reliably rolled-up and compared to other data streams across operations.
Electrical Network Connectivity Model
An electrical network connectivity model is a data set, in spatial context that contains geospatial grid asset
details (physical data), configuration information, customer and DER connectivity details, and electrical
network information (connectivity data) to accurately depict the current state of the distribution system.
This model is often visually represented in a GIS and used in power flow studies. Distribution operations
employs two versions of the model: as-built and as-operated. The as-built model reflects original design
and implementation, while the as-operated model reflects the actual real-time model for daily
operations.137 This data is also used in the planning activities described in Section 2.1. Connectivity model
data can be volatile on both short and long time scales through outage remediation (short) and
maintenance and construction (long).
Distribution State Estimation
State estimation is the prediction of all voltages and currents in the system, from a limited set of actual
measurements. It must account for missing or bad data, load variations, and local control operations such
as capacitor switching, voltage regulator operation, and automatic switch operation. State estimation is a
key enabler for a number of applications on the distribution system; these include reactive power
management, outage management, loss reduction, DR, adaptable over-current protection, condition-
based maintenance, integration with transmission system operations, and more.138, 139
OMS
An OMS integrates meter-level outage information and real-time information (such as interactive voice
response) on customer outages. Analysis of that data identifies interrupted equipment and circuits,
enabling work crews to be dispatched to the location of the fault and decreasing the time to repair and
the duration of the outage. It also provides suggested switching plans to accelerate outage restoration.
OMS can monitor and observe equipment status to optimize outage prediction and enhance situational
awareness by integrating real-time data from customers with telemetered analog data from the
distribution system. 140, 141
Geographic Information Systems (GIS)
A GIS is used to capture, store, manipulate, analyze, and manage all types of geospatially referenced data.
GIS tools enable users to create queries, analyze spatial information, edit data and maps, and present the
results. Relevant geodata types might include land-based data, streets, ownership/real estate, vegetation,
network topology, GPS location data for grid devices and components, and census data.142

MODERN DISTRIBUTION GRID: VOLUME II │ 58
2.2.6.2. TECHNOLOGY DESCRIPTIONS
Field Data Management
Data Management Systems
Data management systems offer a user interface that allows users to view, manage and act on usage and
overlay related information such as: weather data, average usage profiles, similar premise usage, AMI
events, validation, editing, and estimation, installation and removal activities, outage periods, meter
reader remarks, and service orders. Such platforms can also integrate with complementary products and
tools such as a CIS, data storage and management systems, infrastructure management systems, and
Software as a Service analytics tools.143
Analytics Software
Technical analytics are critical software tools and processes that transform raw data into useful,
comprehensible information for operations decision making. Technical analytics includes signal analytics
(substation and line sensor waveforms, time and frequency domain data), engineering operations
analytics (system performance, asset health, load trends and forecasts) and customer analytics (demand
profiles, and DR behavior and forecasts).144
Electrical Network Connectivity Model
Distribution network connectivity software models provide a web-based, geospatial visualization of the
electric distribution network and assets providing a single view of data and analysis for all users of the
software system. The models are capable of dynamic updates and automated integration with GIS systems
and power engineering and planning modeling tools. An operating system such as a DMS unifies data from
DMS, SCADA and OMS to maintain a real time “as-operated” distribution network connectivity model.145
Distribution State Estimation
The technologies and tools used for distribution state estimation include customer side smart meters, grid
meters and pseudo measurements. Customer smart meters and grid meters are installed to enable the
measurement of power consumption and voltage and reactive power at frequent intervals, at the
customer site and on the distribution grid respectively. In unobservable areas or without any measuring
points, the estimation depends on the existing knowledge of the grid and pseudo measurements, such as
historical data, load templates, nominal voltage value, and average power factor.146

MODERN DISTRIBUTION GRID: VOLUME II │ 59
2.2.6.3. ADOPTION MATURITY ANALYSIS
Figure 25: Operational Analytics
Data management systems consist of servers, networking, data storage and supporting systems software,
including operating systems, databases, communications software, and applications monitoring software.
They are a key component of sensor and meter data management systems, and have been widely
deployed. The installation of these platforms and data management software is driven by the deployment
of smart grid devices and AMI. Hence, data management systems are in mature deployment.
Analytics software is deployed in conjunction with IT platforms. These tools are used to clean and analyze
data that is eventually visually represented via an IT platform. As a result, analytics software is in mature
deployment.
Recent market trends indicate a preference for single vendor outage management systems bundled with
DMS, SCADA and Interactive Voice Response (IVR), for example. However, discrete (“best of breed”)
outage management systems have been widely implemented over the past decade through interfaces
with customer systems and DMS. OMS are in the mature deployment stage.
Geographic information systems and tools are in mature deployment.147

MODERN DISTRIBUTION GRID: VOLUME II │ 60
Software based electrical network connectivity models are in early commercial deployment. However, the
key challenge to real-time connectivity models is maintaining the availability of accurate and “clean” data.
Typical approaches to GIS/network model data cleanup do not ensure ongoing data integrity because they
do not address the underlying volatility of an operational grid. Real-time connectivity models are
therefore in operational demonstrations.
Distribution state estimation for real-time use in distribution systems with high levels of DER is in initial
operational demonstrations. The unique features of the distribution grid (i.e., a significant number of
nodes, radial topology, unbalanced phases, etc.) create challenges that are not faced on transmission
systems. Also, problems can arise if inputs to the state estimator consist of a combination of pseudo data,
real measurements, which vary temporally and spatially, or if the measured objects delivered from
different sources are different from each other in terms of voltage or power. As such, classic state
estimation methods for transmission work poorly on distribution feeders.
2.2.7. Optimization Analytics
2.2.7.1. TECHNOLOGY CATEGORY DESCRIPTION
The availability of additional grid intelligence can, through analytics, extend the life of assets, predictively
maintain equipment, and effectively manage a field work force to improve overall system performance
and efficiencies. Also, as DER services include non-wires alternatives, there is a need to optimally evaluate
a complex portfolio or many portfolios of various individual, programmatic and aggregator services to
meet specific locational grid needs. This optimized locational “loading order” utilizes analytics to assess
availability and performance attributes to create portfolios for operational dispatch.148,149
The underlying components that support optimization analytics are asset management and DER
optimization.
2.2.7.2. TECHNOLOGY DESCRIPTIONS
Asset Management
Asset management integrates the grid intelligence acquired in achieving the other milestones with new
and existing asset management applications. One important technology is condition based maintenance
(CBM) systems.
CBM Systems
A CBM system collects data on distribution assets to ensure maintenance is performed only when needed.
A CBM integrates with software-based tools that can be deployed to gather grid data, to aggregate and
analyze grid data, and to pinpoint locations to add new data collection monitors and sensors. CBM systems
leverage asset data to reconcile maintenance schedules with actual asset conditions, organizational
priorities, and changes in operating environments. 150, 151
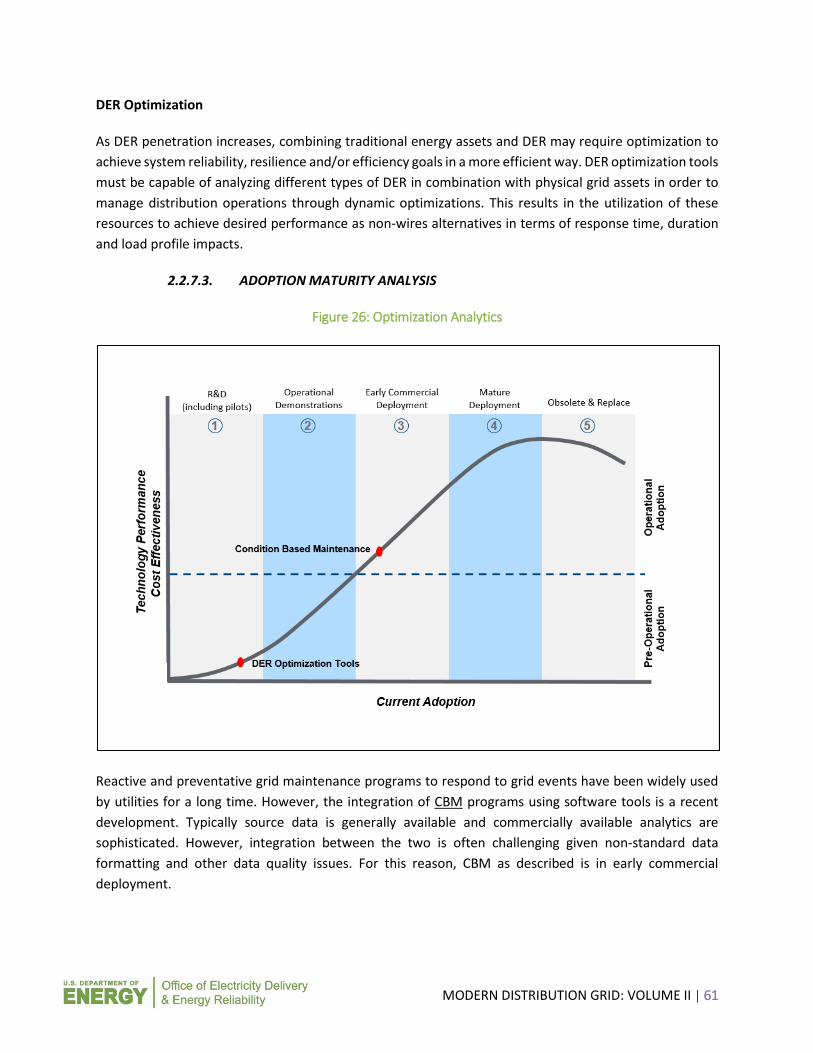
MODERN DISTRIBUTION GRID: VOLUME II │ 61
DER Optimization
As DER penetration increases, combining traditional energy assets and DER may require optimization to
achieve system reliability, resilience and/or efficiency goals in a more efficient way. DER optimization tools
must be capable of analyzing different types of DER in combination with physical grid assets in order to
manage distribution operations through dynamic optimizations. This results in the utilization of these
resources to achieve desired performance as non-wires alternatives in terms of response time, duration
and load profile impacts.
2.2.7.3. ADOPTION MATURITY ANALYSIS
Figure 26: Optimization Analytics
Reactive and preventative grid maintenance programs to respond to grid events have been widely used
by utilities for a long time. However, the integration of CBM programs using software tools is a recent
development. Typically source data is generally available and commercially available analytics are
sophisticated. However, integration between the two is often challenging given non-standard data
formatting and other data quality issues. For this reason, CBM as described is in early commercial
deployment.

MODERN DISTRIBUTION GRID: VOLUME II │ 62
DER optimization tools are generally in R&D stage of adoption maturity. Today, assessment of DER non-
wires alternatives portfolios at the distribution level is often performed through spreadsheet-type
analysis. Some DER portfolio optimization capability is included in a DERMS, but these are typically
designed for managing the dispatch function, not for constructing portfolios resulting from sourcing
evaluations and distribution planning. It may be possible to extend the DERMS functionality for this
purpose in planning, as well as to integrate with market operations and grid operations.
2.3 DISTRIBUTION MARKET OPERATIONS
2.3.1 Distribution Operational Market
2.3.1.1. TECHNOLOGY CATEGORY DESCRIPTION
Distribution operational markets involve the use of DER provided services as non-wires alternatives.152 In
addition to the planning and grid operational technologies described above, there are initially two
technology categories, Market Settlement and Market Portals, that are needed to support a distribution
operational market over the next five years. Additionally, market compliance and surveillance tools will
be needed. Other potential market structures and specific market designs are beyond the scope of
Volume II.
2.3.1.2. TECHNOLOGY DESCRIPTIONS
Market Settlement
The settlement process will include calculating payment determinants based on performance, contract or
tariff terms, and any charges for non-performance. The scale of these complex structured transactions
may grow to a large quantity and involve accounting for relatively small units (micro-transactions) that
sum to large dollar values. Traditional CIS billing systems and wholesale settlement systems do not
support the potential transaction scale and diversity of pricing schemes and tariff/contract terms. Today,
most special retail tariffs and DR programs are handled manually using less sophisticated
spreadsheet/database tools that will not scale. This creates the need for settlement systems not unlike
those used for online digital media, such as for purchasing music, to automate a settlement process for
the potential scale and small unit size of transactions and create visibility into the valuation of services
and related monetization methods.153
Market Portals
Market portals could provide open channels for market participants to view and visualize information
related to distribution operational markets for grid services. Market portals will support access to market
data from the front-end (e.g., web-based displays) or from the back-end (e.g., electronic data interchange)
for downloading large quantities of data while being safeguarded by strong privacy protections and
cybersecurity measures.154 Several standards based approaches are in development to support
information exchange including: Green Button Connect and Orange Button Connect.155, 156

MODERN DISTRIBUTION GRID: VOLUME II │ 63
Additionally, market portals may include identification of grid services and related locational
opportunities, participant registration/enrollment and program/procurement eligibility criteria, pricing
information, secure access to participant settlements, and notifications. A market portal may convey
different types of information designed for various audiences such as customers, energy service providers
and DER aggregators.
Market Compliance and Surveillance
Distribution operational market participants include both DER providers and directly participating
customers. Market participation rules are being defined in terms of the requirements and responsibilities
for market participants in order to provide a high quality of service delivery. As such, tools will be needed
to oversee and ensure participants’ compliance with the new market rules. Expected functionalities will
include:
• Qualifying (e.g., credit and performance checking) of new participants;
• Tracking pre-scheduled or real-time service deliveries;
• Managing of participant interactions (e.g., service complaints) and participant non-performance;
and
• Monitoring market participation (e.g., liquidity).
Market surveillance tools can provide continuous surveillance and evaluation of distribution markets,
which helps prevent any wrongdoing or anti-competitive behavior, and ensures markets perform as
intended. The functionalities of market surveillance tools can be split into two: identifying and addressing
wrongdoing in the bidding process, and auditing of posted clearing prices and the evaluation of efficient
functioning of the market.157

MODERN DISTRIBUTION GRID: VOLUME II │ 64
2.3.1.3. ADOPTION MATURITY ANALYSIS
Figure 27: Distribution Operational Market
Market portals related to customer information access and system data exchange are in early commercial
deployment. A few Green Button Connect implementations have been established, or are under
development. Portals sharing hosting capacity information through maps and data have begun initial
deployments and are in early commercial development. Other information portals such as Orange Button
are under R&D, with the data exchange standards in development.158 It is anticipated that additional
locational market opportunities will become available online potentially through a bulletin board, or as
additional information provided on the emerging hosting capacity maps. Such a portal could be further
extended in functionality to support various sourcing mechanisms such as a DER procurement. This
sourcing function would require secure, confidential access for market participants.
Settlement systems for distribution operational markets are in operational demonstrations, primarily
beginning with settlement of complex tariffs and DR programs.
Market compliance and surveillance tools are widely used in wholesale markets and are regarded as
mature for the wholesale electricity grid, but have not yet been implemented for the distribution grid.
Many of these technologies can be adapted for distribution operational market oversight. For distribution
operational markets, the oversight scope will include data and information regarding assumptions and
methodologies for determining locational and system value as well as sourcing results and market bid
information.

MODERN DISTRIBUTION GRID: VOLUME II │ 65
3. SUMMARY
3.1. OVERVIEW
Volume II identifies the enabling technologies linked to the functions identified in Volume I of this report.
As such, this volume combined with Volume I provides a line of sight from state policy objectives and
attributes for a modern grid to the related functional requirements and ultimately the technology needed.
Accordingly, this volume indicates the supporting technologies that can be used to implement and support
this vision of a modern, holistic grid.
The technologies are presented within pertinent overarching “technology categories,” and represented
by means of a hierarchical taxonomy. Additionally, the technologies described in this volume are assessed
along a Technology Adoption Cycle to evaluate their maturity through several stages of commercial usage
– from research and development activities to mature deployment and eventual obsolescence. It assumed
that commercial adoption of advanced grid technology will be driven by customer value and expectations
as well as policies.
Volumes I and II serve as industry references and support the discussion in Volume III, “Decision Guide,”
which addresses key considerations for states and industry contemplating distribution grid modernization
to enable one or more of the following outcomes:
• Reliability, safety and operational efficiency of the distribution system
• DER integration to enable customer choice and other policy objectives
• DER utilization in bulk power system and/or as distribution non-wires alternatives
3.2. FINDINGS
A wide range of technologies are discussed in this volume most of which are in a stage of maturity for
commercial deployment to support the customer and policy objectives identified in Volume I. However,
there are maturity gaps in 5 key technology categories that present potential challenges over the 5-year
horizon of the Modern Distribution Grid Report. These are summarized below.
• Multi-DER simulation for planning and hosting capacity analysis
There is an existing gap in current modeling tools used for hosting capacity analysis and annual
distribution planning to be able to assess the simultaneous net effect of various types of DER
operating autonomously or optimized at a distribution system location. Given that battery energy
storage is rapidly becoming more cost-effective and increasing combined with solar PV system, it
will be essential to have this capability to properly conduct evaluations. This gap is understood in
the industry, but less so with policy makers. Efforts to facilitate commercial development, testing
and deployment are needed.

MODERN DISTRIBUTION GRID: VOLUME II │ 66
• Integrated resource, transmission and distribution modeling tools
As customer adoption and merchant development of DER (e.g., community solar, DER
aggregators, microgrids, etc.) increase, they will play an increasingly important role in system
resource adequacy and transmission planning in addition to distribution planning. In several
states the current and forecast levels of DER are such that it is important to assess DER across the
entire power system. Today, that is only possible through an iterative approach linking the results
from resource planning to transmission and distribution. It is not possible to conduct a
simultaneous (or coordinated) evaluation. This gap will pose a significant challenge to states with
high DER forecasts such as Hawaii and California over the next 5 years. Efforts to facilitate
commercial development, testing and deployment are needed.
• Distributed energy resource management systems
DERMS is a key technology for DER utilization for a variety of uses to manage portfolios of
aggregated DER as well as direct control of DER. These systems, as noted, are in an early stage of
operational demonstration with a large number of vendor products in commercial development.
However, further development and adoption will be slowed by the lack clarity on the functionality
required. This is due to varying industry opinions of the operational and technical capabilities
envisioned of DERMS. Additionally, DERMS that have been deployed to date are also highly
dependent on protocols and custom interfaces specific to each project, as the uniform application
and availability of certain interoperability standards is a significant gap.
Another challenge is the potential transition from legacy Demand Response Management
Systems to a single unified DERMS to manage all DER (incl. existing DR programs) providing
wholesale and distribution grid services. The operational demonstrations underway should lead
to commercial adoption, but will require regulatory support for “co-development” between
technology vendors and the users of these systems. Also, standardization of the several interfaces
are needed and support for these activities is also required.
• Integrated Volt-var management w/smart inverters
Integrated Volt-var systems have not been widely deployed, as traditional voltage management
techniques can be used to achieve most of the efficiency gains from conservation voltage
reduction. With increasing levels of variable DER such systems will need to be used to coordinate
grid devices and smart inverters to maintain voltage quality. However, in practice the design and
operation of such a system is still in a development stage. There are several R&D pilots of a Volt-
var management system interfacing with smart inverters. However, a revised IEEE 1547 standard
is forthcoming that includes significant changes to the autonomous and interoperable functions
of inverters. Also, a key interoperability standard is in development by the SunSpec Alliance. Given
that these standards have yet to be fully tested and commercially implemented, it may be a
couple of years before they are commercially adopted.

MODERN DISTRIBUTION GRID: VOLUME II │ 67
Additionally, distribution power flow controllers (DPFCs) are an alternative to smart inverters to
dynamically manage voltage and reactive power. A challenge to integrated Volt-var management
as envisioned in several states is that there are not yet industry best practices for the application
and use of IVVO software, DPFCs and/or smart inverters in addition to existing load tap changes
and capacitor banks as part of a holistic system. As a result, gaps exist on actual operational
performance due to limited demonstrations, industry accepted design approaches and
comparative cost-effectiveness studies for design alternatives.
• Interoperability standards
Interoperability standards remain a significant challenge to the development of a modern
distribution grid. This is true when considering both interfaces between utility systems and
customers or energy services organizations or whether considering the intra-faces between grid
operating systems including communications. Progress has been made over the past decade
through efforts of several organizations such as IEEE, NIST and SGIP (now part of SEPA) and several
industry initiatives noted.
However, much remains to be done to advance interoperability standards and to implement in
commercially available technology. For context, utilities and other buyers of this technology are
generally technology takers, not market makers. That is, they are not large enough individually in
buying power (particularly in a global grid technology market) to dictate fundamental technology
capabilities or standards with technology vendors. Regulators have an opportunity to support
utility adoption of interoperable technology by more clearly exploring interoperability gaps and
the potential courses of action to address. The solution requires all three legs of the stool;
regulator, utility and grid technology supplier to address this gap.
One potential approach to highlight the gaps and areas for development is to create an
interoperability roadmap (or roadmaps depending on the function). Such an effort could support
a discussion among regulators and industry on priorities for interoperability standards
development.
Finally, it should be noted that the underlying physical grid infrastructure is already undergoing
improvements and enhancements as part of aging infrastructure replacement. Such investments are
rarely exactly like-for-like. Therefore, the result is a more robust distribution grid that provides a solid
foundation for more advanced technologies described in this volume. Also, any commercial technology
adoption must consider the integration with legacy systems and equipment given that there rarely are
deployments done in greenfield environments. Additionally, it is expected that the various
communications, information and operational systems discussed in this volume will be built and installed
with the necessary cybersecurity protocols and methods, and with the appropriate assignment of security
roles and permissions. These issues will be discussed in Volume III, “Decision Guide.”

MODERN DISTRIBUTION GRID: VOLUME II │ 68
REFERENCES U.S. Energy Information Agency Glossary https://www.eia.gov/tools/glossary/
Electric Power eTool: Glossary of Terms
https://www.osha.gov/SLTC/etools/electric_power/glossary.html
Electric Power eTool: Illustrated Glossary of Terms
https://www.osha.gov/SLTC/etools/electric_power/illustrated_glossary/
1 “Voices of Experience – Insights into Advanced Distribution Management Systems,” Page 3, February 2015.
https://www.smartgrid.gov/files/ADMS-Guide_2-11.2015.pdf 2 “Advanced Metering Infrastructure,” Page 1, February 2007. https://www.ferc.gov/CalendarFiles/20070423091846-
EPRI%20-%20Advanced%20Metering.pdf 3 CIS Technology: What’s the Advantage?
Available online: http://www.electricenergyonline.com/show_article.php?mag=7&article=50 4 Adapted from - Consolidated Edison Company of New York. “Distributed System Implementation Plan (DSIP),” Page 124,
June 2016. 5 U.S. Energy Information Agency Glossary Available online: https://www.eia.gov/tools/glossary/ 6 US Department of Energy, Energy.gov, Office of Electric Delivery and Energy Reliability
Available online: https://energy.gov/oe/services/technology-development/smart-grid/demand-response 7 http://en.openei.org/wiki/Definition:Distribution_Management_System 8 US Department of Energy. “Quadrennial Technology Review 2015, Chapter 3: Enabling Modernization of the Electric Power
System – Technology Assessments, Flexible and Distributed Energy Resources,” Page 15, 2015
http://energy.gov/sites/prod/files/2015/09/f26/QTR2015-3D-Flexible-and-Distributed-Energy_0.pdf 9 EPRI, 3002008215. “Common Functions For DER Group Management, Third Edition”.
Available online: http://www.epri.com/abstracts/Pages/ProductAbstract.aspx?ProductId=000000003002008215 10 Energy Management System, Texas A&M University, Available online: http://www.ece.tamu.edu/~pscp/monitor.htm 11 U.S. Department of Energy Smart Grid Investment Grant Program. “Fault Location, Isolation, and Service Restoration
Technologies Reduce Outage Impact and Duration,” Page 1, December 2014.
Available online: https://www.smartgrid.gov/files/B5_draft_report-12-18-2014.pdf 12 Abstract: Electric Utility Guidebook for Geographic Information Systems Data Quality: Metadata
Available online: http://www.epri.com/abstracts/Pages/ProductAbstract.aspx?ProductId=000000003002007921 13 GPS Definition, TechTerms. Available online: https://techterms.com/definition/gps 14 Internet Protocols, Internet Engineering Task Force.
Available online: https://www.ietf.org/ 15 Adapted from: Federal Communications Commission. “Private Land Mobile Radio Services”. Available online: http://wireless.fcc.gov/services/index.htm?job=service_home&id=private_land_radio 16 US Department of Energy, Energy.gov
Available online: https://energy.gov/oe/services/technology-development/smart-grid/role-microgrids-helping-advance-
nation-s-energy-system 17 Grid Connection of a Microgrid, University of Texas,
Available online: http://www.dsce.fee.unicamp.br/~antenor/pdffiles/SG.pdf 18 The impact of microgrids on the distribution grid is within the scope of this document, while the explanation of the
operation of an islanded microgrid is not. Hence, the functionality of a microgrid is not explained here. 19 Adapted from: Federal Communications Commission. “Microwave”.
Available online: https://www.fcc.gov/microwave 20 Adapted from: Radio-electronics.com “Fibre optics communications tutorial”. Available online: http://www.radio-
electronics.com/info/telecommunications_networks/fiber-fibre-optics/communications-basics-tutorial.php
MODERN DISTRIBUTION GRID: VOLUME II │ 69
21 US Department of Energy. “Quadrennial Technology Review 2015, Chapter 3: Enabling Modernization of the Electric Power
System – Technology Assessments, Measurements, Communications and Controls” Page 24, 2015. Available online:
http://energy.gov/sites/prod/files/2015/09/f26/QTR2015-3E-Measurements-Communications-and-Controls.pdf 22 Peer-to-Peer (P2P) Architecture: Definition, Taxonomies, Examples, and Applicability
Available online: https://tools.ietf.org/html/rfc5694 23 Oncor, “What is that hanging on the pole? An overview of distribution automation devices.” Available online:
http://www.oncor.com/EN/Documents/Education%20Safety/Electricity/What%20is%20that%20hanging%20on%20the%20
pole.pdf 24 IEEE Standard Reliability Indices. Available online: http://www.l2eng.com/Reliability_Indices_for_Utilities.pdf 25 https://www.britannica.com/technology/satellite-communication
http://www.vsat-systems.com/satellite-internet/how-it-works.html 26 NERC Glossary of Terms. Available online: http://www.nerc.com/files/glossary_of_terms.pdf 27 Telecommunications Handbook, U.S. Department of Transportation.
Available online: https://ops.fhwa.dot.gov/publications/telecomm_handbook/chapter2_03.htm 28 Adapted from: WiMAX Forum.
Available online: http://wimaxforum.org 29 ATIS Telecom Glossary.
Available online: http://www.atis.org/glossary/definition.aspx?id=429 30P. De Martini, Integrated Distribution Planning, ICF-DOE, 2016. Available online:
https://energy.gov/sites/prod/files/2016/09/f33/DOE%20MPUC%20Integrated%20Distribution%20Planning%208312016.p
df 31 Tang Y, Homer JS, McDermott TE, M Coddington, B Sigrin, and B Mater. 2017. Summary of Electric Distribution System
Analyses with a focus on DERs. PNNL‑26272, Pacific Northwest National Laboratory, Richland, WA. 32 Adapted from: Tao Hong, "Energy Forecasting: Past, Present and Future," Foresight: The International Journal of Applied
Forecasting, issue 32, pp. 43-48, Winter 2014. 33 Southern California Edison. “Grid Modernization Distribution System Concept of Operations,” Page 6, January 17, 2016.
Available online:
https://www.edison.com/content/dam/eix/documents/innovation/SCE%20Grid%20Modernization%20Concept%20of%20O
perations%201.17.16b.pdf 34 EPRI. “Distributed Energy Resource Controller Produces Distribution Powerflow Forecast Version 1.1,” January 6, 2010.
Available online: http://smartgrid.epri.com/UseCases/DER%20Forecasting%20V1.1.pdf 35 Microgrids at Berkeley Lab. “Distributed Energy Resources Customer Adoption Model (DER-CAM).
Available online: https://building-microgrid.lbl.gov/projects/der-cam 36 Brookhaven National Laboratory, Renewable Energy Lab, “Distributed Energy Resources Customer Adoption Model (DER-
CAM)” Available online: https://www.bnl.gov/SET/DER-CAM.php 37 National Renewable Energy Laboratory, Distributed Generation Market Demand (dGen) model, used for specific R&D
studies in 2016. Report available online: http://www.nrel.gov/analysis/dgen/ 38 http://www.electrician2.com/articles/ampacity.htm 39 Ludvig Lindstrom. “Evaluating impact on ampacity according to IEC-60287 regarding thermally unfavorable placement of
Power Cables – KTH Masters Thesis,” Chapter 4, Page 21, November 2011. 40 Adapted from: Francisco M. Gonzalez-Longatt, Jose Luis Rueda. “PowerFactory Applications for Power Systems Analysis,”
Page 20. 41 California Institute for Energy and Environment, Public Interest Energy Research (PIER) Program Whitepaper. “Electric
Distribution System Simulation and Analysis Tools – Status and Research Gaps for Integration of Renewables and Electric
Vehicles,” Page 12, April 2013.
Available online: https://uc-ciee.org/downloads/Task%201%201%20White%20Paper.pdf 42 519-2014 - IEEE Recommended Practice and Requirements for Harmonic Control in Electric Power Systems,
https://standards.ieee.org/findstds/standard/519-2014.html 43 Electrical disturbances include oscillations, voltage variations, flicker, harmonics, fast disturbances (transients), and network
unbalance.
http://www.pge.com/includes/docs/pdfs/about/news/outagestatus/powerquality/pq_home.pdf
http://www.pge.com/mybusiness/customerservice/energystatus/powerquality/ 44 Pacific Gas & Electric, EPIC Summer Workshop. “Distributed Energy Resource Management (DERMS) EPIC Project 2.02
Overview,” Page 4, June 22, 2016.

MODERN DISTRIBUTION GRID: VOLUME II │ 70
Available online: http://www.energy.ca.gov/research/epic/documents/2016-06-
22_workshop/presentations/PGE_EPIC%20Summer%20Workshop_2-02%20DERMS%20Presentation_Final.pdf 45 Source: Distributed Energy Resource Management Systems (GTM Research) 46 U.S. Department of Energy Microgrid Exchange Group https://building-microgrid.lbl.gov/microgrid-definitions 47 Sandia National Laboratories. “The Advanced Microgrid – Integration and Interoperability,” Page 47, March 2014.
Available online: https://energy.gov/sites/prod/files/2014/12/f19/AdvancedMicrogrid_Integration-
Interoperability_March2014.pdf 48 Adapted from - Geza Joos, McGill University. ”Medium Voltage grid interfaces and interconnection equipment,” April 2016.
Available online: https://www.nist.gov/sites/default/files/documents/pml/high_megawatt/Joos_presentation_MV-grid-
interfaces_15apr16.pdf 49 DoE, LBNL, Demand Response Program Design and Implementation Case Study Interviews, 2013.
Available online: https://eetd.lbl.gov/publications/demand-response-program-design-and-im 50 PG&E Distributed Energy Resource Management System (DERMS) EPIC Project 2.02 Overview, June 2016. 51 NV Energy Distributed Energy Resources Trial, April 2016. 52 DTE Energy Advanced Implementation of Energy Storage Technologies, March 2016.
Available online: https://www.smartgrid.gov/files/OE0000229_DTE_FinalRep_2016_03_16.pdf 53 Sunspec Alliance, CEC PON 14-303 Interoperability Standards and Open Testing Framework to Support High- Penetration
Distributed Photovoltaics and Storage http://sunspec.org/cec-pon-14-303/ 54 IEEE Project P2030.7 – Standard for the Specification of Microgrid Controllers. Available online:
https://standards.ieee.org/develop/project/2030.7.html 55 GTM Research Note - U.S. Microgrid Vendor Landscape: Q4 2016 56 EPRI-Sandia Symposium on Secure and Resilient Microgrids, August 2016. Available online: http://energy.sandia.gov/2016-
epri-presentations/ 57 Ibid. Microgrids Lessons Learned—SO FAR, Merrill Smith August 29, 2016. 58 Ibid. Microgrid & Controller R&D, slide 9, Microgrid R&D Timeline, Dan Ton, DoE Office of Electricity Delivery and Energy
Reliability. 59 Ibid. DoD Advanced Microgrid Integration Challenges with Utilities, slide 8 60 Energybiz Magazine, “Guide and Sourcebook – Transmission and Distribution Automation,” January/ February 2006
Available online: http://energycentral.fileburst.com/Sourcebooks/gsbk0106.pdf 61 E. Tom Jauch, “Volt/var Management An Essential “SMART” Function,” Page 1.
Available online: https://www.beckwithelectric.com/docs/tech-papers/Smartgrid-final-paper.pdf 62 Southern California Edison, “2018 General Rate Case: Transmission & Distribution (T&D) Volume 10 – Grid Modernization,”
Page 49, September, 2016.
Available online:
http://www3.sce.com/sscc/law/dis/dbattach5e.nsf/0/49FCCC4EB70514FB882580210068F69D/$FILE/SCE02V10.pdf 63 Schneider, Advanced Distribution Management System (ADMS).
Available online: http://www.schneider-electric.com/b2b/en/solutions/for-business/s4/electric-utilities-advanced-
distribution-management-system-adms/, accessed in Jan, 2017. 64 Siemens, Distribution Management System (DMS).
Available online: http://w3.siemens.com/smartgrid/global/en/products-systems-solutions/control-center-solutions/grid-
control-platform/solutions/distribution_management/pages/distribution-management-system.aspx, accessed in Jan, 2017. 65 Xcel Energy, “2015 Biennial Distribution Grid Modernization Report,” October, 2015. 66 Southern California Edison, “2018 General Rate Case: Transmission & Distribution (T&D) Volume 10 – Grid Modernization,”
September, 2016.
Available online:
http://www3.sce.com/sscc/law/dis/dbattach5e.nsf/0/49FCCC4EB70514FB882580210068F69D/$FILE/SCE02V10.pdf 67 James R. Clouston, James H. Gurney, “Field Demonstration of a Distribution Static Compensator Used to Mitigate Voltage
Flicker,” 1999.
Available at: http://grouper.ieee.org/groups/1409/s14_16.pdf 68 Gridtec Solutions, “Distribution Static VAR Compensator (Distribution System Planning-SVC) System.
Available at: http://www.amsc.com/documents/distributed_static_var_compensator_d-svc_system_/ 69 Power Systems Engineering Research Center (PSERC), “The 21st Century Substation Design,” Page 82, September, 2010.
Available online: http://smartgridcenter.tamu.edu/pscp/wp-content/uploads/2014/10/Kezunovic_Project-T-
37_PSERC_Final_Report_2010.pdf

MODERN DISTRIBUTION GRID: VOLUME II │ 71
70 Green Tech Media, “TNG 2011: Solid-State Transformers Part II.”
Available at: https://www.greentechmedia.com/articles/read/tng-2011-solid-state-transformers-part-ii 71 Newton-Evans, “The Role of ADMS/SCADA in Building a Resilient & Reliable Distribution Grid: Part 1,” August 2015.
Available online: http://www.newton-evans.com/the-role-of-admsscada-in-building-a-resilient-reliable-distribution-grid-
part-1/ 72 Ibid. 73 Presentation made by Chuck Newton, Newton-Evans Research Company at The GE Digital Energy 2015 Americas Software
Summit, “The Role of Advanced DMS/ SCADA Software and Systems in Building a Resilient and Reliable Power Distribution
Grid,” March 2-6, 2015. 74 Newton-Evans Research Company, “The World Market Study of SCADA, EMS, DMS and OMS in Electric Utilities: 2017-2019,
Volume 1: North American Market.” Page 22, March 2017. 75 Newton-Evans. “Smart Grid Systems Report – Input Considerations Prepared for the U.S. Department of Energy,” Page 17,
December 2014. 76 Gridtec Solutions, “Distribution Static VAR Compensator (Distribution System Planning-SVC) System. Available at:
http://www.amsc.com/documents/distributed_static_var_compensator_d-svc_system_/ 77 Gridtec Solutions, “Distribution Static VAR Compensator (Distribution System Planning-SVC) System. Available at:
http://www.amsc.com/documents/distributed_static_var_compensator_d-svc_system_/ 78 Green Tech Media, “Gridco Deploys Advanced Power Electronics to Control the Grid Edge.” Available at:
https://www.greentechmedia.com/articles/read/Gridco-Deploys-Advanced-Power-Electronics-to-Control-the-Grid-Edge 79 Newton-Evans Research Company, “The World Market Study of SCADA, EMS, DMS and OMS in Electric Utilities: 2017-2019,
Volume 1: North American Market.” Pages 22, 24, 26, 62, March 2017. 80 KEMA, “Substation Integration and Automation.” Available online: http://www.slideshare.net/MahbubRashid/substation-
automation-26659022 81 IEEE 1613 and IEC 61850-3 provide standards for computers used in electrical substations. 82 Department of Energy, “Quadrennial Technology Review – An Assessment of Energy Technologies and Research
Opportunities,” Chapter 3, Section 3A, Page 11, September 2015. 83 Ibid. Chapter 3, Sections 3A & 3F, Pages 11 & 15, September 2015. 84 Southern California Edison, “Grid Modernization Distribution System Concept of Operations, Version 1.0,” Page 12, January
2016. 85 Presentation made by Chuck Newton, Newton-Evans Research Company at The GE Digital Energy 2015 Americas Software
Summit, “The Role of Advanced DMS/ SCADA Software and Systems in Building a Resilient and Reliable Power Distribution
Grid,” March 2-6, 2015. 86 Newton-Evans Research Company, “The World Market for Substation Automation and Integration Programs in Electric
Utilities: 2014-2016, Vol. 1 - North American Market.” Pages 19&65, January 2014. 87 Ibid. 88 Newton-Evans 2016. Study of Protective Relay Trends in the World’s Electric Power Utilities Depict a Receptive Market for
Incorporating Advanced Technological Capabilities 89 Yan, Ye; Qian, Yi; Sharif, Hamid; and Tipper, David, "A Survey on Smart Grid Communication Infrastructures: Motivations,
Requirements and Challenges" (2013). Faculty Publications from the Department of Electrical and Computer Engineering.
Paper 316. Available online: http://digitalcommons.unl.edu/electricalengineeringfacpub/316 90 Source: Cisco Systems, Inc. 91 Trilliant. “Wireless WAN for the Smart Grid,” June 2013.
Available online: http://trilliantinc.com/wp-content/uploads/2013/06/Wireless-WAN-for-the-Smart-Grid-new.pdf 92 Cisco Systems, Inc., “TELEPROTECTION OVER MPLS WIDE-AREA NETWORKS”
Available online: https://www.cisco.com/c/dam/en_us/solutions/industries/energy/partner-utilities-teleprotection-over-
mpls.pdf 93 Wi-SUN Alliance Releases its Field Area Network Specification. Available online: https://www.wi-
sun.org/index.php/en/about-us/pr/93-pr-may16-2016 94 Adapted from: www.sandc.com “SpeedNet Radios.” Available online: https://www.sandc.com/en/products--
services/products/speednet-radios/ 95 Kuzlu, Murat, Pipattanasomporn, Manisa, Rahman, Saifur. “Communication network requirements for major smart grid
applications in HAN, NAN and WAN,” Virginia Tech, Advanced Research Institute, April 2014. Available online:
http://www.saifurrahman.org/wp-content/uploads/2014/12/Communication-network-requirements-for-major-smart-grid-
2.pdf

MODERN DISTRIBUTION GRID: VOLUME II │ 72
96 See http://www.utc.org 97 GTM Research Whitepaper,” Trends in Utility Smart Grid Communications Management,” Page 15, 2013. Available online:
https://www.ericsson.com/res/docs/2013/trends-in-utility-smart-grid-communications-management.pdf 98 Pacific Northwest National Laboratory. “The Emerging Interdependence of the Electric Power Grid & Information and
Communication Technology,” Page 5.6, August 2015. Available online:
http://www.pnnl.gov/main/publications/external/technical_reports/PNNL-24643.pdf 99 May also be referred to as OAM&P (Operations, Administration, Monitoring and Provisioning, or FCAPS (Fault,
Configuration, Accounting, Performance, Security) 100 Cisco Whitepaper. “Multiprotocol Label Switching for the Utility Wide Area Network,” Page 2, 2013.
Available online: http://www.cisco.com/c/dam/en_us/solutions/industries/docs/energy/mpls_wp_v2.pdf 101 Schneider Electric Blog. ”Electric Utilities: Boost Communications Reliability with MLPS,” November 2016.
Available online: http://blog.schneider-electric.com/utilities/2016/11/18/boost-communications-reliability-mpls/ 102 De Ghein, Luc. “MPLS Fundamentals,” Page 6, November 2006. 103 Network Innovations. “VSAT: Global High Speed Internet Services”
Available online: http://www.networkinv.com/technology/vsat/ 104 Long Term Evolution (LTE) is a 4G wireless broadband technology developed by the Third Generation Partnership Project
(3GPP), an industry trade group. 3GPP engineers named the technology "Long Term Evolution" because it represents the
next step (4G) in a progression from GSM, a 2G standard, to UMTS (Universal Mobile Telecommunications System),
the 3G technologies based upon GSM. LTE provides significantly increased peak data rates, with the potential for
100 Mbps downstream and 30 Mbps upstream, reduced latency, scalable bandwidth capacity, and backwards compatibility
with existing GSM and UMTS technology. Future developments could yield peak throughput on the order of 300 Mbps. 4G
represents the fourth generation of data technology for cellular networks, as defined by the radio sector of the
International Telecommunication Union (ITU-R). 105 The Next Generation 5G Leadership in the U.S., Cellular Telephone Industry Association (CTIA), February 2016
Available online: http://www.ctia.org/docs/default-source/default-document-library/5g_white-paper_web2.pdf 106 Land Mobile Radio Systems, http://wireless.fcc.gov/services/index.htm?job=service_home&id=private_land_radio 107 "WiMAX Forum – Technology," Archived from the original on July 22, 2008, Retrieved 2008-07-22. Available online:
https://web.archive.org/web/20080722062158/http://www.wimaxforum.org/technology/ 108 Developed from: Energy Central. “What’s up with RF Mesh Networks – is it mesh or mush?” December 2013. Available
online: http://www.energycentral.net/article/03/12/whats-rf-mesh-networks-it-mesh-or-mush 109 S&C Speednet 110 Sensus, Tantalus 111 West Monroe Partners. “Analog Circuit Replacement: The Race to the end of the PSTN – Survey Results.” Available online:
http://www.westmonroepartners.com/Insights/Newsletters/West-News-Energy-and-Utilities-July-2013/Analog-Circuit-
Replacement 112 Federal Communications Commission. “Technology Advisory Council – Broadband Infrastructure Deployment Working
Group.” Available online: https://transition.fcc.gov/oet/tac/TACMarch2011mtgfullpresentation.pdf 113 Wireless Internet Service Providers Association
See http://www.wispa.org 114 JD Taft, “Advanced Networking Paradigms for High-DER Distribution Grids,” Page 5, May 2016. 115 Next Generation Communications, “4G LTE and Smart Grid Changing the Broadband Game for Electric Utilities,” December
2012.
Available online: http://next-generation-communications.tmcnet.com/topics/industries/articles/318094-4g-lte-smart-grid-
changing-broadband-game-electric.htm 116 Adapted from AT&T Newsroom. Available online:
http://about.att.com/story/att_smart_cities_welcomes_spruce_finance.html 117 Metering and Smart Energy International. Available online: https://www.metering.com/news/att-nokia-collaborates-for-
long-term-evolution-network-development/ 118 Electric Energy online. Available online:
http://www.electricenergyonline.com/detail_news.php?ID=602899&titre=Sentient+Energy+to+Add+Speed%2C+Coverage%
2C+and+Reliability+to+Electric+Grid+Analytics+with+AT%26T+Connectivity&cat=;53 119 Developed from: U.S. Department of Energy.=, “2014 Smart Grid System Report, Report to Congress, August 2014,” Page
11, August 2014. Available online: https://energy.gov/sites/prod/files/2014/08/f18/SmartGrid-SystemReport2014.pdf 120 WiSUN Alliance. Available online: https://www.wi-sun.org/index.php/en/

MODERN DISTRIBUTION GRID: VOLUME II │ 73
121 WiFi Alliance. Available online: http://www.wi-fi.org 122 Taft, JD and De Martini, P., Sensing and Measurement Architecture for a Modern Grid, PNNL-Caltech, February 2016. 123 Taft, JD, De Martini, P and von Prellwitz, L., Utility Data Management & Intelligence, Cisco Systems, May 2012 124 Minnesota Public Utilities Commission. “Staff Report on Grid Modernization.” Page 24, March 2016. 125 New York Market Design and Platform Technology Working Group (MDPT). “Report of the Market Design and Platform
Technology Working Group,” Pages 89-95, August 2015. 126 New York Market Design and Platform Technology Working Group (MDPT). “Report of the Market Design and Platform
Technology Working Group,” Page 89-90, August 2015. 127 Smartgrid.gov, “Smart Grid Asset Descriptions”. Available online: https://www.smartgrid.gov/files/description_of_assets.pdf 128 Malmedal, Keith and Sen, PK, “Potential of Massively Deployed Sensors Applications in Substation Engineering,” May 2012.
Available online: http://www.neiengineering.com/wp-content/uploads/2012/05/Potential-of-Massively-Deployed-Sensors-
Applications-in-Substation-Engineering.pdf 129 Energy.gov., “ORNL, Chattanooga Electric Power Board test the role of sensors in grid innovation,” February 8, 2017.
Available online: https://energy.gov/oe/articles/ornl-chattanooga-electric-power-board-test-role-sensors-grid-innovation 130 De Martini, Paul and Taft, Jeffrey, ”Sensing and Measurement for Advanced Power Grids Version 1.3,” October 22, 2012.
Available online: http://gridarchitecture.pnnl.gov/media/advanced/Sensing%20for%20Advanced%20Grids%20v1.3.pdf 131 Adapted from: Matthew Lave, Matthew J. Reno, Joshua Stein and Ryan Smith, “Low-Cost Solar Variability Sensors for
Ubiquitous Deployment,” Sandia National Laboratories. Available online:
https://www.osti.gov/scitech/servlets/purl/1257765 132 Adapted from: Southern California Edison. “2018 General Rate Case Transmission & Distribution (T&D) Volume 10 – Grid
Modernization,” Page 7, September 2016. Available online:
http://www3.sce.com/sscc/law/dis/dbattach5e.nsf/0/49FCCC4EB70514FB882580210068F69D/$FILE/SCE02V10.pdf 133 Peter Fuhr, Ph.D, “Unmanned Aerial Systems (UAS), the Internet of Things (IoT) and Modernization of the Electric Grid – an
overview,” November 2015. Available online: http://uasresearch.ornl.gov/media/UAS-to-Modern-Grid.pdf 134 Matthew Lave, Matthew J. Reno, Joshua Stein and Ryan Smith. “Low-Cost Solar Variability Sensors for Ubiquitous
Deployment”. Sandia National Laboratories. 135 Irwin, Richard. “Clarity and Context the Emerging Tool of Operational Analytics,” November 2016. Available online:
http://www.elp.com/articles/powergrid_international/print/volume-21/issue-11/features/clarity-and-context-the-
emerging-tool-of-operational-analytics.html 136 Department of Energy, “Quadrennial Technology Review – An Assessment of Energy Technologies and Research
Opportunities, Chapter 3, Section 3E.” Pages 11-12, September 2015. 137 Dirkman, John, Best Practices for Creating Your Smart Grid Network Model, Schneider Electric. Available online:
http://cdn.iotwf.com/resources/8/Best-practices-for-creating-your-Smart-Grid-network-model_2013.pdf 138 EnerNex Corporation, prepared for U.S. Department of Energy, “Load Modeling and State Estimation for Power Distribution
Systems: Final Report,” Page 4, May 2010. 139 CEE, Technical University of Denmark, Danish Energy Association, DONG Energy, “Real Time Measurements and their effects
on State Estimation of Distribution Power System”.
Available online: file:///C:/Users/37386/Downloads/Real-
time_Measurements_and_their_Effects_on_State_Estimation_of_Distribution_Power_System.pdf 140 Department of Energy. “Quadrennial Technology Review – An Assessment of Energy Technologies and Research
Opportunities, Chapter 3, Section 3E.” Pages 18 & 24, September 2015. 141 New York Market Design and Platform Technology Working Group (MDPT), “Report of the Market Design and Platform
Technology Working Group,” Page 142, August 2015. 142 Pike Research, “Executive Summary: Utility Geographic Information Systems,” Page 1, Q1 2012. Available online:
http://www.navigantresearch.com/wp-content/uploads/2012/03/UGIS-12-Executive-Summary.pdf 143 Oracle Utilities Meter Data Management Data Sheet. Available online:
http://www.oracle.com/us/industries/utilities/046533.pdf 144 Accenture, “Achieving High Performance in Smart Grid Data Management,” Pages 8 and 9, 2010. Available online:
https://www.smartgrid.gov/files/Achieving_High_Performance_in_Smart_Grid_Data_Management_201012.pdf 145 Dirkman, John. Best Practices for Creating Your Smart Grid Network Model, Schneider Electric. 146 CEE, Technical University of Denmark, Danish Energy Association, DONG Energy, “Real Time Measurements and their effects
on State Estimation of Distribution Power System.” 147 Pike Research. “Executive Summary: Utility Geographic Information Systems,” Page 4, Q1 2012. 148 SolarCity, A Pathway to the Distributed Grid, Page 20, February 2016

MODERN DISTRIBUTION GRID: VOLUME II │ 74
149 ConEdison, Brooklyn Queens Demand Management Response Program Guidelines, June 28, 2016 150 “Taking the first steps towards condition-based maintenance,” ABB 2014, Available online:
http://new.abb.com/docs/librariesprovider139/default-document-library/wp-
2_first_steps_to_condition_maint_wp.pdf?sfvrsn=2 151 “Condition-Based Maintenance Bolsters the Bottom Line in Power Generation,” Page 2, OSIsoft 2015.
Available online: http://www.wiredcity.com/uploadedFiles/Content/PI_System/wp-power-cbm-lt-en.pdf 152 Paul De Martini, Dale Murdock, et. al., “Evolving Distribution Operational Markets,” Page 6, December, 2016.
http://resnick.caltech.edu/docs/EDOM.pdf 153 Greentech Leadership Group and Caltech Resnick Institute, “More Than Smart – A Framework to Make the Distribution Grid
More Open, Efficient and Resilient,” August 2014. Available online: http://authors.library.caltech.edu/48575/ 154 New York Market Design and Platform Technology Working Group (MDPT), “Report of the Market Design and Platform
Technology Working Group,” Page 98&99, August 2015. Available online: http://nyssmartgrid.com/wp-
content/uploads/MDPT-Report_150817_Final.pdf 155 Green Button Alliance, http://www.greenbuttondata.org/ 156 Orange Button, “Enabling Standardized Data Exchanges for Enhanced Access, Industry Connections, and Solar Marketplace
Advancements,” Available online: http://www.orangebuttondata.org/ 157 Developed by referencing: RAP Online, “The Case for Market Monitoring – A Key to Successful Electricity Markets,” July
2016. http://www.raponline.org/case-for-market-monitoring/ 158 Department of Energy, “Orange Button – Solar Bankability Data To Advance Transactions And Access (Sb-Data),” Available
online: https://energy.gov/eere/sunshot/orange-button-solar-bankability-data-advance-transactions-and-access-sb-data