volume no 10 issue no 09 (september issn 2231-5756
TRANSCRIPT

VOLUME NO. 10 (2020), ISSUE NO. 09 (SEPTEMBER) ISSN 2231-5756
A Monthly Double-Blind Peer Reviewed (Refereed/Juried) Open Access International e-Journal - Included in the International Serial Directories Indexed & Listed at:
Ulrich's Periodicals Directory ©, ProQuest, U.S.A., Cabell’s Directories of Publishing Opportunities, U.S.A., Google Scholar,
Indian Citation Index (ICI), J-Gage, India [link of the same is duly available at Inflibnet of University Grants Commission (U.G.C.)],
Index Copernicus Publishers Panel, Poland with IC Value of 5.09 (2012) & number of libraries all around the world.
Circulated all over the world & Google has verified that scholars of more than 6575 Cities in 197 countries/territories are visiting our journal on regular basis.
Ground Floor, Building No. 1041-C-1, Devi Bhawan Bazar, JAGADHRI – 135 003, Yamunanagar, Haryana, INDIA
http://ijrcm.org.in/

VOLUME NO. 10 (2020), ISSUE NO. 09 (SEPTEMBER) ISSN 2231-5756
INTERNATIONAL JOURNAL OF RESEARCH IN COMMERCE, IT & MANAGEMENT A Monthly Double-Blind Peer Reviewed (Refereed/Juried) Open Access International e-Journal - Included in the International Serial Directories
http://ijrcm.org.in/
ii
CONTENTS
Sr.
No.
TITLE & NAME OF THE AUTHOR (S)
Page
No.
1. A REVIEW ON FACTORS AFFECTING ADOPTION OF MOBILE
BANKING
SHILPA BIDANI & Dr. M. S. SENAM RAJU
1
2. EFFECT OF NON-PERFORMING ASSETS ON BANKING
SECTOR: A STUDY ON STATE BANK OF INDIA
Dr. JYOTIRMOY KOLEY
6
3. A STUDY ON THE PROVISIONS OF NOTIONAL RENT IN
INDIAN INCOME TAX
VARANASI. RAHUL
10
4. A STUDY OF CUSTOMER BEHAVIOR TOWARDS TECHNOLOGY
IN BANKING SECTOR: A STUDY ON DHARWAD CITY
PAVANKUMAR U D & MEGHA G PATIL
13
5. IMPACT OF PANDEMIC INDUCED LOCKDOWN ON STOCK
MARKET PERFORMANCE WITH SPECIAL REFERENCE TO
INDIAN EQUITY MARKET
Dr. RAVINDRA
19
REQUEST FOR FEEDBACK & DISCLAIMER 23

VOLUME NO. 10 (2020), ISSUE NO. 09 (SEPTEMBER) ISSN 2231-5756
INTERNATIONAL JOURNAL OF RESEARCH IN COMMERCE, IT & MANAGEMENT A Monthly Double-Blind Peer Reviewed (Refereed/Juried) Open Access International e-Journal - Included in the International Serial Directories
http://ijrcm.org.in/
iii
FOUNDER PATRON Late Sh. RAM BHAJAN AGGARWAL
Former State Minister for Home & Tourism, Government of Haryana Former Vice-President, Dadri Education Society, Charkhi Dadri Former President, Chinar Syntex Ltd. (Textile Mills), Bhiwani
CO-ORDINATOR Dr. BHAVET
Former Faculty, Shree Ram Institute of Engineering & Technology, Urjani
ADVISOR Prof. S. L. MAHANDRU
Principal (Retd.), Maharaja Agrasen College, Jagadhri
EDITOR Dr. PARVEEN KUMAR
Professor, Department of Computer Science, NIMS University, Jaipur
CO-EDITOR Dr. A. SASI KUMAR
Professor, Vels Institute of Science, Technology & Advanced Studies (Deemed to be University), Pallavaram
EDITORIAL ADVISORY BOARD Dr. S. P. TIWARI
Head, Department of Economics & Rural Development, Dr. Ram Manohar Lohia Avadh University, Faizabad Dr. CHRISTIAN EHIOBUCHE
Professor of Global Business/Management, Larry L Luing School of Business, Berkeley College, USA Dr. SIKANDER KUMAR
Vice Chancellor, Himachal Pradesh University, Shimla, Himachal Pradesh Dr. JOSÉ G. VARGAS-HERNÁNDEZ
Research Professor, University Center for Economic & Managerial Sciences, University of Guadalajara, Guadala-jara, Mexico
Dr. TEGUH WIDODO Dean, Faculty of Applied Science, Telkom University, Bandung Technoplex, Jl. Telekomunikasi, Indonesia
Dr. M. S. SENAM RAJU Professor, School of Management Studies, I.G.N.O.U., New Delhi
Dr. A SAJEEVAN RAO Professor & Director, Accurate Institute of Advanced Management, Greater Noida
Dr. D. S. CHAUBEY Professor & Dean (Research & Studies), Uttaranchal University, Dehradun
Dr. CLIFFORD OBIYO OFURUM Professor of Accounting & Finance, Faculty of Management Sciences, University of Port Harcourt, Nigeria
Dr. KAUP MOHAMED Dean & Managing Director, London American City College/ICBEST, United Arab Emirates
Dr. VIRENDRA KUMAR SHRIVASTAVA Director, Asia Pacific Institute of Information Technology, Panipat
Dr. MIKE AMUHAYA IRAVO Principal, Jomo Kenyatta University of Agriculture & Tech., Westlands Campus, Nairobi-Kenya
Dr. SYED TABASSUM SULTANA Principal, Matrusri Institute of Post Graduate Studies, Hyderabad
Dr. BOYINA RUPINI Director, School of ITS, Indira Gandhi National Open University, New Delhi
Dr. NEPOMUCENO TIU Chief Librarian & Professor, Lyceum of the Philippines University, Laguna, Philippines

VOLUME NO. 10 (2020), ISSUE NO. 09 (SEPTEMBER) ISSN 2231-5756
INTERNATIONAL JOURNAL OF RESEARCH IN COMMERCE, IT & MANAGEMENT A Monthly Double-Blind Peer Reviewed (Refereed/Juried) Open Access International e-Journal - Included in the International Serial Directories
http://ijrcm.org.in/
iv
Dr. SANJIV MITTAL Professor & Dean, University School of Management Studies, GGS Indraprastha University, Delhi
Dr. RAJENDER GUPTA Convener, Board of Studies in Economics, University of Jammu, Jammu
Dr. SHIB SHANKAR ROY Professor, Department of Marketing, University of Rajshahi, Rajshahi, Bangladesh
Dr. SRINIVAS MADISHETTI Professor, School of Business, Mzumbe University, Tanzania
Dr. NAWAB ALI KHAN Professor & Dean, Faculty of Commerce, Aligarh Muslim University, Aligarh, U.P.
MUDENDA COLLINS Head, Operations & Supply Chain, School of Business, The Copperbelt University, Zambia
Dr. EGWAKHE A. JOHNSON Professor & Director, Babcock Centre for Executive Development, Babcock University, Nigeria
Dr. A. SURYANARAYANA Professor, Department of Business Management, Osmania University, Hyderabad
P. SARVAHARANA Asst. Registrar, Indian Institute of Technology (IIT), Madras
Dr. MURAT DARÇIN Associate Dean, Gendarmerie and Coast Guard Academy, Ankara, Turkey
Dr. ABHAY BANSAL Head, Department of Information Technology, Amity School of Engg. & Tech., Amity University, Noida
Dr. YOUNOS VAKIL ALROAIA Head of International Center, DOS in Management, Semnan Branch, Islamic Azad University, Semnan, Iran
WILLIAM NKOMO Asst. Head of the Department, Faculty of Computing, Botho University, Francistown, Botswana
Dr. JAYASHREE SHANTARAM PATIL (DAKE) Faculty in Economics, KPB Hinduja College of Commerce, Mumbai
SHASHI KHURANA Associate Professor, S. M. S. Khalsa Lubana Girls College, Barara, Ambala
Dr. SEOW TA WEEA Associate Professor, Universiti Tun Hussein Onn Malaysia, Parit Raja, Malaysia
Dr. OKAN VELI ŞAFAKLI Professor & Dean, European University of Lefke, Lefke, Cyprus
Dr. MOHENDER KUMAR GUPTA Associate Professor, Government College, Hodal
Dr. BORIS MILOVIC Associate Professor, Faculty of Sport, Union Nikola Tesla University, Belgrade, Serbia
Dr. LALIT KUMAR Course Director, Faculty of Financial Management, Haryana Institute of Public Administration, Gurugram
Dr. MOHAMMAD TALHA
Associate Professor, Department of Accounting & MIS, College of Industrial Management, King Fahd University of Petroleum & Minerals, Dhahran, Saudi Arabia
Dr. V. SELVAM Associate Professor, SSL, VIT University, Vellore
Dr. IQBAL THONSE HAWALDAR Associate Professor, College of Business Administration, Kingdom University, Bahrain
Dr. PARDEEP AHLAWAT Associate Professor, Institute of Management Studies & Research, Maharshi Dayanand University, Rohtak
Dr. ALEXANDER MOSESOV Associate Professor, Kazakh-British Technical University (KBTU), Almaty, Kazakhstan

VOLUME NO. 10 (2020), ISSUE NO. 09 (SEPTEMBER) ISSN 2231-5756
INTERNATIONAL JOURNAL OF RESEARCH IN COMMERCE, IT & MANAGEMENT A Monthly Double-Blind Peer Reviewed (Refereed/Juried) Open Access International e-Journal - Included in the International Serial Directories
http://ijrcm.org.in/
v
Dr. ASHOK KUMAR CHAUHAN Reader, Department of Economics, Kurukshetra University, Kurukshetra
Dr. BHAVET Former Faculty, Shree Ram Institute of Engineering & Technology, Urjani
YU-BING WANG Faculty, department of Marketing, Feng Chia University, Taichung, Taiwan
SURJEET SINGH Faculty, Department of Computer Science, G. M. N. (P.G.) College, Ambala Cantt.
Dr. TITUS AMODU UMORU Professor, Kwara State University, Kwara State, Nigeria
Dr. RAJESH MODI Faculty, Yanbu Industrial College, Kingdom of Saudi Arabia
Dr. SAMBHAVNA Faculty, I.I.T.M., Delhi
Dr. THAMPOE MANAGALESWARAN Faculty, Vavuniya Campus, University of Jaffna, Sri Lanka
Dr. SHIVAKUMAR DEENE Faculty, Dept. of Commerce, School of Business Studies, Central University of Karnataka, Gulbarga
SURAJ GAUDEL BBA Program Coordinator, LA GRANDEE International College, Simalchaur - 8, Pokhara, Nepal
FORMER TECHNICAL ADVISOR AMITA
FINANCIAL ADVISORS DICKEN GOYAL
Advocate & Tax Adviser, Panchkula NEENA
Investment Consultant, Chambaghat, Solan, Himachal Pradesh
LEGAL ADVISORS JITENDER S. CHAHAL
Advocate, Punjab & Haryana High Court, Chandigarh U.T. CHANDER BHUSHAN SHARMA
Advocate & Consultant, District Courts, Yamunanagar at Jagadhri
SUPERINTENDENT SURENDER KUMAR POONIA

VOLUME NO. 10 (2020), ISSUE NO. 09 (SEPTEMBER) ISSN 2231-5756
INTERNATIONAL JOURNAL OF RESEARCH IN COMMERCE, IT & MANAGEMENT A Monthly Double-Blind Peer Reviewed (Refereed/Juried) Open Access International e-Journal - Included in the International Serial Directories
http://ijrcm.org.in/
vi
CALL FOR MANUSCRIPTS We invite unpublished novel, original, empirical and high quality research work pertaining to the recent developments & practices in the areas of Com-puter Science & Applications; Commerce; Business; Finance; Marketing; Human Resource Management; General Management; Banking; Economics; Tourism Administration & Management; Education; Law; Library & Information Science; Defence & Strategic Studies; Electronic Science; Corporate Gov-ernance; Industrial Relations; and emerging paradigms in allied subjects like Accounting; Accounting Information Systems; Accounting Theory & Practice; Auditing; Behavioral Accounting; Behavioral Economics; Corporate Finance; Cost Accounting; Econometrics; Economic Development; Economic History; Financial Institutions & Markets; Financial Services; Fiscal Policy; Government & Non Profit Accounting; Industrial Organization; International Economics & Trade; International Finance; Macro Economics; Micro Economics; Rural Economics; Co-operation; Demography: Development Planning; Development Studies; Applied Economics; Development Economics; Business Economics; Monetary Policy; Public Policy Economics; Real Estate; Regional Economics; Political Science; Continuing Education; Labour Welfare; Philosophy; Psychology; Sociology; Tax Accounting; Advertising & Promotion Management; Management Information Systems (MIS); Business Law; Public Responsibility & Ethics; Communication; Direct Marketing; E-Commerce; Global Business; Health Care Administration; Labour Relations & Human Resource Management; Marketing Research; Marketing Theory & Applications; Non-Profit Or-ganizations; Office Administration/Management; Operations Research/Statistics; Organizational Behavior & Theory; Organizational Development; Pro-duction/Operations; International Relations; Human Rights & Duties; Public Administration; Population Studies; Purchasing/Materials Management; Re-tailing; Sales/Selling; Services; Small Business Entrepreneurship; Strategic Management Policy; Technology/Innovation; Tourism & Hospitality; Transpor-tation Distribution; Algorithms; Artificial Intelligence; Compilers & Translation; Computer Aided Design (CAD); Computer Aided Manufacturing; Computer Graphics; Computer Organization & Architecture; Database Structures & Systems; Discrete Structures; Internet; Management Information Systems; Mod-eling & Simulation; Neural Systems/Neural Networks; Numerical Analysis/Scientific Computing; Object Oriented Programming; Operating Systems; Pro-gramming Languages; Robotics; Symbolic & Formal Logic; Web Design and emerging paradigms in allied subjects.
Anybody can submit the soft copy of unpublished novel; original; empirical and high quality research work/manuscript anytime in M.S. Word format after preparing the same as per our GUIDELINES FOR SUBMISSION; at our email address i.e. [email protected] or online by clicking the link online submission as given on our website (FOR ONLINE SUBMISSION, CLICK HERE).
GUIDELINES FOR SUBMISSION OF MANUSCRIPT
1. COVERING LETTER FOR SUBMISSION:
DATED: _____________
THE EDITOR
IJRCM
Subject: SUBMISSION OF MANUSCRIPT IN THE AREA OF______________________________________________________________.
(e.g. Finance/Mkt./HRM/General Mgt./Engineering/Economics/Computer/IT/ Education/Psychology/Law/Math/other, please
specify)
DEAR SIR/MADAM
Please find my submission of manuscript titled ‘___________________________________________’ for likely publication in one of
your journals.
I hereby affirm that the contents of this manuscript are original. Furthermore, it has neither been published anywhere in any language
fully or partly, nor it is under review for publication elsewhere.
I affirm that all the co-authors of this manuscript have seen the submitted version of the manuscript and have agreed to inclusion of
their names as co-authors.
Also, if my/our manuscript is accepted, I agree to comply with the formalities as given on the website of the journal. The Journal has
discretion to publish our contribution in any of its journals.
NAME OF CORRESPONDING AUTHOR :
Designation/Post* :
Institution/College/University with full address & Pin Code :
Residential address with Pin Code :
Mobile Number (s) with country ISD code :
Is WhatsApp or Viber active on your above noted Mobile Number (Yes/No) :
Landline Number (s) with country ISD code :
E-mail Address :
Alternate E-mail Address :
Nationality :
* i.e. Alumnus (Male Alumni), Alumna (Female Alumni), Student, Research Scholar (M. Phil), Research Scholar (Ph. D.), JRF, Research Assistant, Assistant
Lecturer, Lecturer, Senior Lecturer, Junior Assistant Professor, Assistant Professor, Senior Assistant Professor, Co-ordinator, Reader, Associate Profes-
sor, Professor, Head, Vice-Principal, Dy. Director, Principal, Director, Dean, President, Vice Chancellor, Industry Designation etc. The qualification of
author is not acceptable for the purpose.

VOLUME NO. 10 (2020), ISSUE NO. 09 (SEPTEMBER) ISSN 2231-5756
INTERNATIONAL JOURNAL OF RESEARCH IN COMMERCE, IT & MANAGEMENT A Monthly Double-Blind Peer Reviewed (Refereed/Juried) Open Access International e-Journal - Included in the International Serial Directories
http://ijrcm.org.in/
vii
NOTES:
a) The whole manuscript has to be in ONE MS WORD FILE only, which will start from the covering letter, inside the manuscript. pdf.
version is liable to be rejected without any consideration.
b) The sender is required to mention the following in the SUBJECT COLUMN of the mail:
New Manuscript for Review in the area of (e.g. Finance/Marketing/HRM/General Mgt./Engineering/Economics/Computer/IT/
Education/Psychology/Law/Math/other, please specify)
c) There is no need to give any text in the body of the mail, except the cases where the author wishes to give any specific message
w.r.t. to the manuscript.
d) The total size of the file containing the manuscript is expected to be below 1000 KB.
e) Only the Abstract will not be considered for review and the author is required to submit the complete manuscript in the first
instance.
f) The journal gives acknowledgement w.r.t. the receipt of every email within twenty-four hours and in case of non-receipt of
acknowledgment from the journal, w.r.t. the submission of the manuscript, within two days of its submission, the corresponding
author is required to demand for the same by sending a separate mail to the journal.
g) The author (s) name or details should not appear anywhere on the body of the manuscript, except on the covering letter and the
cover page of the manuscript, in the manner as mentioned in the guidelines.
2. MANUSCRIPT TITLE: The title of the paper should be typed in bold letters, centered and fully capitalised.
3. AUTHOR NAME (S) & AFFILIATIONS: Author (s) name, designation, affiliation (s), address, mobile/landline number (s), and email/al-
ternate email address should be given underneath the title.
4. ACKNOWLEDGMENTS: Acknowledgements can be given to reviewers, guides, funding institutions, etc., if any.
5. ABSTRACT: Abstract should be in fully Italic printing, ranging between 150 to 300 words. The abstract must be informative and eluci-
dating the background, aims, methods, results & conclusion in a SINGLE PARA. Abbreviations must be mentioned in full.
6. KEYWORDS: Abstract must be followed by a list of keywords, subject to the maximum of five. These should be arranged in alphabetic
order separated by commas and full stop at the end. All words of the keywords, including the first one should be in small letters, except
special words e.g. name of the Countries, abbreviations etc.
7. JEL CODE: Provide the appropriate Journal of Economic Literature Classification System code (s). JEL codes are available at www.aea-
web.org/econlit/jelCodes.php. However, mentioning of JEL Code is not mandatory.
8. MANUSCRIPT: Manuscript must be in BRITISH ENGLISH prepared on a standard A4 size PORTRAIT SETTING PAPER. It should be free
from any errors i.e. grammatical, spelling or punctuation. It must be thoroughly edited at your end.
9. HEADINGS: All the headings must be bold-faced, aligned left and fully capitalised. Leave a blank line before each heading.
10. SUB-HEADINGS: All the sub-headings must be bold-faced, aligned left and fully capitalised.
11. MAIN TEXT:
THE MAIN TEXT SHOULD FOLLOW THE FOLLOWING SEQUENCE:
INTRODUCTION
REVIEW OF LITERATURE
NEED/IMPORTANCE OF THE STUDY
STATEMENT OF THE PROBLEM
OBJECTIVES
HYPOTHESIS (ES)
RESEARCH METHODOLOGY
RESULTS & DISCUSSION
FINDINGS
RECOMMENDATIONS/SUGGESTIONS
CONCLUSIONS
LIMITATIONS
SCOPE FOR FURTHER RESEARCH
REFERENCES
APPENDIX/ANNEXURE
The manuscript should preferably be in 2000 to 5000 WORDS, But the limits can vary depending on the nature of the manuscript.

VOLUME NO. 10 (2020), ISSUE NO. 09 (SEPTEMBER) ISSN 2231-5756
INTERNATIONAL JOURNAL OF RESEARCH IN COMMERCE, IT & MANAGEMENT A Monthly Double-Blind Peer Reviewed (Refereed/Juried) Open Access International e-Journal - Included in the International Serial Directories
http://ijrcm.org.in/
viii
12. FIGURES & TABLES: These should be simple, crystal CLEAR, centered, separately numbered & self-explained, and the titles must be
above the table/figure. Sources of data should be mentioned below the table/figure. It should be ensured that the tables/figures are
referred to from the main text.
13. EQUATIONS/FORMULAE: These should be consecutively numbered in parenthesis, left aligned with equation/formulae number placed
at the right. The equation editor provided with standard versions of Microsoft Word may be utilised. If any other equation editor is
utilised, author must confirm that these equations may be viewed and edited in versions of Microsoft Office that does not have the
editor.
14. ACRONYMS: These should not be used in the abstract. The use of acronyms is elsewhere is acceptable. Acronyms should be defined
on its first use in each section e.g. Reserve Bank of India (RBI). Acronyms should be redefined on first use in subsequent sections.
15. REFERENCES: The list of all references should be alphabetically arranged. The author (s) should mention only the actually utilised
references in the preparation of manuscript and they may follow Harvard Style of Referencing. Also check to ensure that everything
that you are including in the reference section is duly cited in the paper. The author (s) are supposed to follow the references as per
the following:
All works cited in the text (including sources for tables and figures) should be listed alphabetically.
Use (ed.) for one editor, and (ed.s) for multiple editors.
When listing two or more works by one author, use --- (20xx), such as after Kohl (1997), use --- (2001), etc., in chronologically ascending
order.
Indicate (opening and closing) page numbers for articles in journals and for chapters in books.
The title of books and journals should be in italic printing. Double quotation marks are used for titles of journal articles, book chapters,
dissertations, reports, working papers, unpublished material, etc.
For titles in a language other than English, provide an English translation in parenthesis.
Headers, footers, endnotes and footnotes should not be used in the document. However, you can mention short notes to elucidate
some specific point, which may be placed in number orders before the references.
PLEASE USE THE FOLLOWING FOR STYLE AND PUNCTUATION IN REFERENCES:
BOOKS
Bowersox, Donald J., Closs, David J., (1996), "Logistical Management." Tata McGraw, Hill, New Delhi.
Hunker, H.L. and A.J. Wright (1963), "Factors of Industrial Location in Ohio" Ohio State University, Nigeria.
CONTRIBUTIONS TO BOOKS
Sharma T., Kwatra, G. (2008) Effectiveness of Social Advertising: A Study of Selected Campaigns, Corporate Social Responsibility, Edited
by David Crowther & Nicholas Capaldi, Ashgate Research Companion to Corporate Social Responsibility, Chapter 15, pp 287-303.
JOURNAL AND OTHER ARTICLES
Schemenner, R.W., Huber, J.C. and Cook, R.L. (1987), "Geographic Differences and the Location of New Manufacturing Facilities," Jour-
nal of Urban Economics, Vol. 21, No. 1, pp. 83-104.
CONFERENCE PAPERS
Garg, Sambhav (2011): "Business Ethics" Paper presented at the Annual International Conference for the All India Management Asso-
ciation, New Delhi, India, 19–23
UNPUBLISHED DISSERTATIONS
Kumar S. (2011): "Customer Value: A Comparative Study of Rural and Urban Customers," Thesis, Kurukshetra University, Kurukshetra.
ONLINE RESOURCES
Always indicate the date that the source was accessed, as online resources are frequently updated or removed.
WEBSITES
Garg, Bhavet (2011): Towards a New Gas Policy, Political Weekly, Viewed on January 01, 2012 http://epw.in/user/viewabstract.jsp

VOLUME NO. 10 (2020), ISSUE NO. 09 (SEPTEMBER) ISSN 2231-5756
INTERNATIONAL JOURNAL OF RESEARCH IN COMMERCE, IT & MANAGEMENT A Monthly Double-Blind Peer Reviewed (Refereed/Juried) Open Access International e-Journal - Included in the International Serial Directories
http://ijrcm.org.in/
1
A REVIEW ON FACTORS AFFECTING ADOPTION OF MOBILE BANKING
SHILPA BIDANI RESEARCH SCHOLAR
INDIRA GANDHI OPEN NATIONAL UNIVERSITY NEW DELHI
Dr. M. S. SENAM RAJU
PROFESSOR SCHOOL OF MANAGEMENT STUDIES
INDIRA GANDHI NATIONAL OPEN UNIVERSITY NEW DELHI
ABSTRACT
Mobile banking has arisen as an important distribution channel. It facilitates its customers to perform banking transactions on their mobile phones. This facility is provided by most of the banks in India and abroad. Customers can do various activities like viewing account balance, transfer funds, paying various bills etc. Mobile banking has already adopted by many consumers for doing banking transactions but the adoption is high only in some urban areas and metro cities but rest of the country is still untapped. This review paper aims to briefly review the literature on various factors influencing adoption of mobile banking identified by various researchers in worldwide and in India and advise guidelines for future research in this still developing field The most important drivers to adopt m banking are perceived usefulness, perceived ease of use and Perceived risk is the most important factor which inhibits the adoption.
KEYWORDS mobile banking, banking transactions.
JEL CODES O33, O33.
INTRODUCTION obile banking is an ability which allows customers to perform banking tasks on their mobile phones. This is offered by most of the banks across the world. Customers can use mobile banking to do various banking activities like checking account balance, make fund transfers and pay bills, etc. Mobile banking can be done by various ways such as mobile apps, SMS, USSD. Financial technology services adoption among internet users has doubled during the past
two years, and the adoption rate is growing. The data was collected from 27 markets in March 2019. It shows average 64% of digitally active consumers. (Global FinTech Adoption Index 2019)
CHART 1
Rising of consumer awareness and the swiftness at which customers can access their accounts using mobile has also led in a fall in usage of website usage and visits to bank branches. Footsteps to branch has fell from 476 million in 2011 to 278 million in 2016(UK finance report 2016). The current stats of mobile adoption are good news for the banks and the economy. This review paper aims to briefly review the existing literature on Mobile banking carried out worldwide and in India. The review paper has also made an attempt to produce the results and highlight the factors that affect Mobile banking adoption in India and Worldwide. This research examines 30 journal articles published between 2011 and 2019 in top journals. This review is an analysis based on studies published in technology, innovation, finance, banking journals, and major conferences.
OBJECTIVE OF THE STUDY Mobile banking is one of the most significant development to occur in the retail banking sector. It has provided convenience to the customer of accessing banking information anytime and anywhere. But still it is not accepted well by the banking customers. Hence it is important to explore the factors that motivate consumers in adoption of this new technology. The objective of this paper is to review the existing literature on M banking done in India and worldwide. The paper has made an effort to highlight the factors that predict the consumer’s intention to adopt m banking. The review results indicate Perceived usefulness, perceived risk, perceived ease of use, self-efficacy, Social Norms, Personal Innovativeness, Financial Cost, Performance Expectancy, Hedonic Motivation are the important factors that affect adoption of m banking among the consumers.
87
%
87
%
82
%
82
%
76
%
75
%
73
%
72
%
71
%
71
%
67
%
67
%
67
%
67
%
66
%
64
%
64
%
64
%
64
%
58
%
56
%
51
%
50
%
46
%
42
%
35
%
34
%
64
%
0%
20%
40%
60%
80%
100%
Ch
ina
Ind
ia
Ru
ssia
Sou
th A
fria
Co
lum
bia
Per
u
Ne
the
rlan
ds
Max
ico
Irel
and
UK
Arg
enti
na
Ho
ng
Ko
ng
Sin
gap
ore
Sou
th K
ore
a
Ch
ile
Bra
nzi
l
Ge
rman
y
Swed
en
Swit
zerl
and
Au
stra
lia
Spai
n
Ital
y
Can
ada
US
Bel
giu
m
Fran
ce
Jap
an
Wo
rld
wid
e
%ag
e o
f re
spo
nd
en
t in
eac
h c
ou
ntr
y
Source: Researcher
Financial Technology Service adoption among internet users in various countires, March 2019
M
VOLUME NO. 10 (2020), ISSUE NO. 09 (SEPTEMBER) ISSN 2231-5756
INTERNATIONAL JOURNAL OF RESEARCH IN COMMERCE, IT & MANAGEMENT A Monthly Double-Blind Peer Reviewed (Refereed/Juried) Open Access International e-Journal - Included in the International Serial Directories
http://ijrcm.org.in/
2
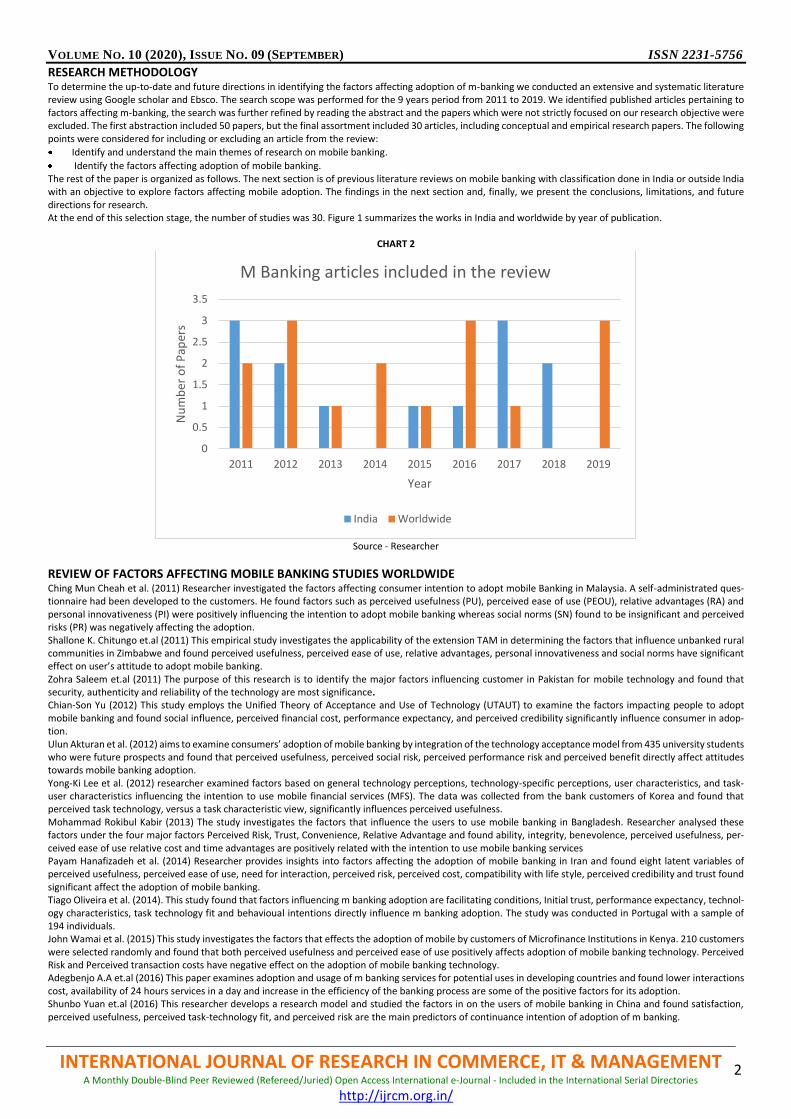
RESEARCH METHODOLOGY To determine the up-to-date and future directions in identifying the factors affecting adoption of m-banking we conducted an extensive and systematic literature review using Google scholar and Ebsco. The search scope was performed for the 9 years period from 2011 to 2019. We identified published articles pertaining to factors affecting m-banking, the search was further refined by reading the abstract and the papers which were not strictly focused on our research objective were excluded. The first abstraction included 50 papers, but the final assortment included 30 articles, including conceptual and empirical research papers. The following points were considered for including or excluding an article from the review:
Identify and understand the main themes of research on mobile banking.
Identify the factors affecting adoption of mobile banking. The rest of the paper is organized as follows. The next section is of previous literature reviews on mobile banking with classification done in India or outside India with an objective to explore factors affecting mobile adoption. The findings in the next section and, finally, we present the conclusions, limitations, and future directions for research. At the end of this selection stage, the number of studies was 30. Figure 1 summarizes the works in India and worldwide by year of publication.
CHART 2
Source - Researcher
REVIEW OF FACTORS AFFECTING MOBILE BANKING STUDIES WORLDWIDE Ching Mun Cheah et al. (2011) Researcher investigated the factors affecting consumer intention to adopt mobile Banking in Malaysia. A self-administrated ques-tionnaire had been developed to the customers. He found factors such as perceived usefulness (PU), perceived ease of use (PEOU), relative advantages (RA) and personal innovativeness (PI) were positively influencing the intention to adopt mobile banking whereas social norms (SN) found to be insignificant and perceived risks (PR) was negatively affecting the adoption. Shallone K. Chitungo et.al (2011) This empirical study investigates the applicability of the extension TAM in determining the factors that influence unbanked rural communities in Zimbabwe and found perceived usefulness, perceived ease of use, relative advantages, personal innovativeness and social norms have significant effect on user’s attitude to adopt mobile banking. Zohra Saleem et.al (2011) The purpose of this research is to identify the major factors influencing customer in Pakistan for mobile technology and found that security, authenticity and reliability of the technology are most significance. Chian-Son Yu (2012) This study employs the Unified Theory of Acceptance and Use of Technology (UTAUT) to examine the factors impacting people to adopt mobile banking and found social influence, perceived financial cost, performance expectancy, and perceived credibility significantly influence consumer in adop-tion. Ulun Akturan et al. (2012) aims to examine consumers’ adoption of mobile banking by integration of the technology acceptance model from 435 university students who were future prospects and found that perceived usefulness, perceived social risk, perceived performance risk and perceived benefit directly affect attitudes towards mobile banking adoption. Yong-Ki Lee et al. (2012) researcher examined factors based on general technology perceptions, technology-specific perceptions, user characteristics, and task-user characteristics influencing the intention to use mobile financial services (MFS). The data was collected from the bank customers of Korea and found that perceived task technology, versus a task characteristic view, significantly influences perceived usefulness. Mohammad Rokibul Kabir (2013) The study investigates the factors that influence the users to use mobile banking in Bangladesh. Researcher analysed these factors under the four major factors Perceived Risk, Trust, Convenience, Relative Advantage and found ability, integrity, benevolence, perceived usefulness, per-ceived ease of use relative cost and time advantages are positively related with the intention to use mobile banking services Payam Hanafizadeh et al. (2014) Researcher provides insights into factors affecting the adoption of mobile banking in Iran and found eight latent variables of perceived usefulness, perceived ease of use, need for interaction, perceived risk, perceived cost, compatibility with life style, perceived credibility and trust found significant affect the adoption of mobile banking. Tiago Oliveira et al. (2014). This study found that factors influencing m banking adoption are facilitating conditions, Initial trust, performance expectancy, technol-ogy characteristics, task technology fit and behavioual intentions directly influence m banking adoption. The study was conducted in Portugal with a sample of 194 individuals. John Wamai et al. (2015) This study investigates the factors that effects the adoption of mobile by customers of Microfinance Institutions in Kenya. 210 customers were selected randomly and found that both perceived usefulness and perceived ease of use positively affects adoption of mobile banking technology. Perceived Risk and Perceived transaction costs have negative effect on the adoption of mobile banking technology. Adegbenjo A.A et.al (2016) This paper examines adoption and usage of m banking services for potential uses in developing countries and found lower interactions cost, availability of 24 hours services in a day and increase in the efficiency of the banking process are some of the positive factors for its adoption. Shunbo Yuan et.al (2016) This researcher develops a research model and studied the factors in on the users of mobile banking in China and found satisfaction, perceived usefulness, perceived task-technology fit, and perceived risk are the main predictors of continuance intention of adoption of m banking.
0
0.5
1
1.5
2
2.5
3
3.5
2011 2012 2013 2014 2015 2016 2017 2018 2019
Nu
mb
er o
f P
aper
s
Year
M Banking articles included in the review
India Worldwide

VOLUME NO. 10 (2020), ISSUE NO. 09 (SEPTEMBER) ISSN 2231-5756
INTERNATIONAL JOURNAL OF RESEARCH IN COMMERCE, IT & MANAGEMENT A Monthly Double-Blind Peer Reviewed (Refereed/Juried) Open Access International e-Journal - Included in the International Serial Directories
http://ijrcm.org.in/
3
Veera Bhatiasevi (2016) attempts to identify the factors for the adoption of mobile banking in Thailand. Researcher has used extended existing UTAUT model. The results showed that performance expectancy, effort expectancy, social influence, perceived credibility, perceived convenience, and behavioual intention posited a positive relationship to use mobile banking. Sujeet Kumar Sharma (2017) This paper explores major antecedents influencing the mobile banking acceptance by extending two factors autonomous motivation and controlled motivation to TAM. Data was collected in Oman from 225 respondents and found major factor influencing adoption was trust and autonomous motivation. Abdullah M. Baabdullah et al. (2019) combines two models UTAUT2 and the D&M IS Success Model. It was found that factors like performance expectancy, price value, facilitating conditions, hedonic motivation, habit, system quality and service quality have a significant impact on actual use behaviour. Abdulkader Kaakeh et al. (2019), researched on bank customers living in UAE. to investigate the effects of factors like image, awareness, Shariah compliance and individualism, on the attitude and intention of customers. It was found that attitude and awareness affect intention directly, while image, awareness, Shariah compliance and individualism affect attitude directly and intention indirectly mediated by attitude. Lute Sakala et al. (2019) The study was done in Zambia to identify the factors that affect the adoption and use of mobile banking services. Researcher designed the questionnaire using TAM and collected a sample of 384 respondents having retail saving or current account in commercial bank and found positive relationship between perceived ease of use, perceived usefulness, user attitude, external variables, user intention and system use.
REVIEW OF FACTORS AFFECTING MOBILE BANKING STUDIES IN INDIA Archana Sharma (2011) This paper examines consumer adoption of a new electronic payment service and the positive factors influencing its adoption found are perceived risk, security and trustworthiness of the services. Purnima S. Sangle et al. (2011), this paper empirically explores the factors that can be used for making better mobile customer relationship services in banking and found perceived utility value is regarded as the most important factor. Siddhartha, Dasgupta et al. (2011) This study examined the antecedents to behavioual intention of mobile banking in Hyderabad and found Perceived Usefulness, Perceived Ease of Use, Perceived Image, Perceived Value, Self-Efficacy, Perceived Credibility and Tradition all positively affects behavioual Intentions towards mobile banking usage. Mohini S Samudra et al. (2012) This paper attempts to study the adoption of mobile banking in Pune city using the UTAUT model. Researcher used wide array of constructs to study the adoption and found convenience, compatibility, perception, social influence and Information are useful for the adoption of mobile banking services. Reji Kumar et al. (2012) examines the factors influencing the continuance decisions of adopters of m-banking services in Kerala and found perceived service quality, satisfaction and continuance intentions are positive towards adoption of m banking. Yogesh Jain (2013) paper examines factors influencing the adoption of consumer adoption of a new electronic payment service in South Rajasthan and found risk and security are the most significant factors for banking service adoption. P. S. Aithal et al. (2015) This is an empirical study to explore customer acceptance of mobile banking by developing six hypotheses and found demography of customers, personal banking experience & incentives, technology experience, psychology & culture, and security & trust are the factors affecting usage of M banking. S. V. Krishna Kishore et al. (2016) examined respondents of rural provinces in Karnataka state and used mixed sampling technique to collect 959 samples and found PE, EE, SI, Attitude, and PR significantly affect the dependent variable BI. Deepak Chawla et al. (2017) empirically examined the influence of different factors on user attitude and intention towards adopting mobile banking and found perceived trust, perceived ease of use (PEOU), perceived lifestyle compatibility, perceived efficiency and perceived convenience significantly affect user attitude towards adoption. Sumeet Gupta et al. (2017) researcher exploratory attempts to understand that the levels of security affect perceived risk and control on the consumer and ultimately it effects the adoption of mobile banking by Indian customers. It was found perceived risk and control plays and important role in influencing customers’ intention to adopt mobile banking. V.V. Ravi Kumar et.al (2017) article studies the factors influencing intention to use mobile banking on management students. The study utilizes two constructs of the technology adoption model and then extends it further to include two additional constructs. The results suggest that perceived usefulness and perceived ease of use, social influence and trust propensity are the underlying factors in respect of the behavioural intention to use mobile banking services. Amit Shankar et al. (2018) identified perceived ease of use (PEOU), perceived usefulness (PU), trust, and self-efficacy (SE) are significant and have positive impact on affecting mobile payment adoption intention in India. Richa Priya et al. (2018) examined the factors affecting mobile banking adoption among young Indian consumers. 269 respondents aged between 23 and 30 years. findings of the study suggest that perceived usefulness (PU), perceived ease of use (PEU), perceived credibility (PC) and structural assurance (SA) are strong determinants of user satisfaction (US) and behavioual intention (BI) to use the mobile banking service.
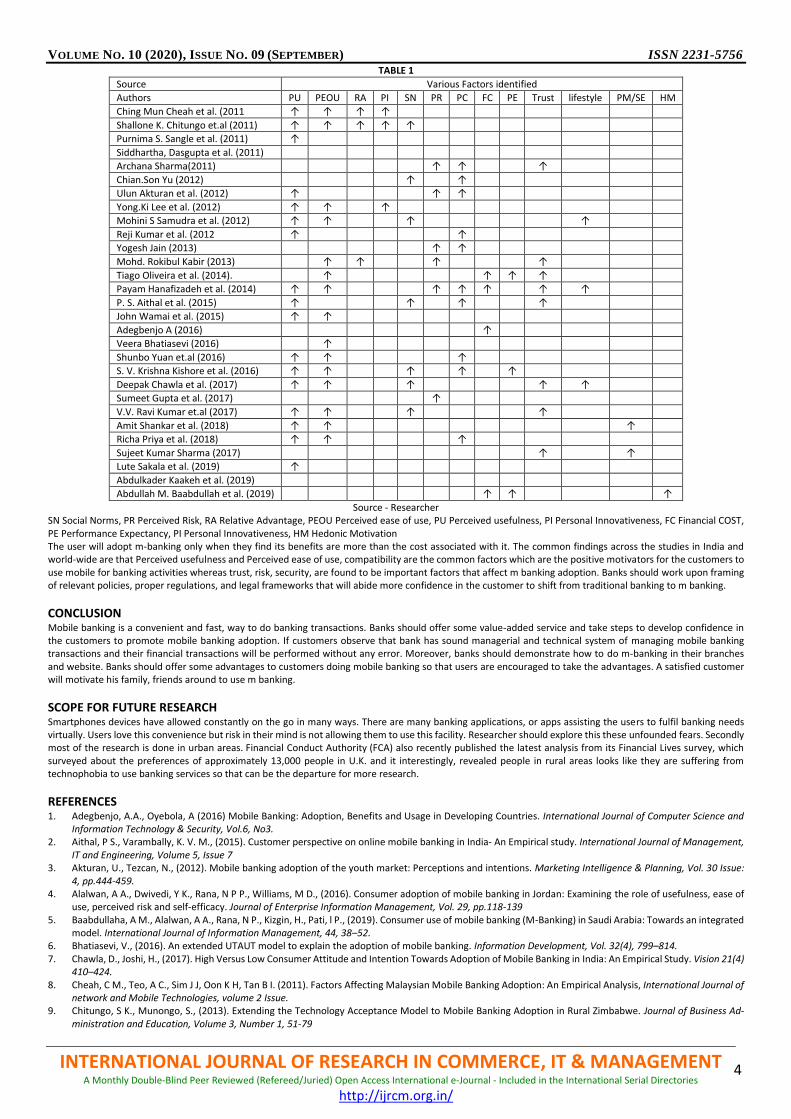
DISCUSSION The review reveals that which factors influence more in accepting mobile banking adoption across the world. It also helps us to identify the degree of influence of each one of the factors. The literature also gives the vision in to the modality of Mobile banking transactions. Literature review has experiential some significant points that needs attention by the banks and financial institutions to know about the fear of the customers that is not encouraging them to use m banking. These findings can help the banks to customise their services focussing on demographic feature or as per the geographic needs. Figure 2 summarizes the factors high-lighted by various researchers in India and worldwide undertaken in the study.
VOLUME NO. 10 (2020), ISSUE NO. 09 (SEPTEMBER) ISSN 2231-5756
INTERNATIONAL JOURNAL OF RESEARCH IN COMMERCE, IT & MANAGEMENT A Monthly Double-Blind Peer Reviewed (Refereed/Juried) Open Access International e-Journal - Included in the International Serial Directories
http://ijrcm.org.in/
4
TABLE 1
Source Various Factors identified
Authors PU PEOU RA PI SN PR PC FC PE Trust lifestyle PM/SE HM
Ching Mun Cheah et al. (2011 ↑ ↑ ↑ ↑
Shallone K. Chitungo et.al (2011) ↑ ↑ ↑ ↑ ↑
Purnima S. Sangle et al. (2011) ↑
Siddhartha, Dasgupta et al. (2011)
Archana Sharma(2011) ↑ ↑ ↑
Chian.Son Yu (2012) ↑ ↑
Ulun Akturan et al. (2012) ↑ ↑ ↑
Yong.Ki Lee et al. (2012) ↑ ↑ ↑
Mohini S Samudra et al. (2012) ↑ ↑ ↑ ↑
Reji Kumar et al. (2012 ↑ ↑
Yogesh Jain (2013) ↑ ↑
Mohd. Rokibul Kabir (2013) ↑ ↑ ↑ ↑
Tiago Oliveira et al. (2014). ↑ ↑ ↑ ↑
Payam Hanafizadeh et al. (2014) ↑ ↑ ↑ ↑ ↑ ↑ ↑
P. S. Aithal et al. (2015) ↑ ↑ ↑ ↑
John Wamai et al. (2015) ↑ ↑
Adegbenjo A (2016) ↑
Veera Bhatiasevi (2016) ↑
Shunbo Yuan et.al (2016) ↑ ↑ ↑
S. V. Krishna Kishore et al. (2016) ↑ ↑ ↑ ↑ ↑
Deepak Chawla et al. (2017) ↑ ↑ ↑ ↑ ↑
Sumeet Gupta et al. (2017) ↑
V.V. Ravi Kumar et.al (2017) ↑ ↑ ↑ ↑
Amit Shankar et al. (2018) ↑ ↑ ↑
Richa Priya et al. (2018) ↑ ↑ ↑
Sujeet Kumar Sharma (2017) ↑ ↑
Lute Sakala et al. (2019) ↑
Abdulkader Kaakeh et al. (2019)
Abdullah M. Baabdullah et al. (2019) ↑ ↑ ↑
Source - Researcher SN Social Norms, PR Perceived Risk, RA Relative Advantage, PEOU Perceived ease of use, PU Perceived usefulness, PI Personal Innovativeness, FC Financial COST, PE Performance Expectancy, PI Personal Innovativeness, HM Hedonic Motivation The user will adopt m-banking only when they find its benefits are more than the cost associated with it. The common findings across the studies in India and world-wide are that Perceived usefulness and Perceived ease of use, compatibility are the common factors which are the positive motivators for the customers to use mobile for banking activities whereas trust, risk, security, are found to be important factors that affect m banking adoption. Banks should work upon framing of relevant policies, proper regulations, and legal frameworks that will abide more confidence in the customer to shift from traditional banking to m banking.
CONCLUSION Mobile banking is a convenient and fast, way to do banking transactions. Banks should offer some value-added service and take steps to develop confidence in the customers to promote mobile banking adoption. If customers observe that bank has sound managerial and technical system of managing mobile banking transactions and their financial transactions will be performed without any error. Moreover, banks should demonstrate how to do m-banking in their branches and website. Banks should offer some advantages to customers doing mobile banking so that users are encouraged to take the advantages. A satisfied customer will motivate his family, friends around to use m banking.
SCOPE FOR FUTURE RESEARCH Smartphones devices have allowed constantly on the go in many ways. There are many banking applications, or apps assisting the users to fulfil banking needs virtually. Users love this convenience but risk in their mind is not allowing them to use this facility. Researcher should explore this these unfounded fears. Secondly most of the research is done in urban areas. Financial Conduct Authority (FCA) also recently published the latest analysis from its Financial Lives survey, which surveyed about the preferences of approximately 13,000 people in U.K. and it interestingly, revealed people in rural areas looks like they are suffering from technophobia to use banking services so that can be the departure for more research.
REFERENCES 1. Adegbenjo, A.A., Oyebola, A (2016) Mobile Banking: Adoption, Benefits and Usage in Developing Countries. International Journal of Computer Science and
Information Technology & Security, Vol.6, No3. 2. Aithal, P S., Varambally, K. V. M., (2015). Customer perspective on online mobile banking in India- An Empirical study. International Journal of Management,
IT and Engineering, Volume 5, Issue 7 3. Akturan, U., Tezcan, N., (2012). Mobile banking adoption of the youth market: Perceptions and intentions. Marketing Intelligence & Planning, Vol. 30 Issue:
4, pp.444-459. 4. Alalwan, A A., Dwivedi, Y K., Rana, N P P., Williams, M D., (2016). Consumer adoption of mobile banking in Jordan: Examining the role of usefulness, ease of
use, perceived risk and self-efficacy. Journal of Enterprise Information Management, Vol. 29, pp.118-139 5. Baabdullaha, A M., Alalwan, A A., Rana, N P., Kizgin, H., Pati, l P., (2019). Consumer use of mobile banking (M-Banking) in Saudi Arabia: Towards an integrated
model. International Journal of Information Management, 44, 38–52. 6. Bhatiasevi, V., (2016). An extended UTAUT model to explain the adoption of mobile banking. Information Development, Vol. 32(4), 799–814. 7. Chawla, D., Joshi, H., (2017). High Versus Low Consumer Attitude and Intention Towards Adoption of Mobile Banking in India: An Empirical Study. Vision 21(4)
410–424. 8. Cheah, C M., Teo, A C., Sim J J, Oon K H, Tan B I. (2011). Factors Affecting Malaysian Mobile Banking Adoption: An Empirical Analysis, International Journal of
network and Mobile Technologies, volume 2 Issue. 9. Chitungo, S K., Munongo, S., (2013). Extending the Technology Acceptance Model to Mobile Banking Adoption in Rural Zimbabwe. Journal of Business Ad-
ministration and Education, Volume 3, Number 1, 51-79

VOLUME NO. 10 (2020), ISSUE NO. 09 (SEPTEMBER) ISSN 2231-5756
INTERNATIONAL JOURNAL OF RESEARCH IN COMMERCE, IT & MANAGEMENT A Monthly Double-Blind Peer Reviewed (Refereed/Juried) Open Access International e-Journal - Included in the International Serial Directories
http://ijrcm.org.in/
5
10. Dasgupta, S., Paul, R., Fuloria, S., (2011). Factors Affecting Behavioral Intentions towards Mobile Banking Usage: Empirical Evidence from India. Romanian Journal of Marketing, Vol. 6 Issue 1, p6-28. 23p.
11. Gupta, S., Haejung, Yun., Heng, X., Kim, H W., (2017). An exploratory study on mobile banking adoption in Indian metropolitan and urban areas: a scenario-based experiment. Information technology for development, Vol. 23, No. 1, 127–152
12. Hanafizadeh, P., Behboudi, M., Koshksaray, A A., Tabar, M J S., (2014). Mobile-banking adoption by Iranian bank clients. Telematics and Informatics 31, 62–78.
13. Jain, Y., (2013). Mobile Banking: A Study On Adoption & Challenges in Southern Rajasthan, India. International Journal of innovative Research & development, Vol 2 Issue 4.
14. Kaakeh, A., Hassan, M. K., Stefan, F., Almazor, V H., (2019). Factors affecting customers’ attitude towards Islamic banking in UAE, International Journal of Emerging Markets.
15. Kabir, M R., (2013). Factors Influencing the Usage of Mobile Banking: Incident from a Developing Country World Review of Business Research Vol. 3. No. 3. Issue Pp. 96 – 114
16. Kishore, S V K., Sequeira, A H., (2016). An Empirical Investigation on Mobile Banking Service Adoption in Rural Karnataka. SAGE Open, 1–21 17. Lee, Y K., Jong-Hyun P., Chung, N., Blakeney, A., (2012). A unified perspective on the factors influencing usage intention toward mobile financial services.
Journal of Business Research 1590–1599. 18. Oliveira,T., Faria, M., Thomas, M A., Popovi, A., (2014). Extending the understanding of mobile banking adoption: When UTAUT meets TTF and ITM. Interna-
tional Journal of Information Management, 34 (2014) 689–703 19. Priya, R., Gandhi, A V., Shaikh, A., (2018). Mobile banking adoption in an emerging economy: An empirical analysis of young Indian consumers. Benchmarking:
An International Journal, Vol. 25 Issue: 2, pp.743-762. 20. Ravikumar, V V,. Lall, A., Man, T., (2017). Extending the TAM Model: Intention of Management Students to Use Mobile Banking: Evidence from India. Global
Business Review 18(1) 238–249 (2017) 21. RejiKumar, R. G., D., Ravindran, S., (2012). An Empirical study on service quality perceptions and continuance intention in mobile banking context in India.
Journal of Internet Banking and Commerce, vol. 17, no. 1 22. Sakala, L., Phiri, J., (2019). Factors Affecting Adoption and Use of Mobile Banking Services in Zambia Based on TAM Model. Open Journal of Business and
Management, 7, 1380-1394. 23. Saleem, Z., Kashif, R., (2011). Relationship between Customer Satisfaction and Mobile Banking Adoption in Pakistan. International Journal of Trade, Economics
and Finance, Vol. 2, No. 6 24. Samudra, M S., Phadtare, M., (2012). Factors Influencing the Adoption of Mobile Banking with special Reference to Pune City. ASCI Journal of Management
42 (1): 51–65 25. Sangle, P S., Awasthi, P., (2011). Consumer’s expectations from mobile CRM services: a banking context, Business Process Management. Journal, Vol. 17 No.
6, pp. 898-918 26. Shankar, A., Datta, B., (2018). Factors Affecting Mobile Payment Adoption Intention: An Indian Perspective. Global Business Review, 19(3S) 72S–89S. 27. Sharma, A., (2011). Mobile banking as technology adoption and challenges, International Journal of Multidisciplinary Research Vol.1 Issue 6. 28. Sharma, S.K., (2017). Integrating cognitive antecedents into TAM to explain mobile banking behavioural intention: A SEM-neural network modelling. Inf Syst
Front 21, 815–827. 29. Wamai. J., Kandiri, J M., (2015). Determinants of Mobile Banking Adoption by Customers of Microfinance Institutions in Nairobi County in Kenya. International
Journal of Science and Research, Volume 6 Issue 6. 30. Yu, C S., (2012). Factors Affecting Individuals to Adopt Mobile Banking: Empirical evidence from the UTAUT model. Journal of Electronic Commerce Research,
Vol 13, No 2 31. Yuan, S., Liu, Y., Yao, R., Liu, J., (2016). An investigation of users’ continuance intention towards mobile banking in China. Information Development, Vol. 32(1)
20–34.

VOLUME NO. 10 (2020), ISSUE NO. 09 (SEPTEMBER) ISSN 2231-5756
INTERNATIONAL JOURNAL OF RESEARCH IN COMMERCE, IT & MANAGEMENT A Monthly Double-Blind Peer Reviewed (Refereed/Juried) Open Access International e-Journal - Included in the International Serial Directories
http://ijrcm.org.in/
6
EFFECT OF NON-PERFORMING ASSETS ON BANKING SECTOR: A STUDY ON STATE BANK OF INDIA
Dr. JYOTIRMOY KOLEY ASST. PROFESSOR
P.G. DEPARTMENT OF COMMERCE HOOGHLY MOHSIN COLLEGE
HOOGHLY
ABSTRACT Non-performing asset (NPA) is a critical challenge for the banking sector in India and the world as a whole now-a-days. It is negatively affecting the profitability of the banking industry over the period. The NPA is a drag on the banking sector. Various related studies, researches and banking statistics evidently show that the NPA is increasing more rapidly in the public sector banks than private sector banks in India scenario. It could only meet up by the vital and efficient asset manage-ment wings on the banks. Indian is holding 33rds position in respect of the world’s gross NPA ratio (10.3%). This paper has attempted to analyze the effect of NPA on the profitability and the trend of NPA of the State Bank of India over last ten years from 2009-10 to 2018-19. The study reveals that the NPA has a gradual increasing trend, but a sharp decline in year 2018-19. The paper also shows that the NPA has an inverse effect on the profitability of the State bank of India.
KEYWORDS non-performing assets, public sector banks, private sector banks, efficient asset management, profitability.
JEL CODES G20, G21, G33.
INTRODUCTION t the ancient time the banking system was started with the primary objective of receiving deposits from public and lending loans to public for the purpose of mobilizing the funds in the society. They charge interest on loans and pay interest on deposits. In this way, they earn a profit. So, loans are the assets of the banks whereas the deposits are liabilities for the banks. So, far the loan borrowers are paying due interest and repaying the installment of principal loan
amount on due time, loan assets are good or performing assets for the banks. When these assets fail to generate income for the banks then they are termed as non-performing asset (NPA). The loan assets are classified under four categories like good advance, sub-standard advance, doubtful advance and loss advance. Out of these classes, sub-standard advance, doubtful advance and loss advance are termed as gross non-performing asset. The NPA is a vital indicator for assessing banks’ credit risk, asset quality and efficiency in allocation of resources to productive sectors. Efficiency in management of loans and advances is becoming a critical task across the world. Our nation India is not the exception. The amount of bad loans and defaulters are gradually increasing over the years in India especially in public sector banks. The NPA is like a tough virus in the banking industry. It is gradually affecting the financial health of the banking industry and also the economy of the nation. According to the IMF data, India is holding 33rd position among the 137 countries of the world in respect of gross NPA ratio. Presently, its gross NPA ratio is 10.3%. The Ukraine has the highest NPA ratio followed by San Marino and Greece. They have 54.3%, 47.2% and 44.1% NPA ratio respectively. The Canada has the lowest NPA ratio followed by the Republic of Korea and Switzerland. They have 0.4%, 0.5% and 0.6% of NPA ratio respectively1. Here, the gross NPA ratio is expressed in terms of the ratio between of non-performing loans to total loans & advances. According to RBI data, the gross NPA ratio for the Indian Public Sector banks is 14.6%, private sector banks is (old-1.9% & new-4.7%) and foreign banks is 3.8%2. So, Indian public sector banks have higher NPA ratio comparison to private sector and foreign banks. The State Bank of India, having the highest market capitali-zation, has been selected as a sample unit for the purpose of this study. The gross NPA ratio of SBI is 10.9% as of 31.03.20183.
LITERATURE REVIEW Several studies have been conducted by many academicians and researchers on a different aspects non-performing assets in Indian banking sector. Some of them are highlighted below. Nachimuthu & Muthukrishna (2019) discussed the impact of NPA on the profitability in Indian scheduled commercial banks. They found that there was an increas-ing trend in NPA and due to such rise of NPA the profitability of the scheduled commercial banks had reduced in India. Bawaa, Goyala, Mitraa, & Basub (2019) examined panel data for Indian banks with some specific financial ratios which reflects the operating capability, liquidity, solvency, profitability capital adequacy and business development capacity aspects across Indian banks which affects NPAs. They found a significant negative relationship between asset growth and NPAs in India. Kapadia & Madhav (2019) analyzed the trends of NPAs and the factors responsible for mounting NPAs in the banking sector from non-identical aspects. Bag & Islam (2019) aimed to analyze the recent trend of NPAs in the banking industry (public & private) with reference to India and Bangladesh. They also examined the relationship between NPAs and profitability of the banking industry. They found that the NPAs had an inverse impact on the profitability of both types of banks in both the nations, but problems were more serious for public sector banks than private sector banks. They also observed that the growths in NPAs in public sector banks were upward rising in both the nations. Gulati (2018) analyzed new private sector banks with respect to their efficiency in NPA management comparatively. They used growth rate analysis and descriptive analysis. They found that some of the new private sector banks are more efficient in NPA management than other some new private sector banks in India. Dave (2016) made an attempt to analyze the impact of Indian banking operations, trend and magnitude of NPAs in selected Indian public and private sector banks. He found that NPAs affect the liquidity and profitability, in addition to posting threat on quality of asset and survival of banks. Ramasubbian & Thangavelu (2015) focused on the future trend of the NPA in Indian banking sector with the help of list square method and time serious analysis. They observed that the asset quality and financial health of private and foreign banks is improving in comparison to public sector bank and schedule commercial banks in India. Bandyopadhyay (2013) made an analytical study to reveal the movement of NPA over time. He demonstrated an upward future trend of the NPA in the public sector banks in India. It puts a question mark on the wisdom and integrity of the top management of banks in handling credit portfolio. They suggested for replacing the practices of credit appraisal and monitoring of credit in public sector banks in India.
OBJECTIVES OF THE STUDY 1. To evaluate the trend of the NPA in SBI. 2. To examine the effect of NPA on the profitability of SBI.
1 IMF Data, Quarter ended September 2018. 2 RBI data, March 2018 3 RBI data, March 2018
A

VOLUME NO. 10 (2020), ISSUE NO. 09 (SEPTEMBER) ISSN 2231-5756
INTERNATIONAL JOURNAL OF RESEARCH IN COMMERCE, IT & MANAGEMENT A Monthly Double-Blind Peer Reviewed (Refereed/Juried) Open Access International e-Journal - Included in the International Serial Directories
http://ijrcm.org.in/
7
RESEARCH METHODOLOGY The study is purely based on secondary data. The data have been collected from various related research articles, journals, RBI bulletin, annual reports of the State Bank of India (SBI) and web based resources. The study period is ten years from 2009-10 to 2018-19. The trend analysis has been used to show the movement of NPA during the ten years of the study period. The regression analysis has been done to predict the effect of NPA on the profitability of the SBI in the said study period. In this study, profitability of the banking sector has been shown in three important dimensions such as net profit margin (NPM), return on assets (ROA) and return on equity (ROE). The non-performing assets have been measured as a ratio of net non-performing assets to net advances. NPA is taken as independent variable (IV) and profitability measures are considered as dependent variable (DV) in the study. Two variable static linear regression model is “Y = a + b.X + e”. Where, Y= Profitability, a = constant term, b = regression coefficient for the independent variable, X = NPA, e = error term. The data have been analyzed with the help of statistical package Gretl to draw logical conclusion. Initially, while testing the stationary of the original time series data set imported in Gretl through a unit root test (ADF), presence of non stationary has been found in the data set. To make the data set stationary, the first difference of the variables is taken for the purpose of running the Ordinary Least Square model.
HYPOTHESIS Ho1: There is no relationship between non-performing asset and net profit margin of SBI Regression model: NPM= a + b.NPA+ e (IV is NPA & DV is NPM) Ho2: There is no relationship between non-performing asset and return on assets of SBI Regression model: ROA= a + b.NPA+ e (IV is NPA & DV is ROA) Ho3: There is no relationship between non-performing asset and return on equity of SBI Regression model: ROE= a + b.NPA+ e (IV is NPA & DV is ROE)
DATA ANALYSIS AND DISCUSSION Trend Analysis: In this section, trends of the NPA has been shown in the following diagram over the last ten years from 2009-10 to 2018-19.
DIAGRAM 1: TRENDS OF NPA OF SBI FROM 2009-10 TO 2018-19
Source: Compiled from the annual reports of SBI of various years.
Net NPA to Net Advances, 2009-10, 1.72 Net NPA to Net Advances, 2010-11,
1.63
Net NPA to Net Advances, 2011-12, 1.82
Net NPA to Net Advances, 2012-13, 2.1
Net NPA to Net Advances, 2013-14, 2.57
Net NPA to Net Advances, 2014-15, 2.12
Net NPA to Net Advances, 2015-16, 3.81 Net NPA to Net Advances, 2016-17,
3.71
Net NPA to Net Advances, 2017-18, 5.73
Net NPA to Net Advances, 2018-19, 3.01
Net NPA to Net Advances (%)
2009-10
2010-11
2011-12
2012-13
2013-14
2014-15
2015-16
2016-17
2017-18
2018-19

VOLUME NO. 10 (2020), ISSUE NO. 09 (SEPTEMBER) ISSN 2231-5756
INTERNATIONAL JOURNAL OF RESEARCH IN COMMERCE, IT & MANAGEMENT A Monthly Double-Blind Peer Reviewed (Refereed/Juried) Open Access International e-Journal - Included in the International Serial Directories
http://ijrcm.org.in/
8
Interpretation: From above diagram, it has been observed that there was an increasing trend in NPA from 2009-10 to 2013-14. Thereafter a slight decline in 2014-15 then a sharp hike in 2015-16. In 2016-17, there was a quite stability. Again a sharp up clime in 2017-18 and a straight clime down in 2018-19. This final decline has been seen at the bank has been taking some precautionary measures to reduce NPA. Regression Analysis: In this section, two variable static linear regression model analyses have been done with the help of SPSS to test the hypotheses and their respective results are shown below in the following tables: Hypothesis Testing - 1 Ho1: There is no relationship between non-performing asset and net profit margin of SBI Regression model: NPM= a + b.NPA+ e (IV is NPA & DV is NPM) Model 1: OLS, using observations 2011-2019 (T = 9) Dependent variable: d_NPM
TABLE 1
Coefficient Std. Error t-ratio p-value
const −0.895209 0.672294 −1.332 0.2247
d_NPA −1.77761 0.522661 −3.401 0.0114 **
TABLE 2
Mean dependent var −1.150000 S.D. dependent var 3.053498
Sum squared resid 28.12111 S.E. of regression 2.004321
R-squared 0.622995 Adjusted R-squared 0.569137
F(1, 7) 11.56739 P-value(F) 0.011426
Log-likelihood −17.89728 Akaike criterion 39.79456
Schwarz criterion 40.18901 Hannan-Quinn 38.94334
rho 0.035284 Durbin-Watson 1.812778
Heteroskedasticity Test: White's test with p-value = 0.131885
** Significant at 5%. (Source: Compiled by researcher) Interpretation: The above tables show that there are two variables, namely, net profit margin (NPM) and NPA. The dependant variable is net profit margin and the NPA is an independent variable. Here NPA is measured as the ratio of net NPA to net advances. The model is NPM = a + b.NPA + e. In this model, P-Value for beta coefficient of net profit margin is 0.0114 which is significant at 5% significance level. So, the null hypothesis is rejected and the alternative hypothesis is accepted. So, it can be concluded that there is a relation between NPM and NPA. Here, the value of F is 11.56739 which is also significant at 5% significance level. The value of R square is 0.622995 which indicates that the model is a good fit and there is a high correlation between NPM and NPA. But the negative sign of the regression coefficient indicates that there is an inverse relationship between these two variables. The adjusted R square value is 0.569137 which implies that NPA can explain about 57% of the variance in NPM. It is also notable that there is no problem of auto-correlation in the time series data used for the study, as the values obtained by Durbin-Watson test is around one (1.812778). White's test has been done for checking heteroskedasticity. The test result (P- 0.131885) shows that there is no heteroskedasticity in the data set. From the above interpretations, finally, it can be concluded that NPA has a negative impact on net profit margin of SBI. Hypothesis Testing - 2 Ho2: There is no relationship between non-performing asset and return on assets of SBI Regression model: ROA= a + b.NPA+ e (IV is NPA & DV is ROA) Model 2: OLS, using observations 2011-2019 (T = 9) Dependent variable: d_ROA
TABLE 3
Coefficient Std. Error t-ratio p-value
const −0.0749139 0.0617226 −1.214 0.2642
d_NPA −0.144012 0.0479850 −3.001 0.0199 **
TABLE 4
Mean dependent var −0.095556 S.D. dependent var 0.260294
Sum squared resid 0.237030 S.E. of regression 0.184015
R-squared 0.562694 Adjusted R-squared 0.500221
F(1, 7) 9.007080 P-value(F) 0.019909
Log-likelihood 3.595125 Akaike criterion −3.190251
Schwarz criterion −2.795802 Hannan-Quinn −4.041471
rho 0.046369 Durbin-Watson 1.814353
Heteroskedasticity Test: White's test with p-value = 0.556598
** Significant at 5%. (Source: Compiled by researcher) Interpretation: The above tables show that there are two variables, namely, return on asset (ROA) and NPA. The dependant variable is return on asset and NPA is independent variable. Here NPA is measured as the ratio of net NPA to net advances. The model is ROA = a + b.NPA + e. In this model, P-Value for beta coefficient of return on asset is 0.0199 which is significant at 5% significance level. So, the null hypothesis is rejected and the alternative hypothesis is accepted. So, it can be concluded that there is a relation between ROA and NPA. Here, the value of F is 9.007080 which is also significant at 5% significance level. The value of R squire is 0.562694 which indicates that the model is a good fit and there is a high correlation between ROA and NPA. But the negative sign of the regression coefficient indicates that there is an inverse relationship between these two variables. The adjusted R square value is 0.500221 which implies that NPA can explain around 50% of the variance in ROA. It is also notable that there is no problem of auto-correlation in the time series data used for the study, as the values obtained by Durbin-Watson test is around one (1.814353). White's test has been done for checking heteroskedasticity. The test result (P- 0.556598) shows that there is no heteroskedasticity in the data set. From the above interpretations, finally, it can be concluded that NPA has a negative impact on return on asset of SBI. Hypothesis Testing - 3 Ho3: There is no relationship between non-performing asset and return on equity of SBI Regression model: ROE= a + b.NPA+ e (IV is NPA & DV is ROE) Model 3: OLS, using observations 2011-2019 (T = 9) Dependent variable: d_ROE
TABLE 5
Coefficient Std. Error t-ratio p-value
const −1.11973 0.987080 −1.134 0.2940
d_NPA −2.69959 0.767385 −3.518 0.0098 ***

VOLUME NO. 10 (2020), ISSUE NO. 09 (SEPTEMBER) ISSN 2231-5756
INTERNATIONAL JOURNAL OF RESEARCH IN COMMERCE, IT & MANAGEMENT A Monthly Double-Blind Peer Reviewed (Refereed/Juried) Open Access International e-Journal - Included in the International Serial Directories
http://ijrcm.org.in/
9
TABLE 6
Mean dependent var −1.506667 S.D. dependent var 4.579776
Sum squared resid 60.62046 S.E. of regression 2.942799
R-squared 0.638723 Adjusted R-squared 0.587112
F(1, 7) 12.37570 P-value(F) 0.009755
Log-likelihood −21.35378 Akaike criterion 46.70756
Schwarz criterion 47.10201 Hannan-Quinn 45.85634
rho 0.119424 Durbin-Watson 1.711036
Heteroskedasticity Test: White's test with p-value = 0.137560
** Significant at 1%. (Source: Compiled by researcher) Interpretation: The above tables show that there are two variables, namely, return on equity (ROE) and NPA. The dependant variable is return on equity and NPA is independent variable. Here NPA is measured as the ratio of net NPA to net advances. The model is ROE = a + b.NPA + e. In this model, P-Value for beta coefficient of return on equity is 0.0098 which is significant at 1% significance level. So, the null hypothesis is rejected and the alternative hypothesis is accepted. So, it can be concluded that there is a relation between ROE and NPA. Here, the value of F is 12.37570 which is also significant at 1% significance level. The value of R squire is 0.638723 which indicates that the model is a good fit and there is a high correlation between ROE and NPA. But the negative sign of the regression coefficient indicates that there is an inverse relationship between these two variables. The adjusted R square value is 0.587112 which implies that NPA can explain around 58% of the variance in ROE. It is also notable that there is no problem of auto-correlation in the time series data used for the study, as the values obtained by Durbin-Watson test is around one (1.711036). White's test has been done for checking heteroskedasticity. The test result (P- 0.137560) shows that there is no heteroskedasticity in the data set. From the above interpretations, finally, it can be concluded that NPA has a negative impact on return on equity of SBI.
TABLE 7: SUMMARY OF HYPOTHESIS TESTING AT A GLANCE
Null Hypothesis P-Value Decision
Ho1: There is no relationship between non-performing asset and net profit margin of SBI 0.0114 Reject
Ho2: There is no relationship between non-performing asset and return on assets of SBI 0.0199 Reject
Ho3: There is no relationship between non-performing asset and return on equity of SBI 0.0098 Reject
CONCLUSION From above analysis and interpretations, it can be finally concluded that the growth of non-performing asset of SBI has an upward rising tendency except the very last year of 2018-19. The study also reveals that the NPA has an inverse relationship to profitability of SBI over the last ten years. In all the taken dimensions of profitability (net profit margin, return on asset and return on equity) measurement, it has been observed that the NPA has a negative effect on them. In order to minimize and control over NPA, SBI should formulate more strong recovery and preventive policy. SBI should form an efficient asset management wing, which will be exclusively responsible for managing non-performing and under performing loans to maximize the recovery value. The client assessment procedure should be stronger before lending loans rather than completion of technical paper procedures. The bank should be stricter in “Know Your Customer” norms for identification of borrowers, guarantor and verification of their address to minimize the risk of default in case of housing loans. In case of agricultural loans, a recovery camp should be organized during the harvest season. Continuous monitoring of the bank’s borrowers is vital to understand the primary reason of corporate decline and to be able to identify the potential distress situation. It is essential to identify symbols of distress which reduce the borrowers’ ability to repay loans. In this way, State bank of India could manage its NPA and maintain a better profitability in future.
REFERENCES 1. Bandyopadhyay, G. (2013). Modeling NPA Time Series Data in Selected Public Sector Banks in India with Semi Parametric Approach. International Journal of
Scientific & Engineering Research, 4 (12), 1876-1889. 2. Bawaa, J. K., Goyala, V., Mitraa, S., & Basub, S. (2019). An analysis of NPAs of Indian banks: Using a comprehensive framework of 31 financial ratios. IIMB
Management Review, 31, 51-62. 3. Dave, D. K. (2016). Comparative Study of Non Performing Assets in Public Sector and Private Sector Banks in India. International Journal of Scientific Research,
5 (8), 445-449. 4. Gulati, P. R. (2018). NPA Management Efficiency: A Comparative Study of New Private Sector Banks. International Journal of Interdisciplinary Research and
Innovations, 6 (2), 332-338. 5. Kapadia, S. B., & Madhav, V. V. (2019). NPAs in Indian Scheduled Commercial Banks: Origination and Impact on Economy. International Journal of Recent
Technology and Engineering, 8 (2S6), 538-541. 6. Nachimuthu, K., & M. V. (2019). Impact of non-performing assets on the profitability in Indian scheduled commercial banks. African Journal of Business
Management, 13 (4), 128-137. 7. Ramasubbian, H., & Thangavelu, A. (2015). Forecasting the Trends of NPAs in Indian Banking Sector. Asian Journal of Management Research, 5 (4), 629-634. 8. Bag, S., & Islam, S. (2019). Non-Performing Assets a Biggest Challenge in Banking Sector- A Comparative Study between India and Bangladesh Banking Sector.
ICTACT Journal On Management Studies, 3 (4), 620-624. 9. Rajput, N. et.al (2013). Profitability and Credit Culture of NPAs: An Empirical Analysis of PSBs. The International Journal’s Research Journal of Commerce &
Behavioural Science, 2(03), 41-53. 10. Annual Reports from 2009-10 to 2018-19, State Bank of India. (given in below table)
Annual Reports of SBI
Date and time of access Access link
2009-10 12/5/2020 at 7:11 AM https://sbi.co.in/documents/17826/35696/1275994607852_12_BALANCESHEET_SBI_GROUP.pdf
2010-11 12/5/2020 at 7:13 AM https://sbi.co.in/documents/17826/35696/1307544010161_13_2.pdf
2011-12 27/3/2020 at 11:01 PM https://sbi.co.in/documents/17826/35696/1339769825519_SBI_GROUP_FINANCIALS_AR12.pdf
2012-13 12/5/2020 at 7:09 AM https://sbi.co.in/documents/17826/35696/1373614553213_SBI_UNABRIDGED_ANNUAL_REPORT_2012_13_ ENGLISH.pdf
2013-14 12/5/2020 at 7:03 AM https://www.sbi.co.in/AR_13-14/
2014-15 5/2/2020 at 5:44 PM https://www.sbi.co.in/AR1415/
2015-16 5/2/2020 at 5:43 PM https://bank.sbi/AR1516/
2016-17 5/2/2020 at 5:42 PM https://sbi.co.in/AR1617/
2017-18 5/2/2020 at 5:41 PM https://bank.sbi/AR1718/
2018-19 5/2/2020 at 5:40 PM https://sbi.co.in/corporate/AR1819/

VOLUME NO. 10 (2020), ISSUE NO. 09 (SEPTEMBER) ISSN 2231-5756
INTERNATIONAL JOURNAL OF RESEARCH IN COMMERCE, IT & MANAGEMENT A Monthly Double-Blind Peer Reviewed (Refereed/Juried) Open Access International e-Journal - Included in the International Serial Directories
http://ijrcm.org.in/
10
A STUDY ON THE PROVISIONS OF NOTIONAL RENT IN INDIAN INCOME TAX
VARANASI. RAHUL ASST. PROFESSOR
DEPARTMENT OF COMMERCE K.B.N. DEGREE COLLEGE
VIJAYAWADA
ABSTRACT This paper is a study on the applicability of the provisions of section 22 of income tax law, to analyse whether the exemption under the provision is applicable to the partner owner of the firm, i.e the individual whose property is occupied by the firm, in which he was a partner, and provide that premises at free of cost. The paper studies the provisions of section 22 of Indian Income Tax law, legal decisions in favour and opposing the decisions of allowing exemptions under above said section, and grounds of final judgement given by Kolkata court in Prodip Kumar Bothra v. CIT (2011) case in this regard.
KEYWORDS exemption under section 22, owner – partner, deemed rent, notional rent.
JEL CODE H21
INTRODUCTION he provisions of Sec.22 of Income Tax Act,1961, provides that, annual value of property occupied by the assesse for his own business and such business income is chargeable to Income tax, then the annual value of that property held for own business shall be exempted from chargeability under Income tax law.
But in the present case, the question is that, whether the above exemption is applicable equally to the partner of a partnership firm who provides his own resi-dential property at free of rent to the partnership firm in which he is a partner. Lot of discussions were done in different legal case studies on the above question. Different decisions and different views were presented by different legal authorities. But at last in 2011, judgement given in Prodip Kumar Bothra Vs. Commissioner of Income-Tax, Kolkata Income Tax Appeal No. 742 Of 2004 (15-07-2011), it was held that Annual value of the property which was rented even at free of cost to the firm, by the individual who is also a partner in the firm, shall be taxable in the hands of that partner and no exemption U/s 22 is available to him. The reasons behind the legal decisions of allowing the exemptions of that individual partner was quoted by Mr. Banerjee, who acted as Advocate on behalf of Revenue. And it is advisable to individual partner to receive rent for such property, from the partner firm, even though he is a partner in that firm. Provisions of Income tax law has allowed such rent as deduction for that firm, which is also a indirect financial benefit for the partner who is the owner of the Property occupied.
REVIEW OF LITERATURE Karnataka vs. K.N. Guruswamy, reported in (1983) 146 ITR 34: If the property or a portion of it, owned by an assessee, is occupied by him for the purpose of his own business or profession, or a property owned by a firm is used for its business, such assessee is entitled to exemption under section 22. In the view that we have taken, the contention urged for the Revenue should prevail, and the Tribunal's finding that the assessee is entitled to exemption under Section 22 should be rejected. Commissioner of Income-tax vs. K.M. Jagannathan, reported in (1989) 180 ITR 191:…..the tribunal was right in the view it took for the purpose of sec 22. Of the Act, the business carried on by the firm should be regarded as being carried all the partners and therefore, no income from the property should be computed in respect of the portion of the property in respect of the portion under the occupation of the firm in the computation of the income from the property in the hands of the assessee – partner. Commissioner of Income-tax vs. P.M. Thomas, reported in (1990) 181 ITR 256:…..the assessee is carrying on business in partnership the profits of which are chargeable to income tax. It cannot be stated that the assesseeis not occupying the building for the purpose of his business. The business is done in partnership, the other partners are occupying the ground floor along with the assessee and the partnership business is carried on by him along with all the partners. Therefore, we are of the view that the annual letting value of the ground floor of the building belonging to the assessee which is in occupation of a firm in which the assessee is a partner is not includable in the income of the assessee under section 22 of the Act and, consequently, the reopening of the assessment is not suitable. Commissioner of Income-tax vs. Rabindranath Bhol, reported in (1995) 211 ITR 799 : in the case in hand, we are of the considered opinion that the literal construc-tion put by Karnataka high court to sec 22 of Income tax act works out gross injustice and does not subserve the object of the legislation. In the aforesaid premises, we respectively differ with the views expressed by the Karnataka High court and agree with the conclusion and reasoning’s adopted by the Gujarat High court, and hold that the income from a house property owned by the assessee-partner and used in the business carried on by the partnership firm in which the assessee is a partner would qualify for exemption provided in sec 22 of the income tax act 1961. Prodip Kumar Bothra v. CIT (2011) 62 DTR (Cal) 47: …..after taking into consideration the overall position of a partnership firm in the light of the Income tax Act, 1961 we are of the view that the exemption under Section 22 of the Act in respect of a property not owned by the partnership firm cannot be availed of by an individual co-owner merely because he happens to be a partner of a firm in occupation of a part of the property.
RESEARCH OBJECTIVES 1. To study the provisions of sec 22 of Indian Income Tax Act, 1961. 2. To study the applicability of exemption under sec. 22 of IT Act, 1961 to Partner – owner. 3. To suggest to the Partner – owner in case of non – applicability of sec. 22 of IT Act, 1961.
RESEARCH METHODOLOGY The present research study is a blend of secondary data and the major source of data was used from different websites of legal decisions, government portal of Income tax, website of business magazines etc. and it is a descriptive and exploratory research method which has been used to analyses the secondary data collected, in order to conclude whether the provisions of section 22 are applicable to owner partner of a firm.
T

VOLUME NO. 10 (2020), ISSUE NO. 09 (SEPTEMBER) ISSN 2231-5756
INTERNATIONAL JOURNAL OF RESEARCH IN COMMERCE, IT & MANAGEMENT A Monthly Double-Blind Peer Reviewed (Refereed/Juried) Open Access International e-Journal - Included in the International Serial Directories
http://ijrcm.org.in/
11
STUDY ON THE PROVISIONS OF SECTION 22, OF INDIAN INCOME TAX LAW, REGARDING ALLOWANCE OF EXEMPTION ON ANNUAL VALUE OF PROPERTY OF THE PARTNER, WHICH WAS OCCUPIED BY THE FIRM IN WHICH HE IS A PARTNER As per section 22 of Income Tax Act, 1961, “The annual value of property consisting of any buildings or lands appurtenant thereto of which the assessee is the owner, other than such portions of such property as he may occupy for the purposes of any business or profession carried on by him the profits of which are chargeable to income-tax, shall be chargeable to income-tax under the head "Income from house property". Here we have to have a look on some vital points, which are as follows; 1) What is taxable? 2) Who is charged to tax? 3) When it will be exempted? Unlike charging section of other heads of income, the charging section of House property income provides the provisions for both taxability and exemption. Two peculiar points what we can observe in the above charging section 22 of IT Act, 1961 are, firstly, the income charged to Taxability is Annual value of the property, but not the income or profit as per the provisions of charging sections of other heads of income. And the second point was that, the owner of the property shall be charged to tax, even though he is not the actual receiver of the income, as provided in the charging section of the head, “Income from House property”. So, as discussed above, what is taxable is the Annual Value of the property after deductions allowed were adjusted. And who is charged to tax, is the owner of the property. The exemption which is available to the owner, only if he carries on business in his own premises, which profit is subject to income tax. It is clear that exemption can be claimed by the assessee, if he occupies his property for his own business, so the annual value of such property occupied for his business purpose is not charged to tax. But the key point under the study of the present paper is, the question raises the same exemption is available to the owner of the house property, if that house is occupied by the partnership firm, in which the owner one of the partners. Legal provisions in favor of applicability of exemption to such owner – partner are, As per the provisions of section 4 of Partnership act, 1932 - "Partnership" is the relation between persons who have agreed to share the profits of a business carried on by all or any of them acting for all. And also, with reference to provisions of Section 5 of Partnership Act, 1932- status of partner, the relation of partnership arises from contract and not from status; By elaborating the above provisions of partnership act, it was clear that, a Partner ship firm is formed by a contract between two or more partners to carryon the same business. And it did not have any separate legal status or legal entity. So, partner and partnership firm both and same and not distinct persons. As per the provisions of section 25, of Partnership act, 1932 - Every partner is liable jointly with all the other partners and also severally, for all acts of the firm done while he is a partner. And as per the provisions of section 26 of Partnership act, 1932,- Where, by the wrongful act or omission of a partner acting in the ordinary course of the business of a firm or with the authority of his partners, loss or injury is caused to any third party, or any penalty is incurred, the firm is liable therefor to the same extent as the partner. According to the provisions of section 25 and 26 of the said partnership act, 1932 – Firm is liable for conduct of a partner and at the same time partner is also liable for the conduct of Firm. They both are liable for mis conduct of each other. And in the same way, it seems to be that, they both are not distinct persons. As they both are liable for the misconduct of any of them, either the firm or a partner, the exemption under section 22 cannot be disallowed by showing the partner and firm as distant persons. The same was held in, Commissioner of Income-tax vs. Rabindranath Bhol, reported in (1995) - in the eye of law, a firm is compendious expression indicate that several persons constituting that firm are carrying on a business. But the compendious expression cannot give to the firm a legal entity or a legal existence. And as per the provisions of section 28, of partnership act, 1932 - a partner is the agent of the firm for the purposes of the business of the firm. It was also held in the same case, that – one partner is agent of the other in carrying out that business. Consequently, when a partnership carries on business, each partner therefor must be said to be carrying out that business. One of the crucial characteristics of Partnership firm is “Unlimited liability”, according to which a partner is personally liable for losses of a firm. So, as per just and equity, if the losses of firm have to be borne by individual partner, then the exemption of section 22 which is said to be allowed to partner in individual status only, should also be allowed to the partnership firm, in which he is a partner. And the unlimited liability characteristic also makes the sense that partner and firm are not distinct. Legal decisions of court of law, against the applicability of exemption to such owner – partner are, As per the judgement given in Prodip Kumar Bothra v. CIT (2011) case, a partner who is the owner of the property occupied by the firm, in which he was also a partner, exemption under section 22, of the Income Tax Act, 1961 is not allowed. The following are the grounds under which above legal decision was given. 1) To get exemption under section 22, the property should be owned by the partnership firm, but not by the partner. 2) The owner and occupier must be same person. 3) To claim exemption, the property occupied by the owner for business, and such business profit shall be chargeable under the hands of that owner. In the legal judgment of, Commissioner of Income-Tax, vs K.N. Guruswamy, the court has followed the decisions of Delhi court in Bhai Sunder Dass & Sons v. CIT and also the decision of Calcutta high court in, Sarvamangala Properties Ltd. v. CIT [1973] 90 ITR 267, that, “property owned by a firm has to be treated as property of the firm and liable to be taxed in respect of income from property in its assessment and not in the assessment of its partners. Based on the above issues, raised by Mr. Banerjee, Advocate who argued on behalf of Revenue department, Court has issued the judgement, that, the exemption under section 22 of the act in respect of property not owned by the partnership firm cannot be availed, by an individual co-owner merely because he is the partner of the firm, which occupied for its business operations.
A COMPARATIVE ANALYSIS OF PROVISIONS APPLICABLE BETWEEN AN INDIVIDUAL AND SAME INDIVIDUAL AS PARTNER IN A FIRM Case A: - If an individual Mr. Z is Carrying his business in a portion of his house, and the business is chargeable to income tax, then the provisions of Section 22 of Income Tax Act, 1961 shall be applicable and Mr. Z will get exemption from taxability of Annual value of the property used for carrying his business. And he shall not be eligible for claiming deduction under section 30, because charging rent for own property is a notional rent and such notional rent is disallowed for claiming deduction by Mr. Z. Case B: - If the same individual Mr. Z is carrying his business in leased property, there is no question of Section 22 and he can deduct the amount of rent paid to the owner under section 30 of Income Tax Act, 1961. Case C: - If the individual Mr. Z is a partner in a firm M/S XYZ, and Allowed a portion of his own house property to carryon business of same firm and not charging any amount of rent, then the annual value of that portion shall be taxable as “Deemed income” and he cannot claim exemption under section 22 of Income Tax, Act,1961 as per the judgement given in, Shri Prodip Kumar Bothra v. Commissioner of Income-Tax, Kolkata case. Here in this case, Mr. Z will not get any rental income, but he shall be chargeable to house property tax as deemed income. Case D: - If the individual Mr. Z, constitute a firm M/S XYZ in which he is a partner, and allowed a portion of his own property to carryon business of same firm but charged some amount of rent from the firm, then deduction of rent paid under section 30 shall be allowed to the firm and the annual value of the property shall be taxable under House property to Mr. Z as in above case. Here both the firm and partner will get benefited and can avoid negative effect of the provisions of “deemed rent”.

VOLUME NO. 10 (2020), ISSUE NO. 09 (SEPTEMBER) ISSN 2231-5756
INTERNATIONAL JOURNAL OF RESEARCH IN COMMERCE, IT & MANAGEMENT A Monthly Double-Blind Peer Reviewed (Refereed/Juried) Open Access International e-Journal - Included in the International Serial Directories
http://ijrcm.org.in/
12
ANALYSIS OF TAX SAVINGS UNDER SEC 22, AVAILABLE TO AN ASSESSEE IN INDIVIDUAL STATUS AND PARTNERSHIP STATUS On comparing all the above four cases, A, B, C and D, the last one is beneficial to both the individual Mr. Z and the firm M/S XYZ. But when it will be beneficial to both. That means, at what amount of rent if Mr. Z charges from M/S XYZ, both will get benefited. It must be more than the annual value of the property but at what amount.
RECOMMENDATION AND SOLUTION
For a total income more than Rs. 10 lakhs after deduction of notional rent at an amount of more than Rs. 52100, per month, which is allowable as deduction to the firm, then the tax liability of the Partnership firm will be less than the tax liability of the individual owner partner. Test check of above solution In case the individual Mr. Z carried on his business in his own premises in individual capacity: -
TABLE 1
Individual Assessee (Mr. Z) Amount (Rs.)
Total Income Before deduction of notional rent 15,00,000 (More than Rs. 10,00,000)
Less:- Notional rent (not allowed as deduction) nil
Total income After deduction of notional rent 15,00,0000
Tax liability of Individual Assessee Mr. Z 2,62,500 Refer tax calculation, Table: - 2
TABLE 2
Tax calculation; Amount (Rs.)
up to Rs. 2,50,000 nil
Rs. 2,50,000 to Rs. 5,00,000 tax at a rate of 5% 12,500 (5,00,000 – 2,50,000) X 5%
Rs. 5,00,000 to Rs. 10,00,000 tax at a rate of 20% 1,00,000 (10,00,000 – 5,00,000) X 20%
Above Rs. 10,00,000 tax will be at a rate of 30% 1,50,000 (15,00,000-5,00,000) X 30%
Total tax liability 2,62,500
In case the individual Mr. Z constituted a firm and carry on his business in his own premises charging rent for the premises:
TABLE 3
Assessee as a partnership firm (M/S XYZ) Amount (Rs.)
Total Income Before deduction of notional rent 15,00,000 (More than Rs. 10,00,000)
Less: - Notional rent (allowed as deduction) 6,36,000 (monthly rent of Rs.53000 more than Rs.52100)
Total income After deduction of notional rent 8,64,000
Tax liability of Individual Assessee Mr. Z 2,59,200 (30% of Rs. 8,64,000)
So, here, tax liability of Firm Rs.2,59,200 is less than the tax liability of Individual assessee Rs.2,62,500. So, it was proved that the suggestion of constituting a firm and leasing the property to that firm is beneficial to individual assessee and firm, rather than continuing the business as individual status.
SUGGESTIONS It is common in practice of partnership firm, providing some partner’s premises as principal place of business, to reduce the rental expenditure to be paid it the same business operations were carried in any other building or it may block more capital in property, if any building was purchased. Here, according to the layman knowledge, who thinks firm’s business as his own business, in ignorance of law, the owner partner will not charge any rent for the building occupied by the firm to carry on its business operations. But as said in the above case law of, Prodip Kumar Bothra v. CIT (2011), the annual value of such rented property shall be charged to house property tax in the hands of that partner-owner as deemed income. So, to avoid the negative effects of this deemed income provisions, we can adopt the provisions of section 30 of income tax act,1961, under the head “ Profit or gains from business or profession”. Which allows deductions of rent paid to the partner for occupying his premises for business operations. And such rent should be more than the annual value of the property. It benefits to the firm for claiming deduction and get tax savings and for the partner owner, as he is getting rent amount, even though it is taxable under the head “House property”
REFERENCES 1. Commissioner of Income-tax vs. K.M. Jagannathan, reported in (1989) 180 ITR 191. Viewed as on 08-09-2020 https://www.casemine.com/judge-
ment/in/5608ffb5e4b0149711152755 2. Commissioner of Income-tax vs. P.M. Thomas, reported in (1990) 181 ITR 256. Viewed as on 08-09-2020 https://www.casemine.com/judge-
ment/in/56094e80e4b014971128151e 3. Commissioner of Income-tax vs. Rabindranath Bhol, reported in (1995) 211 ITR 799. Viewed as on 08-09-2020 https://www.casemine.com/judge-
ment/in/560988bfe4b014971137eae3 4. Commissioner Of Income-Tax,vs K.N. Guruswamy. Viewed as on 08-09-2020 https://indiankanoon.org/doc/1900047/ 5. Section - 22, Income-tax Act, 1961-2020. viewed as on 08-09- 2020 https://www.incometaxindia.gov.in/pages/acts/income-tax-act.aspx 6. Section - 30, Income-tax Act, 1961-2020. viewed as on 08-09- 2020 https://www.incometaxindia.gov.in/pages/acts/income-tax-act.aspx 7. Shri prodip kumar bothra v. commissioner of income-tax, Kolkata, viewed as on 08-09- 2020 https://www.casemine.com/judge-
ment/in/56ea808b607dba36fd0b7153#:~:text=Commissioner%20Of%20Income%2DTax%2C%20Kolkata,-The%20Judg-ment%20of&text=Bhaskar%20Bhattacharya%2C%20J.%3A%E2%80%94,tax%20Appeal%20being%20ITA%20No.
8. V.K Subramani (2011): “Unending dispute on property income”, Business line, Published as on November 27th, 2011.

VOLUME NO. 10 (2020), ISSUE NO. 09 (SEPTEMBER) ISSN 2231-5756
INTERNATIONAL JOURNAL OF RESEARCH IN COMMERCE, IT & MANAGEMENT A Monthly Double-Blind Peer Reviewed (Refereed/Juried) Open Access International e-Journal - Included in the International Serial Directories
http://ijrcm.org.in/
13
A STUDY OF CUSTOMER BEHAVIOR TOWARDS TECHNOLOGY IN BANKING SECTOR: A STUDY ON DHARWAD CITY
PAVANKUMAR U D ASST. PROFESSOR KLES G H COLLEGE
HAVERI
MEGHA G PATIL ASST. PROFESSOR KLES G H COLLEGE
HAVERI
ABSTRACT The modern world technology play important role in banking sector has enabled customer to take the banking services at anytime and anywhere in the form of ATM, Mobile banking and internet banking like as paytm, Google pay and phone pay etc. this has not only focused on baking service but also has reduced the transaction cost but also leads to high level of consumer satisfaction so now a day’s Bankers must aware about customers’ behaviour towards Electronic Banking Services. Technology in banking sector it is rapidly changes in internet banking system now a day’s rely on innovation and technology provide customer needs and satisfaction electronic banking it is facelifts 24/7 service. But question arise about consumer perception and awareness to the update technology in banking service and how much beneficial to the customer in e-banking relating knowledge can readily be made available to consumer with the help of internet banking. Because there are several network oriented innovations for –banking like as green card, smart card, Electronic Data Interchange, National Electronic Funds Transfer and Real Time Gross Settlement etc. technology examines customer related factors risk, complexity and perceived. This paper aims the e-banking service almost pre-ferred by customer’s satisfaction towards banking service.
KEYWORDS ATM, consumer behaviour and satisfaction, internet banking, mobile banking.
JEL CODES M30, O32, O33.
INTRODUCTION – Banking is the one of the huge accomplishment of e- commerce this development is change in e-business environment and innovation. The present situation in every sector customer is ‘king’ it means that no sector can exist without consumer. Therefore, the number company are facing most difficult challenge to understanding and studying consumer behaviours. Especially when it come service sector such as banking sector the consumer behaviour
analysis becomes more complex and difficult to understanding their requirements and satisfaction. e- Banking is the one of the best instrument in banking sector. The development of technology and internet has facilitated the emergence of e-banking. E-banking it provide opportunities for banks to increase the speed and efficient control in their service to customers at any time (24/7, 365 days).
LITERATURE REVIEW Dr. Vannirajan & B. Anbazagan (2007) The study tries to make an assessment of SERVPERF scale in the Indian Retail banking sector by doing a survey in banks at Madhurai. The study found that in public sector banks tangibles and assurance are most important and in private sector banks reliability, responsiveness and tangibles are most important. P K Gupta (2008) Objective of this study was to find out the behavior of customers with respect to internet banking vis-à-vis conventional banking. The study found out that internet banking was found to be easier and speedier than conventional banking and trust, accuracy and confidentiality were the most important factors here. Ellaine Wallce & Leslie De Cheratatony (2009) Study finds out the importance of assurance and reliability, customer orientation teamwork etc. in performance of. Also the study highlights criticality of branch& employee teamwork for performance. Continuous commitment and service recovery were also found important Mohammed Siddique Khan, Siba Sankar Mahapatra (2009) The study was to identify important parameters affecting service quality in internet banking. Factor analysis of the data collected finds 7 factors which included factors like reliability, access, user friendliness privacy etc. Correlation analysis shows that a significant positive correlation exists between factors. Also it was found out that business class differs from other classes in perception Padhy P K and B N Swar (2009) the paper investigated role of technology in banking and its impact on perceived service quality in public, private and foreign banks in Orissa using a s ample size of 300 customers. Foreign bank was found to be very close to expectations of customers followed by ICICI and AXIS. Service quality in public sector banks was found to be very low Rod et al (2009) The study focused on relationship between service quality, overall internet banking service quality and customer satisfaction in New Zealand. The study found out that online customer service quality and online information systems were significantly and positively related to overall customer internet banking service quality. Overall internet banking service quality and customer satisfaction were positively correlated Akiko Ueno (2010) The paper talks about the importance of quality. The study finds out the features that are fundamental in supporting service quality. The secondary research finds out the human resource functions like recruitment, teamwork etc. in maintain service quality.
E

VOLUME NO. 10 (2020), ISSUE NO. 09 (SEPTEMBER) ISSN 2231-5756
INTERNATIONAL JOURNAL OF RESEARCH IN COMMERCE, IT & MANAGEMENT A Monthly Double-Blind Peer Reviewed (Refereed/Juried) Open Access International e-Journal - Included in the International Serial Directories
http://ijrcm.org.in/
14
BANKING STRUCTURES IN INDIA CHART 1: BANKING STRUCTURES IN INDIA
MODEL OF E-BANKING CHART 2
IMPORTANCE OF THE STUDY 1. It provides how much understand and uses of e-technology 2. Taking advantage of integrated banking services, banks may compete in new markets can get new technology and grow their market issue. 3. It provides some security and privacy to customers, by using and security technologies.
OBJECTIVES OF THE STUDY 1. To study the consumer’s demographic profile. 2. To identify the consumer awareness on e-banking 3. To evaluate the attitude of consumers towards m-banking 4. To understand the concept of e-banking and its importance. 5. To identify the e-banking benefits and problems from consumer point of view. 6. To examine the impact of e-banking products on the behaviour and satisfaction of consumers.
RESEARCH METHODOLOGY Researcher have used structured questionnaire and a five point balanced likert scale for measuring consumer attitude towards technology in banking sector. Primary data was collected from respondents of Dharwad city through a questionnaire designed for a sample of 200 respondents by using the survey method. Random sampling method was adopted by the researcher and selected the samples. The data collected from the respondents are coded, tabulated and percentage analysed. Secondary data was collected from the available literature, journals and web search wherever necessary. The Questionnaire method was chosen for its versatility speed and cost benefits. Due to shortage of time the researcher has used only descriptive statistical and percentage to arrive at findings and conclusions.
PICTURE 1

VOLUME NO. 10 (2020), ISSUE NO. 09 (SEPTEMBER) ISSN 2231-5756
INTERNATIONAL JOURNAL OF RESEARCH IN COMMERCE, IT & MANAGEMENT A Monthly Double-Blind Peer Reviewed (Refereed/Juried) Open Access International e-Journal - Included in the International Serial Directories
http://ijrcm.org.in/
15
DATA ANALYSIS AND INTERPRETATION TABLE 1: GENDER OF RESPONDENTS
Gender Male Female
Frequency 75 125
Percent 37.5 62.5
TABLE 2; AGE OF RESPONDENTS
Age Below 18 18-30 30-50 Above 50
Frequency 20 130 35 15
Percent 10 65 17.5 7.5
TABLE 3: EDUCATIONAL LEVEL
Educational Level 12th standard and below Graduation or equivalent Post-graduation or equivalent Other
Frequency 27 85 50 38
Percent 13.5 42.5 25 19
TABLE 4: MONTHLY INCOME
Monthly Income Up to 50000 50001 to 100000 100001 to150000 Above 150000
Frequency 70 65 37 28
Percent 35 32.5 18.5 14
TABLE 5: NATIONALITY
Nationality Indian Other
Frequency 200 00
percent 100
TABLE 6: OCCUPATION
Occupation Student Self-employment Govt employee Business Other
Frequency 125 10 55 10 00
percent 62.5 5 27.5 5 00
CONSUMER’S DEMOGRAPHIC PROFILE CHART 2
Source: Table 1 to 6
The above table shows demographic profile total respondent were 200 by which most of the respondents are female 125, in this survey all age grouped are response out of this the majorities are age between 18-30, respondents are having complete graduation, all respondent are Indian and number of respondent are occupation student and Govt employee
TABLE 7: WHAT DO YOU KNOW ABOUT E-BANKING
Awareness Significant Little bit Not at all
Frequency 169 31 00
percent 84.5 15.5 00
TABLE 8: FREQUENCY OF USE OF E-BANKING SERVICES
Uses Once a week 2-3 times a week 4-5 times a week Frequently
Frequency 89 91 10 10
percent 44.5 45.5 5 5
Table 9: USE ANY E-BANKING SERVICES
e- banking services Yes No
Frequency 200 00
percent 100 00
0
20
40
60
80
100
120
140
160
180
200
Gender Age Eductional level MonthlyIncome
Nationality Occupation
75
125
20
130
35
15
27
85
50
38
70
65
37
28
200
125
10
55
10
other3 business
Govt Employee self employment
Student other2
Indian above 1.5L
1 L-1.5L 50k-1 L
up to 50k other
post-graduation Graduation
12th std and below above 50
30-50 18-30
Below 18 Female
Male

VOLUME NO. 10 (2020), ISSUE NO. 09 (SEPTEMBER) ISSN 2231-5756
INTERNATIONAL JOURNAL OF RESEARCH IN COMMERCE, IT & MANAGEMENT A Monthly Double-Blind Peer Reviewed (Refereed/Juried) Open Access International e-Journal - Included in the International Serial Directories
http://ijrcm.org.in/
16
CHART 3
Source: Table 7 to 9
The above table shows that most of the respondents are aware and using the e-banking system and respondents are frequently using e-banking concepts. And also all responds are having and using e –banking examples are ATM, M-banking and Paytm etc.
TABLE 10: REASONS THAT CUSTOMERS HAVE NOT OPENED AN E-BANK ACCOUNT
Reasons Under age Never heard e-banking Concerned about security
Have not taken time to open an account
I prefer to have personal human relation
Frequency 00 00 80 70 50
Percent 0 0 40 35 25
TABLE 11: HOW LONG HAVE YOU BEEN USING THE E-BANKING SERVICES
Duration Less than 1 month 1 month – less than 1 year 1 year- less than 2 year 2 year or more
Frequency 00 00 35 165
Percent 00 00 17.5 82.5
TABLE 12: WHERE DO YOU USUALLY ACCESS THE INTEREST FROM
Access Home Work place College Cyber café Other
Frequency 30 60 40 05 65
Percent 15 30 20 2.5 32.5
TABLE 13: WHICH ELECTRONIC FEATURE DO YOU USE REGULARLY
Feature Pay bills Make an A/c inquiry Wire transfer Transfer funds between A/c Process patrol Order cheque book
Frequency 42 82 26 16 20 14
Percent 21 41 13 8 10 7
TABLE 14: HAVE YOU HAD DIFFICULTY LOGGING INTO THE BANKS WEBSITE
Logging All the time Some times Not at all
Frequency 30 150 20
Percent 15 75 10
TABLE 15: DO YOU ALSO HAVE A TRADITIONAL BANK A/C
Traditional bank Yes No
Frequency 35 165
Percent 17.5 82.5
TABLE 16: DO YOU STILL VISIT THE BANK BRANCHES SINCE YOU STARTED USING E-BANKING SERVICES
Branches Yes No
Frequency 40 160
Percent 20 80
0
20
40
60
80
100
120
140
160
180
200
awareness Uses E-banking services
169
31
0
89 91
10 10
200
significant
little bit
not at all
once a week
2-3 times a week
4-5 times a week
frequently
yes
no

VOLUME NO. 10 (2020), ISSUE NO. 09 (SEPTEMBER) ISSN 2231-5756
INTERNATIONAL JOURNAL OF RESEARCH IN COMMERCE, IT & MANAGEMENT A Monthly Double-Blind Peer Reviewed (Refereed/Juried) Open Access International e-Journal - Included in the International Serial Directories
http://ijrcm.org.in/
17
CHART 4
Source Above table
The above tables show that the total respondents were 200 by which 80& 70 respondents are agree to security and it’s taken more time respectively so reason of that consumer not open e-banking. And numbers of respondents are access internet transaction at work place and college. And numbers of respondents is faces difficult logging into the bank account in sometimes and also after installing e-banking majority of responds are not visit to bank
TABLE 17: WHAT ARE THE REASONS THAT YOU TYPICALLY VISIT YOUR BANK BRANCH
Frequency percent
To deposits cash 60 30
To withdraw cash 40 20
To get advice for investment option 10 5
To pay taxes 00 0
To raise a loan 35 17.5
To operate PPF 00 0
To take out a DD 55 27.5
To operate a locker 00 00
TABLE 18: WHAT ARE YOUR REASONS FOR CHOOSING E-BANKING SERVICES
Benefits Conveniences Time saving Safety 24 hours access to account Reliability User friendly
Frequency 25 80 00 60 00 35
Percent 12.5 40 0 30 0 17.5
TABLE 19: IN USING OF E-BANKING SERVICES HAVE YOU FACED DATA QUALITY ISSUES
Quality Accuracy Completeness Update status Reliability Relevance Easy access
Frequency 14 25 51 40 15 55
Percent 7 12.5 25.5 20 7.5 27.5
TABLE 20: OVERALL HOW SATISFIED YOU WITH E-BANKING
Satisfied Very satisfied Satisfied Neutral Dissatisfied Very dissatisfied
Frequency 151 49 00 00 00
Percent 75.5 24.5 0 0 0
TABLE 21: DO YOU THINK HUMAN CONTACT IS IMPORTANT FOR BANKING
Significant Completely Sometimes Unsure Not at all
Frequency 12 141 40 07
Percent 6 70.5 20 3.5
TABLE 22: WHAT WOULD ENCOURAGE YOU TO USE MORE THE E-BANKING SERVICES
Rewards Simples procedure Higher security Lower transaction
Frequency 23 159 15 03
Percent 11.5 79.5 7.5 1.5
TABLE 23: PLEASE RANK THE E-BANKING SERVICES IN ORDER OF BEING USER FRIENDLY
Rank Telephone banking M-banking ATM
Frequency 65 60 75
Percent 32.5 30 37.5
TABLE 24: QUALITY OF SERVICES IN E-BANKING
Quality Excellent Very good Good Averages Poor
Frequency 72 50 42 25 11
Percent 36 25 21 12.5 5.5
0
20
40
60
80
100
120
140
160
180
200
not opended an e-bank account access the
transcation difficulty loggingafter e-banking
80
70
50
30
60
40
65
30
150
20
60
140
no
yes
not at all
some times
all the time
other
cyber café
college
workplace
home
human relation
open an a/c humen relation
security

VOLUME NO. 10 (2020), ISSUE NO. 09 (SEPTEMBER) ISSN 2231-5756
INTERNATIONAL JOURNAL OF RESEARCH IN COMMERCE, IT & MANAGEMENT A Monthly Double-Blind Peer Reviewed (Refereed/Juried) Open Access International e-Journal - Included in the International Serial Directories
http://ijrcm.org.in/
18
FINDINGS Majority (42.5%) of the consumer’s have educated. Consumer have expressed strongly about the concepts of E-banking. Majority (84.5%) of the respondents knowing about E-banking. People are using and knowledge about e-banking and benefits of M & E-banking system. From the results we can conclude that the frequency2-3 times a week of use of e –banking. From the above result s concerned about security and they are preferring to human relation so respondents have not opened an electronic bank account. Respondents state that usually30% access the internet from in workplace and also college. Consumer’s attitudes towards technology in E-banking. Most of the consumers for choosing e-banking services because of time saving and 24/7 hours’ access to account. Majority of respondent’s reason for visit to bank to deposits Cash, to withdrawal cash and to take out a DD with respect of 30%, 20% and 27.5% respectively. From results above people agree easy access and update status of using of E–banking services they have faced data quality issues. Majority (75.5%) respondents are very satisfied with e-banking services. Respondents are think human contact important for banking relation. Number of respondent are agreeing to the quality of services in e-banking.
SUGGESTION According to survey improve the e-mode system and avoided error and improver surveyor. Some of the ATM and others devises not working properly so improver that and update.
CONCLUSION The banking sector has update many changes the new economic policy based on privatization, globalization and liberalizations 1991 adopted by government of India. Customer is the king in the modern days banking. Today the customer services preference keeps on changing at a rapid speed and their demands. For the banking sector challenging and tough job for security and convince to customer. The aim of the bankers is to make the customers satisfied and happy to achieve their targets. Today number of banks is there and each bank follow different procedure it is very difficult to follow the customers. Even though the consumer is well educated some time high technology banking services difficult to the customer for the transaction. For the effective banking transaction, the banks should have well communication, soft skill must require. Universal banking procedure can help the customer for the better truncation and customer comfort and satisfied.
REFERENCES JOURNAL AND OTHER ARTICLE 1. A. Ananth Arul Raj. A (2011), “A study on banking quality in Nagapattinam district, Tamilnadu”, Indian Journal of Marketing Vol.41, P4-5. 2. Ghosh and kalishB1 (2011),"Impact of services quality on customer satisfaction, loyality and commitment in the banking sector”, Indian Journal of Marketing,
vol.40 no.5 p.23. 3. Kumar M and Rajesh R (2009),"Whether today's customer are satisfied?", India journal of marketing, Vol.xxxix, No.9, p.46. 4. Mshra Anubhv Anand (2010), “Factors affecting customers satisfaction and their Relative Importance in retail banking sector an empirical study", The IUP
Journal of management Research, Vol.ix, No.3, p.7 BOOKS 5. Gupta, S. K., Singh, J., & Sharma, R. K. (2006). Banking & Insurance (10th ed.). Ludhiana, India: Kalyani Publishers. 6. Kotler, P. and Keller, K., 2012. Marketing management. 14th ed. New Jersey: Prentice Hall. 7. Kotler, P., Amstrong, G., Saunders, J., and Wong, V., 1999. Principles of marketing. Second European Edition. London: Prentice Hall Europe. 8. Kulkarni, R. V., &Desai, B. L. (2004). Knowledge-based Systems in Banking Sector (1st ed.). New Delhi, India: New Century Publications.

VOLUME NO. 10 (2020), ISSUE NO. 09 (SEPTEMBER) ISSN 2231-5756
INTERNATIONAL JOURNAL OF RESEARCH IN COMMERCE, IT & MANAGEMENT A Monthly Double-Blind Peer Reviewed (Refereed/Juried) Open Access International e-Journal - Included in the International Serial Directories
http://ijrcm.org.in/
19
IMPACT OF PANDEMIC INDUCED LOCKDOWN ON STOCK MARKET PERFORMANCE WITH SPECIAL REFERENCE TO INDIAN EQUITY MARKET
Dr. RAVINDRA INDEPENDENT RESEARCHER
“SAI SADAN” PLOT NO. 57 KAILASH NAGAR KALABURAGI
ABSTRACT
The paper attempts to understand the impact of Pandemic induced lockdown on stock market performance pre and during the lockdown period with special reference to Indian equity market. The following observations were made from the findings of the study. Pandemic induced lockdown seems to have a temporary or short term impact of the stock market performance. Due to lower than the expected earnings coupled with fear of possible economic slowdown, overall sentiment of the market remained negative during the 1st, 2nd and 3rd phase of lockdown. However, the market seemed to have recovered from the pandemic shock during the 4th phase of the lookdown. During pre-lockdown period the Sensex was found to be trading at higher valuations. On the other hand, during lockdown period the market swing from expensive to cheap. However, this trend could not sustain for the longer period as it was observed that during the 4th phase of the lockdown the market was found to be rebounding and market swing from cheap to expensive again. In terms of volatility the market was found to be more volatile during the lockdown period due to negative sentiments towards the equity market. Increase in the foreign portfolio investment coupled with government measures to strengthen the economy boosted the investors’ confidence in equity market during the 4th phase of the lockdown.
KEYWORDS COVID-19, FPI, lockdown, market-cap-to-GDP ratio, pandemic, P/E ratio, sensex, volatility index.
JEL CODES H24, K34.
INTRODUCTION uring December of 2019, the world became aware of new global-scale threat called at first as corona virus, which changed the lives of millions of people around the globe. The corona virus has multiple impacts regarding public polices, economic production, and population dynamics at macro and micro scale levels across countries, the magnitude of these changes remains unknown since the Corona virus (now called Covid-19) strikes pretty fast at almost
every nation of the world (directly or indirectly). [Sheif M. Hassan et.al 2020, (Submitted for the consideration of EEA Covid-19 project networking. This paper is a part of M&S Research Hub Institute’s research project (Covid19 and global Economy)]. In early and mid-January 2020, the virus started to spread to other Chinese provinces, supported by a huge movement of people towards their hometowns to celebrate Chinese New Year which turned the outbreak into a national crisis. Although Wuhan official announced a complete travel ban in terms of its residents of January 23, the virus still spared quickly. The WHO declared a global emer-gency due to the rapidly spreading of COVID-19 on January 30, 2019. It’s only the sixth time that such type of global emergency has been announced, with past examples including that of the Democratic Republic of Congo Ebola outbreak and the Zika Virus. Chinese scientists linked this disease to a virus family known as corona viruses, which included both the severe acute respiratory syndrome (SARA) virus and the Middle East respiratory syndrome (MERS). (HaiYue Liu et.al Feb 2020). Indian government confirmed first case of COVID-19 on January 30 2020 in Kerala. Following the increase in the number of cases of corona virus in India the prime minister of India on 19th mach 2020 asked all citizens to observe ‘ Janata Curfew’ on 22nd march 2020. Following this event the PM Modi on 24 March announced 21 day lockdown throughout the country. Prime Minister Modi emphasized that the only solution to control the spreading of COVID-19 is to break the chain and practice social distancing. Ever since COVID-19 strike, markets loom under fear as uncertainty prevails. It has sent markets around the world crashing to levels not witnessed since the Global Financial Crisis of 2008. Following the strong correlation with the trends and indices of the global markets as BSE Sensex and Nifty 50 fell by 38%. The total market cap lost a staggering 27.31% from the start of the year. The stock market has reflected the sentiments this pandemic unleashed upon investors, foreign and domestic alike. Companies have scaled back layoffs have multiplied and employee compensations have been affected resulting in negligible growth in the last couple of months. Certain sectors such as hospitality, tourism and entertainment have been impacted adversely and stock of such companies have plummeted by more than 40% [S Ravi May 2020 (Impact of COVID-19 on Indian Stock Markets, BW Business World, http://www.businessworld.in/ Accessed on 18 June 2020.)]
LITERATURE REVIEW 1. Sehgal, Sanjay & Tripathi, Vanita (2007): examined if there is value effect in Indian stock market. The study also attempts to identify important sources that
cause it. The study found statistically significant value effect using alternative measures such as book to market equity (BE/ME), earnings to price (E/P), cash flows to price (C/P) and dividends to price (D/P). Value effect is found to be significant on unadjusted as well as risk-adjusted return basis. Trading strategy based on value effect is found to be economically feasible.
2. Sehgal. S and Pandey. A (2010): The paper attempts to evaluate the equity valuation in India using Price multiples. The samples of study covers 13 prominent sector and data are taken from 145 large companies that satisfy their screening criteria for the period from 1999 to 2007. The findings of the study reveal that “Price-to-earnings provide the best price forecast compared to the other three multiples, price-to-book value, price-to-cash flow and price to sales. Finally, authors recommend that the historical price to earnings (P/E) is the best price multiples for developing price forecast in the Indian environment.
3. Paramati, Sudharshan Reddy & Gupta, Rakesh (2011): found that there is a bidirectional relationship between IIP and stock prices (BSE and NSE) and quar-terly results reveal that there is no relationship between the GDP and BSE but in case of NSE and GDP there is a unidirectional relationship and that runs from GDP to NSE. The study also confirms that there is a long-run relationship between the stock market performance and the economic growth. Finally, the results of error correction model revel that when the long-run equilibrium deviates then the economic growth adjusts to restore equilibrium by rectifying the disequilibrium.
4. Masoud, Najeb (2013): Concludes that there is a positive relationship between efficient stock markets and economic growth, both in short run and long run and there is evidence of an indirect transmission mechanism through the effect of stock market development on investment. They are seen as providing a service that boosts economic growth. The results are consistent with the theoretical and empirical predictions.
5. Yadav. S (2017): In his paper, stock market volatility – A study of Indian stock market concludes that “in general over that reference period the bull phase is longer, the amplitude of bull phase is higher and the volatility in bull phase is also higher. The gains during expansions are larger than the losses during the bear phases of the stock market cycles. The bull phase in comparison with its pre liberalization character is more stable in the post liberalization phase. The results of his study show that the stock market cycles have dampened in the recent past. Volatility has declined in the post liberalization phase for both the bull and bear phase of the stock market cycle”
D

VOLUME NO. 10 (2020), ISSUE NO. 09 (SEPTEMBER) ISSN 2231-5756
INTERNATIONAL JOURNAL OF RESEARCH IN COMMERCE, IT & MANAGEMENT A Monthly Double-Blind Peer Reviewed (Refereed/Juried) Open Access International e-Journal - Included in the International Serial Directories
http://ijrcm.org.in/
20
6. HaiYue Liu et.al (2020): found that countries in Asia experienced more negative abnormal returns as compared to other countries. Further panel fixed effect regressions also support the adverse effect of COVID-19 confirmed cases on stock indices abnormal returns through an effective channel by adding up investors’ pessimistic sentiment on future returns and fears of uncertainties.
7. Hakan Yilmazkuday (2020): found that having 1% on an increase in cumulative daily COVID-19 cases in the U.S results in about 0.01% of cumulative reduction in the S&P 500 index after one day and about 0.03% of reduction after one month. Historical decomposition of the S&P 500 Index further suggests that the negative effects of COVID-19 cases in the U.S on the S&P 500 Index have been mostly observed during March 2020.
8. Gormsen, Niels Joachim and Koije, Ralph S. J (2020): the study shows how the actual forecast and the bound evolve over time. As of June 8, the researcher stated that their forecast of annual growth in dividends is down 9% in the US and 14% in the EU compares to January 1, and forecast of GDP growth is down by 2.0% in the US and 3.1% in the EU. The lower bound on the change in expected dividends is -18% in the US and -25% in the EU at the 2 –year horizon. Finally, the News about fiscal stimulus around March 24 boosts the stock market and long-term growth but did little to increase short-term growth expecta-tions. Expected dividend growth has improved since April in both the US and the EU.
9. Enrico Onali (2020): found that changes in the number of cases and details in the US and six other countries majorly affected by the COVID-19 crisis do not have an impact on the US stock market returns, apart from the number of reported cases for china. However, there is evidence of a positive impact, for some countries, on the conditional hetroscedasticity of the Dow Jones and S&P 500 returns. VAR models suggest that the number of reported deaths in Italy and France have a negative impact on stock market returns, and a positive impact on the VIX returns.
10. Sivakumari, S & Sudhakar, Suraj & K P, Nitha (2020): the paper shows the predictive power and valuation accuracy of P/E Model, P/B model and CAPM to know the significance and reliability of the models for Sensex stocks in Indian Stock Market. The study selected a sample of 30 companies which constitutes the BSE sensitive index (Sensex). There are high levels of valuation errors for stocks in India using P/E model and P/B Model. But the valuation accuracy of capital asset pricing model was at high level and can be used for predicting the intrinsic value of Sensex stocks in Indian stock market.
After reviewing the above studies, it is evident that no specific study is undertaken to examine the impact of pandemic induced lockdown on the stocks markets in Indian context. In view of this the present study makes an attempt to study the impact of lockdown due to covid-19 pandemic on the stock market with special reference to equity market in India.
OBJECTIVES OF THE STUDY The following objectives are set for the present study: 1. To understand the stock market performance in terms of Risk and Return. 2. To understand the valuation of stock market during the study period. 3. To know the amount of foreign portfolio investment in equity market during the study period.
METHODOLOGY The present study aims to examine the Impact of pandemic induced lockdown on the stock market performance in India. In order to achieve the stated objective, the following method is employed. Firstly, in order to have comprehensive understanding of the impact of lockdown on the BSE-Sensex the researcher has attempted to study the performance of 30 share index pre and during the lockdown period. For this study the period starting from November-2019 to February 2020 is taken as pre-lockdown period and a period starting from March 2020 to June 2020 is lockdown period. Secondly, BSE-Sensex is taken as proxy for the stock market performance in India the performance of BSE-Sensex is read in terms of Risk, Return, Valuation, and foreign portfolio investment in equity markets. Risk is measured using S&P BSE Sensex 3-month Realized volatility index. “The S&P BSE Sensex 3-Month Realized Volatility index is the first of its kind in India. It provides market participants with accurate measures of the historic volatility of the S&P BSE Sensex over a three-month time horizon. It is synchronized with BSE’s three-month futures and options contract expiration cycles and is reset every three months.” The monthly data relating to the 3-Month Realized Volatility index is collected and the average value of the same is taken to understand the level of risk or volatility of the stock market. Market returns are calculated by dividing the closing price of the present month by the previous month and deducting one from the result. Price-to-earnings ratio and market-cap-to-GDP ratio is used to measure stock market valuation. The following table depicts the different bands for understanding the market valuations using Market-cap-to-GDP ratio as measure of market valuation.
TABLE 1
Ratio = Total market Cap/GDP Valuation
Ratio ≤50% Significantly Undervalued
50% < Ratio≤ 65% Modestly Undervalued
65%< Ratio≤79% Fair Valued
79% < Ratio≤93% Modestly Overvalued
Source: www.gurufoucs.com SOURCES OF INFORMATION The data collected for the study is secondary in nature. The data relating to the S&P BSE Sensex 3-month Realized volatility index, Market return, Price-to-earnings ratio is sourced from the official website of the Bombay Stock Exchange. Data relating to the market-cap-to GDP is collected from the website guru focus. Finally, the data on foreign portfolio investment in the equity market in India is taken from the official website of the National Securities Depository Limited (NSDL). STRUCTURE OF THE STUDY The present paper is organized into four sections. The first section deals with the introduction. The second section consists of literature reviews, objectives, methodology, and sources of information. Results and analysis are the subject matter of third section. Findings, limitations and conclusion were offered in the last and final section.
RESULTS AND ANALYSIS TABLE 2: SENSEX MONTHLY RETURNS PRE AND DURING THE LOCKDOWN
Pre-Lockdown period High Low Close Return (%) Lockdown Period High Low Close Return (%)
Nov-19 41163.79 40014.23 40793.81 1.66 Mar-20 39083.17 25638.90 29468.49 -22.85
Dec-19 41809.96 40135.37 41253.74 1.13 April-20 33887.25 27500.79 33717.62 14.42
Jan-20 42273.87 40476.55 40723.49 -1.27 May-20 32845.48 29968.45 32424.10 -3.74
Feb-20 41709.30 38219.97 38297.29 -5.93 June-20 35706.55 32348.10 34915.80 7
Average 40267.08 -1.10 Average 32631.50 -1.29
Source: Complied and calculated Table 2 depicts the performance of BSE-Sensex pre and during the lockdown period. It can be observed from the table that during pre-lockdown period the Sensex was trading above forty thousand points. From November 2020 to February 2020 on an average the Sensex was trading at 40267.08 points. It is evident from the table that BSE-Sensex was trading at its all-time high during jan-2020 i.e. 42273.87 points. During the period Nov-19 to Dec-19 Sensex posted positive returns of 1.66 % and 1.13 % respectively. However, by the end of the jan-2020 the covid-19 pandemic had hit the stock exchanges around the world which led to fall in the Sensex return during Jan and Feb 2020. On an average Sensex posted -1.10 returns during the pre-lockdown period. The beginning of the year 2020 i.e. jan-20 and

VOLUME NO. 10 (2020), ISSUE NO. 09 (SEPTEMBER) ISSN 2231-5756
INTERNATIONAL JOURNAL OF RESEARCH IN COMMERCE, IT & MANAGEMENT A Monthly Double-Blind Peer Reviewed (Refereed/Juried) Open Access International e-Journal - Included in the International Serial Directories
http://ijrcm.org.in/
21
Feb -2020 witnessed negative returns of -1.27% and -5.93 % respectively. On the other hand, during lockdown period the Sensex fell to its three year low i.e. 25, 6389.90 points during March 2020 and Sensex posted negative return of -22.85%. However, the market seemed to have recovered from the pandemic shock during the month of April 2020 as the Sensex posted 14.99% returns up from -22.85 % during its previous month close. Further it can be observed that due to lower than the expected earnings coupled with fear of possible economic slowdown overall sentiment of the market remained negative during the lockdown period as Sensex on an average gave a return of -1.29% during this period.
TABLE 3: PRICE-TO-EARNINGS RATIO OF SENSEX
Pre-Lockdown Period P/E Lockdown Period P/E
Nov-2020 27.82 Mar-2020 19.55
Dec-2020 27.95 April-2020 18.78
Jan-2020 25.67 May-2020 19.46
Feb-2020 24.64 June-2020 21.82
Average 26.52 Average 19.9025
Source: BSE Table 3 Historical average Sensex PE ratio from 2007 to 2019 is 20.49. In terms of valuation, during pre lockdown period the Sensex was found to be trading at higher valuations i.e. the price-to-earnings ratio of 30-share index was above its historical average 20.49, generally P/E ratio of 20 and above indicates the over-valuation of the market. On an average the P/E ratio of Sensex during the period from November 2020 to February 2020 was 26.52 signaling overvaluation of the market. On the other hand, the market corrected during the lockdown period as the price-to-earnings ratio of Sensex during lockdown period was found to be declining. P/E ratio which was trading at above 20 during pre locked period had substantially declined during the pase1, phase2, and phase 3 of the lockdown period i.e. P/E ratio of Sensex during feb-2020 was 24.64, however it declined to 19.55 by the end of March 2020. The average price-to-earnings ratio of Sensex during the lockdown period was 19.90. However, the indices swing from cheap to expensive during the month June 2020 as the P/E was found to be above 20.
TABLE 4: MARKET-CAP-TO-GDP RATIO
Pre-Lockdown Period M-Cap –to-GDP (%) Lockdown Period M-Cap –to-GDP (%)
Nov-2019 73.49 Mar-2020 48.29
Dec-2019 67.61 April-2020 55.26
Jan-2020 66.74 May-2020 53.14
Feb-2020 62.76 June-2020 57.22
Range 10.73 Range 8.93
Source: www.gurufoucs.com Table 4 depicts the Market –Cap-to-GDP ratio pre and during the lockdown period. The Market-cap-to-GDP ratio is one of the widely used valuation tool to understand whether, the stock market is overvalued or undervalued. Upon observing the table, it is clearly evident the market cap-to GDP ratio during the pre-locked down period was in the band of 65% to 79% indicating that the market was fairly valued. On the other hand, the M-cap-to-GDP ratio during the lockdown period was in the band of 50% to 65%, which indicates the market is modestly undervalued during the lock down period.
TABLE 5: FOREIGN PORTFOLIO INVESTMENT (FPI) IN EQUITY MARKET
Pre-Lockdown Period FPI (in INR Crores) Lockdown Period FPI (in INR Crores)
Nov-2019 25231 Mar-2020 -61973
Dec-2019 7338 April-2020 -6884
Jan-2020 12123 May-2020 14569
Feb-2020 1820 June-2020 20672
Average 11628 Average -8404
Source: NSDL Table 5 presents the foreign portfolio investment in equity market pre and during the lockdown period. It can be observed from the above table that during pre-lockdown period on an average the foreign portfolio investment in equity market was 11628 crores. Further it is also observed that during the pre-locked period though the amount invested by Foreign portfolio investors were fluctuating but investors seemed to be to have positive sentiment towards the market. However, the in the beginning of the pahse1 and phase 2 of the lockdown period investors sentiment in equity market turned negative, to speak specifically, the foreign portfolio investment during the period march and April 2020 was -61973 cr and -6884 respectively. Finally, the financial package announced by the central gov-ernment to overcome the possible economic slowdown due to COVID-19 pandemic seemed to have boosted the investors sentiment which was evident by the amount of foreign portfolio investment made in equity markets during the period May and June 2020, i.e. 14569 cr and 20672 cr respectively.
TABLE 6: S&P BSE-SENSEX 3- MONTHS REALIZED VOLATILITY INDEX
Pre-Lockdown Period Average 3- Months Realized Volatility index Lockdown Period Average 3- Months Realized Volatility index
Nov-2019 6.42 Mar-2020 41.22
Dec-2019 8.13 April-2020 60.02
Jan-2020 9.43 May-2020 43.41
Feb-2020 19.57 June-2020 29.86
Source: BSE Table 6 depicts the average S&P BSE Sensex 3 months realized volatility pre and during the lockdown period. A High the value of volatility index indicates the high volatility and uncertainty in the market. It is clearly evident from the table that during the pre- lockdown period market was less volatile. To speak specifically, during the period from Nov-19 to Feb 2020 the average 3- months realized volatility index value were 6.42, 8.13, 9.43 and 19.57 respectively. On the other hand the during the lockdown period i.e. from Mar-2020 to June 2020 the market was more volatile as the Average 3- Months Realized Volatility index during the lockdown period i.e. from March 2020 to June 2020 were 41.22, 60.02, 43.41 and 29.86 respectively.
FINDINGS 1. During pre-locked down period on an average the Sensex was trading at 40267.08 points. 2. BSE-Sensex was trading at its all time high during the period jan-2020 i.e. 42273.87 points. 3. During the period Nov-19 to Dec-19 Sensex posted positive returns of 1.66 % and 1.13 % respectively. However, by the end of the jan-2020 the covid-19
pandemic had hit the stock exchanges around the world which led to fall in the Sensex return during Jan and Feb 2020. 4. On an average Sensex posted -1.10 returns during the pre-lockdown period. 5. The beginning of the year 2020 i.e. jan-20 and Feb -2020 witnessed negative returns of -1.27% and -5.93 % respectively. 6. Sensex fell to its three year low i.e. 25, 6389.90 points during March 2020 and Sensex posted negative return of -22.85%.

VOLUME NO. 10 (2020), ISSUE NO. 09 (SEPTEMBER) ISSN 2231-5756
INTERNATIONAL JOURNAL OF RESEARCH IN COMMERCE, IT & MANAGEMENT A Monthly Double-Blind Peer Reviewed (Refereed/Juried) Open Access International e-Journal - Included in the International Serial Directories
http://ijrcm.org.in/
22
7. Market seemed to have recovered from the pandemic shock during the month of April 2020 as the Sensex posted 14.99% returns up from -22.85 % during its previous month close.
8. Due to lower than the expected earnings coupled with fear of possible economic slowdown the overall sentiment of the market remained negative during the lockdown period as Sensex on an average gave a return of -1.29% during this period.
9. In terms of valuation, during pre lockdown period the Sensex was found to be trading at higher valuations i.e. the price-to-earnings ratio of 30-share index was above it historical average 20.49
10. On an average the P/E ratio of Sensex during the pre-lockdown period was 26.52 signaling overvaluation of the market. 11. Market corrected during the lockdown period as the price-to-earnings ratio of Sensex during lockdown period was found to be declining. 12. P/E ratio which was trading at above 20 during pre locked period had substantially declined during the pase1, phase2, and phase 3 of the lockdown period
i.e. P/E ratio of Sensex during feb-2020 was 24.64, however it declined to 19.55 by the end of March 2020. 13. The average price-to-earnings ratio of Sensex during the lockdown period was 19.90. However, the indices swing from cheap to expensive during the month
June 2020 as the P/E was found to be above 20. 14. Market cap-to GDP ratio during the Pre locked down period was in the band of 65% to 79% indicating that the market was fairly valued. 15. Market cap-to-GDP ratio during the lockdown period was in the band of 50% to 65%, which indicates the market is modestly undervalued during the lock
down period. 16. During Pre-lockdown period on an average the foreign portfolio investment in equity market was 11628 crores 17. The beginning of the pahse1 and phase 2 of the lockdown period investors sentiment in equity market turned negative, to speak specifically, the foreign
portfolio investment during the period march and April 2020 was -61973 cr and -6884 respectively. 18. The financial package announced by the central government to overcome the possible economic slowdown due to COVID-19 pandemic seemed to have
boosted the investors sentiment which was evident by the amount of foreign portfolio investment made in equity markets during the period May and June 2020, i.e. 14569 cr and 20672 cr respectively.
19. During the Pre-locked period market seemed to be less volatile as the average 3- months realized volatility index value were 6.42, 8.13, 9.43 and 19.57 respectively. On the other hand the during the lockdown period i.e. from Mar-2020 to June 2020 the market was more volatile as the Average 3- Months Realized Volatility index during the lockdown period i.e. from March 2020 to June 2020 were 41.22, 60.02, 43.41 and 29.86 respectively.
CONCLUSION The paper attempts to understand the impact of Pandemic induced lockdown on stock market performance pre and during the lockdown period with special reference to Indian equity market. The study found that Due to lower than the expected earnings coupled with fear of possible economic slowdown overall sentiment of the market remained negative during the 1st, 2nd and 3 rd phase of lockdown. However, the market seemed to have recovered from the pandemic shock during the 4th phase of the lookdown. During pre-lockdown period the Sensex was found to be trading at higher valuations. On the other hand, during lock down period the market swing from expensive to cheap. However, this trend could not sustain for the longer period as it was observed that during the 4th phase of the lockdown the market was found to be rebounding and market swing from cheap to expensive. Further, in terms of volatility the market was found to be more volatile during the lockdown period due to negative sentiments towards the equity market. In Nutshell, pandemic induced lockdown seems to have a tem-porary or short term impact of the stock market performance as the market sentiment was found to be negative during the Phase1, Phase2, and Phase3 of the lockdown period. However, market was found to be rebounding during the fourth phase of lockdown. Further it was also observed that increase in the foreign portfolio investment coupled with government measures to strengthen the economy boosted the investors’ confidence in equity market.
LIMITATIONS Following are some of the major limitations of the study 1. Foreign portfolio investment in Debt market is not considered in the present study 2. BSE-Sensex is considered as a proxy for stock market performance, while other index such as NIFTY-50 is not considered. 3. Only equity segment is taken to understand the stock market performance, while derivatives and commodity segment is ignored.
REFERENCES 1. Gormsen, Niels Joachim and Koijen, Ralph S. J., Coronavirus (2020), “Impact on Stock Prices and Growth Expectations (June 9, 2020)”. University of Chicago,
Becker Friedman Institute for Economics Working Paper No. 2020-22. Available at SSRN: https://ssrn.com/abstract=3555917 or http://dx.doi.org/10.2139/ssrn.3555917
2. https://en.wikipedia.org/wiki/COVID-19_pandemic_lockdown_in_India, Accessed on 12th June 2020. 3. https://www.asiaindex.co.in/indices/equity/sp-bse-sensex-3-month-realized-volatility-, S&P BSE SENSEX 3-Month Realized Volatility Index, 11th July 2020. 4. https://www.fpi.nsdl.co.in/web/Reports/Yearwise.aspx?RptType=6, FPI / FII Investment Details (Calendar Year), Accessed on 9th June 2020. 5. https://www.gurufocus.com/global-market-valuation.php?country=IND, Buffett Indicator: Where Are We with Market Valuations? Accessed on 16th July
2020 6. https://www.rbi.org.in/scripts/FAQView.aspx?Id=26, Foreign Investment in India, Accessed on 11th July 2020. 7. Liu, HaiYue & Manzoor, Aqsa & Wang, CangYu & Zhang, Lei & Manzoor, Zaira. (2020), “The COVID-19 Outbreak and Affected Countries Stock Markets Re-
sponse”. International Journal of Environmental Research and Public Health. 17. 2800. 10.3390/ijerph17082800. 8. Masoud, Najeb. (2013), “The Impact of Stock Market Performance upon Economic Growth”, International Journal of Economics and Financial Issues, Vol. 3,
No. 4, 2013, pp.788-798. 9. Onali, Enrico, (2020), “COVID-19 and Stock Market Volatility” (May 28, 2020). Available at SSRN: https://ssrn.com/abstract=3571453 or
http://dx.doi.org/10.2139/ssrn.3571453 10. Paramati, S.R. and Gupta, R. (2011), “An empirical analysis of stock market performance and economic growth: Evidence from India”, International Research
Journal of Finance and Economics, Issue 73, 133-149. 11. S Ravi May 2020, Impact of COVID-19 on Indian Stock Markets, BW Business World, http://www.businessworld.in/ Accessed on 18th June 2020. 12. Sehgal, Sanjay & Pandey, Asheesh. (2010). “Equity valuation using price multiples: Evidence from India”, Asian Academy of Management Journal of Account-
ing and Finance. 6. 13. Sehgal, Sanjay & Tripathi, Vanita. (2007), “Value Effect in Indian Stock Market”, The ICFAI journal of applied finance. 13. 23-36. 14. Sherif M. Hassan et.al 2020,” The Impact of Covid-19 in the Performance of stock market indices. Submitted for the consideration of EEA Covid-19 project
networking. This paper is a part of M&S Research Hub institute’s research project (Covid -19 and Global Economy). 15. sivakumari, S & Sudhakar, Suraj & K P, Nitha. (2020), “Does Valuation Models Work well for Sensex stocks in Indian Stock Market? -An Empirical Analysis”.
Test Engineering and Management. 83. 16. Yadav.S (2017), “Stock Market Volatility - A Study of Indian Stock Market”, Gjra - Global Journal for Research Analysis, Volume: VI, Issue : IV, April - 2017 17. Yilmazkuday, Hakan (2020), “COVID-19 Effects on the S&P 500 Index”, (May 5, 2020). Available at SSRN: https://ssrn.com/abstract=3555433 or
http://dx.doi.org/10.2139/ssrn.3555433

VOLUME NO. 10 (2020), ISSUE NO. 09 (SEPTEMBER) ISSN 2231-5756
INTERNATIONAL JOURNAL OF RESEARCH IN COMMERCE, IT & MANAGEMENT A Monthly Double-Blind Peer Reviewed (Refereed/Juried) Open Access International e-Journal - Included in the International Serial Directories
http://ijrcm.org.in/
23
REQUEST FOR FEEDBACK
Dear Readers At the very outset, International Journal of Research in Commerce, IT & Management (IJRCM) acknowledges & appreciates your efforts in showing interest in our present issue under your kind perusal. I would like to request you to supply your critical comments and suggestions about the material published in this issue, as well as on the journal as a whole, on our e-mail [email protected] for further improve-ments in the interest of research. If you have any queries, please feel free to contact us on our e-mail [email protected]. I am sure that your feedback and deliberations would make future issues better – a result of our joint effort. Looking forward to an appropriate consideration. With sincere regards Thanking you profoundly Academically yours Sd/- Co-ordinator
DISCLAIMER The information and opinions presented in the Journal reflect the views of the authors and not of the Journal or its Editorial Board or the Publishers/Editors. Publication does not constitute endorsement by the journal. Neither the Journal nor its publishers/Editors/Editorial Board nor anyone else involved in creating, producing or delivering the journal or the materials contained therein, assumes any liability or responsibility for the accuracy, completeness, or usefulness of any information provided in the journal, nor shall they be liable for any direct, indirect, incidental, special, consequential or punitive damages arising out of the use of infor-mation/material contained in the journal. The journal, neither its publishers/Editors/ Editorial Board, nor any other party involved in the preparation of material contained in the journal represents or warrants that the information contained herein is in every respect accurate or complete, and they are not responsible for any errors or omissions or for the results obtained from the use of such material. Readers are encouraged to confirm the information contained herein with other sources. The responsibility of the contents and the opinions expressed in this journal are exclusively of the author (s) concerned.

VOLUME NO. 10 (2020), ISSUE NO. 09 (SEPTEMBER) ISSN 2231-5756
INTERNATIONAL JOURNAL OF RESEARCH IN COMMERCE, IT & MANAGEMENT A Monthly Double-Blind Peer Reviewed (Refereed/Juried) Open Access International e-Journal - Included in the International Serial Directories
http://ijrcm.org.in/
IV