volume-targeted ventilation by martin keszler · volume-targeted ventilation: the long road to...
TRANSCRIPT
Volume-targeted ventilation: The long road to acceptance
Martin Keszler, MD, FAAP Professor of Pediatrics
Brown University Women and Infants Hospital
Providence, RI

Disclosure - Research Support:
• NIH (COBRE) • NICHD Neonatal Research Network • Draeger Medical (HFOV study) • Mallinckrodt, Inc. (iNO study)
- Speakers Honoraria: • Draeger Medical
- Other: • DSMB for Medipost America stem cell study • DSMB for Chiesi clinical trial

Alphabet Soup of Respiratory Support: State-of-the-Art 2018
BiPAP
? ??? PSV
??

Unique Challenges in NB Ventilation Children ≠ Small Adults!
Newborns ≠ Small Children! Transitional circulation Compliant chest wall, stiff lungs Unfavorable chest wall mechanics Limited muscle strength and endurance Immature respiratory control Rapid RR, short time constants Small trachea, high ETT resistance Uncuffed ETT Tidal volume measurement Awake, breathing patient
Need to understand the pathophysiology

A Act P
fl II
I I II t
. I • II
II ~ II
htl
l I f
htl Matthay MA and Zimmerman GA. 2005 Am J Respir Cell Mol Biol 33:319–327

Lung Injury: Strategies for Prevention
Optimal DR stabilization Avoidance of mechanical ventilation Surfactant replacement therapy Avoid excessive VT
Volume-targeted ventilation Optimize lung volume / avoid atelectasis Permissive hypercapnia/lower SPO2
High-frequency ventilation

The Pathogenesis of BPD
Fetal Lung Development
Postnatal Lung Growth and Development
Antenatal
Steroids
Postnatal
Steroids
Chorioamnionitis
Preterm Labor
Initiation
of air-
breathing
Mechanical
Ventilation Oxygen Infection
Cannalicular Stage
Saccular Stage Alveolar Stage
PDA
Pulmonary
outcome
Preterm
Delivery
Nutrition,
Fluid
intake
!!!
antioxidants,

Compliant chest wall Limited muscle strength
C-section/ absence of labor
Fluid filled lungs Respiratory depression
Limited ability to establish FRC

0::: LL
C 0
:.:; ~ ·5. (/) C ••
"'O C w
OPEEP
Effect of PEEP on
Rabbit Lung Aeration:
Phase contrast radiographs after
20 inflations. Siew, et al, JAP
2009

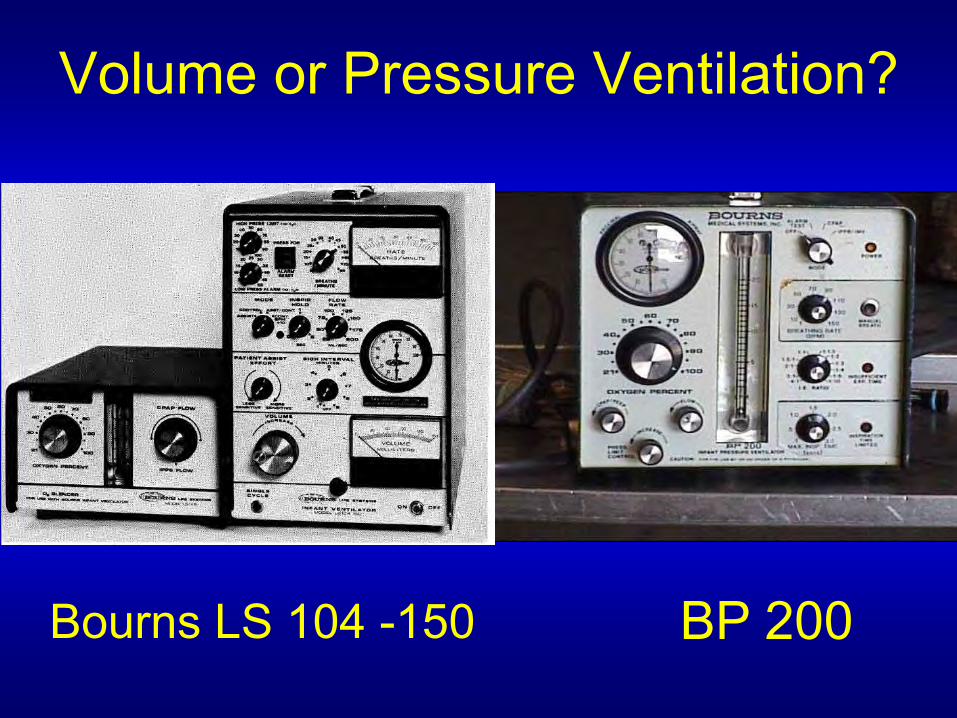
Volume or Pressure Ventilation?
Bourns LS 104 -150 BP 200

Pressure Ventilation- Controls the set pressure- Cycles when set time or flow is
reached- Volume depends on compliance
Volume vs. Pressure Ventilation Volume Ventilation
- Controls the set flow rate - Cycles when set volume is
delivered - Pressure rises passively

Volume Ventilation- Controls the set flow rate- Cycles when set volume is
delivered- Pressure rises passively
Volume vs. Pressure Ventilation Pressure Ventilation
- Controls the set pressure - Cycles when set time or flow is
reached - Volume depends on compliance
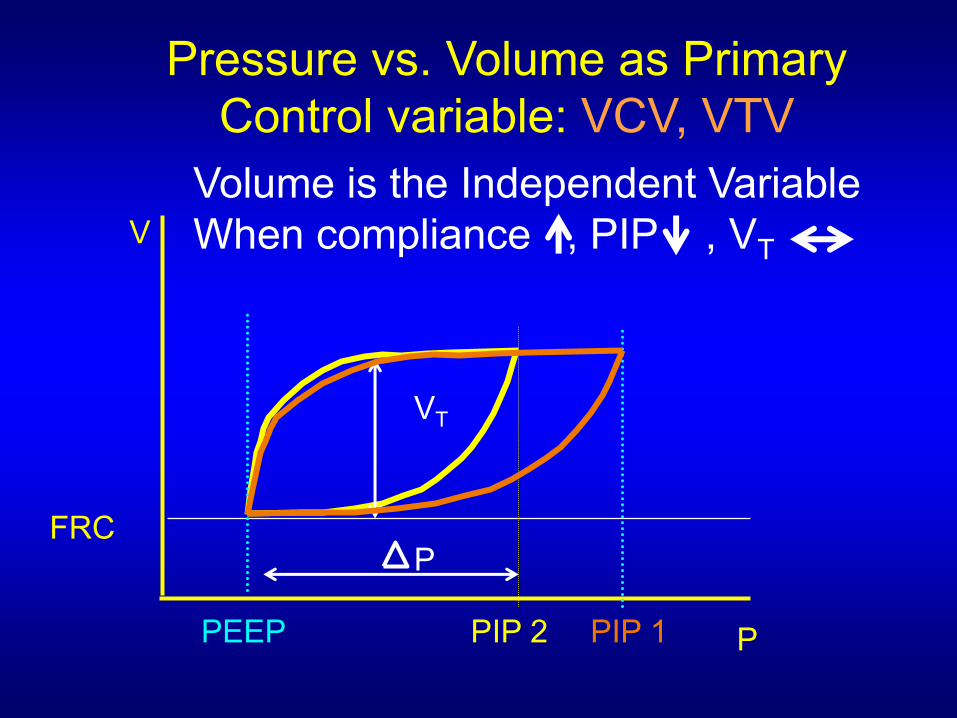
Pressure vs. Volume as Primary Control variable: VCV, VTV
Volume is the Independent Variable V When compliance , PIP , VT
VT
P FRC
PEEP PIP 2 PIP 1 P
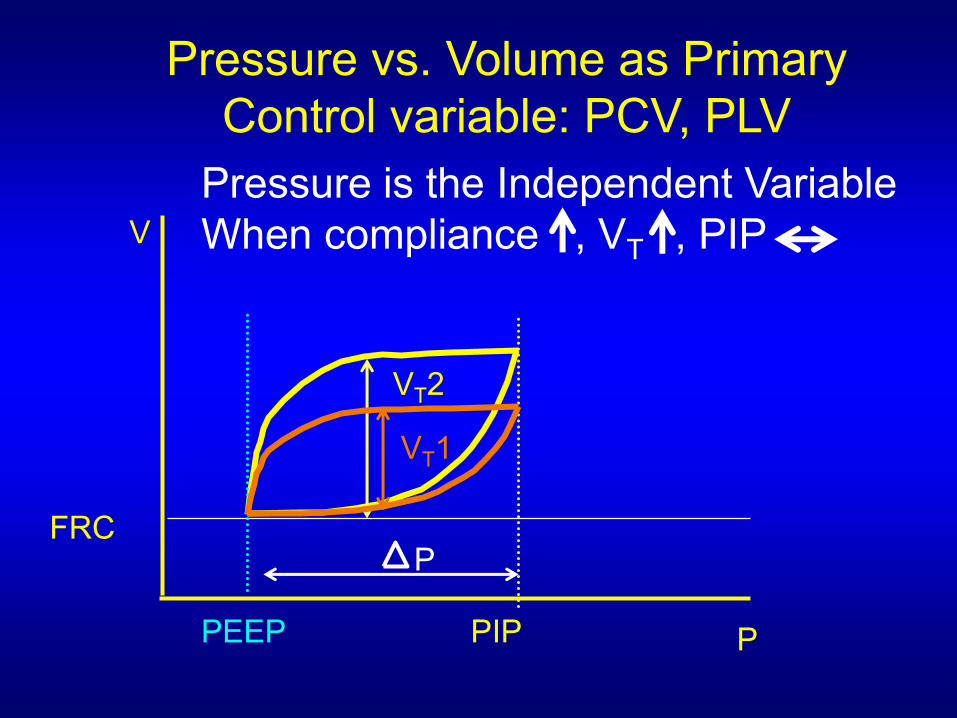
Pressure vs. Volume as Primary Control variable: PCV, PLV
Pressure is the Independent Variable V When compliance , VT , PIP
VT2
P
VT1
FRC
PEEP PIP P
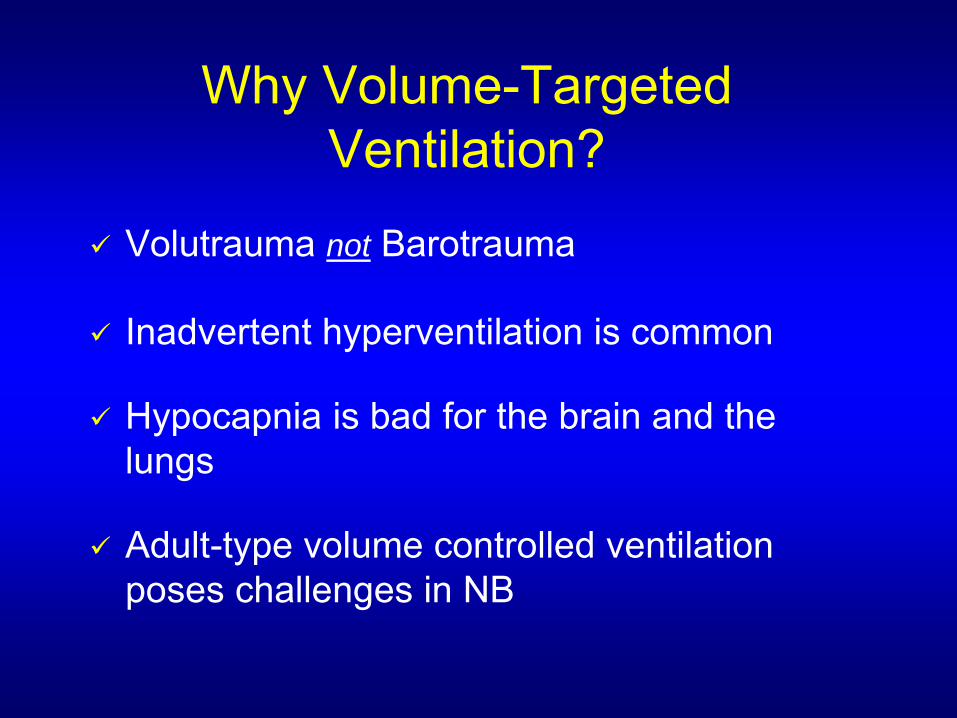
Why Volume-Targeted Ventilation?
Volutrauma not Barotrauma
Inadvertent hyperventilation is common
Hypocapnia is bad for the brain and the lungs
Adult-type volume controlled ventilation poses challenges in NB

Effect of Pressure v. Volume on Lung Injury Hernandez, et al, J Appl Physiol 1989
Capillary filtration coefficient: measure of acute lung injury

PIP is Excessive Relative to Compliance!
P
VT
FRC
E
I
!!
!

Ventilator-Induced Lung Injury: Volutrauma, not Barotrauma
Rodents ventilated Qwl/BW (mL/kg) * *
DLW/BW (g/kg) *
with 3 modes: 10 1.2 100 - High pressure
80(45 cm H2O), 8 0.9
high volume 606 - Low (negative) 0.6
pressure, high 404 volume
0.3 20- High pressure 2 (45 cm H2O), low
0 0volume (strapped 0
chest & abdomen)
Albumin space (%)
*P<0.01.
Dreyfuss D et al. Am Rev Respir Dis. 1988;137:1159-1164.
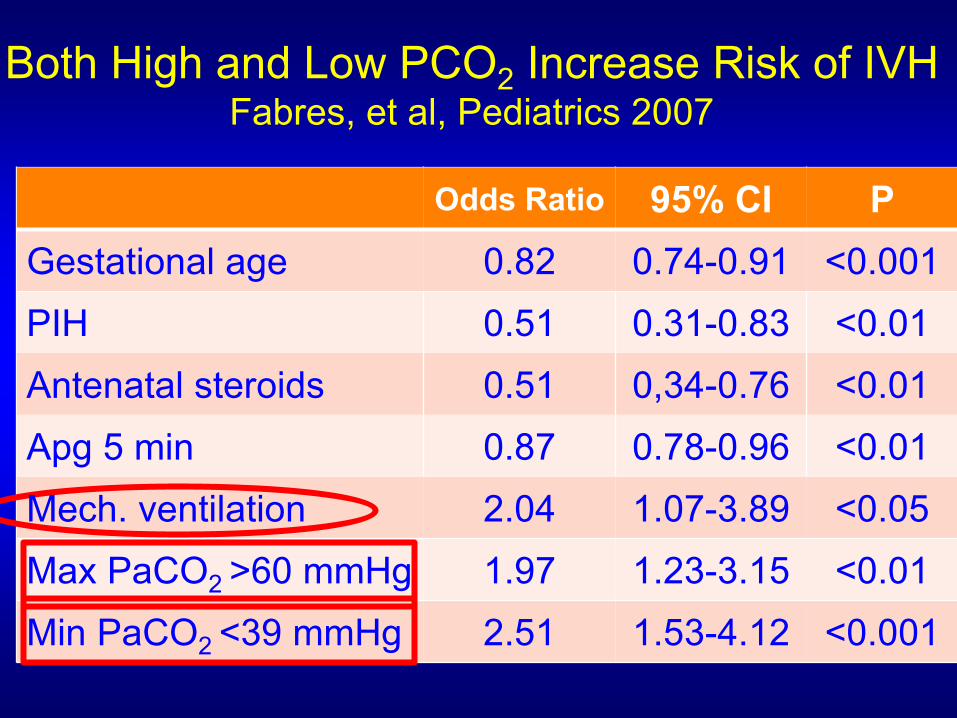
Both High and Low PCO2 Increase Risk of IVH Fabres, et al, Pediatrics 2007
Odds Ratio 95% CI P Gestational age 0.82 0.74-0.91 <0.001 PIH 0.51 0.31-0.83 <0.01
Antenatal steroids 0.51 0,34-0.76 <0.01 Apg 5 min 0.87 0.78-0.96 <0.01 Mech. ventilation 2.04 1.07-3.89 <0.05 Max PaCO2 >60 mmHg 1.97 1.23-3.15 <0.01 Min PaCO2 <39 mmHg 2.51 1.53-4.12 <0.001

V.
CRS
Limitations of Volume - Controlled Ventilation in Newborns
Tubing System and Humidifier
Respiratory System
1
Actual tidal volume is influenced by: 1) Ratio of circuit compliance to respiratory system compliance
Flow Sensor
C T Vent
V .
Humid
C RS
Leak
=VTLung VT set * CT1 + CRS
2) compressible volume of the circuit, including humidifier

Pressure-limited IMV
Continuous flow Continuous flow
Patient Patient
Spont. breath
Pressure limit Leak
PEEP valve
Expiratory phase Inflation

Relationship between lung volume and lung compliance
TLC
Normal FRC with optimal lung expansion, good
lung compliance
Low FRC due to atelectasis
Poor lung compliance, hypoxemia
A
B
V
O
L
U
M
E
DANGER!!!
P R E S S U R E

Volume “Guarantee” Principles of operation
The PIP (“working pressure”) is servo-regulated within preset limits (“pressure limit”) to achieve VT that is set by the user. Regulation of PIP is in response to exhaled VT to minimize artifact due to ETT leak. Breath terminates if 130% of TVT reached. Separate algorithm for spontaneous and machine breaths.
Pressure limit Working Pressure
VT = VT set by user

••••••••••••••••••••••••••••••••••••••••••••••••••••••••••••••••••••••••
- - - - - ~..,,,~-----,-
Pressure Limit
Working Pressure
PRESSURE
Target tidal volume
VOLUME

-
....
-0 I E (.) 0 -~ :c ro E 0.. ~
PSV+VG
q
Ii
0
I~ LO
5s
NAVA · capsule
~--apnoea apnoea apnoea
5s saturation - -- 30s -
VG vs. NAVA and Extreme Periodic Breathing
Owen, et al, ADC 2010

200 NAVA .
::, C'G ._, 100
<( w
0 40 ..--
0 ::t 5 20 .._.,
0 .-----------
Variability of support with NAVA
Sinderby et al, 2007

The benefits of VTV can not be realized without ensuring that the tidal volume is evenly distributed throughout an “open lung”!!!
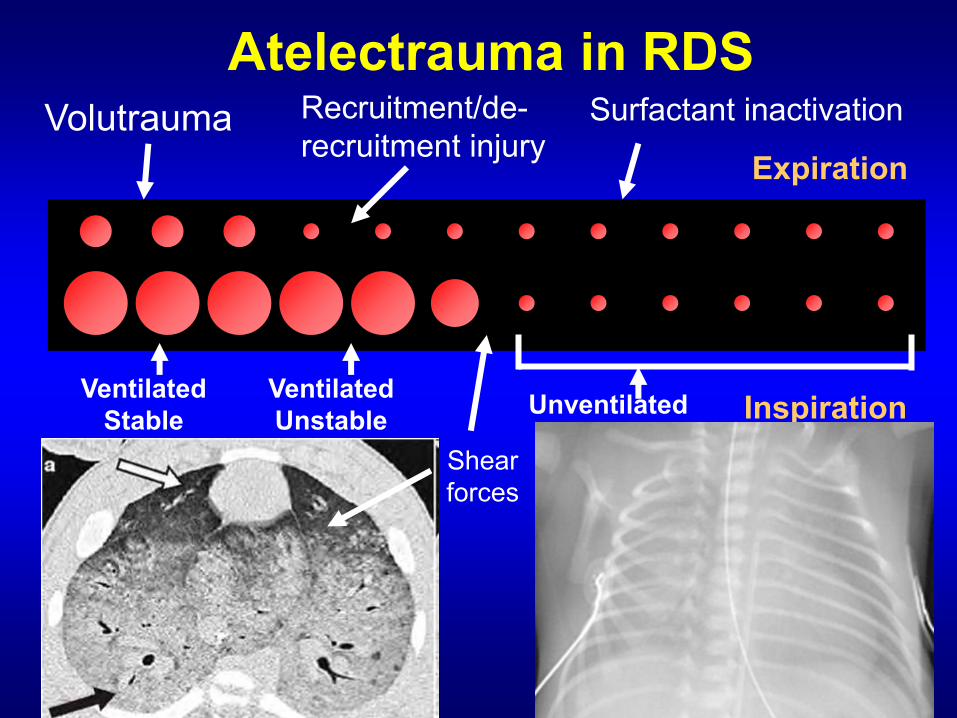
Atelectrauma in RDS
Recruitment/de- Surfactant inactivation Volutrauma recruitment injury
Expiration
Ventilated Ventilated Unventilated Inspiration Stable Unstable Shear forces

Adequate PIP, Adequate PEEP
Good oxygenation, low FiO2, minimal lung injury V
FRC
VT
P
CCP COP P CCP = critical closing pressure; COP = critical opening pressure

Lung volume recruitment
Alveolar Recruitment maneuver
Ventilation on the expiratory limb of the P-V loop, once recruitment occurs.

The high-tech, --~ high-risk drama of ~~ keeping the tiniest "';",..-babies alive ~, ·:.·
F'r;r;·. :.,a
I'
:,,;"·, . . _/_·· ~)._.·__--_. ...'
.~.: :-.
::"::
Jason Mich, WaldmannJr.,'W
weighed only : pounds at bi1

Benefits of VG Maintenance of (relatively) constant tidal
volumes Prevention of hypocapnia, overdistention and
volutrauma due to • Surfactant administration • Lung volume recruitment • Clearance of lung fluid
Automatic lowering of pressure support level during weaning
Compensation for variable respiratory drive • stabilization of tidal volume and minute ventilation due to changes of respiratory drive (periodic breathing)

PLV vs. VTV Meta-analysis Peng, et al, ADC-FNN 2014
Outcome No. of Studies
No. of Subjects
RR (95% CI) or Mean diff (95%CI)
Mortality 11 767 0.73 (0.51-1.05)
Any IVH 11 759 0.65 (0.42-0.99) * Grade 3-4 IVH 11 707 0.55 (0.39-0.79) * BPD @ 36 wks 9 596 0.61 (0.46-0.82) * Cystic PVL 7 531 0.33 (0.15-0.72) * Pneumothorax 8 595 0.46 (0.25-0.86) *
Failure of assigned mode 4 405 0.64 (0.43-0.94) *
Any hypocapnia 2 58 0.56 (0.33-0.96) *
Duration of suppl. O2 (d) 2 133 -1.68 (-2.5to-0.88)*

Cochrane Meta-analysis Klingenberg, et al 2017
Relative risk or Mean difference 95% CI NNTB
(95% CI)
Death or BPD@ 36 wk 0.75 0.53 - 1.07 NA
BPD @ 36 weeks PMA 0.73 0.59 - 0.89 8 (5-20)
Grade 3-4 IVH 0.53 0.37 - 0.77 11 (7-25)
PVL +/- severe IVH 0.47 0.27 - 0.80 11 (7-33)
Pneumothorax 0.52 0.31 - 0.87 20 (11-100)
Hypocapnia 0.49 0.33 - 0.72 3 (2-5)
Days of MV -1.35 -1.83 to -0.86
Sixteen parallel studies with 977 infants + four crossover studies

Barriers to acceptance
Inertia / fear of the unknown Rationalization: need more evidence Lack of understanding of
- Rationale - Functionality - Appropriate settings - Limitations - Leak tolerance

Q15: North East ...
Q15: Mid Atlantic ...
Q15: Great Lakes ...
Q15: t~orth Central ...
Q15: North west ...
Q15: South central ...
Q15: South East ...
Q15: South West ...
Q15:West( CA,AK,HI)
Q15:Canada
0%
Q3 How often you use volume-targeted ventilation ?
Answered: 347 Skipped: 3
10% 20% 30% 40% 50% 60% 70%
- Neve r - rare ly ( <1 5 % ) - Occas ionally ( 1 5-30 % of th e time )
- Oft en (3 1 -50% of th e tim e ) - Most of th e tim e (>50% )
80% 90% 100%
Gupta, et al, AJ Perinat 2018

14
12
- 10 E
~ 8 :J -0
> 6
4
2
0
-6- M a ur d msp1ratory Volum ~ - M asur d xpiratory Volum _.___ lnsp1ratory Leak Volume _,. _ Expiratory Lea Vo lume ~ Corre ed I me
20 40 0 80
Effect of Leak on VT measurement
Herber-Jonat, Ped Crit Care Med 2008

Leak Compensation
V . 6 ml
2 ml V . 3 ml
1 ml
Expiration Inspiration
Leak Compensated VT = VT in the lung
4 ml4 ml

VG-Clinical Caveats VG should be implemented immediately upon
initiation of mechanical ventilation. The initial target VT is 4 - 5 mL/kg during the acute
phase of the illness. Larger VT is needed in ELBW infants, those with
MAS and older infants with chronic lung disease! PIP limit should be set 25% above the PIP currently
needed to deliver the target VT and adjusted as needed.
pH, not PaCO2 drives respiration, look at pH! If the low VT alarm sounds repeatedly, increase the
pressure limit AND INVESTIGATE THE CAUSE

Question #1
Which of the following two infants needs a larger VT/kg for eucapnia?
1. 2400 g term infant with MAS, 1d old
2. 2400 g LPT infant with RDS, 1d old

MAS (n=28) Control (n=40) p value
VT (ml/kg) 6.11 + 1.05 4.86 + 0. 77 <0.0001 - -
MV (ml/kg/min) 371 ± 110 262 + 53 <0.0001 -
PaCO2(mmHg) 41.0 ± 3.9 41.5 + 3.12 0.55 -
VT in infants with MAS Sharma, et al, Am J Perinatol. 2015

e1gl t 3500 gra s eco 1 11111 ro e
VTV Survey Results
Question #2
Which of the following two infants needs a larger VT/kg for eucapnia?
1. 540 g preemie with RDS, 2 days old
2. 980 g preemie with RDS, 2 days old

da . o ld prete rm bab y . e igh ing 500 grams
LOO
VTV Survey Results

Relationship of Birth Weight and VT Montazami,et al, Ped Pulmonol 2009
3
3.5
4
4.5
5
5.5
6
6.5
0.3 0.4 0.5 0.6 0.7 0.8 0.9
Weight (kg)
VT
(m
l/k
g)
ELBW RLBW *
*RLBW = Ridiculously LBW
R= -0.563 p<0.001

Conventional Physiology Anatomical dead-space = 2mL/kg. Instrumental dead-space is fixed.
Anatomical + Instrumental dead-space = 3mL in a typical 1 kg infant
Anatomical + Instrumental dead-space = 2.5mL in a typical 0.5 kg infant
Alveolar ventilation = tidal volume – dead-space volume) x RR
VT = 5mL , DS=3mL VT = 4mL , DS=3mL VT = 3mL , DS=3mL
Alveolar ventilation = X Alveolar ventilation = 0.5 X
Alveolar ventilation = 0

(mmHg) ET CO2 Waveform
160 -.----------------11 120
1~ : =,-- --120
100
80
60
40
20
0
60 - --20- -· __ _ ._ __ _ ---------- - o.___..._ ...... ___ .___.. _ __.
I • CO2 (mmHg) I
1 3292 6583 9874 13165 16456 19747 23038 26329

050
100150200250300350400450500
DS + 2 DS+ 1 DS DS -0.5 DS - 1 DS -1.5
500 □
D 2.5 ETT O 3.0ETT D. 3.SETT
400
300
200
100
0 - ...................... - ........... --.--..................... - ........... --.--..................... --.--........... --.--...................... --.--........... --.--...................... -.....-........... --.--...................... --2 -1.5 -1 -0.5 0 0.5 1 1.5 2
Added Dead Space (mls) Tidal Volume (ml)
Seconds
Time to Eliminate CO2 from Test Lung 2.5 mm ETT, DS = 3.5 ml
Keszler, et al. ADC FN in print

Gas Flow Through Narrow ETT Fresh gas inflow spikes through DS gas
Mixing when flow abruptly stops
Exhaled gas spikes through mixed DS gas

Flow pattern matters!
VCV or VG with a slow rise time do not form a spike as effectively
Approximately 10-20% larger VT is needed to maintain same PCO2
Hurley, et al, ADC-FN 2016

Question #3
Which of the following two infants needs a larger VT/kg for eucapnia?
1. 650 g 24 week preemie on day 2 of life
2. 650 g 24 week preemie on day 21 of life

Relationship of Post-Natal Age and VT (mL/Kg)
Day 1-2 n = 251
Day 5-7 n = 185
Day 14-17 n = 216
Day 18-21 n = 176
VT (mL/kg) 5.15 + 0.6 5.24 + 0.7 5.63 + 1.0 6.07 + 1.4
PCO2 (torr) 44.0 + 5.4 46.3 + 5.2 53.9 + 7.3 53.9 + 6.2
Keszler et al, Arch Dis Child ‘09

VG Clinical Caveats: Weaning
Weaning occurs automatically (“self-weaning”) Set VT at low end of normal If VT is set too high the baby will not have a
respiratory drive and will not “self-wean”. If the VT is set too low, there will be excessive WOB ! Most infants can be extubated when:
VT is at or above the target value with working PIP is < 10-12 cm H2O
< 12-15 cm H2O in infants > 1 kg with FiO2 < 0.35 and good sustained respiratory effort.

TABLE 2 PTPdi Results According to VT Level
PTPdi, Mean+ SD, cm H2O .. s/min
Baseline 4 ml /kga 5 ml / kga
Overall 158 + 70b 174 + 5gc,d
TABLE 3 VTE, Inflation Time,, Peak lns,piratory Pre,ssure,, and
Minute Volume According to VT Le,vel
v·rE, mean + SD, ml/kg Inflation time, mean + SD, s Peak inspiratory pressure,
mean + SD, cm H20
4 ml/kga
5.1 + 1.3
0.24 + 0.09 10.8 + 3.6
Sml/k ·a
55.-+ QS' .. .. - !1!1 . ·.
+ Q,7-_-- !I! ' ·
12.0 + 3.3
65 + o- , __ . !I! ·· - -· !I •
0.29 + 0.07 13.4 + 3.7
Infant respiratory rate, C ........... __ 6~o~-, +.....:1~6 __ __:.5.:_5_+_r ~9 ___ 4~9 ____ +_7 __ - __ > mean + SD, breaths per
I
min
Work of Breathing @ Different VT target Patel, et al Pediatrics 2009

Take home message It’s time to embrace VTV
One size does NOT fit all !!
Optimize lung volume / avoid atelectasis
Start early
Verify appropriateness of settings
Re-evaluate strategy often
Use all available information (waveforms)
When all else fails, examine the patient!
