volume vi regional science inquiry regional … j dec... · science inquiry contribution by: 3 ......
TRANSCRIPT

ISSN: 1791-5961 Print
ISSN: 1791-7735 On line
English Edition
RSI J
FOUNDATION YEAR 2008
Dece
mb
er 2
01
4 V
olu
me V
I Nu
mb
er 2
Reg
ion
al S
cien
ce In
qu
iry
RegionalScienceInquiry
Volume VINumber 2
December 2014
Hellenic Association of Regional Scientists
THE JOURNAL OF THE
RegionalScienceInquiry
Contribution by:
3
Dr. ANNE MARGARIAN
Institute of Rural Studies, Federal Research Institute
for Rural Areas, Forestry and Fisheries,
Braunschweig, Germany
PROFESSOR AGLAIA ROBOCOU-KARAGIANNI
Department of Public Administration
Panteion University, Athens, Greece
Dr EVAGGELOS PANOU
Department of European International and Area Studies
School of Culture and International Communication
Studies, Panteion University of Social and Political
Sciences Athens, Athens, Greece
ASSOCIATE PROFESSOR OLGA GIOTI-PAPADAKI
School of Sciences of Economy and Public
Administration, Panteion University of Social and
Political Sciences Athens, Greece
RESEARSHER Dr NIKOLAOS KARACHALIS
Regional Development Institute
of Panteion University, Athens, Greece
ASSOCIATE PROFESSOR STEFANOS KARAGIANNIS
Department of Economic and Regional Development
School of Sciences of Economy and Public
Administration, Panteion University of Social and
Political Sciences Athens, Athens, Greece
ASSOCIATE PROFESSOR DARCIN AKIN
Department of City and Regional Planning
Gebze Institute of Technology, Gebze,Turkey
ASSOCIATE PROFESSOR JAN SUCHACEK
Department of Regional and Environmental Economics
Technical University of Ostrava, Ostrava,
Czech Republic
ASSOCIATE PROFESSOR MIHAIL XLETSOS
Department of Economic Sciences
University of Ioannina, Ioannina, Greece
ASSISTANT PROFESSOR ANASTASIA STRATIGEA
Department of Geography and Regional Planning
National Technical University of Athens, Athens
Greece
ASSOCIATE PROFESSOR ELIAS PLASKOVITIS
Department of Economic and Regional Development,
Panteion University, Athens, Greece
ASSOCIATE PROFESSOR HELEN THEODOROPOULOU
Department of Home Economics Ecology,
Harokopion University, Kallithea, Greece
PROFESSOR PANTELIS SKLIAS
Faculty of Social Sciences
University of Peloponnese, Korinthos, Greece
ASSISTANT PROFESSOR MARIUSZ SOKOLOWICZ
Department of Regional Economics and Environment
University of Lodz, Lodz, Poland
ASSISTANT PROFESSOR JOAO MARQUES
Department of Social and Political Sciences
University of Aveiro, Aveiro, Portugal
ASSOCIATE PROFESSOR GEORGIOS SIDIROPOULOS
Department of Geography University of the Aegean,
Mitilini, Greece
ASSOCIATE PROFESSOR ELENI PAPADOPOULOU
School of Urban-Regional Planning &
Development Engineering, Aristotle University
of Thessaloniki, Thessaloniki, Greece
PROFESSOR IOANNIS YFANTOPOULOS
Faculty of Political Science & Public
Administration National & Kapodistrian
University of Athens, Athens, Greece
ASSISTANT PROFESSOR GEORGIOS XANTHOS
Department of Sciences, Technological
Educational Institute of Crete, Heraklion, Greece
ASSOCIATE PROFESSOR EMMANUEL CHRISTOFAKIS
Department of Economic and Regional Development
School of Sciences of Economy and Public
Administration, Panteion University of Social and
Political Sciences, Athens, Greece
LECTURER MAARUF ALI
Department of Computer Science & Electronic
Engineering Oxford Brookes University,
Oxford, United Kingdom
ASSOCIATE PROFESSOR LABROS SDROLIAS
Department of Business Administration, School of
Business Administration and Economics, Technological
Education Institute of Thessaly, Larissa, Greece
LECTURER NETA ARSENI POLO
Department of Economics
University “Eqrem Cabej”, Gjirokaster, Albania
LECTURER ALEXANDROS MANDHLA
RAS Department of Economics, University
Of Surrey, United Kingdom
ASSISTANT PROFESSOR GEORGE P. MALINDRETOS
Harokopion University, Kallithea, Greece
RESEARCH FELLOW PARK JONG - SOON
Development Institute of Local Government
of South Korea, Jangan-gu, Suwon City, South Korea
RESEARCHER, Dr. Dr. AIKATERINI KOKKINOU
Department of Geography University the Aegean,
Mitiline, Greece
Dr STILIANOS ALEXIADIS
RSI Journal
Dr MICHAEL ALDERSON
Director Project Development
University of Szent Istvan, Budapest, Hungary
Dr PEDRO RAMOS
Facudade de Economia,Universidade
de Coimbra, Coimbra, Portugal
Dr NIKOLAOS HASANAGAS
Faculty of Forestry and Natural Environment, Aristotle
University of Thessaloniki, Thessaloniki, Greece
PROFESSOR IOANNIS MOURMOURIS
Department of International Economic Relations and
Development, Democritus University of Thrace,
Komotini, Greece
ASSISTANT PROFESSOR STELLA KYVELOU
Department of Economic and Regional Development
Panteion University, Athens, Greece
PROFESSOR LYDIA SAPOUNAKI – DRAKAKI
Department of Economic and Regional Development
Panteion University, Athens, Greece
ASSOCIATE PROFESSOR HIROYUKI SHIBUSAWA
Department of Architecture and Civil Engineering
Toyohashi University of Technology, Toyohashi, Japan
ASSISTANT PROFESSOR CHRISTOS STAIKOURAS
Department of Accounting and Finance, Athens
University of Economics and Business, Athens, Greece
ASSISTANT PROFESSOR ZACHAROULA
ANDREOPOULOU
Faculty of Forestry and Natural Environment, Aristotle
University of Thessaloniki, Thessaloniki, Greece
ASSISTANT PROFESSOR ALEXANDROS APOSTOLAKIS
Department of Sciences, Technological
Educational Institute of Crete, Heraklion, Greece
Dr PRODROMOS PRODROMIDIS
Centre for Planning and Economic Research and Athens
University of Economics and Business KEPE,
Athens, Greece
PROFESSOR MARIA BENETSANOPOULOU
Department of Public Administration
Panteion University, Athens, Greece
LECTURER VENI ARAKELIAN
Department of Economic and Regional
Development,Panteion University of Social
and Political Sciences, Athens, Greece
ASSOCIATE PROFESSOR VASSILIS KEFIS
Department of Public Administration
Panteion University, Athens, Greece
ASSISTANT PROFESSOR GEORGIA KAPLANOGLOU
Department of Economics
University of Athens, Athens, Greece
ASSISTANT PROFESSOR SELINI KATSAITI
Department of Economics and Finance
College of Business and Economics
United Arab Emirates University Al-Ain, UAE
Members
STAVROS RODOKANAKIS
Department of Social and Policy Sciences
University of Bath Clarerton Down,
Bath, United Kingdom
PROFESSOR PETROS KOTSIOPOULOS
Department of Senior Mathematics
Hellenic Air Force Academy, Dekelia, Greece
ASSOCIATE PROFESSOR GEORGE TSOBANOGLOU
Department of Sociology
University of the Aegean, Mitiline, Greece
PROFESSOR DIMITRIOS MAVRIDIS
Department of Technological Educational
Institute of Western Macedonia, Kozani, Greece
ASSOCIATE PROFESSOR ALBERT QARRI
Vlora University, Vlora, Albania
ASSOCIATE PROFESSOR GEORGE GANTZIAS
Department of Cultural Technology & Communication
University of the Aegean, Mitiline, Greece
LECTURER APOSTOLOS KIOXOS
Department of International and European Studies,
University of Macedonia, Thessaloniki, Greece
RESEARCHER Dr CARMEN BIZZARRI
Department of Human science
European University of Rome, Rome,Italy
LECTURER NIKOLAOS MPENOS
Department of Economic Sciences
University of Ioannina, Ioannina, Greece
PROFESSOR GEORGE POLICHRONOPOULOS
School of Business Administration and
Economics, Technological Educational Institute
of Athens, Athens, Greece
Dr MICHEL DUQUESNOY
Universidad de los Lagos, CEDER
Universidad Autónoma del Estado de Hidalgo,
ICSHu-AAHA, Chili
LECTURER ASPASIA EFTHIMIADOU
Master Program of Environmental Studies
Open University of Cyprus, Nicosia, Cyprus
ASSISTANT PROFESSOR ELECTRA PITOSKA
Technological Institute of Florina, Florina, Greece
ASSISTANT PROFESSOR THEODOROS IOSIFIDIS
Department of Geography
University of the Aegean, Mitilene, Greece
ASSISTANT PROFESSOR DIMITRIOS SKIADAS
Department of International and European Studies
University of Macedonia, Thessaloniki, Greece
ASSISTANT PROFESSOR GEORGIOS EXARCHOS
Technological Institute of Serres, Serres, Greece
LECTURER EVIS KUSHI
Faculty of Economy, University of Elbasan,
Elbasan, Albania
LECTURER ROSA AISA
Department of Economic Analysis
University of Zaragoza, Zaragoza, Spain
LECTURER MANTHOS DELIS
Faculty of Finance. City University London
London, United Kindgom
LECTURER ELENI GAKI
Department of Business Administration
University of the Aegean, Chios, Greece

4
ASSISTANT PROFESSOR AMALIA KOTSAKI
Department of Architectural Engineering
Technical University of Crete, Chania, Greece
Dr GEORGIOS-ALEXANDROS SGOUROS
National and Kapodistrian University of Athens,
Athens, Greece
Dr BULENT ACMA
Department of Economics, Anadolu University,
Unit of Southeastern Anatolia, Eskisehir, Turkey
Dr DRITA KRUIA
Faculty of Economics
Shkodra University, Shkodra, Albania
Dr LAMPROS PYRGIOTIS
RSI Journal
Dr KONSTANTINOS IKONOMOU
RSI Journal
Dr KATERINA PARPAIRI
RSI Journal
Dr KHACHATRYAN NUNE
Head of the scientific research unit
University of Hohenheim, Stuttgart, Germany
Dr ANDREW FIELDSEND
Research Institut of Agriculture Economics,
Budapest, Hungary
Dr CRISTINA LINCARU
National Scientific Research Institut
for Labor and Social Protection,
Bucharest, Romania
Dr FUNDA YIRMIBESOGLU
Istanbul Technical University, Faculty of Architecture
Office Istanbul, Istanbul, Turkey
PROFESSOR MAHAMMAD REZA POURMOHAMMADI
Department of Geography,
University of Tabriz, Iran
ASSISTANT PROFESSOR POLYXENI PAPADAKI
Department of Public Administration
Panteion University, Athens, Greece
Critical Surveys Editors
Lecturer Aspasia Efthimiadou, Dr Sotirios Milionis,
Dr Georgios-Alexandros Sgouros, Dr Stavros
Ntegiannakis, Dr Anastasia Biska, Dr Christos
Genitsaropoulos, Dr Loukas Tzachilas
Book Review Editors
Dr Dr Katerina Kokkinou, Dr Stilianos Alexiadis, Dr
Elias Grammatikogiannis, Dr Maria Mavragani,
Dimitrios Kouzas, Vilelmini Psarrianou, Antonia
Obaintou, Helga Stefansson, Dr Nikolaos Hasanagas,
Maria karagianni, Georgia Chronopoulou
Copy Editors
Professor Georgios Korres, Assistant Professor
Panagiotis Krimpas, Dr Stylianos Alexiadis, Dimitirios
Kouzas, Antonia Obaintou
Publisher-Manager
Dr Christos Ap. Ladias
---------------------------------------------
Κείμενα Περιφερειακής Επιστήμης
(Kimena Periferiakis Epistimis)
Managing Editor
Professor Georgios Korres
Hon. Managing Editor
Hon Professor Nikolaos Konsolas
Copy Editor
Dr Dr Aikaterini Kokkinou
Editorial Assistant
Associate Professor Stefanos Karagiannis
Publisher-Manager
Dr Christos Ap. Ladias
Members
Lecturer Fotis Kitsios, Assistant Professor Eleni
Papadopoulou, Vilelmini Psarrianou
--------------------------------------------
Investigación en Ciencia Regional
Managing Editor
Lecturer Nela Filimon
Hon. Managing Editor
Professor José Vargas-Hernández
Copy Editor
Lecturer Konstantina Zerva
Editorial Assistant
Professor Cristiano Cechela
Publisher-Manager
Dr Christos Ap. Ladias
Members
Professor Ana Cristina Limongi Franca, Associate
Professor Francisco Diniz, Assistant Professor Eloína
Maria Ávila Monteiro, Dr Michel Duquesnoy
--------------------------------------------
Zeitschrift für die Regionale
Wissenschaft
Managing Editor
Associate Professor Trifonas Kostopoulos
Hon. Managing Editor
Professor Rudiger Hamm
Copy Editor
Assistant Professor Panagiotis Kribas
Editorial Assistant
Associate Professor Stefanos Karagiannis
Publisher-Manager
Dr Christos Ap. Ladias
Members
Dr Khachatryan Nune, Dr Nikolaos Chasanagas,
Dr Anne Margarian,, Dr Lambros Sdrolias
--------------------------------------------
Géographies, Géopolitiques et
Géostratégies Régionales
Managing Editor
Professor Ioannis Mazis
Hon. Managing Editor
Professor Charilaos Kephaliakos
Copy Editor
Vilelmini Psarrianou
Editorial Assistant
Dimitrios K. Kouzas
Publisher-Manager
Dr Christos Ap. Ladias
Members
Professor Grigorios Tsaltas, Professor Lydia Sapounaki-
Drakaki, Associate Professor Olga Gioti-Papadaki, Dr
Maria-Luisa Moatsou
----------------------------------------------

Regional Science Inquiry, Vol. VI, (2), 2014
5
Contents Page
Editorial
7
Articles
1 Distribution About Regional Disparities Of The Us Labor Market: Statistical
Analysis Of Geographic Agglomeration By Employment Status, Tsunetada Hirobe
11
2 Potential Of Earnings In Network Marketing And Some Factors Influencing
Commissions Rates: Evidence From Bulgaria, Valentina G. Makni
23
3 Optimization Of Deterministic Population Dynamics Models, Michaela
Benešová
33
4 Spanish And Portuguese Hotel Networks In Brazil, Evidence From The
Northern Coast Of Bahia, Lirandina Gomes, Joaquim Ramos Silva
39
5 Involving Stakeholders In Forest Management: The Case Of Montemuro
Mountain Site, Alexandra Marta-Costa, Rui Pinto, Filipa Torres Manso, Manuel
Luís Tibério, Inês Carneiro, José Portela
57
6 The Relationship Between HDI And Its Indicators With Regional Growth In
Iranian Provinces, Mohammad Reza Pourmohammadi, Mojtaba Valibeigi,Mir
Sattar Sadrmousavi
73
7 Employment And Human Capital In The Greek Hotel Industry, Efstathios
Velissariou, Christos Amiradis
87
8 The Psychological And Symbolic Factor Of Great Britain's Geostrategy In The
Cyprus-Suez Issue, Professor Ioannis Th. Mazis
99
Announcements, Conferences, News
119
Academic profiles
123
Book reviews
127
Author Instructions
131
The articles published in RSI Journal are in accordance with the approving dates by the anonymous
reviewers.

Regional Science Inquiry, Vol. VI, (2), 2014 6

Regional Science Inquiry, Vol. VI, (2), 2014
7
Regional Science Inquiry, Vol. VI, (2), 2014
Editorial Note
Policy planning and objectives
Economic policy is the deliberate attempt to generate increases in economic welfare.
Today, under the midst of the current economic and financial crisis, economies have
recognised that there is a role for policy planning, in order to steer, either a local, regional or
national economy towards increased economic and social welfare. Following modern policy
approaches, this issue hosts eight articles, each one of which focuses on current policies
towards these goals and objectives, falling into broad groups of independence objectives,
economic efficiency objectives, resource conservation objectives, as well as social and
economic stability objectives, in order to gain a substantial knowledge of the relative
importance of each of these objectives.
Articles
The first article, titled: ‘Distribution About Regional Disparities Of The US Labor Market:
Statistical Analysis Of Geographic Agglomeration By Employment Status’, by Tsunetada
Hirobe, analyzes the regional disparities brought by each employment status, especially
focusing on the regional agglomeration. Specifically, it investigates the characteristics of
spatial autocorrelations or geographical clusters based on the statistics of the regional
specialization, as well as the degree of agglomeration based on each specialization state and
the relationship between the geographical clustering process and the equilibrium or
disequilibrium phenomenon based on the regional specialization of the labor force.
The second article, titled: ‘Potential Of Earnings In Network Marketing And Some Factors
Influencing Commissions Rates: Evidence From Bulgaria’, by Valentina G. Makni, provides
some evidence for the potential of network marketing in Bulgaria and explores which factors
influence the commission earnings. For this purpose correlation analysis has been used to
prove statistical dependencies taking into account the derived L-distribution of
representative’s income.
The third article, titled: ‘Optimization Of Deterministic Population Dynamics Models’, by
Michaela Benešova, applies methods from optimal control theory to the mathematical
modelling of biological pest control and formulates a pest control strategy for nonlinear
Kolmogorov system of n interacting populations by introducing natural enemies as a control
function.
The fourth article, titled: ‘Spanish And Portuguese Hotel Networks In Brazil, Evidence
From The Northern Coast Of Bahia’, by Lirandina Gomes, and Joaquim Ramos Silva,
analyzes the experience of Portuguese and Spanish hotel networks in Brazil, specifically on
the Northern Coast of Bahia. The paper looks at this process over the period when Brazil was
opening up to international tourism corporations through promotion of national and regional
policies.
The fifth article, titled: ‘Involving Stakeholders In Forest Management: The Case Of
Montemuro Mountain Site’, by Alexandra Marta-Costa, Rui Pinto, Filipa Torres Manso,
Manuel Luis Tiberio, Ines Carneiro, and Jose Portela, focuses on the Natura 2000 Montemuro
Mountain Site by looking at a set of interviews conducted to several entities with ties to the
forest sector in that territory, identifying their perception as regards the forest in Montemuro
Mountain. Results show both the lack of participation and communication among the various
stakeholders and the absenteeism of many forest owners as important factors conditioning
forest management.
The sixth article, titled: ‘The Relationship Between Hdi And Its Indicators With Regional
Growth In Iranian Provinces’, by Mohammad Reza Pourmohammadi, Mojtaba Valibeigi, and
Mir Sattar Sadrmousavi, investigates relations between human development and economic
growth, with a view to identifying major policies and prioritizing of them across Iranian
provinces. The findings suggest that although still inequality remains but the quality of life

Regional Science Inquiry, Vol. VI, (2), 2014 8
also has risen and these improvements seems have significant impact on long term economic
growth.
The seventh article, titled: ‘Employment And Human Capital In The Greek Hotel
Industry’, by Efstathios Velissariou and Christos Amiradis, presents and compares studies
and statistical data related to employment and the human capital in the hotel industry in
Greece. The paper concludes with proposals regarding the employment of personnel in the
Greek hotel industry.
The eighth article, titled: ‘The Psychological And Symbolic Factor Of Great Britain's
Geostrategy In The Cyprus-Suez Issue’, by Professor Ioannis Th. Mazis, argues that, since
Cyprus came under the British rule and for at least seven decades, Britain did not consider
Cyprus a “territory of major strategic importance for the Crown”. It also argues that the policy
makers of colonial Britain probably considered this island one of the “poor colonies”, since it
did not have raw material deposits or any kind of industrial infrastructure. Thus, the paper
suggest that Greek researchers should examine how Great Britain was perceiving the strategic
importance of Cyprus until the end of World War II and, therefore, should not insist on
blaming the Greek side that, supposedly, did not take into account Britain’s sensitivity and
“unwisely sought the Union (Enosis) of Cyprus with Greece, which annoyed Britain and led
to the well-known traumatic events”.
This journal issue also concludes with important announcements, Conferences, News, as
well as presenting distinguished academic profiles and book reviews.
With our thanks to the issue authors,
the members of the editorial board,
as well as to our reading public,
Dr. Dr. Aikaterini Kokkinou, RSI J

Regional Science Inquiry, Vol. VI, (2), 2014
9
Articles

Regional Science Inquiry, Vol. VI, (2), 2014 10
Hirobe T., Regional Science Inquiry, Vol. VI, (2), 2014, pp. 11-21
11
DISTRIBUTION ABOUT REGIONAL DISPARITIES OF THE US LABOR
MARKET: STATISTICAL ANALYSIS OF GEOGRAPHIC
AGGLOMERATION BY EMPLOYMENT STATUS
Tsunetada HIROBE Department of Economics, Meikai University, 1 Akemi, Urayasu, Chiba 279-8550, Japan
Abstract
The paper analyzes the regional disparities brought by each employment status concerning
the civilian noninstitutional population 16 years of age and over especially focusing on the
regional agglomeration. Specifically, it investigates the characteristics of spatial
autocorrelations or geographical clusters based on the statistics of the regional specialization.
Thus it definitely investigates the degree of agglomeration based on each specialization state,
not the original data from the statistics of each labor category such as the number of the
unemployed persons or the simple unemployment rates. The method is based on the share and
rate calculations which would be almost equivalent to the well-known Location Quotient
technique. With respect to the geographical agglomeration, some interesting regional
characteristics of the working population have been found by mainly an exploratory way.
From some results, several states such as North Dakota, South Dakota, and Nebraska indicate
specific regional features which are very different from the other states, and those features
often have a surprisingly persistent trend. Usually the influence of the significant
socioeconomic shocks is exchanged or is absorbed in some specifically related regions. Then
it spreads around and disperses to further distant areas during a sufficient amount of time, and
finally its geographical distribution map is properly modified or changed. In addition, some
results suggest the significant relationship between the geographical clustering process and
the equilibrium or disequilibrium phenomenon based on the regional specialization of the
labor force; it also suggests an important relevance to the existing economic theories.
Keywords: regional disparities, regional specialization, spatial dependence and
agglomeration
JEL classification: J20, J21, R12, R23
1. Introduction
1.1. Theoretical background about regional disparities of unemployment・
The study of regional changes of the labor market is one of the most fundamental topics in
all regional studies including regional science, and other related fields. In particular, regional
disparities with respect to unemployment issues have been a popular research theme since
1960s. The remarkable achievement of this subject in the early days is by Thirlwall (1966),
and afterwards Brechling (1967), Gordon (1979, 1980, 1985), Elias (1978, 1979, 1980), Bell
(1981), Marston (1985), and other numerous studies followed. With respect to theoretical
standpoints on the issues of unemployment rates, the “equilibrium theory” and the
“disequilibrium theory” are well known: They argue about whether the values of regional
unemployment data ultimately converge to a certain equilibrium point or not (Marston 1985,
and others). Usually equilibrium theorists have a theoretical scenario: After big shocks of
business fluctuations, the substantial effects by them would remain for a considerably long
period and spread widely throughout regions (Blackley 1989; Veder and Gallaway 1996;
Aragon et al. 2003, and others). This remaining ripple effect is a cause of areal persistence of
unemployment rates, and it induces a specific rate sometimes called the natural ratio of
unemployment which would be a targeting equilibrium point. Most of the existing literature
of local unemployment disparities is based on the hypothesis of a stable equilibrium of labor
markets (Cracolici and Nijkamp 2007). On the other hand, based on the fact that the
Hirobe T., Regional Science Inquiry, Vol. VI, (2), 2014, pp. 11-21 12
differentials of the rates tend to be lost during a certain suitable time, the disequilibrium
approach generally assumes a relatively short period. In that sense, this theory is built on the
thought that the levels of unemployment rates are always variable and moving, and they never
converge on a specific rate in nature.
There are several reasons why disequilibrium phenomena occur. As an example, the speed
of adjustment for relieving the fluctuation of unemployment rates is a key role. Any failure or
collapse of this process would cause a serious problem such as high unemployment rates
and/or low economic growth in many areas. Aragon et al. (2003) indicated that there were
four factors that significantly influence and/or even dominate the spatial patterns of
unemployment; those are migrations, labor force participation, business locations, and wages.
Of course, although there are many other factors that would affect regional structures of
unemployment, these four elements are essential, and particularly the first two also directly
influence the changes of the working-age population. However, in the real world, it is difficult
to identify the equilibrium or disequilibrium state accurately since the labor environment of
each region is always changing and thus the actual condition of unemployment is also
fluctuating. Then as an alternative idea, the existence of multiple equilibrium points was
suggested by Fujita, Krugman, and Venables (1999); it claims that such equilibrium or
disequilibrium is tentative or local one, not global one, thus the idea seems to be quite a
natural solution of this argument.
1.2. Research motive
Although many achievements for regional disparities of unemployment based on
especially economics or related approaches have been already done as mentioned above,
however, the further geographical studies such as spatial patterns and dependency by multi-
disciplinary perspectives are few. Most previous work is on macroscopic or even abstract
viewpoints. To fill such gaps, thus the approach used in this paper depends on more
microscopic approach by region, and it would have more geographical aspects based on
demographics than the existing literature.
In addition, the paper treats not only the phenomena of unemployment but also the
phenomena derived from the entire labor structure of the civilian non-institutional population
16 years of age and over. It is very important to analyze such dynamic mechanism to identify
the regional disparities of the entire structure of the labor market. Also the approach of this
paper is able to give further comprehensive explanations of the changes of the labor force
state by region since the method directly using the share ratios of employment statuses instead
of unemployment rates is much effective for the multi-faceted treatment of mutual
comparisons of the data about population. Thus from that point of view, one of the aims of the
paper is to characterize the agglomeration process of the regional specialization of the
unemployed persons compared with the other categories including the employed persons.
However, unfortunately the work based on such approach is hardly known so far. Therefore it
would be able to suggest a new direction to this field.
In addition, the previous work which investigated the regional agglomeration tendency
about specialization areas of the working population classified by the status categories is also
hardly known. Actually the analysis of spatial agglomeration based on the regional
specialization is definitely necessary to identify the geographical distribution state of such
specialization areas and especially the spatial clustering process.
In order to draw a right knowledge and conclusion as exact as possible, many kinds of
statistics and indicators are used by combining them each other. The paper is structured as
follows: The next Section 2 presents about the methods and data. Section 3 shows the main
results accompanied by some brief explanations of LISA and so on for evaluating spatial
dependency and agglomeration. Finally some concluding remarks and a brief discussion are
made in Section 4.

Hirobe T., Regional Science Inquiry, Vol. VI, (2), 2014, pp. 11-21
13
2. Methods and data
2.1. Methodology
One of the most commonly used measures of specialization is the Location Quotient (Billings and Johnson 2012). It has been used for the data of various regional studies to analyze the degree of concentration regarding the economic or geographical matters since the study of the measurement of industrial localization (Hoover 1936). Thereafter, for example, the employment Location Quotient (Hoover-Balassa coefficient), or the standardized location quotient (O’Donoghue and Gleave 2004) was introduced as a further improved version. Thus that technique generally has high flexibility to the applications of many research areas. The method used here is generally called the rate-share analysis which would derive from this well-known Location Quotient technique. That was firstly advocated by J. Takahashi, and has been already used for over a couple of decades at the fields of regional science, civil engineering, regional planning, management science, and others especially in Japan. The main principles of the rate-share analysis are based on the share rate calculations of each row and column as shown on the table below. The first step is to compute the share-ratio of each target category; for instance, “New York” as the region item, or “Employed” as the sector item against the total sum of each row and column. IAS (index of areal specialization) used here is important to investigate the degree of areal specialization of each region in each sector; that is essentially based on the same technique as the Location Quotient. In addition, IAG (index of areal gain) is the simple ratio of any two estimated IAS values. Clearly this method is for showing share rates and their growth rates. Thus the rate–share analysis would be considered as an application of the traditional Location Quotient.
On one hand, although sometimes the Herfindahl-Hirschman Index is used for measuring regional specialization, however, it is originally for a tool to determine whether a monopoly exists, not for a tool to detect regional specialization from a geographical view point. Similarly the Krugman Index and many other related indices are not necessarily fit for some specific geographical analysis. In that sense, using the applied location quotient technique is generally considered to be more natural way to evaluate the geographic characteristics of regional specialization than the above indices. As an example, Goschin et al. (2009) introduced the “coefficient of absolute structural changes” to measure the change of the regional shares between any two different periods of time. However, the above-mentioned IAG is much simpler than that. Also it is able to evaluate appropriately the changes of the regional specialization since much more direct statistical interpretation is possible. For more details, see Ishii et al (2002), Billings and Johnson (2012), or other related references.
Table 1. Data matrix for region and sector.
1 2 3 j m Total for Regions
X 11 X 12 X 13 X 1j X 1m X
X 21 X 22 X 23 X 2j X 2m X 2
X 31 X 32 X 33 X 3j X 3m X 3
X i1 X i2 X i3 X ij X im X
X n1 X n2 X n3 X nj X nm X
X 1 X 2 X 3 X j X m XTotal for Sectors
i
n
Region Sector
1
2
3
.,,3,2,1,,,3,2,1,,,1
.1 1 1
..... mjniXXXXXXXn
ii
m
j
n
i
m
jjijjiji
The calculation formulas and definitions of IAS and IAG are the following:

Hirobe T., Regional Science Inquiry, Vol. VI, (2), 2014, pp. 11-21 14
(1)...
.
XX
XXIAS
j
iij
ij ・
where IASij is the index of areal specialization of region i and sector j.
(2), at time: , at time : tstIASIASsIASIASIAS
IASIAG ij
t
ijij
s
ijs
ij
t
ijstij ・
where IASijst
is the index of areal gain of region i and sector j between time s and t.
The origin on the coordinate axis of IAS and IAG is (1, 1). If the value of IAS is greater
than 1, it indicates the tendency of specialization. Similarly, if the value of IAG is greater than
1, it indicates the target category tends to increase. If the share rate of region i and sector j is
equal to that of the entire regions and sector j, then the value of IAS is exactly 1. From the
above equation of (2), the value of IAG becomes 1 when the two estimated values of IAS are
exactly the same. The data points of IAS and IAG are divided into the four quadrants on a
mathematical x-y plot:
・ The first quadrant: the high values of IAS and the high values of IAG.
・ The second quadrant: the low values of IAS and the high values of IAG.
・ The third quadrant: the low values of IAS and the low values of IAG.
・ The fourth quadrant: the high values of IAS and the low values of IAG.
To investigate the degree of the disparities specifically, some indices are introduced
here. Based on the statistics of the rate-share analysis, RDC (Rate of divergence from the
center) is a combined index for measuring the degree of the static and dynamic disparities
between different two time periods, and it is defined as the following formulas:
(3)100×1)-( = ・ IASADCas
where ADCas represents the average divergence from the center regarding IAS.
(4)100×1)-( = ・ IAGADCag
where ADCag represents the average divergence from the center regarding IAG.
(5)100)1()1( = ・ 22 IAGIASRDC
where RDC represents the rate of divergence from the center.
2.2. Data and notes
The used data and the conditions are as follows: All analyses, used definitions and
calculations are based on the labor statistics and the related reference literature from the US
National Census 1991-2011 (see the References of the end of the paper for details). The entire
population here corresponds to CNIP (Civilian Non-Institutional Population 16 years of age
and over), and is divided into three categories: Employed (Employed persons), Unemployed
(Unemployed persons), and Others (Out of Labor Force). Thus the number of CLF (Civilian
Labor Force) is the sum of the numbers of Employed plus Unemployed. Also the number of
CNIP is equal to the sum of the numbers of CLF plus Others.
Finally some frequently used abbreviations are listed up for convenience’ sake:
IASER (IAS statistics of Employed), IASUR (IAS statistics of Unemployed), IASOR
(IAS statistics of Others), RDCER (RDC statistics of Employed), RDCUR (RDC statistics of
Unemployed), RDCOR (RDC statistics of Others), LM, LG (Local Moran’s I statistics, Local
G* (Getis’ Gi
*) statistics), IASURAVGLG (LG based on the averages of IASUR),
IASURSDLG (LG based on the standard deviations of IASUR), and so forth.
For general reference literature for example, see Rogerson and Yamada (2009) for
detailed formulas and definitions of statistics and indicators with respect to spatial
dependence and agglomeration.

Hirobe T., Regional Science Inquiry, Vol. VI, (2), 2014, pp. 11-21
15
3. Results
3.1. Spatial dependence and agglomeration
Moran’s I statistic Moran’s I static is an analogy of the well-known Pearson product-moment correlation
coefficient. That is one of the global statistics, and studies the degree of any spatial dependence or agglomeration, which is calculated by the formula below:
(6)2n
ii
n
i
n
jjiij
n
i
n
jij xx
xxxxw
w
nI
where n is the total number of regions, wij is the spatial weights for the regions i and j, xij is the observed data based on the regions i and j, and ij denotes the average of xij. In general, Moran’s I value near +1 implies the state of clustering, and the one near -1 shows the state of dispersion. On the other hand, the value nearby 0 implies a kind of random state.
Local Moran’s I statistic Local Moran’s I statistic is one of the local statistics, generally called as LISA (Local
Indicators of Spatial Association), and is a local area version of Global Moran’s I statistic: That means the values of Local Moran’s I statistics are actually equivalent to the decomposition of the value of the corresponding Moran’s I statistic. The formula for Local Moran’s I statistic is given as
)7(.2
1
n
ii
n
ijj
jjiji
xx
xxxxwxxn
iI
Moran scatter plot Moran scatter plot depicts the distribution of the coordinate points of which x-axis is for
Local Moran’s Ii values, and y-axis is for the data of any observed variable. The interpretations for the four quadrants on Moran scatter plots are the following:
The first quadrant: the data and their neighborhood both tend to have high values. The second quadrant: the data tend to have lower values than their neighborhood’s
values. The third quadrant: the data and their neighborhood both tend to have low values. The fourth quadrant: the data tend to have higher values than their neighborhood’s
values. Local G* (Getis’ Gi*) statistic Local G* statistic is also a Local statistic called LISA. The calculation formula is given by
)8(1/
)(*
2**1
*
nWSns
xWxdw
iiii
n
jijij
dG
where s is the sample standard deviation of variable xi (i=1, , n), wij (d) is the spatial weight which has the distance d from the observed points i and j, Wi
*= wij (d) and S1i*= {wij (d)}2.
High positive values of Local G* imply the clustering of high values, and the case of low values similarly indicates the clustering of low values.
As described above, we use several kinds of LISA statistics such as Local Moran and Local G* (Getis’ Gi
*) statistics to strictly check the degree of agglomeration and geographic concentration by region. For example, GIS maps, on which several statistics are overlaid, can derive relatively exact results for investigating the complicated phenomenon. It is also the same for the other graphics.
The following figures show some features of the Moran’s I statistics from 1991 to 2011.

Hirobe T., Regional Science Inquiry, Vol. VI, (2), 2014, pp. 11-21 16
Figure 1. Moran’s I statistics: (a) Value, (b) Variance.
From the outcome of variances, the Moran’s I statistics of each employment status remain
a comparatively narrow range and stay calm throughout the entire periods, which indicate
some sort of stability of spatial dependence. The Moran’s I statistics of Employed and Others
constantly tend to increase from 1991 to 2011.
On the contrary, Unemployed, which hardly reacts to any change caused by Employed or
Others, sometimes has experienced sharp fluctuations during the above period. In fact, the
results of the randomized Moran’s I tests around 1993, 1996, and 2002-2007 can not reject
the null hypotheses by the significance level of 5%. On the other hand, regarding Employed
and Others, there are no cases rejecting the null hypotheses even by the 5% level tests through
the whole period. Thus, obviously there would be some essential changes of the regional
characteristics of Unemployed from particularly the years of 2002 to 2007 plus the cases of
1993 and 1996. It implies that some causes weaken the process of clustering and strengthen
the tendency of regional dispersion.
Figure 2. Spatial patterns in agglomeration process.
A B C D
As typical geographic surface patterns depicted by Moran’s I statistics, the above stage A
is a spatial pattern of considerably high agglomeration status, B or C is a middle stage which
may imply moderate or slight correlation, and D is the perfect dispersion state. Just 2002
through 2007 would correspond to the period of the radical changes passing through such
transition stages. That mechanism also would indicate the dissolution and reconstruction
process of such geographical agglomeration system in a specific employment status such as
jobless people. Generally working people tend to move to any region which has high
economic power and many financial benefits. That is because such city provides more
chances to get high salary jobs with various high-value-added amenities. Usually those many
attractions in cities induce incentives to accelerate migrations and further changes the
distribution of the working population. However it usually takes a sufficient amount of time
and effort for changing regional characteristics or labor habits. That is one of the reasons the
areal stickiness and the consistency of labor markets exist.

Hirobe T., Regional Science Inquiry, Vol. VI, (2), 2014, pp. 11-21
17
Figure 3. Selected maps by LISA (the year of 1999, 2003, 2006, and 2008).
From the LISA maps above, some findings and historical reviews are described as
follows. Most of the 1990s was the era of low unemployment rates and high employment
rates. Actually, it seemed that US economy had been moving along quite smoothly until the
Russian crisis, the collapse of the ruble in August 1998. As a result, since the financial crisis
including foreign exchange matters had a strong impact on the labor market, generally one
would think that it might be one of the causes of the abrupt increase of the statistics
concerning unemployment such as IASUR. Thus the end of the 1990s would be the period of
the turning point of labor markets. The trend of uniformly decreasing unemployment rates
was changed to the trend of increasing at that period: that would obviously indicate some kind
of structural change of labor markets.
Regarding the annual Moran’s I statistics, the comparatively low rates early in the 2000s
were recorded, and then the sharp decline from 2001 to 2004 occurred, and the relatively high
values of the dispersion rates were indicated during the period of 2004 to 2006. Also those
periods correspond to the time when some “hot spots” newly broke out in the Northeast and
extended into the coastal areas of the South and the West regions.
Compared to the 1999, the regional distribution of the Moran’s I statistics in the beginning
of the 2000s also explicitly changed. The above maps indicate the large variations in the
distribution of “hot and/or cold spot” areas: they even give the impression of the partial
reorganization of the labor structure in such areas. In fact, before 2000, there were more hot
spots in especially inland and central areas in the U.S.A., however, afterwards they tended to
spillover and disperse to more surrounding areas. If so, what on earth were the potential
causes of these changes? Actually, these annual changes of LISA almost correspond to the
variations of the average unemployment rates of the entire U.S.A. Namely, the large
fluctuations of unemployment rates tend to widen the regional disparities, and remake the
clustering process.
As already introduced by some arguments of the “equilibrium” or “disequilibrium”
theory, some socioeconomic shocks trigger the sharp variations of IAS statistics and others,
then somewhat rebound to a comparatively moderate level which becomes the next starting
point to make a new trend. Since generally the regional characteristics are difficult to change
quickly, it takes a significantly long time to transform them and usually shift to some
transitional stages absorbing such remarkable changes.

Hirobe T., Regional Science Inquiry, Vol. VI, (2), 2014, pp. 11-21 18
3.2. Characteristics of Local G* statistics
The following graphs describe the local G* statistics of IASER, IASUR, and IASOR. The
figure (a) indicates downward-sloping tendency and the figure (b) shows a little upward trend
instead. The former indicates that some hot spots of IASER correspond to the cold spots of
IASUR, and shows that some cold spots of IASER correspond to the hot spots of IASUR
conversely. On the other hand, the trend of the latter is opposite to that of the former.
The figure (c) is the pair plot of “IASUR vs. IASER” or “IASUR vs. IASOR” with
respect to the standard deviations of the local G* statistics from 1991 to 2011 by region. It
shows that the extent of dispersions about two kinds of the pair plot is not so large, and also
shows that there are few relationships of the standard deviations between IASUR and IASER
or between IASUR and IASOR.
Figure 4. Related plots of LG: (a) Annual average, (b) Annual average, (c) Standard deviation.
3.3. Characteristics of Moran scatter plots
As the characteristics of the Moran scatter plots of IASUR and RDCUR selected from the
list, some interesting findings are expressed in Figure 5.
Figure 5. Plots of IASUR and RDCUR:
(a) Annual average, (b) Standard deviation, (c) Annual average, (d) Standard deviation.
From the outcome of the Moran scatter plots, the total proportions of data plotted in the
second quadrant and the third quadrant together are higher than those in the both of the first
quadrant and the fourth quadrant. It implies relative superiority of the regions which include

Hirobe T., Regional Science Inquiry, Vol. VI, (2), 2014, pp. 11-21
19
cold spot areas and have low levels of IAS or RDC. In addition, the trend of the standard
deviations implies the superiority of cold spot areas: it indicates the spatial agglomeration of
the regions that have comparatively small changes; thus it also shows the trend of such spatial
dependency against time (see the figure (b), (d)).
3.4. Summary of LISA results of IAS and RDC statistics
The following is the list of main findings and some remarks from Figure 6.
・ Regarding the standard deviation of IASUR through1991 to 2011, the high value
mostly concentrated in the coastal areas. Conversely, the low value is seen in the Northeast,
and a part of the Midwest and the South regions.
・ The surrounding area of North Dakota, South Dakota, and Nebraska forms an
especially high valued cluster, and that area is characterized by the combination of the cold
spot areas of IASUR and the hot spot areas of IASER.
・ Oregon and Washington is another special clustering area which has the relatively high
values of IASUR and the relatively low values of IASER; that fact may cause some potential
labor problems at those areas.
・ Since Hawaii, Florida, Texas, Louisiana, and several other states have significantly
high values of LG about IASUR, and low values of LG about IASER, that may bring a
serious future problem of such labor shortages in those regions.
・ Northeast and some parts of the Midwest are the clustered areas of IASER of the
relatively low values. Otherwise the other clustered areas of IASER are somewhat scattering.
・ With some exceptions, most regions mentioned above, plus Main, North Carolina, and
some other states have the high positive LG values of the combination of the averages about
IASUR and the standard deviations about IASUR: Thus regarding the annual averages of
unemployed people in those areas, the high degree of agglomeration state of the remarkable
specialization about unemployment throughout each region is clearly shown. By contrast, the
other areas such as most inland areas have explicitly different patterns.
・ Florida and Louisiana and their surrounding areas are the hottest spots concerning the
combination of IASOR and IASUR.
・ On the whole, mostly the Northeast, the South, and a part of the Midwest, and Hawaii
have high values with respect to the combination of IASOR and IASUR.
・ The surrounding areas of especially North Dakota, South Dakota, and Nebraska have
the strongest spatial dependence with respect to RDCUR and RDCER. Consequently, such
areas show the widest inter-regional disparities about the ratios of the employed persons and
the unemployed persons both.
・ Most parts of the Northeast and the South areas except for Main, North Carolina, and
Florida tend to have the weak spatial dependencies or autocorrelations about RDCUR and
RDCER in comparison with those of the other areas such as the Midwest or the Pacific.
Figure 6. LISA of some selected IAS and RDC (annual average, standard deviation).

Hirobe T., Regional Science Inquiry, Vol. VI, (2), 2014, pp. 11-21 20
4. Concluding remarks
Most labor statistics prove some kind of stability with respect to the regional gaps unless
there is the considerable impact by large fluctuations. The influence of such shocks tends to
be exchanged or absorbed between specific local areas and surrounding global areas.
Afterwards, it spreads around and disperses to further distant areas during a sufficient amount
of time, and thus the geographical distribution about the spatial dependence and
agglomeration is significantly often repainted or transformed by the influence of such shocks
in the final stage. Those phenomena would correspond to the economic situation such as
equilibrium or disequilibrium state of the labor market, and simultaneously would bring about
the remaking of the process of clustering regarding the geographical structure of regional
labor mobility.
Regarding the geographical clustering process, thus the results of this paper would suggest
the existence of the equilibrium and disequilibrium phenomena or the multiple equilibria as
the same concepts in economics; an economic disequilibrium state also causes the geographic
disequilibrium state. On one hand, an economic equilibrium state sometimes stabilizes
geographical changes by controlling the mobility of the labor force. However, future
empirical studies should continue scrutinizing the related arguments to obtain a much more
determinate conclusion.
References
Aragon, Y., Haughton, D., Haughton, J., Leconte, E., Malin, E., Ruiz-Gazen, A., and
Thomas-Agnan, C. 2003. Explaining the pattern of regional unemployment: The case of
the Midi-Pyrenees region. Papers in Regional Science 82: 155-174.
Bell, D. 1981. Regional output, employment and unemployment fluctuations. Oxford
Economic Papers 33: 42-60.
Billings, S., and Johnson, E. 2012. A nonparametric test for industrial specialization. Journal
of Urban economics 71 (3): 312-331.
Blackley, P. 1989. The measurement and determination of state equilibrium unemployment
rates. Southern Economic Journal 56 (2): 440-456.
Brechling, F. 1967. Trends and cycles in British regional unemployment. Oxford Economic
Papers 19: 1-21.
Cracolici, M., Cuffaro, M., and Nijkamp, P. 2007. Geographical distribution of
unemployment: an analysis of provincial differences in Italy. Growth and change 38 (4):
649-670.
Elias, D. 1978. Regional unemployment elasticities: Future evidence. Scottish Journal of
Political Economy 25: 89-96.
Elias, D. 1979. Regional unemployment elasticities: Migration or registration? Scottish
Journal of Political Economy 26: 103-107.

Hirobe T., Regional Science Inquiry, Vol. VI, (2), 2014, pp. 11-21
21
Elias, D. 1980. Regional unemployment differentials: A restatement of the evidence. Scottish
Journal of Political Economy 27: 103-105.
Fujita, M., Krugman, P., and Venables, A. 1999. The spatial economy. Massachusetts: MIT
Press.
Gordon, I. 1979. Regional unemployment elasticities: The neglected role of migration.
Scottish Journal of Political Economy 26: 103-106.
Gordon, I. 1980. Regional unemployment differentials: Migration not registration. Scottish
Journal of Political Economy 27: 97-101.
Gordon, I. 1985. The cyclical sensitivity of regional employment and unemployment
differentials. Regional Studies 19: 95-110.
Goschin, Z, Constantin, D. L., Roman, M., Ileanu, B. V. 2009. Specialization and
concentration patterns in the Romanian economy. Journal of Applied Quantitative
Methods 4 (1): 95-111.
Hirobe, T., and Asahi, J. 2013. Labor statistics for the inter-regional disparity in Japan: the
structural change through 1990 to 2000. Meikai Economic Review 25 (2): 45-69.
Hoover, JR. E. 1936. The measurement of industrial localization. The Review of Economics
and Statistics 18 (4): 162-171.
Ishii, I., Yuzawa, A., Motoda, Y., Kamiura, M., Kameno, T., Miyakoshi, K., Chikami, S.,
Kitamura, H., and Kumano, M. 2002. Regional Planning [originally written by Japanese,
“Chiiki Keikaku”], 2nd Edition, Tokyo, Morikita Publishing Co., Ltd.
Marston, S. 1985. Two views of the geographical distribution of employment and stability,
Quarterly Journal of Economics 100: 57-79.
O’Donoghue, D, and Gleave, B. 2004. A note on methods for measuring industrial
agglomeration, Regional Studies 38 (4): 419-427.
Rogerson, P., and Yamada, I. 2009. Statistical detection and surveillance of geographic
clusters. Florida: Chapman & Hall / CRC Press.
Takahashi, J. 2001. The principle of abstract surface of the earth: Challenge to the
indoctrination of geography (Junjiro Takahashi's collected papers) [originally written by
Japanese, “Chushouteki Chihyou No Genri: Chirigaku No Rironka Heno Chousen” ],
Tokyo, Kokon Shoin Publishing Co., Ltd.
Thirlwall, A. 1966. Regional unemployment as a cyclical phenomenon. Scottish Journal of
Political Economy 13: 205-219.
Trendle, B. 2001. The dispersion and persistence of Queensland regional unemployment,
Australasian Journal of Regional Studies 7 (2): 189-208.
United States Department of Labor, Bureau of Statistics. Local Area Unemployment Statistics
[electric resource]. http://www.bls.gov/lau.
Vedder, R., and Gallaway, L. 1996. Spatial variations in U.S. unemployment. Journal of
Labor Research 17 (3): 445-461.

Regional Science Inquiry, Vol. VI, (2), 2014 22

Makni V.G., Regional Science Inquiry, Vol. VI, (2), 2014, pp. 23-31
23
POTENTIAL OF EARNINGS IN NETWORK MARKETING AND SOME
FACTORS INFLUENCING COMMISSIONS RATES: EVIDENCE FROM
BULGARIA
Valentina G. MAKNI Assistant Professor, Department of International Economic Relations, Faculty of Management,
University of Economics – Varna, Bulgaria
Abstract
During the last two decades direct selling and its new form known as network marketing
(multilevel marketing) illustrate constant growth at a global scale, despite the world economic
crisis. According to WFDSA global retail sales in the industry are at amount of 166 billion
USD, achieved through 90 million independent salespersons in 2012. In terms of high
unemployment and financial instability network marketing deals increasingly as a tool for
generating income and employment in the societies. From the 1990s this alternative business
model rapidly entered in the lives of people in Central and East European Countries in order
to improve their living standards. Direct selling has experienced steady growth in Bulgaria in
the last 5 years as the biggest channel of non-store based retailing. The aim of this paper is to
provide some evidence for the potential of network marketing in Bulgaria and to explore
which factors influence the commission earnings. For this purpose correlation analysis has
been used to prove statistical dependencies taking into account the derived L-distribution of
representative’s income. In socio-demographic features of Bulgarian, direct sellers have been
observed whereat descriptive statistics has been conducted.
Keywords: Network Marketing, MLM, Direct Selling, Bulgaria, Earnings, Extra income
JEL classification: M310, J310
Acknowledgement:
This article was created by the implementation of Project SP 73/2012 ‘Network marketing
– the unknown reality’ according to agreement on applied and scientific research at the
University of Economics – Varna.
1. Introductory Remarks
For a growing number of people, network marketing (MLM) is becoming a popular
method for the preparation of incomes as a new form of the well known traditional direct
selling. It is a sales approach, distribution method, corporate strategy, business model,
entrepreneurship opportunity in which a distribution network from independent salespersons
is selling products or services to customers and in this prolonged process they build their own
business. The main difference to the traditional direct selling model is that distributors (also
called direct sellers) earn commissions not only on their own sales to the customers, but also
on the sales of new distributors they recruit and train – their downline. [1] As Choudhary [2]
explains, when new distributors continue their recruiting and training efforts a multiplying
effect arises, which makes network marketing quite different from traditional direct selling.
American Marketing Association [3] defines that kind of multilevel selling as “1) a sales
approach that involves using company employees at multiple levels in the firm’s hierarchy to
call on similar levels in the account” and “2) a strategy used by direct selling companies to
have independent agents serve as distributors and resell merchandise to other agents who
eventually make sales to customers”.
According to the European Direct Selling Association – SELDIA [4] direct selling
industry is the largest provider of independent business opportunities in Europe. Over 4.8
million people are engaged in direct selling in the European Union and over 11 million in
whole Europe, out of which 79 % are women. Direct selling companies offer permanent

Makni V.G., Regional Science Inquiry, Vol. VI, (2), 2014, pp. 23-31 24
employment to over 25 000 people in Europe and 76 % of the products they sell are
manufactured in the Old Continent.[5] Europe represents 16 % of the global direct selling
market. [6] Since 1990s network marketing has rapidly entered in the lives of people from
Central and East European Countries (CEECs) as a tool to increase income and living
standarts.
Euromonitor’s survey indicates constant industry growth in Bulgaria in the last five years,
where direct selling companies prefer multi-level selling method versus single-level
marketing. Value CAGR is likely to reach 3 % over the next 5 years. [7] In 2012 Bulgaria is
on the 6th place from EU countries in direct selling industry growth. Direct selling
community in Bulgaria amounts to 135 thousand direct sellers [8], which represents 45 % of
all people engaged in the retail industry and nearly 5 % of total employment in the country.[9]
This data refer only to the seven companies registered in Bulgarian Direct Selling Association
– BDSA [10]. They represent a small share of direct selling companies operating in Bulgaria.
According to Euromonitor International survey [7] companies with the largest market share
are Avon (44 %) и Oriflame (24 %). Network marketing does not have a good image among
natives, due to the negative experience of many people from financial fraud schemes in the
1990s. As Coughlan and Grayson [11] emphasize “network marketing carries negative
connotations in many marketplaces worldwide. It is often incorrectly associated with
deceptive pyramid schemes, which result in a financial ruin for participants.” Another
general problem pointed by Keun [12] is that the activity of recruiting people into network
marketing is “socially and psychologically unacceptable to most people in the society.”
According to Kiaw and Ernest de Run [13] MLM business is “one of the most controversial
industries in modern commerce.” Nevertheless, new MLM companies continue to enter
Bulgarian market wherefore direct selling community is growing. This trend is
comprehensible, taking into account the applied market diversification corporate strategies,
growth stage of the industry life cycle in the country and relative low income of the
population.
So far direct sales and multilevel marketing in particular, have not been studied in
Bulgaria. The state lacks on legislation in this field moreover the whole retail industry is not
regulated and still has not been taken measures in this direction. On the background of
political lack of interest more Bulgarians have found multilevel marketing as an attractive
tool to increase their incomes in terms of flexible conditions of work and independence.
2. Methodology
The actuality of this topic and adduced arguments premise a study among Bulgarian
distributors who are involved in multilevel marketing and earn incomes from direct sales.
This is originally study in Bulgaria and generally aims to give an idea about socio-
demographic profile of Bulgarian direct sellers, and in particular, to determine the
commission rate they receive from the network marketing and the factors that influence on it.
A national online questionnaire was conducted among distributors from five international
direct selling companies operating in Bulgaria. We have used unordinary selection method of
respondents. With the consent and corroboration of the CEOs in the Bulgarian subsidiaries of
the companies, a survey was send to their independent representatives in the country. The
collection of data occurred in the period between June and August 2013. A total of 279
respondents completed the questionnaire. The approach in the selection of companies and
their distributors were based on the following restrictions:
- Respondents were mostly from companies that conduct business over 10 years in
Bulgaria. This condition was met for 85% of the respondents.
- Respondents were mostly from companies that have opened offices in the country and
have been members of the Bulgarian Direct Selling Association (BDSA). This condition was
met for 82% of the respondents.
- Respondents were active distributors and win commissions, i.e. for them network
marketing is a source of additional or principal income l. Total 89% see themselves engaged
in MLM,
- According to World Federation of Direct Selling Association –WFDSA [14] the
predominant product categories in direct sales in Bulgaria are Beauty and personal care (53

Makni V.G., Regional Science Inquiry, Vol. VI, (2), 2014, pp. 23-31
25
%) and Wellness (37 %) which determines the specificity of the responding companies – 92
% of the respondents offer products in these two categories.
Considering specifications of statistical distribution of the investigated variable – direct
sellers commission rate - descriptive and correlation analysis were used. The data collected
were treated using SPSS 19.0
3. Results and discussion
In terms of gender 83 % of the respondents are women and 17 % are men. Official data
shows, that in Bulgaria 86 % of direct selling community are women and 14 % are men [15],
i.e. gender ratio of the respondents is very similar to the gender ratio of all Bulgarian direct
sellers. These figures confirm the global trend of gender structure in direct selling. Worldwide
75 % of direct sellers are women and 25 % are men in 2012. [15] Bell [16] designates the
MLM industry as ‘Pink ecopnomy’, in order to provide a flexible business opportunity for
women by offering them work-life balance.
In the capital city live 30 % of all respondents, in major city – 49 %, in other town – 18 %,
in the village - 3 %. Regional location of direct sellers indicates that direct selling industry
encompasses even the least populated places in the country.
Respondents average age is 45 years old (means=45). In the highest percentage (31%) falls
range between 25 and 34 years old. The standard deviation (σ= 12) shows that network
marketing attracts mostly people at mature age - between 33 and 57 years old. (Fig. 1)
Figure 1: Age of the respondents
Youths and pensioners also earn commissions from direct sales. Bulgaria has the lowest
pensions rate as a percentage from GDP in EU [17] and many retirees live below the poverty
line. For those, who are enaged in network marketing commissions are particularly valuable
source of extra income. Because MLM is a flexible form of employment it allows many
young people, including students, to obtain additional resources, for example, during their
studies.
Most of the distributors (73 %) have attained tertiary education, 26 % have attained
secondery education and only 1 % have completed primary school. The results indicate that
high educated people in Bulgaria are interested in direct selling industry.
MLM attracts different kind of people and social groups in the country. The biggest share
are employees (34 %). There are small business owners (22 %), investors (10 %),
unemployed persons (9 %), retired people (9 %), women in motherhood (4 %), students (4 %)
and 3 % are disadvantaged or others. Wider diversification of direct sellers confirms the
importance in social distinction of network marketing – no discrimination in terms of age,
gender, profession, skills, qualifications, social status – no input requirements and barriers in
starting MLM business.

Makni V.G., Regional Science Inquiry, Vol. VI, (2), 2014, pp. 23-31 26
Table 1. Characteristics of direct sellers
Distributors characteristics %
Active engaged in MLM 89%
Employee 34%
Small business owner 22%
Investor 10%
Retired 9%
Unemployed 9%
Student 4%
In motherhood 4%
Disadvantaged or others 3%
To study the commission rate of respondents initially they were divided into two groups –
those with monthly average earnings under 1000 lv.(77 % of the respondents) and those with
monthly average earning over 1000 lv. (23 % of the respondents).1 After compiling data on
monthly average commission earnings we found out that they derive L-distribution in lower
commission rates (< 1000 lv.) and normal distribution in higher commission rates (> 1000 lv.)
Among all respondents, who have specified the size of their commissions - 68 % earn average
monthly commission under 600 lv. The largest share of direct sellers (32 %) earn 100 lv. on
average, 22 % - 300 lv. and 14 % - 500 lv. (Fig. 2) For these three categories of distributors,
network marketing is an efficient tool to increase the household income and useful extra
income. Hence, they can cover some of their costs, pay monthly interest on loans or spare for
savings. Other 32 % of respondents are equally distributed in five categories levels of
commissions – 5 % earn 700 lv. per month on average, 5 % - 900 lv., 6 % - 1500 lv., 4 % -
2500 lv., 4 % - 3500 lv., and 5 % earn above 5000 lv. Hence, for these 32 % of respondents
MLM deals as a main source of income. In comparison, in 2013 average gross monthly wage
in Bulgaria was 799 lv. [18]
Figure 2. Average monthly commissions of direct sellers*
* Results refer to 248 direct sellers (11% did not provide
information on the amount of their commissions.)
1 Monetary system in Bulgaria is in currency board. Bulgarian currency is fixed to the Euro (1Euro =
1.95583 levs)

Makni V.G., Regional Science Inquiry, Vol. VI, (2), 2014, pp. 23-31
27
As we can see from Tab. 2 one fifth (21 %) of the respondents were unemployed before
involving to MLM. At the time of the survey 10% of them earned monthly commissions over
1000 lv., 37% - between 500-1000 lv. and 54% - less than 500 lv.
Table 2. Cross-tabulation between average commissions and the number of unemployed before
joining MLM
Average monthly commissions (lv.)
Total 100 300 500 700 900 1500 2500 3500 4500 5500
Number of
unemployed before
joining MLM
Yes 14 14 11 5 3 2 1 1 0 1 52
No 64 41 24 6 9 11 9 10 8 12 194
Total 78 55 35 11 12 13 10 11 8 13 246
The results create implication that network marketing can reduce unemployment among
the Bulgarian population. Further more, for a part of the former unemployed it becomes a
source of income exceeding the amount of the average salary in the country. About one fifth
(22%) of distributors indicate that at the time of the study they did not have any other source
of income besides MLM. This indicates that direct sales can be not only additional, but also a
major source of income.
4. Size of the network marketing organization (NMO)
In general, as Coughlan and Grayson [11] underline “the commission rate increases as a
function of overall group volume.” The larger the network of distributors, the greater is the
turnover for the company that generates the network because there are more consumers who
consume products and services. Companies pay off to their distributors a percentage of the
turnover of each distributor network. Therefore we assume that the commission will increase
if distributors attract more distributors (this means more consumers). The larger number of
respondents (59%) have developed their NMO, which consists of at least 50 people. From
Fig. 3 we can see that 17% have recruited between 50-150 distributors, 5% - 150-250
distributors, 5% - 250-350 distributors, 1% - 350-450 distributors and 14% - more than 450
distributors.
Figure 3.Size of the NMO
We studied the strength of the relationship between the size of the existing network (the
number of recruited distributors) and the amount of commissions through correlation analysis.
Pearson’s coefficient (rb = 0.8) indicates a strong correlation between the expansion of the
network and the commission rate. (See Tab. 5 below) Checking on reliability of the estimated
coefficients by statistical hypothesis testing.
The null hypothesis (H ₒ) states that there is no relationship between the two variables. The
alternative hypothesis (H ₁) means there is a relationship. Coeficient is significant at the 0.01

Makni V.G., Regional Science Inquiry, Vol. VI, (2), 2014, pp. 23-31 28
level, which is a ground for rejecting the null hypothesis and accepting the alternative
hypothesis. Hence, the size of the NMO has a strength influence on commission rate.
5. International network marketing organization
Thirty one percent (31 %) of respondents stated to have their network (NMO) not only in
Bulgaria, but also in other countries. As we can see in Tab. 3, there is a growing positive ratio
at higher commission rates (over 3500 lv.) between international NMOs to national NMOs.
Therefore, higher commissions were received prevailing from distributors with international
NMOs.
Table 3. Crosstabulation between commission rate and international NMO
№ of distributors
with
Average monthly commissions in leva
Total 100 300 500 700 900 1500 2500 3500 4500 5500
NMO in Bulgaria 66 42 26 4 6 7 6 4 1 5 167
International NMO 12 13 9 8 6 6 4 7 7 8 80
Total 78 55 35 12 12 13 10 11 8 13 247
We studied the correlation between the commission rate and establishing network abroad
(international NMO). According to Pearson Chi-square test (χ²=43.5 significant at α=0.05)
null hypothesis (H ₒ) is rejected and the alternative hypothesis is accepted (H ₁), i.e.
establishment of international NMO influences commission rates. Cramer’s V = φ= 0.42,
which indicates medium relationship.
International NMOs create an important potential for the national economy. Their impact
is even more evident, when the corporation is a foreign company. International networks and
their turnover are formed outside the national economy, in which the movement of products
/services between the company and the end consumers takes place entirely abroad. At the
same time it generates cash flow in the form of commissions to Bulgaria, respectively, to the
distributor, contributed to the increase in foreign demand for the products. Therefore, the
international NMOs formed by Bulgarian distributors, turn on financial transfers to Bulgaria,
which can create a multiplier effect in domestic economy.
6. Years involved in MLM
In network marketing there are no requirements regardless of age, gender, education,
skills, background or level of finances. [19] In this sense, low entry barriers encourage many
people to become direct sellers. [20] According to Neyten and Fogg [21] ‘more then 70 000
worldwide join a direct selling business every day’. At the same time exit barriers are also
very low, whereas the proportion of the distributors who are leaving business is very high. We
assume that with increasing years in the MLM industry, intentions and efforts increase to
build a sustainable business that leads to increase of commissions. The results show that 37%
of respondents are involved in MLM in less than two years, 25% - 4-6 years, the 22% - over
10 years.We investigate the relationship between the years spent in network marketing and
commission rate. In Tab. 5 we can see, that Pearson’s correlation is significant at 0.01 level
(rp=0.6). This confirms the alternative hypothesis (H ₁), hence the duration of the
construction business has a significant impact on the commission rate.
7. Time spend on the MLM business per day
Table 4.Hours spent in MLM business
Hours spent Share of
in MLM distributors
0-2 h 62%
2-4 h 21%
4-6 h 9%
6-8 h 8%

Makni V.G., Regional Science Inquiry, Vol. VI, (2), 2014, pp. 23-31
29
We can see in Tab. 4 that most of distributors (62 %) spend below 2 hours per day to build
their MLM business (meetings with prospects, sponsoring new distributors, presentations,
trainings, etc.) One fifth (21%) spend between 2-4 hours daily in MLM, 9% - between 4-6
hours daily and 8% are engaged in MLM full-time. The correlation analysis shows a
significant association between two variables at α = 0.01 level. Pearson’s correlation (rp =
0.4), indicates moderate relationship between the average time spent per day in MLM
business and commission earnings. (Tab. 5)
Table 5.Pearson’s correlations
Variables Pearsons (rp) Strength of the relationship
Size of the network 0.831** strength
Years involved in MLM 0.559** significant
Time spend in MLM business per day 0.382** medium
**Correlation is significant at the 0.01 level
* Correlation is significant at the 0.05 level
8. Success in MLM
Distributors were required to evaluate each of the nine factors on a scale of 1-5 in order of
importance for success in MLM (1 is the least important and 5 is most important) outlining
four factors – ‘consistency (never giving up)’ - 86% of all respondents gave this factor the
highest score. Factor ‘Personal motivation and goal setting” was rated highest by 85% of
respondents. ‘Individual’s personality’ is referred to as the most important factor by 79% of
respondents, and ‘activity’ (in the form of regular calls and meeting new people) – by 75% of
respondents. Exploring the impact of all nine factors on the amount of commissions by
Spearman coefficient, we found the following relationships - significant at α=0.01 level are
the factors 'activity', 'following of a ready-made system' , 'consistency' and 'regular
participation in company trainings'. Significant at α=0.05 level are the factors ‘personal
motivation and goal setting’ and ‘regular contact with downlines’. The value of the
significant coefficients (0 <rs <0.3) indicates a weak relationship between the variables and
the commission rate. (Tab. 6) An interesting result on factor ‘Individual’s personality’ which
is most highly evaluated by the 79% of respondents, but it turns statistically insignificant, i.e.
irrelevant to the commission rate. The last two factors – 'permanent contacts with the sponsor'
and 'constantly reading and studying of business' are not considered of particular importance
by distributors, there is no statistically significant relationship between these variables and
commissions.
Table 6.Spearman’s rank correlation coefficient
Variables Spearman coefficient
Activity (regular calls and meeting new prospects) 0.239**
Following of a ready-made system 0.210**
Consistency (never giving up) 0.205**
Regular participation in company trainings 0.196**
Personal motivation and goal setting 0.149*
Regular contact with downlines 0.125*
Regular contact with your sponsor and your upline 0.052
Individual personality 0.050
Constantly reeding and studying of business 0.050
**Correlation is significant at the 0.01 level
* Correlation is significant at the 0.05 level

Makni V.G., Regional Science Inquiry, Vol. VI, (2), 2014, pp. 23-31 30
9. Conclusions
The main findings of our study relate to the potential that create the commissions in
network marketing. Descriptive analysis shows that earnings in network marketing are a good
source of extra income and for some distributors they are the main source of income. Network
marketing creates employment for different social groups of the population. It can redeem
unemployment in Bulgaria and generated MLM income is sometimes higher than the average
wage in the country (in some cases much higher). In this sense, the state should focus on the
socio-economic opportunities offered by the industry.
As a result of the correlation analysis of the factors that were included in the study it was
found that for distributor the strengthest influence on the commission rate has the size of the
existing NMO (number of distributors included) and duration of establishing the business
(years of engagement with business). Significant impact on the commissions has the time
spent in MLM (hours per day devoted to business). Existence of international NMOs
moderately influences the commission rate. We observe weak influence on the commissions
of the variables – activity, following of a ready-made system, consistency, regular
participation in company trainings, personal motivation and goal setting, regular contacts with
downlines.
Future research should be focused on the extension of the studied variables on
commissions. It can be added to various demographic and psychological factors affecting
commissions as for example incentives for involving to MLM business, personal
characteristics, use of the products offered. Attention may be drawn to what extent the factors
affecting lower and higher commissions are the same and weather they have equal impact on
them. It is interesting to examine how distributors allocate their commissions i.e. how and to
what extent diversify the use of earnings from network marketing.
REFERENCES
[1] Mathews, G., Manalel, J., Zacharias, S. “Network Marketing: Exploitation of
Relationships – Myth or Reality”, in International Marketing Conference on Marketing &
Society, 8-10 April, 2007, IIMK, pp. 159-163
[2] Choughary, R. “Multilevel Marketing (MLM) for Socio-economic Development”, in
International Journal for Reviews, Surveys and Research, Vol. 2, Issue 1, January 2013
[3] American Marketing Association:
https://www.ama.org/resources/Pages/Dictionary.aspx?dLetter=M
[4] SELDIA Annual Report 2012-2013: Representing Direct Selling in Europe
http://seldia.eu/sites/default/files/pdf-documents/SELDIA_AR_2013.pdf
[5] The European Direct Selling Association: http://seldia.eu/statistics
[6] WFDSA, Global Sales and Direct Selling Community – 2012, Published on 6.04.2014
http://wfdsa.org/files/pdf/global-stats/Sales_and_Community_2012.pdf
[7] Euromonitor International, Direct Selling in Bulgaria, 2013
[8] European Direct Selling Association: http://www.seldia.eu/sites/default/files/pdf-
documents/2012%20stat%20general%20presentation27062013%20xls.pdf
[9] Eurostat: http://appsso.eurostat.ec.europa.eu/nui/show.do?dataset=lfsi_emp_a&lang=en
[10] Bulgarian Direct Selling Association: http://www.bdsa-bg.com/
[11] Coughlan, A. and K. Grayson, “Network Marketing Organizations: Compensation Plans,
Retail Network Growth and Profitability”, in International Journal of Research in
Marketing 15, 1998, pp. 401-426
[12] Keun, Ng Gek, “Participation in Network Marketing Companies: the motivational factors
that influence the part-time distributors in Kuching, Sarawak” University Malaysia
Sarawak, 2004

Makni V.G., Regional Science Inquiry, Vol. VI, (2), 2014, pp. 23-31
31
[13] Kiaw, C. and E. Cyril de Run, “Why Malaysians Join and Stay on in a Multi-level
Marketing Company”, in Icfai Journal of Services Marketing, Vol. V, Nο 4, 2007, pp. 37-52
[14] WFDSA, Global Sales by Sales Method – 2012, Published 24.06.2013
http://wfdsa.org/files/pdf/global-stats/Sales_Method_2012.pdf
[15] WFDSA: http://wfdsa.org/files/pdf/global-stats/Sales_Method_2012.pdf
[16] Bell, A. “The Pink Economy”, in Direct Selling News, published on 1.10.2011
http://directsellingnews.com/index.php/view/in_the_pink/P1#.Uy6Qk6h_sq4
[17] Eurostat:
http://appsso.eurostat.ec.europa.eu/nui/show.do?dataset=spr_exp_pens&lang=en
[18] http://www.investor.bg/ikonomika-i-politika/332/a/srednata-zaplata-se-e-povishila-s-31-
prez-2013-g,166799/
[19] Gaddy, D. Network Marketing: A Smart Choice for Today’s Entrepreneur, Community
Success Initiative, 2004, available at:
http://communitysuccess.org/sites/default/files/network_marketing.pdf, last accessed on 30
March 2014
[20] European Direct Selling Association, Promoting the benefits of direct selling: Annual
report 2011-2012
[21] Nuyten, T. and J. Milton Fogg (2012), Your Plan B, third edition, BusinessForHome.org, p. 4

Regional Science Inquiry, Vol. VI, (2), 2014 32

Benešová M.,Regional Science Inquiry, Vol. VI, (2), 2014, pp. 33-38
33
OPTIMIZATION OF DETERMINISTIC POPULATION DYNAMICS
MODELS
Michaela BENEŠOVÁ Department of Mathematics and Statistics of the Faculty of Science, Masaryk University
Kotlářská 2, 611 37 Brno Czech Republic
Abstract
The aim of this contribution is to apply methods from optimal control theory to the
mathematical modeling of biological pest control. We formulate a pest control strategy for
nonlinear Kolmogorov system of n interacting populations by introducing natural enemies as
a control function. The sufficient conditions for existence of an optimal feedback control
function are based on the fact, that the steady-state solution of the Hamilton-Jacobi-Bellman
partial differential equation is a Lyapunov function guaranteeing stability and optimality We
apply those general results to the Lotka-Volterra system with a logistic rate of increase of the
prey population and Holling’s second type functional response of the predator population, to
illustrate biological control of pest mite in stored grain Acarus siro by predatory mite
Cheyletus eruditus.
Keywords: Kolmogorov system, optimal control theory, Lotka-Volterra system, pest
control strategy.
JEL classification: J110, J180, J19
1. Introduction
Optimal control theory acquires an increased application in both theoretical and applied
ecology and epidemiology. It is a main method of adaptive resource management, sustainable
ecosystem management ([13]), optimal harvesting and foraging theory ([1], [8], [12]), native-
invasive population dynamics ([6], [3]) and pest management programs ([14]).
Most of pest control methods are based on chemical insecticides. Chemical controls are
inexpensive to use and very effective but with high environmental cost. There appears a
tendency to use natural enemies to suppress pest population and thus making it less damaging.
This approach is called biological control (BC). Role of BC is to stabilize the density of the
pest population in the level of non-economic and non-ecologic damage by predators,
parasites, parasitoids or pathogens. BC sometimes includes genetic manipulations to increase
the resistance of organisms such as sterilization and disturbance of mate finding ability ([4]).
The theoretical and experimental studies show, that successful natural enemy must have
some qualities: it is specific for the pest population, it has high intrinsic growth rate, high
search capability, synchronous dynamic and aggregates in areas with a high density of pest
population. There are three types of BC: (1) importing and introducing natural enemies of the
original geographic area, (2) augmentation of a large population of natural enemies for
immediate effect or periodic augmentation ofa small population of natural enemies, (3)
conservation of environment in order to preserve existing natural enemies.
In this paper we focus on the use of optimal control theory to the mathematical modeling
of BC through the non-recurring augmentation of natural enemies. In general BC is modeled
as predator-prey or host-parasitoid type systems. We organized this paper as follows. In
Section 2 we present the optimal control problem of the nonlinear Kolmogorov system. In
Section 3 we apply this approach to control the predator-prey system and finally conclusion
and references are given.
2. Formulation of the control problem
Optimal control theory is one of several applications and extensions of the calculus of
variations ([5]). It deals with finding an admissible control function that minimizes the
performance measure functional with differential equation constraints. It is known, that the

Benešová M., Regional Science Inquiry, Vol. VI, (2), 2014, pp. 33-38 34
nonlinear optimal control problem (nonquadratic functional with nonlinear differential equations) can be reduced to the Hamilton-Jacobi-Bellman nonlinear partial differential equation ([7]). There are many problems in its solution except the case of linear regulator problem (quadratic functional with linear differential equations), where the Hamilton-Jacobi-Bellman partial equation is reduced to the Riccati system of nonlinear ordinary differential equations and it can be shown, that the solution is a Lyapunov function.
Bernstein ([2]) rewied a framework for optimal nonlinear problems involving nonquadratic functionals that is analogous to linear-quadratic theory. He investigated time-invariant systems on the infinite interval. In such case the steady state solution of the Hamilton-Jacobi-Bellman equation is a Lyapunov function of the nonlinear system, guaranteeing stability and optimality.
We formulate a pest control strategy for Kolmogorov model of n interacting species
(1)
or in vector form (2) where χi is density of i-th species at the time t, fi(χ1,χ2,...,χn) is nonlinear continuous
function for i = 1,...,n and it expresses growth rate of the i-th species depending on densities of all of the species.
Suppose, that the right-hand side of (2) can be divided into linear and nonlinear parts (3) where is a constant matrix, h(χ) is a vector of nonlinear functions. We
introduce into the system (3) natural enemies represented by control vector with constant matrix
(4) The aim of this control is to move the system to the desired steady state
, in which the pest density is stable without causing damages and natural enemy density is stabilized at the level, that will allow further control. The desired steady state satisfies the following system
But in general, the desired steady state can be unstable. To avoid this obstacle, the control
strategy must be sum of two control vectors where ensures asymptotical stability.
Define new variables (5) Substituting (5) into (4) we get the "error" system:
(6) where Based on the results of ([2]) we prove the next theorem: Theorem 1. Consider general nonlinear system with time-dependent (7) If there exist symmetric positive definite matrix Q(t) and positive definite matrix R(t),
such that
is positive definite function. Then the linear control function

Benešová M.,Regional Science Inquiry, Vol. VI, (2), 2014, pp. 33-38
35
(8) that moves the system (7) from initial state to the desired final state minimizing
functional
(9)
is optimal; the matrix P(t) is symmetric positive definite solution of Riccati equation (10) Proof. According to the Theorem 3.1 and Remark 4.1 of ([2]) we know, that if the
minimum of (9) exists and V is a smooth function of the initial conditions, then it satisfies the following Hamilton-Jacobi-Bellman equation:
(11)
where ' denotes the Fréchet derivative. Let us consider function (12) where P(t) satisfies (10). Then the derivative on the optimal trajectory with (8) according
to (7) is
(13)
Substituting (13) into (11) we obtain
so from that
Then equals to and it is negative definite for both R positive definite. Thus function V(y) is Lyapunov and then the system is locally asymptotically stable.
Remark 1. Theorem 1 holds also for the systems with constant matrix A. In such case matrices Q, R are constant and constant matrix P is symmetric positive definite
solution of algebraic Riccati equation
3. Application to the biological control of Acarus siro
The mite Acarus siro is one of the most important pests of stored products. It infests cereals, oilseeds, cheese, grain. Biological control was already developed 40 years ago using a predatory mite Cheyletus eruditus ([10]). To describe Acarus-Cheyletus dynamics mathematically we use the predator-prey model with Holling II type functional response of predator population and logistic growth of prey population ([9]):
(14)
(15)
Here, χ = χ(t) and y = y(t) denote a time dependent abundance of prey Acarus and predator Cheyletus populations, respectively, the parameters r, K denote the prey intrinsic growth rate, carrying capacity of the environment for the prey population and the parameters d, c, α, T denote the predator mortality rate, conversion efficiency, predation rate (also called capture efficiency, search rate), handling time including time required for chasing, killing, eating and digesting the prey.

Benešová M., Regional Science Inquiry, Vol. VI, (2), 2014, pp. 33-38 36
The standard qualitative analysis states that the system (14), (15) has one stable interior
equilibrium. This fact is also illustrated by simulations performed in R ([11]) for given
parameters r = 0.4, K = 500, d = 0.08, c = 0.8, T = 0.5, α = 0.001 ([10]) with initial state
[100;20], [300;2] respectively, in the Figure 1.
Figure 1. Density variations of the Acarus-Cheyletus model (14), (15) without control strategy
The aim is to control the dynamics by massive augmentation of the natural enemy
Cheyletus to move the system to the desired steady-state χ*, y*, where the pest abundance χ*
should be equal and below the pest damage level. The controlled system (14), (15) is of the
following form:
(16)
(17)
and the next holds
(18)
(19)
Since χ* is given by the known values causing damage, from (18) we get
and from (19) we get
Now substituting new variables into (16), (17) we
construct an error system:
The linear part of the error system can be represented by constant matrix
(20)
Then the control matrix and is the remaining nonlinear part of the error
system. For parameters r = 0.4, K = 500, d = 0.08, c = 0.8, T = 0.5, α = 0.001 and given
desired state χ*=18, we compute y*=389.0704, u*=25.57299. The matrix (20) has the form

Benešová M.,Regional Science Inquiry, Vol. VI, (2), 2014, pp. 33-38
37
Choosing
and solving the algebraic Riccati equation we obtain
Finally based on the Theorem 1 we compute the optimal control function for the error
system
hence the optimal control fiction u of the Acarus-Cheyletus system equals
Figure 2. Density variations of the Acarus-Cheyletus model (14), (15) with control strategy
4. Conclusion
In this article we present a mathematical model for biological pest control. The control
problem for nonlinear system is investigated in order to formulate the optimal control strategy
by only introducing natural enemies. As an application we analyze the predator-pest system of
two mites Acarus siro and Cheyletus eruditus. We derive the linear control u, that is a sum of
the feedforward control function u* and feedback control function . As the Figure 2 shows,
the control u drives the trajectories of the Acarus-Cheyletus system from initial state after the
massive augmentation of the Cheyletus population to the desired state χ* below the pest
damage level.

Benešová M., Regional Science Inquiry, Vol. VI, (2), 2014, pp. 33-38 38
References
[1] ANITA, S. (1997). Optimal harvesting for a nonlinear age-dependent population
dynamics. J. Math. Analysis Appl., 226:6-22.
[2] BERNSTEIN, D. S. (1993). Nonquadratic cost and nonlinear feedback control. Int. J.
Robust Nonlinear Control, 3:211–229. doi: 10.1002/rnc.4590030303.
[3] BODINE, E. N., GROSS, L. J., LENHART, S. (2008). Optimal control applied to a
model for species augmentation. Math. Biosci. Eng., 5(4):669-80.
[4] BOUKAL, D. S., BEREC, L. (2009). Modelling mate-finding Allee effects and
populations dynamics, with applications in pest control. Population Ecology 51:445-458.
doi:10.1007/s10144-009-0154-4.
[5] BRYSON, A. E., Jr. (1996). Optimal control – 1950 to 1985. Control systems, IEEE,
16(3):26-33.
[6] KERN, D. L., LENHART, S., MILLER, R., YONG, J. (2007). Optimal control applied to
native-invasive population dynamics. J. of Biological Dynamics, 1(4):413-426.
[7] KIRK, D. E. Optimal control theory: an introduction. Mineola, N.Y.: Dover Publications,
2004, 452 s. ISBN 0-486-43484-2.
[8] LUO, Z. (2007). Optimal harvesting for a population dynamics problem with age-
structure and diffusion. J. Appl. Math. and Computing, 25(1-2):35-50.
[9] MURRAY, J. D. Mathematical Biology: I. An Introduction. Interdiscip. Appl. Math.,
Springer-Verlag, NY, 2002, 551 s. ISBN 0-387-95223-3.
[10] PEKÁR, S., ŽĎÁRKOVÁ, E. (2004). A model of the biological control of Acarus siro
by Cheyletus eruditus (Acari:Acaridae, Cheyletidae) on grain. J. Pest Sci., 77:1-10.
[11] R Development Core Team (2008). An Introduction to R: Notes on R, A Programming
Environment for Data Analysis and Graphics [electronic edition]. Accessible from:
http://cran.r-project.org/doc/manuals/R-intro.html
[12] RUNGE, M. C., JOHNSON, F. A. (2002). The importance of functional form in optimal
control solutions of problems in population dynamics. Ecology, 83(5):1357-1371.
[13] SHASTRI, Y., DIWEKAR, U. (2006). Sustainable ecosystem management using
optimal control theory: Part 1 (deterministic systems). J. of Theoretical Biology, 241:506-
521.
[14] VINCENT, T. L. (1975). Pest management programs via optimal control theory.
Biometrics, 31(1):1-10.

Gomes L., Ramos Silva J., Regional Science Inquiry, Vol. VI, (2), 2014, pp. 39-55
39
SPANISH AND PORTUGUESE HOTEL NETWORKS IN BRAZIL Evidence from the Northern Coast of Bahia
Lirandina GOMES Universidade do Estado da Bahia, Salvador, Brazil
Joaquim RAMOS SILVA* SOCIUS, School of Economics and Management, Universidade de Lisboa, Portugal
*Corresponding author:
Abstract
The paper analyzes the experience of Portuguese and Spanish hotel networks in Brazil,
specifically on the Northern Coast of Bahia. We look at this process over the period when
Brazil was opening up to international tourism corporations through promotion of national
and regional policies. The research included surveying hotel representatives from investing
countries. Clearly, there is a mighty convergence of interests between hotel groups, civil
construction firms, and financial institutions, which appeals strongly to the political powers,
particularly at a regional level. We also conclude that countries launching their tourism
industry may learn from the experience of first comers with this crisscrossing research
approach proving beneficial from various perspectives.
Keywords: Internationalization, regional policy, tourism location, tourist-residential
complexes, business strategies, economic development, cultural links
JEL classification: M300, M310, L14
About the authors
Lirandina Gomes is assistant professor at the Universidade do Estado da Bahia (UNEB),
Salvador, Brazil. She received her PhD in Geography at the Universidade Federal de Sergipe
(Aracaju, Brazil). In 2012, she was postdoc at the research center SOCIUS (ISEG/UTL,
Lisbon). She has published papers in several journals, and with the support of Fundação de
Amparo da Pesquisa do Estado da Bahia (FAPESB) and the publishing house EDUNEB, the
author of a book in print on tourism and sustainable development. Her main research interests
are: tourism and hotel management; environment, sustainability, and territorial planning; local
and regional development; globalization, investments, and territoriality.
Joaquim Ramos Silva is Associate Professor at the School of Economics and
Management (ISEG), University of Lisbon (Technical University of Lisbon until July 2013)
and a researcher at SOCIUS. He received his PhD in Economic Analysis and Policy at the
École des Hautes Études en Sciences Sociales (Paris). Among many other publications, he is
the author of four books, editor or co-editor of six, and has around fifty scholarly papers in
refereed journals and chapters of collective books. His main research topics are related to
international economics and business, more specifically: international trade and foreign direct
investment analysis and policies, the process of firms’ internationalization, globalization,
regional integration and the economics of international organizations, the internationalization
of the Portuguese economy and firms and particularly its relationship with Brazil.
1. Introduction
Since the 1970s, world tourism flows have increased significantly and tourism industry
internationalization, in particular hotel networks, closely followed these dynamics. The rapid
growth in the number of hotels associated with transnational corporations in developing
countries is a good illustration of this. In the 1980s and 1990s, major hotel chains established
subsidiaries, for example, in Latin America (Mexico, Costa Rica and Panama) and in the
Gomes L., Ramos Silva J., Regional Science Inquiry, Vol. VI, (2), 2014, pp. 39-55 40
Caribbean (Dominican Republic and Cuba), where they installed large resorts, combining the
multiple supply of leisure and entertainment services including marinas, golf courses, SPAs,
among others. Subsequently, in order to diversify their activities and to offset the seasonal
effects of tourism, these international hotel networks began to serve not only tourism demand
but also increasingly residential purposes, especially in places of relative accessibility, and not
far from big cities and airports.
In their process of global expansion, hotel chains have generally opted to adopt contract
agreements such as management and rent contracts, franchising and, in some cases, joint-
ventures. Moreover, the kind of contract changed depending on the origin of the company and
its strategy. Recourse to franchising has most commonly characterized US companies when
compared to their European peers, and this practice has contributed to the supremacy of the
former in the world hotel industry. In turn, the international expansion of European hotel
chains favored participation in the ownership of foreign subsidiaries, mainly in developing
countries. More recently, however, they also began turning to non-equity mechanisms to
expand their internationalization processes. According to the World Tourism Organization
(WTO, 2011), 42% of European hotel chains operate abroad through franchising, 33% by
property, and 25% by management contracts. Hotel networks in the leisure segment make less
recourse to franchising than those oriented to urban and business tourism.
In Brazil, US and European international hotel chains launched operations during the
1970s,1 and were mainly located in the Southeast region in the cities of São Paulo and Rio
de Janeiro, the biggest business centers. Later, they expanded to Curitiba, Belo Horizonte,
Porto Alegre, and some cities in the inner regions of São Paulo state. At this stage, we are
referring to such hotel chains as Hilton and Holiday Inn (São Paulo), Sheraton (Rio de
Janeiro), and Le Méridien (Rio de Janeiro and Salvador). In the 1980s, they began opening
establishments in other Brazilian regions, most notably in coastal cities and areas with
projects clearly oriented towards leisure and tourism purposes. In the following decades
(1990/2000), other international hotel networks entered into the sector, often resulting from a
combination of interests with different origins such as institutional investor funds,
construction companies, and real estate agents, which began to significantly finance and
participate in the expansion process. Furthermore, the trend towards the construction of
tourist-residential complexes became clear in the early 2000s (Assis, 2003).
Within this context, the state has increasingly acted as a catalyst of policies favorable to
the expansion of tourism through territorial planning, marketing and promotion. Moreover, in
the last decades of the 20th century, as argued in the next section, the idea that tourism could
prove a road to prosperity in developing countries and regions gained ground in policy terms,
provided that some comparative advantage existed. In Brazil, the essence of this policy was
translated into the National Tourism Plan (PLANTUR – “Plano Nacional de Turismo”, 1992).
In the Northeast, the region with the lowest GDP per capita but with clear potential for
tourism, the Northeast Tourist Development Program (PRODETUR/NE, launched in 1991,
and with several subsequent revisions), was the framework under which the guidelines
necessary to promoting the sector were designed. Hence, broadly speaking, there was a
convergence between the hotel network internationalization process and the outwardly
orientated national policies which attributed a significant role to the tourism industry sector.
In the 1990s, several US and European hotel chains, specialized in the “sun and beach”
segment, began a more intense process of internationalization and deploying different
strategies, including the Spanish groups Iberostar and Sol Meliá, the French Accor, and the
Notes 1 The first establishment was opened by Hilton Hotels (1971), however, by the late 1970s, other US hotel networks
had subsidiaries such as Intercontinental Hotels Group (which runs several brands, presently seven:
Intercontinental Hotels & Resorts, Holiday Inn Hotels & Resorts, Crowne Plaza Hotels & Resorts, Holiday Inn
Express, Holiday Indigo, Staybridge Suites and Candlewood Suites), and the Sheraton and Marriott
International oriented to the urban market segment. With regard to European companies, the Accor group
pioneered the leisure segment in Brazil with the 1971 inauguration of the Club Med in Itaparica (an island near
to Salvador).

Gomes L., Ramos Silva J., Regional Science Inquiry, Vol. VI, (2), 2014, pp. 39-55
41
US Marriot, and this time not only investing in Central America and the Caribbean, but also
in South America. By the turn of century, and more clearly throughout the early 2000s,
international hotel networks concentrated their investments on the Northern Coast of Brazil,
particularly in the states of Bahia, Ceará, Rio Grande do Norte and Pernambuco. This
expansion was orientated towards the construction of tourist-residential complexes, and
underlies new politico-institutional arrangements, strategic alliances between economic
agents, increasing land valuations, and changes in the forms of urbanization. After the late
1990s, in this part of Brazil, such a process involved mainly Portuguese and Spanish hotel
networks and, to a lesser extent, groups from other nationalities. Indeed, as underlined by
Williams (2006), responding to increasingly complex demands of consumers (for example,
due to their heterogeneity), international hotels and tourist resorts have to enter in less known
and distant areas, and use new forms of exploration. The analysis of this internationalization
process, with a focus on Spanish and Portuguese hotel groups and their expansion into the
Northern Coast of Bahia is the main subject of the present paper. It is worth noting that
Brazil’s successful bidding for such sports events as the FIFA Football World Cup (2014) and
the Rio de Janeiro Olympic Games (2016), although not particularly focused on this region,
endow even more relevance on such issues insofar as the country contemporarily enters a new
stage in “event tourism” on a world scale (Getz, 2008), and has a lot to learn from other
experiences (Jordan et al., 2010).
This introduction is followed by an overview of the literature that explains the
internationalization of hotel networks in light of tourism development where we distinguish
between diverse theoretical contributions. Afterwards, we detail the main aspects of the
methodology, the sample of corporations surveyed, and the research questions guiding our
study. The subsequent section presents the institutional and economic framework of the
internationalization of Spanish and Portuguese hotel networks to Brazil, and specifically to
the Northern Coast of Bahia. In other section, a better knowledge on the sector under analysis
is provided, and some new patterns in hotel network internationalization are highlighted. The
main findings of the research and particularly the discussion of the survey results of the
corporate executives that participated in our study are the core of the following section.
Finally, the most relevant conclusions stemming from the previous analysis are summarized
and some topics for future research are advanced.
2. Literature survey
Although we focus on the internationalization process of tourism sector hotel networks
from the perspective of their business strategies in connection with development policies, this
paper bridges a juncture in which we have to consider several other theoretical contributions.
Let us first refer to economic geography. An important underpinning of policies in this sector
was raised by Christaller (1963): with reference to the theory of central places,2 this author
argued that in contrast with manufacturing, for example, tourism activities tended to be
located in the periphery. Thus, with the presence of comparative advantages for tourism in
laggard and distant areas there was a large space to be explored within the objective of
bringing about their development. This did not go without criticism, as underlined in the
following passage:
The international tourism sector has indeed enjoyed prolonged, rapid growth in many
areas of the South during the postwar period. However, there are also a number of
common problems that have been linked to Third World tourism which call into question
its usefulness as a component of development strategies. These include foreign
domination and dependency, socioeconomic and spatial polarization, environmental
2
“Central places” is a relevant theory in terms of economic geography focusing on the spatial concentration of
economic activities, notably foreign direct investments; for an application at the global level, see Cechella et
al., 2012.

Gomes L., Ramos Silva J., Regional Science Inquiry, Vol. VI, (2), 2014, pp. 39-55 42
destruction, cultural alienation, and the loss of social control and identity among host
communities. (Brohman, 1996, p. 48)
In spite of their interest, as referred to earlier, we do not concentrate on most of these
issues within the context of this paper. Nevertheless, due to the increasing weight of tourist
activities in economic structures, the process remained controversial and has attracted much
attention from several perspectives. As a consequence tourism and hospitality developments
became further scrutinized, and particularly at the planning stage, as regards among other
aspects environmental and cultural protection (WTO, 1999), sustainability (Torres-Delgado
and Palomeque, 2012, pp. 5-6), and corporate social responsibility (Holcomb et al, 2007).
Due to the lack of resources and lesser experience, some of these issues are highly relevant
for the case of developing countries. However, in a study on Thailand, Wattanakuljarus and
Coxhead (2008) present a balanced analysis of the implementation of tourism policies from
the income distribution perspective with the authors recognizing that certain layers of already
favored social groups, like proprietors of land apt for tourism purposes, do benefit more but
this development simultaneously causes deeper structural effects in the domestic economy –
strengthened through backward and forward linkages –, than for example cases of the “Dutch
disease” type.
Another direction of this research relates to the hotel network internationalization
strategies, particularly as far as entry modes are concerned. As pointed out in a seminal paper
by Contractor and Kundu (1998), there is a variety of entry modes in the field, and these
companies have commonly internationalized through direct investment (mergers &
acquisitions and greenfield investments), but also deploy mechanisms such as management
contracts, franchising, and other contract agreements. In spite of these different forms of
internationalization, the control of hotel networks over their subsidiaries is not in general
questioned in so far as they have intangible strategic assets such as brands and worldwide
booking systems. Indeed, more recently, the biggest tourist groups, particularly hotel chains,
privileged recourse to mechanisms that do not involve participation in the capital of their
partners in host countries with this strategy stemming from certain particular factors as
underlined by CEPAL (2008, p. 154):
The main competitive advantages of tourist corporations, particularly in the hotel
industry, are supported by certain intangible assets such as global brand
recognition, access to global booking systems, and business know-how.
The majority of these intangible assets may be separated from tangible assets
such as buildings, equipment and others, and protected through contracts and other
legal mechanisms. This facilitates the reaching of agreements over management,
rent, and franchising without the need for actually owning real assets abroad.
Another important characteristic underlying our specific case must be highlighted: the
linguistic and cultural proximity that frame the investments of Spanish and Portuguese hotel
networks in Brazil. Indeed, these dimensions, particularly language, are often neglected in the
research (Marchan et al., 1997). In the case of Portuguese hotel groups, according to a study
by Breda (2008), their internationalization began in the 1990s, and at this stage the main
destinations of their investments were member states of CPLP – the Community of
Portuguese-speaking Countries, such as Brazil or African countries, including Angola,
Mozambique, Cape Verde, and São Tomé and Príncipe. Moreover, surveys conducted by
Breda (2010) of the sector’s corporate representatives demonstrated that the main motives
behind the decision to invest abroad were linked to internal company issues, and including
prior knowledge on these markets, the need for growth, leveraging existing firm experience
and relational aspects such as accompanying their clients. Dimensions external to the firm
also need taking into account in so far as the domestic market was too small to guarantee their
sustained growth alongside the great potential for tourist destination growth in countries with

Gomes L., Ramos Silva J., Regional Science Inquiry, Vol. VI, (2), 2014, pp. 39-55
43
linguistic and cultural ties, and where Brazil represents the best example.3 It is important to
note that these tourist sector investments followed a substantial increase in the economic
relationships ongoing between Portugal and Brazil as from the early 1990s (Silva, 2002), and
more intensely at the level of foreign direct investment (FDI) in 1996-2001.4 A similar broad
process of investment occurred between Spanish firms and Latin American countries sharing
the same language (Toral, 2006). Although Spain has a different language from the host
country, a study led by Costa (2005, p. 263), applying the index created by Kogut and Singh
(1988), on the basis of data provided by Hofstede (1980) regarding proximity/distance among
national cultures, showed that Spain reports a closer cultural proximity to Brazil than even
Portugal. We would note that, as argued by some authors (Bergeijk, 1996; Silva, 2001), under
the effects of globalization driving the freer circulation of goods, services and factors, the
linguistic and/or cultural affinity among nations gains greater influence in the direction of
trade and investment flows. Of course, this does not mean that there are no risks at all of the
“paradox of psychic distance” in such environments.5
3. The methodological approach, the sample and research questions
As a sector in which Spanish and Portuguese economies display comparative advantages,
the postwar expansion of tourism gradually stimulated the emergence of Iberian hotel groups
reasonably sized and with some competitive capacity on a global scale, regardless of the
obvious asymmetries between both economies and tourist industries. Indeed, multinational
companies from small countries, and this is particularly the case of Portugal, tend to be
successful in those few niches where they attain competitive advantages (Oladottir et al.,
2012). Taking the previous consideration into account, this paper is part of a research project
focusing on the internationalization Spanish and Portuguese hotel networks on the Northern
Coast of Bahia (Gomes, 2011), without neglecting the broader context of the Northeast
Region and of Brazil as a whole, emphasizing analysis of FDI and other entry modes to the
internationalization strategies of firms, and their impact on regional development.
Several sources and methods were incorporated into our research: bibliographic
references, documents and direct enquiries to the corporate executives actually involved in the
process even if their investments came at different stages as explained later. All three sources
prove relevant, however, within the scope of studying the concrete dimensions of the interface
between investing firms and their local “shareholders”, the direct enquiries to the
corporations’ executives played a key role in this research. As in many other works on the
internationalization of corporations, qualitative research is quite necessary to the
improvement of our knowledge of the process. Within this context, the case study proves a
valuable methodology in its own right, and defined as a “research strategy that examines,
through the use of a variety of data sources, a phenomenon in its naturalistic context, with the
purpose of ‘confronting’ theory with the empirical world” (Piekkari et al., 2009, p. 569). The
interviews, as previously underlined, reveal aspects of the direct experience of participants
that cannot otherwise be obtained (Creswell, 2007).
In pursuit of our research objectives, we visited the head offices of hotel corporations with
interests on the Northern Coast of Bahia in Portugal (Lisbon and Algarve), and Spain (Palma
3 For a theoretical foundation of this relationship from the point of view of a common language (easier
communication, creation of linguistically segmented markets, etc.), and its relevance within the context of
globalization, see Silva, 2001.
4 For a more detailed view of this bilateral process, see Silva, 2005. Differently to the previous waves of foreign
direct investment in Brazil, with the privatization program helping in the late 1990s, the process was
characterized by a large penetration of foreign capital in the services and infrastructure sectors (Silva and
Fernandes, 2003), following a more general pattern (UNCTAD, 2004).
5 According to this paradox (O’Grady and Lane, 1996), in supposedly similar linguistic and cultural foreign
environments, firms tend to prescind from careful analysis of the market reality (often actually quite
different!), creating the conditions for a high rate of failure, particularly in the initial steps of their entry.

Gomes L., Ramos Silva J., Regional Science Inquiry, Vol. VI, (2), 2014, pp. 39-55 44
de Mallorca) as well as their subsidiaries in Brazil, where the interviews with representatives
took place. Four Portuguese groups (Pestana, Vila Galé, Tivoli Hotels & Resorts, and Reta
Atlântico Brasil) and four Spanish groups (Iberostar, Fiesta, Singlehome and Invisa
International) were directly surveyed on different angles of their Brazilian experience. The
questionnaires were focused on the internationalization strategies of firms, the factors driving
their decisions, their integration into a new environmental, economic and socio-cultural
landscape, the obstacles and supports found, and the advantages and disadvantages of
investing in Brazil.
Although the number of our interviewees was not high, we gained valuable insights into
the Iberian hotel network internationalization process and enabling the clarification of several
questions related to tourism developments in Brazil and its Northeast Coast, most notably
their gradual association with residential resorts to amplify the business benefits but also
enabling the identification of their predominant entry modes in Brazil as well as answering
questions such as: Did these entry modes follow or differ from the global pattern of
international hotel chains? How is their internationalization financed? Which are the main
support institutions in Brazil? How do they seek to optimize their presence and results in the
host country? Our research establishes the foundations for more solid and accurate responses
to these and other related issues, more specifically as far as concerns the Northern Coast of
Bahia, while this study might also lead not only to greater knowledge on the process, but also
to improved policies and better practices.
4. The institutional and economic background of tourism expansion in Brazil and
along the Northern Coast of Bahia
In the 2000s, a conjunction of factors proved determinant to the internationalization of
Iberian hotel networks in Brazil. First, the European market had become saturated,
compromising the need for company growth. Second, the very favorable conditions, in
relation to previous decades, that prevailed in the Brazilian economy with the consolidation of
macroeconomic stability brought about by the Plano Real (1994), characterized by, among
other aspects, the control of inflation, a trend towards a reduction in interest rates, and less
currency volatility (implying less uncertainty in the international operations). Third, and more
structurally, it is important to recall that, in Brazil generally, and in the areas under analysis
specifically, there were major properties of land yet to be explored and available for purchase
at rather competitive prices.
Within the context just described, the Brazilian Northeast Coastline, and particularly, the
Northern Coast of Bahia (see Figure 1; the state of Bahia is in the bottom right), also
designated “Costa dos Coqueiros”,6 became a preferential region for investment, notably, by
Spanish and Portuguese hotel networks and real estate groups. We would highlight that,
according to Holanda and Magalhães (2012), across the Northeast Region, the state of Bahia
concentrates most of the FDI inflows, and its Northern coast hosts some of Brazil’s leading
tourist destinations, such as Praia do Forte.
6
This coast is 192 km in length, considering the distance from the Northern limit of the city of Salvador, capital of
Bahia state, to the border with the state of Sergipe - SE, and as a part of Bahia is integrated into the Northeast
Region of Brazil. “Costa dos Coqueiros” contains landscapes of great natural beauty, and is also a sensitive
region from the ecological point of view. Indeed, it has large and diversified eco-systems in a good state of
conservation, like lagoons, river estuaries, mangrove forests, dunes, wet areas, animal and vegetal endemic
species (for example, there are turtle reproduction sites).

Gomes L., Ramos Silva J., Regional Science Inquiry, Vol. VI, (2), 2014, pp. 39-55
45
2003 2004 2005 2006 2007 2008 2009 2010
Banco do Brasil
738,504
693,590
1,081,238
1,155,857
1,420,880
1,776,142
2,326,099
2,327,182
Caixa Econômica
Federal
244,399
403,045
680,821
817,498
986,630
1,456,136
2,977,942
3,913,741
BNDES
57,259
43,166
91,353
68,497
66,644
62,351
82,427
132,603
Banco do
Nordeste
48,416
42,457
109,377
122,924
79,400
243,076
140,231
242,715
Banco da
Amazônia
5,746
14,145
15,985
5,131
16,434
53,809
57,704
62,369
Total
1,094,324
1,196,353
1,978,774
2,169,907
2,569,988
3,591,514
5,584,403
6,678,610
Figure 1 – The Northern Coast of Bahia – “Costa dos Coqueiros”
Source: Ministério do Desenvolvimento Agrário, IBGE
Taking into account the policies implemented under the framework of PLANTUR, we
must emphasize how the expansion of tourism in Brazil really only became viable due to a
substantial increase in public investment led by several federal financial institutions aiming to
endow regions with basic and tourist infrastructures. For example, as observed in Table 1,
these institutions financed tourism related investments with only R$ 1,094 million in 2003,
but which rose to R$ 6,678 million in 2010, with Banco do Brasil and Caixa Econômica
Federal the most significant sources of financing.7
Table 1 - Outlays of federal financial institutions on tourist sector projects in Brazil, 2003-2010
(thousand R$)
Source: MTUR, 2011
This public spending took on particular importance to attracting foreign capital. In the case
of the Northeast, the strengthening of links with Portugal and Spain also resulted from actions
deliberately carried out by the private and public sectors designed to promote the region, as
clearly underlined in the following passage:
After the second semester of 2004, entrepreneurs and public managers of the
Northeast united and led a campaign to attract foreign investors through the exhibition
of the potential of Brazilian Northeast both as an auspicious destination and a good
7 In recent years, the exchange rate between the Brazilian Real and the USD has been highly variable. Thus,
whenever the amounts were not provided by Brazilian sources in US dollars, we left them in R$. For a possible
conversion: in the complete year of 2011 (the average bilateral exchange rate at the beginning and at the end of
2011), one USD was worth R$ 1.771, and conversely one Real 0.565 in USD terms.

Gomes L., Ramos Silva J., Regional Science Inquiry, Vol. VI, (2), 2014, pp. 39-55 46
return for real estate investments. Initially, the focus was on the second residence or
residential tourism market, a dimension that had proved to be promising in Europe,
notably on the Spanish and Portuguese coasts. These actions basically involved
participation in international real estate fairs in Lisbon, Madrid, Barcelona, and
Paris. Within two years the extremely high return on these initiatives led to the
founding of the Associação para o Desenvolvimento Imobiliário e do Turismo no
Nordeste (ADIT: Association for the Development of Real Estate and Tourism in the
Northeast). Presently, the Brazilian Northeast is one of the places with the greatest
flows of foreign investment into the real estate and tourism sector in South America,
including hosting the largest event in this sector in Brazil, Nordeste Invest (ADIT,
2010).
In order to leverage synergies, the project backers worked in an organized way and in
coordination with several institutions set up to develop tourist and real estate businesses in
Brazil. Among these business and managerial organizations, the following entities played
keys roles: ADIT – Brasil/NE, and the two chambers of commerce, the CPCB (“Câmara
Portuguesa de Comércio no Brasil”) and the COECB (“Câmara Oficial Espanhola de
Comércio no Brasil”). The tourist sector thus became a priority to the state’s government,
emerging as a key vector for regional economic development in their respective political
programs.8 As underlined by Hsu et al. (2012, pp. 478-479) for China’s hospitality
development, these political ties are “critical resources” in countries where the government
has a considerable power, and are helpful in dealing with bureaucracy, reducing uncertainty,
and improving the legitimacy of firms, although they may also raise other problems as
referred to below.
In the case of Portuguese firms, we would also draw attention to the gap between the
upsurge in their Brazilian investments in the second half of the 1990s across the most diverse
areas (from infrastructures to telecommunications, banking, retailing and other services; Silva
et al., 2003),9 while those in the hotel sector only gained momentum after 1999, i.e., with the
change in the exchange rate policy (in January, 1999) that led the Brazilian Real into a period
of weakness and strong depreciation that lasted until 2003 (Silva, 2007, p. 92). This delay was
likely due to the scarce financial resources available for Portuguese hotel networks that, under
these new circumstances, seized the opportunity in the years between 1999 and 2003. In a
study undertaken by ICEP (2005, p. 22), in late 2004, 61 firms of Portuguese origin were
found in the hotel sector (10.4% of total Portuguese firms in Brazil).
From the general theoretical point of view, either for Portugal or Spain, we would note the
importance of this search for deeper relationships with hotel companies of these origins by
their Brazilian counterparts in conjunction with some underlying rationality. Indeed, as
highlighted by Lin (2009, p. 37), in the catching up process, countries that lag behind may
learn more from those that are ahead, but where the distance is not so greatly accentuated, and
this certainly also applies to the industry under analysis.
It is worth noting that the expansion of tourism has evolved very heterogeneously
throughout all the Northeast Coast due to factors deriving from different economic,
administrative and politico-institutional conditions. In particular, the politico-institutional
environment associated with the mobilization of private sector associations, and the
PRODETUR/NE investments proved decisive in generating the present stage of tourism
development in the Brazilian Northeast. The states of Bahia, Ceará, Pernambuco and Rio
Grande do Norte were strongly leveraged by the PRODETUR/NE investments. These states
host the most important airport infrastructures so inherently necessary to the expansion of the
8 In addition, as referred to in Silva (2012), during the last decades, the attraction of FDI became a major regional
policy instrument.
9 In contrast with the hotel sector, some of the biggest investments of this period, such as those by the two main
Portuguese distribution groups, Jerónimo Martins and SONAE Distribuição, had no sustained sequence, and a
few years later the parent companies disinvested.

Gomes L., Ramos Silva J., Regional Science Inquiry, Vol. VI, (2), 2014, pp. 39-55
47
tourism and residential leisure resorts (Forsyth, 2006). The Northeastern states, particularly
Bahia and Ceará, where there is the greatest cluster of Portuguese hotel network investments,
is also where the CPCB located its main headquarters throughout most of the 2000s (Gomes,
2011). The CPCB has proven very active in promoting this kind of transaction between both
countries and through initiatives such as marketing and advising on bilateral trade, and
providing incentives nurturing the development of business and economic ties between
Portugal and Brazil; organizing meetings, seminars, conferences, rounds of tourist and real
estate business fairs, entrepreneurial missions aiming not only to deepen reciprocal economic
relations but also tourist, cultural, technological, and other forms of exchange.
5. New patterns of hotel networks internationalization
The internationalization of hotel corporations not only increased significantly after the
1990s but also deepened and diversified its forms. This is particularly true as far as concerns
the distinction referred to earlier between tangible and intangible assets. Many hotels in
different regions around the world operate under the name of a brand (“branding”), but only a
small fraction of the properties belongs to the transnational corporation owning the brand; in
some cases they rent properties from local hotel owners through an on average 20-year
management contract subject to automatic renewal. Therefore, local investors without
experience in hotel management own the properties, and construct the establishments that are
then managed by the transnational firm. On the Northern Coast of Bahia, in the early 2000s,
one case illustrates this reality well, the financing of the Costa do Sauípe Hotel Complex by
PREVI, a pension fund belonging to Banco do Brasil employees, and Odebrecht, a
construction group and owner of the real estate plot. After construction, the establishment was
rented out for a 20-year period by three international hotel chains: Sofitel-Accor, Marriott,
Superclubs Breezers. Later, in 2008/2009, these groups broke the contract with PREVI, which
has in the following years managed the complex, while simultaneously attempting to attract
buyers.
This change in the focus of analysis on how the internationalization of firms takes place is
important not only for the case of hotel networks but also in theoretical terms. Indeed, much
of the international business literature on the subject was basically concentrated on the two
most important forms of FDI: greenfield investments, and mergers & acquisitions. The
passage to a process where intangible assets are clearly separated from tangible assets, with
usage of the former requiring much less FDI as such and even potentially no FDI as
conceptually defined by international organizations such as the IMF and OECD (Head, 2007,
pp. 4-5), but under contracts imposing close monitoring (from the quality point of view, for
example) and other forms of supervision, generally requiring sophisticated and demanding
management.10
The entry modes approach, accepting a much broader range of
internationalization strategies (Root, 1998), provides a more comprehensive understanding of
the various dimensions to this process. This is highly relevant in the case of hotel networks,
where display no single, standard form (Contractor and Kundu, 1998, p. 353). This does not
mean that most of the FDI literature is unimportant to the study of hotel corporations because
these changes also correspond to natural evolutions in the paths leading to internationalization
(Dunning, 1995; Dunning and Lundan, 2008).
Pursuing our analysis of the forms of internationalization, we would stress how, within the
context of rising levels of competition, hotel networks have adopted different strategies with a
view to securing their positions in national and international markets. Among these strategies,
we must consider those characterized by Buades (2006), as the predominant forms of
association of tourist transnational corporations:
10
As noted by Grant (2008), for licensing arrangements “key considerations are the capabilities and reliability of
the local licensee. This is particularly important in licensing brand names, where the licenser must carefully
protect the brand’s reputation” (p. 375).

Gomes L., Ramos Silva J., Regional Science Inquiry, Vol. VI, (2), 2014, pp. 39-55 48
a) vertical integration, when the company absorbs firms that cover all areas of the
tourism business sector;
b) horizontal integration, when several firms in the same sector merge or form
associations to gain scale and power in the market;
c) conglomerates, which derive from the association of firms from different sectors in
order to optimize their financial capacity and to reap benefits from that process.
The integration of hotels and large real estate projects, civil construction enterprises, and
financial institutions greatly reinforced the tourist industry. The latter institutions ended up
crucial to project viability. This new model that brought together real estate capital, financial
institutions and hotel networks would tend to promote greater synergies between different
national economies in comparison with the “all inclusive”
model,11
which reflects the
characteristics of an enclave. Strategic alliances between corporations are dominant in the
tourist business sector (especially in the context of the trinity: hotel networks, real estate
sector, and investor funds – financial institutions) insofar as they drive the emergence of new
investment mechanisms and management by different actors seeking to enlarge their scale. A
good example of this is the development of the Real Estate Investment Trusts (REITs), which
underlie different forms of investment on the basis of real estate investment funds associated
with the capital market and the stock exchange. In a study on their comparative risk-return,
Kim and Jang (2012) show the increasing importance of REITs for the financing of the hotel
corporations’ projects since the early 2000s. Additionally, as their market power increases,
these corporations may more easily benefit from public concessions like tax breaks (Buades,
2006). Such a strategy has been successful in the hotel and residential sectors and represents
one of the most important means through which tourist transnational corporations finance
their projects in Europe, the Caribbean, and Brazil.
6. Spanish and Portuguese hotel groups on the Northern Coast of Bahia: results and
discussion
A brief presentation is necessary to outline the dimension of hotel groups and the
associated real estate sector on the Northern Coast of Bahia and their prospects in the
short/medium term. Taking the year of 2010 as our reference, 23 hotel and real estate
establishments (including luxury resorts and residential condominiums) were on course at
several different stages: five in operation, ten under licensing, and eight in the project
planning stage. According to SETUR (2011), the total amount of private investments in the
sector, already concluded or still in construction in “Costa dos Coqueiros” was approximately
US$ 399 million, corresponding to 6,321 UHs (rooms) during the last twenty years. The
SETUR (2011) prediction through to the end of 2014 was that US$ 462.676 million would be
invested in 6,328 UHs (rooms), i.e., a total investment of US$ 861 million, representing
12,649 UHs (rooms). These investments are destined to the construction of hotel
establishments with a real estate component, constituting tourist residential complexes;
however, in 78% of the establishments that are still in the licensing or project stages, the
residential unit numbers are well above the hotel units. Figure 2 portrays the breakdown of
foreign participation in these investments, even if a significant part is only planned; Spain and
Portugal are by far the most important sources of investments, Italy represents 5% and others
(Belgium and France) with only 1%.
11
“All inclusive” is a model of stay in hotels and resorts that includes in the tourist package not only
accommodation but also food, drinks, and eventually other services except for SPA treatments.

Gomes L., Ramos Silva J., Regional Science Inquiry, Vol. VI, (2), 2014, pp. 39-55
49
Figure 2: Actual and planned international investments up to 2014 in the tourist and hotel sector
- Northern Coast of Bahia
Source: SETUR, 2011
The Spanish Iberostar and Fiesta hotel groups already operate in the region, since 2005 and 2010 respectively, whilst all others are still in the licensing and planning stages, as is the case with Trusam Bensal do Brasil, Sol Meliá, Singlehome, Prima Inova, and Invisa International, among others. With regard to the Portuguese groups, Vila Galé SA and Tivoli Hotels & Resorts began operations in the coastal strip of the municipalities of Camaçari and Mata de São João in 2005 and 2008 respectively. The Pestana group is another major actor in the Portuguese camp, however, targeting the urban segment of the sector and thus implementing a different strategy to the previous groups. Nevertheless, in 2008/09, the group also managed the hotels (“pousadas”) of the “Costa do Sauípe” complex, a case referred to in the previous section, but later transferred this management to the owner (PREVI). In addition, strengthening its urban orientation (for example, the group already managed since 2005 the Hotel-Pousada “Convento do Carmo”, in the historical quarter of Salvador), in 2010, Pestana inaugurated, through greenfield investment, the first tourist-residential complex in the city of Salvador, the Pestana Bahia Lodge Residence, more precisely located in the central Rio Vermelho neighborhood.
Another Portuguese group surveyed was Reta Atlântico – Brasil. This represents an interesting case as, almost unknown in Portugal under this designation, the group’s history dates back to 1999 and resulting from the union and common interests and strategies of several civil construction firms: Rufinos, Edipril, Tecniger, and Instalotécnica. In 2007, the group concluded the first phase of the establishment Reserva Imbassaí on the Northern Coast of Bahia, featuring a hotel with 350 “all inclusive” apartments, three residential condominiums (177 units), a shopping center, and a nautical center. The second phase includes the construction of an ecological resort with 240 apartments, residential condominiums (160 units), and another shopping center. For the third phase, the construction of more residential condominiums is planned, a “condo-hotel”, a golf course, and an equestrian center.12 After the construction of the first phase, Reserva Imbassaí was sold by Reta Atlântico to the Spanish group Fiesta Hotel & Resorts, which has managed the complex since 2008.
During their expansion in Brazil, Portuguese hotel networks have thus adopted different strategies aimed at reinforcing their market positions. The entry modes mostly deployed by these groups in the first stage were management contracts, the management of assets, and
12 Information sourced from www.institutoimbassai.org.br

Gomes L., Ramos Silva J., Regional Science Inquiry, Vol. VI, (2), 2014, pp. 39-55 50
acquisitions. The hotel groups Pestana, Vila Galé, and Tivoli, began their entry into Brazil
through acquisitions and management contracts; however, after the mid-point of the 2000s,
there are cases of greenfield investments, a trend initiated by Vila Galé and Reta Atlântico
Brasil on the Northern Coast of Bahia. We may correspondingly assert that management
contracts facilitated the internationalization of the Portuguese hotel networks. Examples of
this are the management contracts signed between the groups Pestana (2000), Vila Galé
(2005), and Tivoli (2008) and Brazilian firms for the management of hotels in the states of
Bahia, Pernambuco, Rio de Janeiro, and São Paulo (Gomes, 2011). Furthermore, with the
deepening of their experience in Brazil, these groups became more committed with a greater
involvement of their financial resources and, in some cases, acquisitions, and expanding the
tourist – residential resorts through new investments. Vila Galé is illustrative of this general
evolution. The group was already present through acquisitions made in the Northeast
(Fortaleza/Ceará) in the beginning of the 2000s, and inaugurated in 2005, the Hotel Vila Galé
Marés (Guarajuba/Northern Coast of Bahia), later Vila Galé initiated administration under
management contracts for two hotels belonging to FUNCEF (the Caixa Econômica Federal
employee pension fund), one in the state of Pernambuco, the Eco Resort, in Cabo de Santo
Agostinho, and another in the state of Rio de Janeiro, the Eco Resort, in Angra dos Reis. In
2010, after establishing a partnership with the Brazilian civil construction firm Diagonal, the
group inaugurated the Vila Galé Cumbuco in Ceará, which has 465 residential units
distributed throughout an “all inclusive” resort, with villas and two blocks of apartments.
The corporation representatives responding to our survey detailed the main motives behind
their internationalization to Brazil as the potential for market growth, and the need to reduce
risk through market diversification. They considered the Portuguese hotel and real estate
market saturated, and heading towards exhaustion and beyond how the country has been
tremendously affected by the effects of the 2008 international financial and economic crisis
and the subsequent European sovereign debt crisis that began in 2010. They recognize the
relevance of the supports received from Portuguese institutions such as AICEP,13
the
Embassy and Consulates to their Brazilian projects as well as the significant role played by
the CPCB in overcoming obstacles on the road to installation, and refer to employer
associations and other sector groups as useful contributors to their objectives. Independent of
all these supports, they emphasize that, in their expansion, the strategic alliances established
between the tourist, hotel, and real estate sectors and the institutional investors were decisive
for the construction of new projects known as tourist residential complexes mainly orientated
towards second residence purposes. Acknowledging the externalities arising from public
investments, they also refer to the benefits of tax breaks on urban property assets (IPTU –
“Imposto Patrimonial Territorial Urbano”), and on services (ISS – “Imposto sobre Serviços”)
for a period of ten years. With regard to the disadvantages of investing in Brazil, the
representatives point to the negative impacts of red tape that cause delays to licensing
processes, particularly as far as environmental bodies are concerned, the operational costs due
to labor charges, and the complexity of the taxation system. Furthermore, they draw attention
to the fact that overly long licensing processes may lead to significant financial losses for
their firms.
In accordance with the survey responses, the internationalization of Spanish hotel
networks to Brazil was motivated by the growth potential in the Brazilian market, the need for
market diversification and resource-seeking. Similar to the Portuguese case, the Spanish
tourist market displays signs of exhaustion, and was significantly affected by the 2008 world
13
Agency for Investment and External Trade of Portugal since 2007, formerly ICEP.

Gomes L., Ramos Silva J., Regional Science Inquiry, Vol. VI, (2), 2014, pp. 39-55
51
economic crisis, and the subsequent European sovereign debt crisis. Spanish entrepreneurs
consider red tape and their lack of knowledge on the market as the main hurdles to their
internationalization to Brazil. They refer to the lack of information about procedures, norms,
and incentives, as well as the cultural differences. They also maintained close interaction with
the COECB, Embassy and Consulates, and with Brazilian institutions like employer
associations and development banks. However, from the Spanish corporate perspective, the
most important supports came from information about how to deal with bureaucratic
procedures in Brazil, and meetings with local entrepreneurs. They would also like information
on incentives, financial supports, environmental legislation and consulting to be clearer and
more precise.
We now proceed to compare the previous findings with the trends characterizing the
internationalization of hotel networks over the last two decades. As regards the main forms of
firm internationalization, Table 2 summarizes the results of our research. As far as entry
modes are concerned, the Spanish groups opted mainly for greenfield investments. The
Portuguese hotel groups have been more nuanced from this perspective and undertook
acquisitions, management contracts and also more recently greenfield investments. Their
forms of internationalization have thus been adapted to an evolving situation, possibly due to
internal changes in the firms involved, such as better market knowledge and better business
prospects. The difference between Spanish and Portuguese hotel groups seems to conform to
the following conclusion of Contractor and Kundu (1998, p. 353): “Higher equity and control
modes are preferred by companies with longer international experience and geographical
reach”. As far as cultural distance is concerned we may adopt the view of Chang et al. (2012,
p. 1160) that “scholars are still unable to depict a clear picture of the relationship of MNEs’
entry mode preference with cultural distance”. In contrasting again our two cases, however, it
may be asserted that linguistic proximity (Portugal) leads to a more “collaborative mode of
entry”.
Table 2 – Forms of internationalization according to hotel and real estate network nationality*
Forms/Nationality Spanish Portuguese Others
Greenfield investment
Iberostar, Sol Meliá, Fiesta
Hotels & Resorts, Invisa
International Hotels, Ed.
Prima, Singlehome SA,
Trusam Bensal do Brasil.
Pestana (2007) Vila
Galé (2005), Tivoli
Hotels & Resorts
(2008), Reta
Atlântico/Brasil.
---------------
Acquisitions
Fiesta Hotels & Resorts
(2008), Singlehome SA,
Trusam Bensal do Brasil.
Pestana, Vila Galé,
Tivoli Hotels &
Resorts.
-----------------
Contracts (management,
rent, and others)
Iberostar
Pestana, Vila Galé,
Tivoli Hotels &
Resorts.
-----------------
Unknown
-------------------
---------------------
Italy, France and
Belgium
* Reference to the year means the adoption of a different form of internationalization to that initially
taken. Source: Gomes (2011)
Other conclusions extracted from the enquiries to corporations’ representatives show that,
despite some differences, Spanish and Portuguese hotel networks converge in their alliances
with the construction and real estate sectors to build large tourist-residential resorts, i.e., with
a significant component of second residences, for leisure, sport and similar purposes. Also
with slight nuances, both groups of hotel networks have been supported in their endeavors by
public agencies from their countries of origin, and often replicate practices current in their
homeland. With respect to the behavior of governments, they especially appreciate tax breaks,
and other economic incentives.

Gomes L., Ramos Silva J., Regional Science Inquiry, Vol. VI, (2), 2014, pp. 39-55 52
7. Concluding remarks and agenda for further research
Taking into account the issues that have been tackled in this study, it becomes clear that
conditions were highly favorable to the internationalization of Spanish and Portuguese hotel
networks to Brazil as from the late 1990s. On the one hand, the saturation of the European
market, also meaning increased competition internally, and the need to diversify to reduce the
risks of exposure to a limited number of markets, impelled these companies into outward
looking orientations. The international financial and economic crisis, beginning in 2007 and
followed by the European sovereign debt crisis, gave even more impetus to taking such a
path. On the other hand, as described above, specific factors related to the destination country
were additionally very important, particularly the great growth potential of the Brazilian
economy in keeping with the macroeconomic stability brought about by the Plano Real
(1994), and later in association with the brighter prospects experienced by many parts of the
developing world in the first decade of the 21st century (including a significant decline in
inequality; Lustig et al., 2013).
Also, it was emphasized that the installation of these hotel networks in Brazil results from
actions jointly carried out by the government and its institutions (at the municipal, state and
federal levels) and the private sector through diverse organizations, in particular,
implementing the guidelines of PRODETUR/NE and more specifically those of Bahia
concerning the strategy established for the tourist sector. Interestingly, if we consider the
“inclusive” characteristic of socio-political developments in Brazil during the last decades
(Acemoglu and Robinson, 2012, pp. 455-460), and in light of the mass movement that shook
the main Brazilian cities in June-July 2013, accompanying the games of the Football
Confederations Cup, this alliance between public entities and private interests will likely be
more closely scrutinized in the future, i.e., more transparency and effective social benefits
will be required in the tourism and related sectors.
In their internationalization to Brazil, among other factors, the Iberian hotel groups, based
on their own experiences and track records, benefited from the comparative advantages of the
host economy, such as relatively low labor costs, and competitive land prices (it is a country
relatively abundant in land and with a long maritime coast). Moreover, this competitive
pricing of land suitable for transformation from rural soil to urban soil with corresponding
new uses (housing, services, infrastructures), made the investments much more profitable to
their owners. It is therefore not surprising that, in their projects, they increasingly opted for
residential-tourism resorts instead of exclusively tourism dedicated units. It must be added
that the initial focus was on the European market (there was an early expectation that 50% of
clients would be of this geographical origin), however, with the deepening international crisis,
the current buyers are, in their majority, Brazilians. Notwithstanding this, the construction of
high standard mega tourist residential establishments definitively puts the region onto the
world market. This process is characterized by new economic, political and social
relationships, under the aegis of those groups deriving the greater benefits from the changes
prevailing. As we have just pointed out for the case of transparency, it is, however, a dynamic
context, and conflicts arise, for example, from the environmental and sustainability point of
view, implying new arrangements between all the parties involved.
In this paper, we have dealt with the internationalization of Spanish and Portuguese hotel
networks towards Brazil, its Northeast Region, and the Northern Coast of Bahia in particular,
its main forms and institutional background. Certainly, many important and related issues
were not deepened and require further work; we refer here to three such examples. Firstly,
there are the environmental problems raised by the installation of international hotel
corporations on the Northern Coast of Bahia, a sensitive region from the ecological point of
view, and this dimension has a doubly large impact on the region and on the firms’ projects.
How to create a sustainable tourism cycle is thus one of the most relevant topics to be
explored. Secondly, it is important to ascertain to what extent the alliance between hotel
networks, civil construction groups, real estate agencies, and institutional investors does not
run the risk of driving the conditions favorable to the development of a serious “real estate
bubble” (as happened, for instance, in Spain), with its devastating effects and hence
questioning just which precautionary measures might prevent such a negative outcome?
Thirdly, we need to identify how the projects we analyzed are not reproducing the mistakes
that characterized the hyper-specialization in tourism of some coastal regions of Spain and

Gomes L., Ramos Silva J., Regional Science Inquiry, Vol. VI, (2), 2014, pp. 39-55
53
Portugal, and leading to their later disqualification, and thereby effectively and consistently
nurturing the terms and conditions for the sustainable development of tourism based on a long
term perspective in harmony with local communities and economic structures. We believe the
present study is a first step on the way to clarifying these issues.
References
Acemoglu, D. and Robinson, J.A. (2012), Why Nations Fail: The Origins of Power,
Prosperity and Poverty, Profile Books, London.
ADIT – Associação para o Desenvolvimento Imobiliário e Turístico do Brasil (2010),
available at http://www.aditnordeste.org.br, accessed June 20, 2011.
Assis, L.F.de (2003), “Turismo de segunda residência: a expressão espacial do fenômeno e as
possibilidades de análise geográfica”, Revista Território, Vol. VII No 12, pp.107-122.
Bergeijk, P.van (1996), “The significance of political and cultural factors for international
economic relations”, in C.J. Jepma and A.P. Rhoen (Eds.), International Trade: A business
perspective, Longman and Open University of Netherlands, London and Heerlen, pp. 195-
212.
Breda, Z.M.deJ. (2008), “A internacionalização das empresas portuguesas no Brasil: o caso
do sector hoteleiro”, Department of Economics, Management and Industrial Engineering,
University of Aveiro, Portugal.
Breda, Z.M.deJ. (2010), “Network Relationships and the Internationalisation of the Tourism
Economy”, Unpublished doctoral dissertation, Universidade of Aveiro, Portugal; available
at http://ria.ua.pt/bitstream/10773/1856/1/2010000691.pdf
Brohman, J. (1996), “New directions in tourism for Third World development”, Annals of
Tourism Research, Vol. 23 No 1, pp. 48-70.
Buades, J. (2006), Exportando Paraísos: La Colonización Turística del Planeta. Ediciones la
Lucena, Palma de Mallorca.
Chang, Y.-C., Kao, M.-S., Kuo, A. and Chiu, C.-F. (2012), “How cultural distance influences
entry mode choice: the contingent role of host country’s governance quality”, Journal of
Business Research, Vol. 65, pp. 1160-1170.
Cechella, C., Dentinho, T. and Silva, J.R. (2012), “World centralities for political,
demographic and market purposes”, Letters in Spatial and Resource Sciences, Vol. 5 No 2,
pp. 73-83.
CEPAL - Economic Commission for Latin America and the Caribbean (2008), La Inversión
Extranjera Directa en América Latina y el Caribe, United Nations Publications, Santiago,
Chile.
Christaller, W. (1963), “Some considerations of tourism location in Europe: the peripheral
regions – underdeveloped countries – recreation areas”, Papers XII Lund Congress,
Regional Science Association, Lund, Sweden, pp. 95-105.
COECB – Câmara Oficial Espanhola de Comércio no Brasil (2011), available at
http://www.camaraespanhola.org.br, accessed April 10, 2011.
Contractor, F.J. and Kundu, S.K. (1998), “Modal choice in a world of alliances: analyzing
organizational forms in the international hotel sector”, Journal of International Business
Studies, Vol. 29 No 2, pp. 325-357.
Costa, C.G. (2005), A Cultura como Factor Dinamizador da Economia: Os Investimentos
Portugueses no Brasil, Edições Instituto Superior de Ciências Sociais e Políticas,
Technical University of Lisbon, Lisbon.
CPCB – Câmara Portuguesa de Comércio no Brasil (2011), available at
http://:www.camaraportuguesa.com, accessed in May 5, 2011.

Gomes L., Ramos Silva J., Regional Science Inquiry, Vol. VI, (2), 2014, pp. 39-55 54
Creswell, J.W. (2007), Qualitative Inquiry and Research Design: Choosing among Five
Approaches, 2nd edition. Sage Publications, London.
Dunning, J.H. (1995), “Reappraising the eclectic paradigm in an age of alliance capitalism”,
Journal of International Business Studies, Vol. 26 No 3, pp. 461-491.
Dunning, J.H. and Lundan, S.M. (2008). Multinational Enterprises in the Global Economy,
Edward Elgar, Cheltenham/UK.
Forsyth, P. (2006), “Martin Kunz Memorial Lecture: tourism benefits and aviation policy”,
Journal of Air Transport Management, Vol. 12, pp. 3-13.
Getz, D. (2008), “Event tourism: definition, evolution, and research”, Tourism Management,
Vol. 29, pp. 403-428.
Gomes, L. (2011), “Luzes e Sombras no Litoral Norte da Bahia: Os Efeitos Territoriais,
Socio-ambientais e Económicos da Implantação das Redes Hoteleiras Espanholas e
Portuguesas”, Unpublished doctoral dissertation, Universidade Federal de Sergipe,
Aracaju, Brazil.
Grant, R.M. (2008), Contemporary Strategy Analysis (6th edition), Blackwell, Oxford.
Head, K. (2007), Elements of Multinational Strategy, Springer, Berlin.
Hofstede, G. (1980), Culture’s Consequences: International Differences in Work Related
Values, Sage Publications, Beverly Hills, CA.
Holanda, M.C. and Magalhães, A.M. (2012), “FDI in Brazil from a regional perspective”, in
W. Baer (Ed.), The Regional Impact of National Policies: The case of Brazil, Edward
Elgar, Cheltenham/UK, pp. 122-137.
Holcomb, J.L., Upchurch, R.S., and Okumus, F. (2007), “Corporate social responsibility:
what are top hotel companies reporting?”, International Journal of Contemporary
Hospitality Management, Vol. 19 No 6, pp. 461-475.
Hsu, C.H.C., Liu, Z. and Huang, S. (2012), “Managerial ties in economy hotel chains in
China: comparison of different ownership types during entrepreneurial processes”,
International Journal of Contemporary Hospitality Management, Vol. 24 No 3, pp. 477-
496.
ICEP (2005). Os Investimentos Portugueses no Brasil, ICEP, São Paulo.
Jordan, L.-A., Tyson, B., Hayle, C. and Truly, D., eds (2010), Sports Event Management: The
Caribbean Experience, Ashgate, Aldershot, UK.
Kogut, B. and Singh, H. (1988), “The effect of national culture on the choice of entry mode”,
Journal of International Business Studies, Vol. 19 No 3, pp. 411-423.
Lin, J.Y. (2009). Economic Development and Transition: Thought, Strategy, and Viability.
Cambridge University Press, Cambridge.
Lustig, N., Lopez-Calva, L.F. and Ortiz-Juarez, E. (2013), “Declining inequality in Latin
America in the 2000s: the cases of Argentina, Brazil, and Mexico”, World Development,
Vol. 44, pp. 129-141.
Kim, J. and Jang, S. (2012), “Comparative analyses of hotel REITs: examining risk-return and
performance characteristics”, International Journal of Contemporary Hospitality
Management, Vol. 24 No 4, pp. 594-613.
Marschan, R., Welch, D. and Welch, L. (1997), “Language: the forgotten factor in
multinational management”, European Management Journal, Vol. 15 No 5, pp. 591-598.
MTUR – Ministério do Turismo (2011), Anuário Estatístico de Turismo-2011, Vol. 37,
MTUR, Brasília.
Oladottir, A.D., Hobdari, B., Papanastassiou, M., Pearce, R. and Sinami, E. (2012), “Strategic
complexity and global expansion: an empirical study of newcomer multinational
corporations from small economies”, Journal of World Business, Vol. 47, pp. 686-695.

Gomes L., Ramos Silva J., Regional Science Inquiry, Vol. VI, (2), 2014, pp. 39-55
55
O’Grady, S. and Lane, H.W. (1996), “The psychic distance paradox”, Journal of International
Business Studies, Vol. 27 No 2, pp. 309-333.
Piekkari, R., Welch, C. and Paavilainen, E. (2009), “The case study as disciplinary
convention: evidence from international business journals”, Organizational Research
Methods, Vol. 12 No 3, pp. 567-589.
Reta Atlântico Brasil (2011), available at http://www.retaatlantico.com, accessed May 15,
2011.
Root, F.R. (1998), Entry Strategies for International Markets, revised and expanded edition,
Jossey-Bass – a Wiley Company, San Francisco.
SETUR – Secretaria de Turismo da Bahia (2011), Superintendência de Investimentos
Turísticos, SETUR, Salvador, Brazil.
Silva, J.R. (2001), “Language areas in the global economy”, Working Paper, nº 5,
CEDIN/ISEG/Technical University of Lisbon, Lisbon.
Silva, J.R. (2002), Portugal/Brasil: Uma Década de Expansão das Relações Económicas,
1992-2002, Editora Terramar, Lisbon.
Silva, J.R. (2005), “A internacionalização das empresas portuguesas: a experiência
brasileira”, RAE – Revista de Administração de Empresas, Vol. 45, Special Issue Minas
Gerais, pp. 102-115.
Silva, J.R. (2007), “Entre multilatéralisme et intégration régionale: la politique commerciale
du gouvernement Lula (2003-2006)”, Lusotopie, Vol. XIV No 2, pp. 87-108.
Silva, J.R. (2012), Foreign direct investment and regional policy, in R. Capello and T. P.
Dentinho (Eds.) Globalization trends and regional development: Dynamics of FDI and
human capital flows, Edward Elgar, Cheltenham/UK, pp. 163-178.
Silva, J.R. and Fernandes, F.C. (2003) “Os novos fluxos de IDE para o Brasil desde 1995”,
Prospectiva e Planeamento, Vol. 9, special issue, pp. 57-68.
Silva, J.R., Fernandes, F.C. and Costa, C.G. (2003), “Empresas e subsidiárias portuguesas no
Brasil: um panorama”, Prospectiva e Planeamento, Vol. 9, special issue, pp. 97-121.
Toral, P. (2006), “Latin America Quest for Globalization: The Role of Spanish Firms”, Quinn
Dickerson Seminar Series, Suffolk University.
Torres-Delgado, A. and Palomeque, F.L. (2012), “The growth and spread of the concept of
sustainable tourism: the contribution of institutional initiatives to tourism policy”, Tourism
Management Perspectives, Vol. 4, pp. 1-10.
UNCTAD (2004), The Shift Towards Services. World Investment Report. United Nations,
New York and Geneva.
Wattanakuljarus, A. and Coxhead, I. (2008), “Is tourism-based development good for the
poor? A general equilibrium analysis for Thailand”, Journal of Policy Modeling, Vol. 30,
pp. 929-955.
Williams, A. (2006), “Tourism and hospitality marketing: fantasy, feeling and fun”,
International Journal of Contemporary Hospitality Management, Vol. 8 Nº 6, pp. 482-495.
WTO (1999), Cooperación entre Sectores Público y Privado, CEOMT, Madrid.
WTO (2011), World Tourism Barometer, World Tourism Organization, United Nations,
Madrid.

Regional Science Inquiry, Vol. VI, (2), 2014 56

Marta-Costa A., Pinto R., Torres Manso F., Luís Tibério M., Carneiro I., Portela J.,Regional Science Inquiry, Vol. VI, (2), 2014, pp. 57-71
57
INVOLVING STAKEHOLDERS IN FOREST MANAGEMENT:
THE CASE OF MONTEMURO MOUNTAIN SITE
Alexandra MARTA-COSTA* * Corresponding author. University of Trás-os-Montes e Alto Douro (UTAD)
and Centre for Transdisciplinary Development Studies (CETRAD); Quinta dos Prados,
5000-801 Vila Real, Portugal, www.utad.pt
Rui PINTO University of Trás-os-Montes e Alto Douro (UTAD); Quinta dos Prados,
5000-801 Vila Real, Portugal, www.utad.pt,
Filipa TORRES MANSO University of Trás-os-Montes e Alto Douro (UTAD); formerly of the CIMO and currently a researcher
at CETRAD; Quinta dos Prados, 5000-801 Vila Real, Portugal, www.utad.pt,
Manuel Luís TIBÉRIO University of Trás-os-Montes e Alto Douro (UTAD) and CETRAD; Quinta dos Prados,
5000-801 Vila Real, Portugal, www.utad.pt,
Inês CARNEIRO Centre for Transdisciplinary Development Studies (CETRAD); Quinta dos Prados,
5000-801 Vila Real, Portugal,
José PORTELA University of Trás-os-Montes e Alto Douro (UTAD) and CETRAD; Quinta dos Prados,
5000-801 Vila Real, Portugal, www.utad.pt,
Abstract
One of the main impediments to a correct forest management has to do with serious gaps
in public participation and stakeholders’ involvement in drawing up and carrying out public
policies. The Natura 2000 Montemuro Mountain Site is paradigmatic of this situation. By
looking at a set of interviews conducted to several entities with ties to the forest sector in that
territory, this paper identifies their perception as regards the forest in Montemuro Mountain.
Results show both the lack of participation and communication among the various
stakeholders and the absenteeism of many forest owners as important factors conditioning
forest management.
Keywords: Stakeholders, forest management, fires, citizen participation, territory.
JEL classification: Q23, Q28
Acknowledgements:
This work was supported by the European Regional Development Fund (ERDF), through
the Competitiveness Operational Programme (COMPETE) and by national funds through the
Foundation for Science and Technology (FCT) under Grant PTDC/AGRCFL/099970/2008.
Marta-Costa A., Pinto R., Torres Manso F., Luís Tibério M., Carneiro I., Portela J.,Regional Science Inquiry, Vol. VI, (2), 2014, pp. 57-71 58
1. Introduction
Portuguese forest occupies around 67% of the territory (3,154,800 ha of forest settlements
and 1,500,157 ha of undergrowth, in 2010, Instituto da Conservação da Natureza e Florestas
[Institute for Nature Conservation and Forest] – ICNF [15], reflecting the country’s forest
aptitude. About 85% of the forest area is privately owned; as to the remaining 15%, only 3%
is the State’s responsibility and 12% are common areas (Direção Geral dos Recursos
Florestais [National Forest Services] - DGRF [9]). Eucalyptuses, cork oaks and Pines are the
dominating species.
Forest products are especially important among Portuguese exports and involve a complex
group of industries processing wood and non timber forest products, such as cork, rosin
derivatives, mushrooms, honey and aromatic plants, among others. There are about 4,500
industrial units which employ circa 260,000 people, both directly and indirectly, turning the
forest sector into a major sector of the Portuguese economy; it contributes with 3.2 % to the
Gross domestic Product (GDP); it represents 12% of the industrial GDP; and it corresponds to
11% of all Portuguese exports (DGRF [9]).
At the environmental level, the forest plays an important role, for it is an ecosystem with
unique natural habitats which ensure fauna and flora; it also contributes to soil formation
while protecting water resources and is a natural carbon sink. It also plays an important role in
climate regulation besides being a recreational and leisure space where other activities like
pastoralism, hunting and green tourism can be developed.
Despite its great value and relevance to the country’s development, and although it has
shared a common history with the populations from the beginning of times (Aguiar and Pinto
[1]), the Portuguese forest still faces a series of constraints, such as the absence of a forest
record, rural fires and the lack of forest management or the management of most wooded
areas, which hinder its sustainable development. Several attempts have been made to cope
with these constraints, but no strategy has been put forward to clearly and inclusively meet
the needs and expectations of the populations, the environment and the forest sector. A
serious gap in the citizens’ participation and in stakeholders’ involvement in designing and
carrying out public policies is still an impediment to a suitable management of all wooded
areas in Portugal (Santos et al. [31]).
The Montemuro Mountain Site (PT CON0025) reflects a scenery where most of the above
mentioned problems are to be found (Azevedo et al. [4]). It is one of the 60 sites which
compose the Natura 2000 Network National Site List, covering an area of approximately
39,000 ha, and it includes part of the municipalities of Cinfães (35%), Castro Daire (50%),
Resende (17%), Lamego (15%) and Arouca (3%) (Instituto da Conservação da Natureza
[Institute for Nature Conservation] - ICN [14]).
With a significant undergrowth area, this territory is characterized by its predominantly
forestry use. It has several especially interesting areas as far as the biodiversity is concerned
and is one of the most important habitats for the conservation of many fauna and flora species
(ICN [14]). However, year after year it has been devastated by rural fires, and is currently
threatened by a number of problems ensuing from people’s exodus from rural areas as well as
the aging of the population. Therefore, it has been chosen as a case study within a research
Project named “ForeStake: The role of local stakeholders to the success of forest policy in
areas affected by fire in Portugal”, and financed by the European Regional Development
Fund (ERDF), through the Competitiveness Operational Programme and by national funds
through the Foundation for Science and Technology (FCT). The aim of this study was to
propose an effective participation strategy of both stakeholders and their organizations and
local populations so that it can lead to a sustainable forest management, focusing mainly on
preventing and mitigating forest fires and recovering burnt areas.
This article presents the results of interviews to stakeholders operating in the forest area of
the Montemuro mountain site which were conducted at the early stage of the ForeStake
programme. The aim was to understand stakeholders’ perceptions of Montemuro forest and of
how it has been managed, and, at a later stage, compare these views to the ones shared by
local communities, making it possible to apply the knowledge thus obtained to new strategies
of stakeholders’ involvement, negotiation and mediation in forest management.

Marta-Costa A., Pinto R., Torres Manso F., Luís Tibério M., Carneiro I., Portela J.,Regional Science Inquiry, Vol. VI, (2), 2014, pp. 57-71
59
2. Forest Fires and citizen participation
Forest fires are one of the biggest calamities threatening the Portuguese forest every year.
According to recent data, in Portugal, the burnt area of forest settlements and undergrowth
rose almost to 1,500,000 ha1 in the last ten years (2001-2010) only. The increase of burnt
areas and the growing number of forest fires are partly due to socio-economic factors related
to the rural areas (Vélez [32]). In the Portuguese Plan for Prevention and Protection against
Fires (Plano Nacional de Defesa da Floresta Contra Incêndios - PNDFCI, Presidência do
Conselho de Ministros [27]), several factors are listed as direct and indirect causes of fire
such as: the rural exodus, the giving up of traditional ways of land use – including pastoralism
and other practices which contribute to the removal of wood and avoid fuel accumulation –,
the burning of agricultural residues and the controlled fires to renew pastures and the
carelessness and negligence of all those who use the forest for leisure and recreational
purposes (hunters, shooters, hikers and fishermen) – either by throwing away burning
cigarettes, by making bonfires in unsuitable places or having other risk behaviours.
Forest fires are at the basis of many problems and are definitely a serious obstacle to the
development of this territory, either because of their negative impact on the environment and
the landscape, or because of the destruction of wood material and other goods. This weakens
local and regional economies that largely depend on the sector being healthy.
It is not possible to estimate the economic, social and environmental losses of forest fires
either upstream or downstream. At best, one could obtain an approximate estimate, based on
the amount of burnt wood sold and the annual costs of fire fighting. But it would not include
other variables like burned undergrowth, the loss of soil and biodiversity, air and water
pollution and the decrease of certain tourism-related activities like hunting, restaurants and
hotels, among others.
Portugal’s state of public calamity started by forest fires in 2003 caused a change in the
legal and institutional regulation for the forest sector. In this context, several tools emerged
for forest management and prevention against fires which must be put into use. If those tools
are to be effective, communication and articulation among the various stakeholders are
essential, as it is taking their views into consideration, when designing the policies and
measures for the sector. Besides, this is in accordance with principle 10 of the 1992 Rio
Declaration on environment and development (Organização das Nações Unidas [United
Nations Organization] [25]), which upholds a better handling of environmental issues through
the participation of all interested citizens. Similarly, Nohl [24] claims that social and
emotional factors must be integrated with environmental issues so that a correct local
planning can be achieved in the future, whereby all individuals should adequately be granted
information as to the subject in question and have the opportunity to be part of the decision
making process.
However, citizen participation can take many forms. Already in 1969, Sherry Arnstein [3]
presented his ladder of citizen participation concept which includes different levels of public
involvement. The bottom rungs of the ladder are “manipulation” (non-participation) and
“therapy”, followed by “informing”, “consultation”, “placating”, “partnership” and
“delegated power”, finally reaching the top rung, “ citizen control”. In this scale, the further
up the ladder the citizens are, the more they are capable of monitoring their involvement in
participation procedures. Recently, André et al. [2] have summed up citizen participation in
three levels: passive participation or receiving of information (a unidirectional form of
participation); participation through consultation (e.g. public audiences and open meetings);
and interactive participations (e.g. workshops, negotiation, mediation and even co
management).
In this study, the authors departed from the notion of “citizen participation” as the
affirmative or negative participation of individuals and groups in a project, a programme, a
plan or a policy that is being proposed to them, involving a decision-making process (this
1 Data available at ICNF portal on http://www.icnf.pt/portal/florestas/dfci/inc/estatisticas, November 2013.

Marta-Costa A., Pinto R., Torres Manso F., Luís Tibério M., Carneiro I., Portela J.,Regional Science Inquiry, Vol. VI, (2), 2014, pp. 57-71 60
definition was suggested by André et al. [2]); therefore, it is their belief the issue of forest
fires, as well as other issues pertaining to forest management, can enlist local communities’
participation in the designing and carrying out of public policies. There is, however, a draw-
back and that is the communities’, especially local ones’, lack of decision-making clout
regarding the best strategy to follow in the matter of forest fires, which seems to impair their
participation. That participation is basically passive and the indispensable collaboration of all
stakeholders, so vital for deciding on a common path, does not take place. That means the
whole process of citizen participation is shrouded in great complexity. In order to ensure that
citizen participation has a greater probability of success, Buchy and Hoverman [5] have
identified some basic principles that should be taken into account: first and foremost,
communication must be adapted to the reality and specific circumstances it is being applied
to; secondly, all participants must be granted suitable information; finally, it must be ensured
that all interests are included in the proposals, namely the interests of the non- and under-
represented groups.
In Portugal, stakeholders’ participation in designing and carrying out forest programmes
and policies capable of developing the sector are still a recent practice. Its former conception
clearly shows a top-down logic that little by little has been being replaced by a bottom-up
process in which the various stakeholders have a word to say. Yet, as regards forest
management and prevention against fires, the legislation that has been passed more often than
not goes against the local communities’ interests, needs and expectations. This is what
happened with the spaces included in the Natura 2000 Network, the Natural Parks
Management Plans and the creation and functioning of Forest Intervention Zones (Zonas de
Intervenção Florestal - ZIF). In this regard, it is essential that social representations on forest
and forest policy be evaluated as well as stakeholders’ role in reinforcing political measures
for the sector, namely the prevention and mitigation of fires and the recovery of burnt areas,
thus allowing a better understanding of the citizen’s role in designing and implementing
successful public policies for forest areas. The aim of this project was to do just that in the
Montemuro Mountain Site.
Literature on participation or participatory processes stems mainly from two areas. The
first is rooted in political sciences and in the discussion around democracy and citizenship,
especially in the context of local and regional planning (Pateman [26], Munro-Clark [22],
Davis [8]); the second is founded on the development theory, particularly as regards the
sustainable use of the soil (Wignaraja et al. [35], Vettivel [34], Rahman [28], Nelson and
Wright [23], Chambers [7]).
3. Methodology
The study’s methodology was based on interviews to a group of Montemuro Mountain
Site stakeholders, including the representatives of some entities and organizations, as well as
individual people who work or carry out their business in the territory being studied and who
were part of the Local Follow-up Group (Grupo de Acompanhamento Local - GAL) of the
ForeStake Project in Montemuro Mountain (GAL Montemuro).
The GAL Montemuro was established during the Local Seminar of the Project that took
place in Tendais, in the municipality of Cinfães, on September 10, 2010. The purpose of the
seminar was to gather individuals and entity representatives that might act as interlocutors for
the study on the field and actively participate in the project. The group proved to be dynamic
over time and also included new stakeholders that were considered important for the territory
as others, representing certain entities and organizations, were replaced, due to the normal
restructuring and political transition that occurred in the meantime. In its final composition,
the GAL Montemuro included 24 institutions, classified as follows (see Table 1).

Marta-Costa A., Pinto R., Torres Manso F., Luís Tibério M., Carneiro I., Portela J.,Regional Science Inquiry, Vol. VI, (2), 2014, pp. 57-71
61
Table 1: GAL Montemuro
Type of Institution No.
Municipalities and Gabinetes Técnicos Florestais (GTFs, Technical Bureaus of Forestry) 4
Juntas de Freguesia (Portuguese territorial-administrative units) 5
Autoridade Florestal Nacional (AFN, National Forestry Authority) 2
Organizações de Produtores Florestais (OPF, Forest Producer Organizations) 3
Livestock associations 1
Hunting and Fishing Associations 1
Rural Development Associations 1
Entidade Gestora de Baldio (Common Land Managing Entity) 1
Autoridade Nacional de Proteção Civil (National Authority for Civil Protection) 1
Guarda Nacional Republicana (GNR, National Republican Guard) 1
Fire fighters 1
Instituto de Conservação da Natureza e Biodiversidade (ICNB, Institute for Nature and
Biodiversity Conservation) 1
Secretariado dos Baldios (Secretariat for Common Land) 1
Firms 1
Total 24
Interviews were conducted face to face, lasting on average an hour and forty-five minutes,
and they obeyed a questionnaire script with forty-two questions structured into six sections.
The first and second sections of the questionnaire were designed to characterise both the
respondent and the forest, respectively; section three included questions about forest
management practices, the Defesa da Floresta Contra Incêndios (DFCI, forest defence
against fires) and the recovery of burnt areas; section four referred the stakeholders’
participation and cooperation relationships; section five was dedicated to future forest
perspectives; and finally, section six mentioned the measures and techniques most used in the
DFCI in Montemuro Mountain Site. The pre-test to the questionnaire and the interviews to
GAL members that followed took place between 2011 and 2012 in the place of contact of
each entity. Interviews were conducted by an interviewer accompanied by observers from
UTAD’s Project team. The anonymity of the respondents and the confidentiality of their
statements were ensured at all times.
It was observed that respondents belonged mainly to “public” organizations (60%) with
only 32% belonging to the “associative” sector. The groups with the highest
representativeness were the GTFs within the purview of Municipalities (20%) and their
corresponding Juntas de Freguesia (20%). Respondents were mostly male (68%), their
average age was 43 (ranging from a minimum age of 28 to a maximum of 66) and had higher
levels of qualification (72% of the respondents).
The collected data were treated with recourse to Software Statistical Package for Social
Sciences (SPSS version 19) and subject to a frequency analysis (see the next sections),
complemented with qualitative information gathered from the respondents. The respondents’
most relevant opinions, reflections and stances are highlighted based on both the interviewer’s
and the observers’ notes and records.2
4. Stakeholders and the Montemuro forest
4.1. Montemuro Mountain: a multifunctional space
According to the respondents (68%), “undergrowth areas” predominate in Montemuro
Mountain Site, are basically used for extensive pastoralism and mostly confined to the highest
zones. The “wooded areas” (referred by 16% of the respondents), namely eucalyptus
plantations, are located in the municipalities of Arouca and Castro Daire (southern area) and
associated with valleys and slopes in the vicinity of the Paiva basin. The remaining forest
2 For more detailed information on interviews and the results of the analysis see Marta-Costa et al. [20].

Marta-Costa A., Pinto R., Torres Manso F., Luís Tibério M., Carneiro I., Portela J.,Regional Science Inquiry, Vol. VI, (2), 2014, pp. 57-71 62
areas are identified as agro-forest areas and pastures (16% of the responses). The 2005 Land Use and Land Cover Map (COS90 2005)3 issued by the Instituto Geográfico Português (Portuguese Geographic Institute [16]) largely confirms respondents’ perception, showing that there are approximately 18,000 ha of undergrowth, 5,000 ha of wooded areas and 9,000 ha of farmland.
Also according to the respondents, “wood production” (20%) and “others” (23%) are the main function of wooded areas in Montemuro Mountain Site (see Fig. 1). Pastoralism stands out among the “other” functions, with some of the respondents having referred this activity as not properly valued, neither socially nor economically and ecologically. In the words of an association leader, “(...) it is important to value people’s work, namely shepherd’s and other stakeholders’, for what they actually do on the mountain.” This aspect is also referred by several authors (Castro [6], Manso [19], Moreira [21], Rodriguez et al. [29], Santos [30], Vélez [33]).
Figure 1: Forest areas’ main functions in Montemuro Mountain Site
It is worth mentioning that the choice of “aeolian energy” is also referred as one of the “other” functions of forest areas in Montemuro Mountain Site. Respondents stress the presence of wind turbines for aeolian energy production on top of the mountain, which seems to have become a familiar landscape feature, despite opinions to the contrary that point out their excessive number and the noise they make, especially those closer to the villages.
When asked about the type of forest areas that are most suitable to the edaphoclimatic and orographic characteristics of the Montemuro Mountain Site, 28% of the respondents referred the “pine production areas” (see Fig. 2), despite the natural oak regeneration which can still be observed, although oak trees do not grow much at higher altitudes. This seems to partly reflect the strategic orientations from the four Planos Regionais de Ordenamento Florestal (PROF, Forest Management Regional Plans) that extend to the Montemuro Mountain Site. These official documents present certain areas that are suitable for pine growing, although the genus Quercus species are given particular attention, since they are considered to be the most suitable for the great majority of the territory’s spaces (DGRF et al. [11], Direção Geral de Agricultura do Entre Douro e Minho [Agricultural Directorate of Entre Douro and Minho] et al. [12] [13]; Ministério da Agricultura, do Desenvolvimento Rural e das Pescas [Ministry of Agriculture, Rural Development and Fisheries] – MADRP and DGRF [18]).
3 The approximate values result from filtering information collected through looking into the COS90 legend.

Marta-Costa A., Pinto R., Torres Manso F., Luís Tibério M., Carneiro I., Portela J.,Regional Science Inquiry, Vol. VI, (2), 2014, pp. 57-71
63
Figure 2: Most adequate types of forest areas in Montemuro Mountain Site
It should be pointed out that it was not easy for the respondents to identify which forest
species were more suitable for the Montemuro Mountain. The president of one of the Juntas de Freguesia even stated that: “(...) when one looks at the plantations that were made 15 years ago, one sees there are different solutions depending on the locations in question. In fact, ..., in a field at 400m-600m high, in a plantation whose purpose was to provide shadow onto a picnic area, it is possible to find a ‘huge Linden tree’ and some good oak trees. ..., in an ample space at 800m high, also meant for providing shade, planting was ‘difficult’ and there are only a few trees left that nobody knows: ‘I don’t know what kind of a pine tree that is, it’s not a stone pine, and it’s not an umbrella pine, either. ..., at 1000m high, there is only an oak tree left, that ‘isn’t growing any taller’. There should be a study to help decide which trees to plant here!”
For 24% of the respondents, the Montemuro Mountain Site has the necessary conditions for the creation of spaces fit for “agro forestry, hunting and fishing,” as well as “leisure and recreational activities”. These activities were also mentioned by the four PROFs integrating the Montemuro Mountain as having a high development potential in several areas of the Site.
4.2. Montemuro Forest: a forest with problems
In the Montemuro Mountain Site zone, the forest faces several different problems. According to respondents, population aging, depopulation, lack of interest for the forest on the part of local communities and the giving up of both agricultural and pastoralist practices and forest management correspond to 37% of the problems that were listed, making the rural fires’ negative trend seem even more serious (see Fig. 3). “Other” bottlenecks (21%) affecting Montemuro Mountain Site forest were also referred, such as “too many wind turbines”, “few financial resources to invest on the forest”, “incipient common land management ”, “surplus of goats”, “failure to value shepherds’ work” and “too many eucalyptuses and pines”.
Forest fires, at the top of the responses regarding Montemuro forest’s problems, may be caused by the controlled fires shepherds and hunters light in order to renew the pastures and scare away the game, respectively. Setting and causing fires is, naturally, a delicate subject. Identifying alleged arsonists was met with reserve and uncertainty among respondents and led to contradictory statements. In fact, while one President of a Junta de Freguesia remarked that “(…) it’s not the cow shepherds’ fault!”, the leader of a regional public entity immediately pointed out that “(…) goat shepherds are the main responsible for fires in that area. But it is understandable! What should be done was to contact them, gather them and make them aware of a correct use of fire.” Another respondent mentioned that in 2010, thirteen arsonists were detained on the Montemuro Mountain and none were shepherds. They were people with mental disorders, who “(…) enjoy watching the mountain burning, listening to the sirens and seeing the firemen and the helicopters in action” (GNR); or locals taking revenge on their neighbours; or even people suffering from alcoholism. According to some respondents, fire is important for pastoralism, which means that “(…) if controlled fires were used in articulation with shepherds, the latter would not feel the need to do it themselves.” (AFN).

Marta-Costa A., Pinto R., Torres Manso F., Luís Tibério M., Carneiro I., Portela J.,Regional Science Inquiry, Vol. VI, (2), 2014, pp. 57-71 64
Figure 3: Main problems affecting Montemuro Mountain Site forest
Fires are a complex issue that can be linked to other aspects like fire permit periods being
too short. For that reason, the responsible for two entities suggested an exceptional regime be created for specific zones of the country, namely for the Montemuro Mountain Site: “(…) we all know that on a particular day it may not be possible to light a fire near the stream but be perfectly alright to do a controlled fire on the mountain because of the fog and all on the same day. It does not make any sense to set up a uniform fire ban to be applied to such different zones” (the president of a Junta de Freguesia). Therefore, it is only necessary to ensure the right articulation between all interested parties and the entities in charge. In this regard, it was referred by the head of a state-owned entity that “(…) shepherds are willing to listen to the proposals about territory management they may be presented. However they do not like unfulfilled promises. In Portugal, things are often outlined and discussed and then left undone. This can be very frustrating even daunting.” Furthermore, people must go to the municipality to obtain the license to do a controlled fire instead of doing it locally, which can be an inconvenience not only as regards obtaining the license but also doing the fire under good safety conditions. As the president of one Junta de Freguesia pointed out, “Nobody is going to drive 30 km to go to Cinfães just to get a license to do a controlled fire. The document may even cost only one euro, but it will cost more to get there, not to mention the trouble of having to travel. If that were done locally, the neighbours would have a saying in the matter.”
Apparently, there seems to be a certain predisposition to accept fires naturally. Different respondents, namely from GTF and from one Forest Producers Organization stated that the entities that are competent to deal with rural fires often say “...it’s no use... the mountain will always burn”, in the sense that one should not mobilize the means to combat fires when the burnt areas are not worth it. Several respondents have also mentioned a whole range of “interests” around fires, expressing their firm belief that “there is a business underlying all this”. For some, these business interests are the very causes of fires. As one so expressively put it, the situation “(…) calls for measures that pull the plug on those interests”.
Let us now look into the main cause of fire propagation in Montemuro Mountain Site according to respondents (see Fig. 4). The failure to put in place forest management best practices, such as creating and maintaining buffer zones, the lack of compartmentalised wood areas, the absence of fuel management strips and forest firebreaks along with the presence of highly combustible forest species were the causes listed by 37% of the respondents. Additionally, the fact that “undergrowth is not cleared” is referred only by a little over 25% of the respondents. The “gunpowder barrels” – a very suggestive expression used by some respondents to refer to the abundance of fuel biomass – are the consequence of there being no cattle to graze the vegetation while it is still green. Besides acknowledging the deficit of “fire fighting cattle”, some respondents do not seem to value the importance of undergrowth for rural populations. That was very clear during one of our visits, when we witnessed a fire in an undergrowth area that had been active for three days and nothing was being done besides the effort to keep it under control. As mentioned above, the aerial firefighting resources management for Montemuro Mountain Site is much rationalised. When there is no risk for the populations, neither is there a significant loss of timber, it is assumed it is not worth using a

Marta-Costa A., Pinto R., Torres Manso F., Luís Tibério M., Carneiro I., Portela J.,Regional Science Inquiry, Vol. VI, (2), 2014, pp. 57-71
65
resource that has a high cost attached. Firefighters’ inexperience is also pointed out as one of the reasons for forest fire propagation.
Figure 4: Causes of rural fire propagation in Montemuro Mountain Site
It is the respondents’ view that the main fire impacts are “the increase of soil erosion and
seepage”, probably due to their visibility. “Water pollution” and “landscape degradation” are also important. The view one has of a burnt area after the first rains have fallen is a very distressing one and brings out the loss resulting from this calamity. This is too a familiar scenario, though, for local communities. “There seems to be no environmental or ecological awareness on the part of people. For them to understand they have lost something, they must feel it or have someone show it to them”, said the head of a state-owned entity, a statement corroborated by the visual memories of most respondents. When they were asked to indicate the worst fires in Montemuro Mountain Site, they singled out the years 2003 and 2005. Those were also the worst years in terms of fires in the whole of Portugal.
Figure 5: Level of investment on forest fire prevention in Montemuro Mountain Site
In figure 5, it is possible to look at the types of investment on fire prevention considered
necessary by the respondents. In general, the answers indicate a local perception that is clearly different from the one held at other decision and action levels. The measures that have been implemented to fight rural fires have not proven to be the most suitable, according to respondents and so it is necessary to restructure investment, if a more effective prevention is

Marta-Costa A., Pinto R., Torres Manso F., Luís Tibério M., Carneiro I., Portela J.,Regional Science Inquiry, Vol. VI, (2), 2014, pp. 57-71 66
to be gained. “Forest management” is at the top of ‘great investments’, because it extends to
many areas and involves many resources for its accomplishment. Then there is “citizens’
involvement in the decisions” regarding the forest. Contrarily, most respondents believe there
should be no investment on “firefighting resources”. Also significant was the number of those
who think that “overseeing and punishing the ones who do not comply with regulations” is
not the solution to solve the problem of preventing rural fires. “Awareness and information
campaigns” need ‘some investment’, considering what has been done in this field in recent
years.
In what concerns DFCI measures, respondents think the most applied measure is the
“construction and maintenance of a forest roads network” (30%), followed by “surveillance-
related activities”, namely mobile surveillance (24%) and “reduction of shrub density”
(15%). As to DFCI techniques, the most frequently pointed out by over two thirds of the
respondents are the ones regarding the above mentioned measures, involving shrub density
reduction and the use of “mechanical, manual or motor-manual cutting of the vegetation”.
Most respondents share the opinion that nothing has been done to recover burnt areas; a
little over 25%, however, listed the “new plantations” as a way to cope with the situation.
Although there are no ZIFs4 in the Montemuro Mountain Site, these were, nevertheless,
suggested as a solution for most of the problems that were listed, along with extraordinary
measures to “force” landowners to “do something” about their land: “The government should
make people who own land cultivate it or otherwise sell it or rent it to whoever wanted to
work it” (the President of a Junta de Freguesia). Most respondents (around 80%), “have
already heard” of ZIFs but 12% “have no knowledge” of this type of forest management
model. 35% of them think the ZIFs’ main advantage is to “increase forest areas’ economic
return”, while 18% chose “decrease of forest risk” and 15% the “diversification of forest
areas’ use and functions”. The remaining 22% are of the opinion that ZIFs have nothing but
disadvantages: they represent a management model that is not adapted to the reality of the
country and one that generates conflicts; they are difficult to create and have too much
bureaucracy; they require the outlining of a forest management plan even for those
landowners who did not join the ZIF; ZIFs have to cover an area of at least 1000 ha.
Although 42% of the respondents totally agree with this management model, almost as
many think the possibility of including common land – something which is not in place, yet –
as well as the 1000 ha requirement should be reviewed or corrected. Besides, these are
polemic issues and not only for the respondents. It seems to make no sense for some of them
that the common areas are included in the ZIFs, since they were created to reduce the very
fragmentation of private property. On the other hand, in many areas of the northern and
central part of the country, continuous and contiguous areas that reach the required 1000 ha
are not easy to find. The current law regarding ZIFs5 (MADRP [17]) already contemplates the
possibility of common land being included in those spaces. In any case (regardless of it being
included in the ZIFs or not), “(…) ZIFs do not work because people cannot see any return
there and they are afraid they will no longer own the land”, said the head of an association.
“People were left out when ZIFs were created, that is, they had no saying in the process.”
Consequently, entities and organizations that are mostly concerned with forest issues find
4 The ZIF is a continuous and demarcated territorial area, consisting mostly of forestland under a Forest
Management Plan and a Specific Forest Intervention Plan and run by an entity called Managing Body. The main
purposes of ZIFs are: a) promoting the sustainable management of their forestland; b) coordinating the protection
of forestland and natural areas in a planned manner; c) reducing fire ignition and propagation conditions; d)
coordinating the recovery of forestland and natural areas when affected by fires; e) making the actions of central
and local administration as well as other stakeholders intervening in forestland coherent and effective (under
Decree-Law no 127/2005, August 5, MADRP [17]). 5 Decree-Law no 15/2009, January 14 altered Decree-Law no 127/2005, August 5, namely by introducing the
possibility of exclusively state-owned land and common land being included in forest intervention zones (MADRP
[17]).

Marta-Costa A., Pinto R., Torres Manso F., Luís Tibério M., Carneiro I., Portela J.,Regional Science Inquiry, Vol. VI, (2), 2014, pp. 57-71
67
themselves incapable of leading landowners to showing a more dynamic and more open
attitude towards this type of management model.
4.3. Stakeholders’ participation and cooperation relationships
Agents’ participation and cooperation relationships, especially as regards a joint effort to
implement DFCI policies, were studied according to the type of forestry-related initiatives
that were developed by the entities being surveyed; their level of participation and the
identification of the main groups to participate; the stakeholders that should design and carry
out forest-targeted interventions; and the listing of the most conflicting stakeholders and the
most frequent factors leading to conflict.
According to 60% of the respondents, the forestry-related initiatives taking place more
often are the “awareness seminars” that, in the end, are too general and do not target specific
groups. Other not so frequent events were also pointed out like gastronomic fairs promoting
agro-forestry products, (the Montemuro goat kid, the Arouquesa beef, the wild boar), the
organization of events related to the World Tree Day and summer mobile surveillance
initiatives developed simultaneously. According to one OPF member, “(…) one cannot expect
people to gather up in a room just to have someone talk to them about forest fires. After ten
minutes nobody is listening. One has to articulate this subject with others more interesting for
both landowners and producers.”
The level of public support to different events can be high or low depending on the type of
initiative being promoted and the entity responsible for it. It was generally considered
“reasonable” by 56% of the respondents but 22% think it is “good”. Individual forest owners
(47%), Governing Boards of Common Land (12%), Juntas de Freguesia (12%) and
Municipalities (6%) are the entities that take part the most in forest-related initiatives in
Montemuro Mountain Site. “Other” participants are distributed over central and regional
administrative authorities and local organizations.
As regards stakeholders that that should be responsible for deciding forms of forest
intervention, 20% of the respondents referred the OPF, while 15% point out the
municipalities, which have been assuming a protagonism they did not have ten years ago,
thanks to the responsibility they have been assigned in matters like civil protection and forest
fire prevention. The “Common Land Governing Boards” were referred by 13% of the
respondents as one of the main authorities that should decide about forest intervention, which,
actually, is already happening, according to 24% of the respondents, for they are responsible
for forest land management more than any other entity. In some cases, however, common
land is run by families who do not even report to their counterparts. Others like the head of an
association protested their management leaves a lot to be desired. “Common Land Governing
Boards suck. They do not manage and when they do, it’s badly done. They build ‘a few
things’ that often were not a priority”. Members of a public entity also added that “(…) the
very common land use plans [Planos de Utilização dos Baldios - PUB] have not much
technical credibility and were drawn up in a manner that is little inclusive and technically
inefficient.”
Apart from the above mentioned stakeholders, other were also listed by respondents as
being responsible for forest management in Montemuro Mountain Site, such as Individual
Forest Owners (21%), followed by Juntas de Freguesia (19%) and Central State Bodies
(16%).
As a rule, entities claim they have “good relationships” among themselves, namely with
GTFs and OPFs (e.g. Forest Firefighting Teams). The latter have both experience on the field
and technical expertise, two important requirements to legally intervene in the municipalities.
Forest firefighting teams are also an important link in certain areas like forest cleaning. Other
respondents also mentioned other entities (e.g. members of a public entity and OPF leaders),
with whom they have no or little institutional cooperation.
The term “conflicting” which was used in the questionnaire to single out agents or groups
of entities likely to cause disagreements or disputes was frequently replaced by the expression
“lack of communication between entities”. And it translates to contradictory interventions on
the field and to the absence of a concerted strategy for the sector. Not only do entities not
communicate among themselves, but also they do not communicate with local communities.
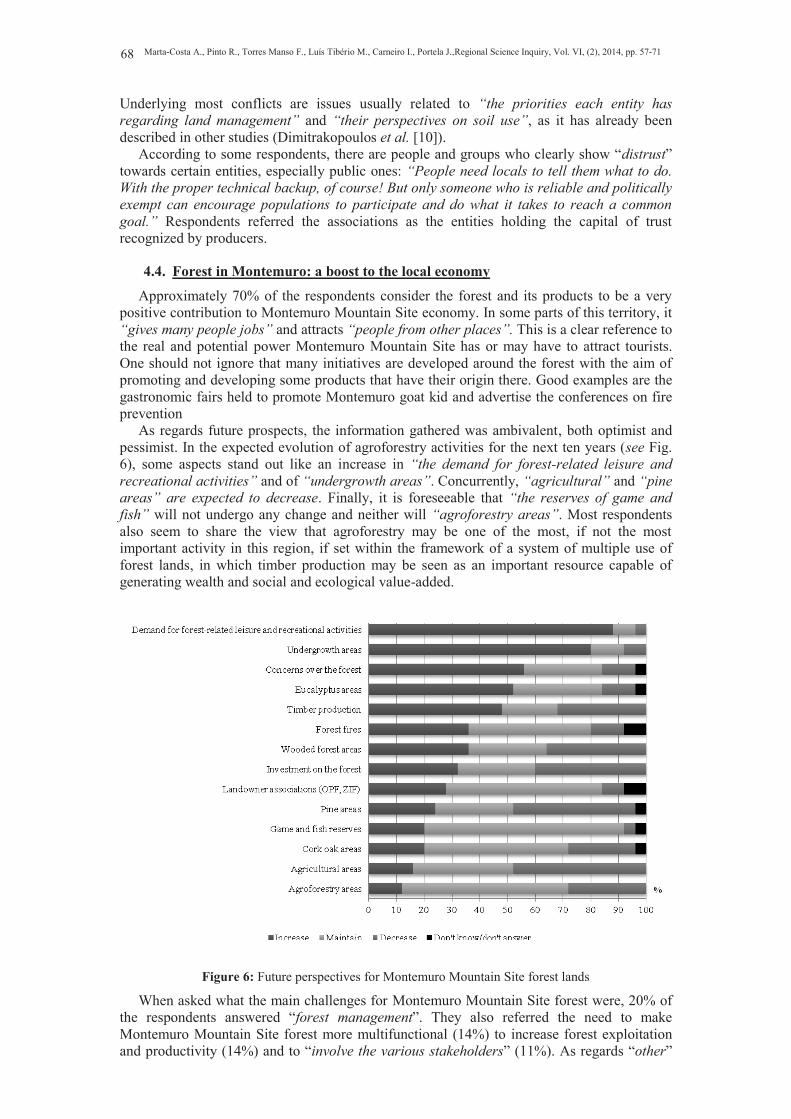
Marta-Costa A., Pinto R., Torres Manso F., Luís Tibério M., Carneiro I., Portela J.,Regional Science Inquiry, Vol. VI, (2), 2014, pp. 57-71 68
Underlying most conflicts are issues usually related to “the priorities each entity has regarding land management” and “their perspectives on soil use”, as it has already been described in other studies (Dimitrakopoulos et al. [10]).
According to some respondents, there are people and groups who clearly show “distrust” towards certain entities, especially public ones: “People need locals to tell them what to do. With the proper technical backup, of course! But only someone who is reliable and politically exempt can encourage populations to participate and do what it takes to reach a common goal.” Respondents referred the associations as the entities holding the capital of trust recognized by producers.
4.4. Forest in Montemuro: a boost to the local economy
Approximately 70% of the respondents consider the forest and its products to be a very positive contribution to Montemuro Mountain Site economy. In some parts of this territory, it “gives many people jobs” and attracts “people from other places”. This is a clear reference to the real and potential power Montemuro Mountain Site has or may have to attract tourists. One should not ignore that many initiatives are developed around the forest with the aim of promoting and developing some products that have their origin there. Good examples are the gastronomic fairs held to promote Montemuro goat kid and advertise the conferences on fire prevention
As regards future prospects, the information gathered was ambivalent, both optimist and pessimist. In the expected evolution of agroforestry activities for the next ten years (see Fig. 6), some aspects stand out like an increase in “the demand for forest-related leisure and recreational activities” and of “undergrowth areas”. Concurrently, “agricultural” and “pine areas” are expected to decrease. Finally, it is foreseeable that “the reserves of game and fish” will not undergo any change and neither will “agroforestry areas”. Most respondents also seem to share the view that agroforestry may be one of the most, if not the most important activity in this region, if set within the framework of a system of multiple use of forest lands, in which timber production may be seen as an important resource capable of generating wealth and social and ecological value-added.
Figure 6: Future perspectives for Montemuro Mountain Site forest lands
When asked what the main challenges for Montemuro Mountain Site forest were, 20% of the respondents answered “forest management”. They also referred the need to make Montemuro Mountain Site forest more multifunctional (14%) to increase forest exploitation and productivity (14%) and to “involve the various stakeholders” (11%). As regards “other”

Marta-Costa A., Pinto R., Torres Manso F., Luís Tibério M., Carneiro I., Portela J.,Regional Science Inquiry, Vol. VI, (2), 2014, pp. 57-71
69
challenges, respondents (20%) made several suggestions: implementing forest certification,
recovering burnt areas, reducing fires and even attempting to create ZIFs in the territory being
studied.
5. Final remarks
Departing from the literature on participatory processes of debating forest fire issues in
Portugal, the authors of this study argue that the lack of citizen participation in defining and
implementing public policies and measures for the sector is one of the bottlenecks to a proper
management of Portuguese forest land.
The fact that, in Portugal, local communities have no say in these matters seems to affect
citizen participation, which has been rather passive or does not even exist, thus preventing all
stakeholders from deciding on a common pathway. In fact, only recently have stakeholders
begun to be involved in designing forest policies and programmes with the aim of adopting
the right measures to develop the sector; but the process has been gaining a bottom-up logic.
However, in matters regarding management in general, forest management and forest fire
prevention, the legislation that has been passed often collides with the local communities’
interests, needs and expectations.
In this context, within the research project “ForeStake: The role of local stakeholders to
the success of forest policy in areas affected by fire in Portugal”, a reflection was made on the
prospects of Montemuro Mountain Site serving as the setting for proposals regarding an
effective strategy leading to enlist stakeholders’, their organizations’ and local communities’
participation in sustainably managing the forest. The strategy should add particular emphasis
on forest fire prevention and mitigation and on the recovery of burnt areas.
Montemuro Mountain Site is a classified site within the Natura 2000 Network and is
characterized by its predominantly agroforestry landscape, where the area of undergrowth is
rather significant. But it is also a space faced with many difficulties caused by an aging
population that has been leaving and devastated by fires year after year. These problems are
interrelated and mutually strengthened by the socio-demographic and economic dynamics of
the territory.
Using the interviews conducted to 24 Montemuro Mountain Site entities and organizations
at an early stage of the ForeStake project, this study aimed at determining stakeholders’ views
and concerns regarding the reality of the forest in this territory, a task that is deemed essential
for enlisting citizens’ and stakeholders’ participation in a sustainable strategy of forest
management.
Respondents have a clear view of soil occupation in Montemuro Mountain Site. They
recognize the many problems, namely fires, affecting the forest. They point the finger at
shepherds and hunters as being the main causers of forest fires. In turn, forest owners are
accused of neglecting to clean undergrowth, responsible for fire propagation. But they also
mention a set of non-specified “interests” and “interested/favoured parties. Apparently,
environmental issues deriving from fires are among the respondents’ concerns; however, for
reasons that have to do with the lack of initiative and/or financial resources, little or nothing
has been done to recover burnt areas in Montemuro Mountain Site.
Respondents are also worried about the lack of forest management in their territory and
they think Common Land Governing Boards should accept their responsibilities in this
matter. This view is partly the result of the public attention Common Land Governing Boards
drew on themselves when aeolian parks were installed on common land, since they were the
entities that signed the contracts with the supplying companies. Paradoxically, respondents
seem oblivious of the fact that almost 50% of forest land is privately owned.
Forest owners’ lack of interest and participation in designing and carrying out suitable
plans for the forestry sector are frequently brought up by respondents in connection with fire
prevention. They demand that local communities be given the opportunity to actively take
part in designing and carrying out these plans. They also wish the obvious lack of
communication among stakeholders ended for it clearly hinders Montemuro Mountain Site
land management, rendering the execution of plans, programmes and measures to prevent
forest fires ineffective.

Marta-Costa A., Pinto R., Torres Manso F., Luís Tibério M., Carneiro I., Portela J.,Regional Science Inquiry, Vol. VI, (2), 2014, pp. 57-71 70
In the respondents’ view, future strategies for the sustainable management of forest areas
in Montemuro Mountain Site should contemplate aspects like making the most of common
lands areas, afforesting with more suitable species, using forest spaces for multiple purposes
(agroforestry, hunting, shooting and fishery) and implementing other economic activities
(namely tourism, recreation and leisure), which will be complementary income sources
besides providing the conditions for more dialogue and understanding among the various
stakeholders.
It is necessary to stimulate the participation and commitment both of stakeholders, forest
owners and local communities in the decision making process so that it effectively reflects on
the designing and carrying out of sound strategies for the Montemuro Mountain Site forest.
References
1. Aguiar, C., Pinto, B., “Paleo-história e história antiga das florestas de Portugal
continental: até à Idade Média”, in Árvores e florestas de Portugal: floresta e
sociedade, uma história comum, Silva, J.S. (Ed.), Lisbon, Jornal Público, Fundação
Luso-Americana para o Desenvolvimento, Liga para a Protecção da Natureza,
2007, pp. 15-53.
2. André, P., Enserink, B., Connor, D., Croal, P., “Public Participation International
Best Practice Principles”, in Special Publication Series, Nr. 4, International
Association for Impact Assessment, Fargo, USA, 2006.
3. Arnstein, S.R., “A Ladder of Citizen Participation”, in Journal of the American
Institute of Planners, Vol. 35 Nr. 4, 1969, pp. 216-224.
4. Azevedo, J., Tibério, L., Torres, F., Fonseca, C., Almeida, L., Capapé, A., Marta, A.,
Mascarenhas, A., Mesquita, M., Magalhães, M., Ferreira, P., Silva, J., Costa, F.,
Gonçalves, H., Resende, D., Bento, J., “Plano de Gestão Integrada do Sítio
PTCON0025 Montemuro”, Relatório Final – Plano de Acção, University of Trás-
os-Montes e Alto Douro, Vila Real, 2009.
5. Buchy, M., Hoerman, S., “Understanding public participation in forest planning: a
Review”, in Forest Policy and Economics, Nr.1, 2000, pp. 15-25.
6. Castro, M., “A utilização dos pequenos ruminantes na prevenção dos incêndios
rurais: estratégia pró-activa de promoção silvopastoril”, in A silvopastorícia na
prevenção dos fogos rurais, Moreira, M.B., Coelho, I. S. (Coord.), Lisbon, ISA
Press, 2008, pp. 159-175.
7. Chambers, R., “Whose Reality Counts? Putting the Last First”, London, Intermediate
Technology, 1997.
8. Davis, G., “Consultation, Public Participation and the Integration of Multiple
Interests into Policy Making”, Paris, Organisation for Economic Cooperation and
Development, 1996.
9. DGRF (General Board of Forestry), “Estratégia Nacional para as Florestas”, Lisbon,
Direção Geral dos Recursos Florestais, 2006.
10. Dimitrakopoulos, P., Nikoleta, J., Theodoros, I., Ioanna, F., Ourania, L., Foivos, P.,
Konstantinos, I., “Local attitudes on protected areas: Evidence from three Natura
2000 wetland sites in Greece”, in Journal of Environmental Management, Nr. 91,
2010, pp. 1847-1854.
11. DGRF, UTAD, Nordeste Rural, “Plano Regional de Ordenamento Florestal do
Douro”, 2006.
12. DRAEDM, DGRF, UTAD, “Plano Regional de Ordenamento Florestal da Área
Metropolitana do Porto e Entre Douro e Vouga”, 2006a.
13. DRAEDM, DGRF, UTAD, “Plano Regional de Ordenamento Florestal do Tâmega”,
2006b.
14. ICN, “Plano Sectorial Rede Natura 2000, Sítio Serra de Montemuro”, Instituto da
Conservação da Natureza, 2006.
15. ICNF “6º Inventário Florestal Nacional (IFN6) – Áreas dos usos do solo e das
espécies florestais de Portugal Continental, Resultados preliminares”, Lisbon,
Instituto da Conservação da Natureza e Florestas, 2013.
Marta-Costa A., Pinto R., Torres Manso F., Luís Tibério M., Carneiro I., Portela J.,Regional Science Inquiry, Vol. VI, (2), 2014, pp. 57-71
71
16. Instituto Geográfico Português, “Carta de Uso e Ocupação de Solo de Portugal
Continental (COS90 2005)”, 2006.
17. MADRP, “Decreto-Lei N.º 15/2009, que estabelece o regime de criação de zonas de
intervenção florestal (ZIF)”, in Diário da República, Nr. 9, I Série, 14 january
2009, 2009, pp. 254-267.
18. MADRP, DGRF, “Plano Regional de Ordenamento Florestal Dão-Lafões”, 2006.
19. Manso, F.T., “A problemática das relações entre a floresta, o fogo e o pastoreio:
resultados indicadores no norte de Portugal”, in A silvopastorícia na prevenção dos
fogos rurais, Moreira, M.B., Coelho, I. S. (Coord.), Lisbon, ISA Press, 2008, pp.
141-157.
20. Marta-Costa, A.A., Pinto, R., Torres Manso, F., Tibério, M.L., Carneiro, I.,
Fernandes, P., Botelho, H., “Participação pública e gestão florestal na Serra de
Montemuro: Entre a perceção e a realidade”, Vila Real, Sodivir – Edições do Norte
Lda., 2013.
21. Moreira, M., “A Pastorícia como prevenção dos Fogos Rurais: A necessidade de um
novo empreendedorismo”, in A silvopastorícia na prevenção dos fogos rurais,
Moreira, M.B., Coelho, I. S. (Coord.), Lisbon, ISA Press, 2008, pp. 99-122.
22. Munro-Clark, M. (Ed.), “Citizen Participation in Government”, Sidney, Hale &
Ironmonger, in association with Ian Buchan Research Centre, University of
Sydney, 1990.
23. Nelson, N., Wright, S., “Power and Participatory Development, Theory and Practice”,
London, Intermediate Technology, 1995.
24. Nohl, W., “Halbierter Naturschutz. Nature conservation only half the job!”, in Natur
und Landschaft, Nr. 4, 1997, 221-232.
25. Organização das Nações Unidas, “Declaração do Rio sobre Ambiente e
Desenvolvimento”, in Infopédia, Porto, PORTO Ed., 1992.
26. Pateman, C., “Participation and Democratic Theory”, Cambridge, Cambridge
University Press, 1970.
27. Presidência do Conselho de Ministros, “Resolução do Conselho de Ministros n.º
65/2006, relativa ao Plano Nacional de Defesa da Floresta Contra Incêndios
(PNDFCI)”, in Diário da República, Nr. 102, I-B Série, 26 may 2006, 2006, pp.
3511-3559.
28. Rahman, A., “People’s Self Development. Perspectives on Participatory Action
Research”, London, Zed Publications, 1993.
29. Rodriguez, R., Losada, M., Franco, R., Hernández, M., Urtiaga, J., “Prevención de
incendios mediante sistemas silvopastorales”, in A silvopastorícia na prevenção dos
fogos rurais, Moreira, M.B., Coelho, I. S. (Coord.), Lisbon, ISA Press, 2008, pp.
77-98.
30. Santos, H., “Novos rumos, caminhos velhos”, in A silvopastorícia na prevenção dos
fogos rurais, Moreira, M.B., Coelho, I. S. (Coord.), Lisbon, ISA Press, 2008, pp.
23-47.
31. Santos, F., Martins, H., Borges, J., “Desenvolvimento de Abordagens Participativas
no Planeamento Florestal Português”, in Silva Lusitana, Nr. 12, 2004, pp. 67-76.
32. Vélez, R., “The causes of forest fires in the Mediterranean basin”, in Risk
Management and Sustainable Forestry, Arbez, M., Birot, Y., Carnus, J.M. (Eds.),
Finland, European Forest Institute, 2002, pp. 35-42.
33. Vélez, R., “The causing fires: a focus on economic and social driving forces”, in
Living in Wildfires: what science can tell us, Birot (Eds.), EFFI Discussion paper,
Nr. 15, Joensuu, European Forest Institute, 2009, pp. 21-25.
34. Vettivel, S.K., “Community Participation. Empowering the Poorest, Roles of NGOs”,
New Delhi, Vetri, 1992.
35. Wignaraja, P., Hussain, A., Sethi, H., Wignaraja, G., “Participatory Development.
Lessons from South Asia”, Karachi, Oxford University Press, 1991.

Regional Science Inquiry, Vol. VI, (2), 2014 72

Pourmohammadi M.R., Valibeigi M., Sadrmousavi M.S., Regional Science Inquiry, Vol. VI, (2), 2014, pp. 73-86
73
THE RELATIONSHIP BETWEEN HDI AND ITS INDICATORS WITH
REGIONAL GROWTH IN IRANIAN PROVINCES
Mohammad Reza POURMOHAMMADI Professor of Geography & Urban Planning Department, Geography Faculty, University of Tabriz, Tel:
0098-411-3348953. Fax: 0098-411-3348953.
Mojtaba VALIBEIGI Urban Planning Department, Buin-Zahra Technical University, Tel: 0098-9195288768.
Mir Sattar SADRMOUSAVI Professor of Geography & Urban Planning Department, Geography Faculty, University of Tabriz,
Tel: 0098 - 411 – 3392297. Fax: 0098 -411- 3356013
Abstract
The purpose of the paper is investigating relations between human development and
economic growth, with a view to identifying major policies and prioritizing of them across
Iranian provinces. In order to, human development index (HDI) between Iranian provinces
over 1996, 2006 and 2001 have been created, and then with using the Co-integration and
Granger causality technique have been measured long term relationships between economic
growth and HDI. The findings suggest that although still inequality remains but the quality of
life also has risen and these improvements seems have significant impact on long term
economic growth. Also we find that HDI is positively influenced by Per capita GDP and if we
want high levels of quality of life, we must dedicate a special consideration to economic
growth in regional Policies across provinces.
Keywords: quality of life, human development index, economic growth, Iranian
provinces.
JEL classification: R21, R32
1. Introduction
Since Human Development, which has been defined as enlarging people’s choices in a
way which enables them to lead longer, healthier and fuller lives, has come to the fore as a
fundamental objective of development, its relationship to economic growth has become a
central issue. This is not just a matter of how the two relate at a particular point in time, but
also determination of the economic growth and human development relationship helps the
policy and decision makers to formulate and implement relevant poverty eradication
strategies (Boozer & et al., 2003; Bundala, 2012).
Recent empirical research confirms the significant impact of investment in human capital
on economic growth. Work at the OECD (2001) by the Economics Department and the
Directorate for Education, Employment, Labor and Social Affairs estimated that an increase
of one year in the average educational attainment of a country would raise per capita GDP by
between 4 and 7 percent. Analyses of the changes in economic performance in OECD
countries between the 1980s and the 1990s show human capital investment to be one of the
most powerful engines of economic growth. Interestingly, on average, its impact has been
larger than that of physical investment. There are three key growth-enhancing effects of
human capital. First, it contributes to economic efficiency. Second, it provides the labor
resources on which growth depends. Third, it can reduce social inequalities and, potentially,
make growth more sustainable (McGaw, 2001).

Pourmohammadi M.R., Valibeigi M., Sadrmousavi M.S., Regional Science Inquiry, Vol. VI, (2), 2014, pp. 73-86 74
In Iran, regional disparities have been growing at an alarming rate leading to serious
problems including migration with its associated problems from backward provinces to the
more developed ones (Noorbakhsh, 2002). The Law of the Fourth Economic, Social and
Cultural Development Plan of the Islamic Republic of Iran (2005-2009) states that “In order
to establish justice and social stability, to reduce social and economic disparities, to reduce the
gap between income declines and to secure fair distribution of income in the country, as well
as to alleviate poverty and deprivation, enabling the poor, via allocation of effective and
targeted allocation of the social security resources and payment of subsidy, government is
bound to prepare and implement comprehensive plans for eradicating poverty and promoting
social justice on the basis of the…” (Management and Planning Organization of Iran, 2005).
Since the purpose of the paper is an outline of situation and trends in the field of human
development in Iranian provinces and then is considered relationships between economic
growth and the human development.
Accordingly the paper is organized as following. Section 2 contains literature review in the
field. Section 3 describes methods and collected primary data. The fourth section presents
brief description of HDI and the method used to implement the Human Development Index
(HDI) and investigates levels and trends for HDI and related indicators during the last 15
years in province levels. The 5 section first focuses on the empirical results obtained from the
Co-integration technique and investigate long term impact these indicators on economic
growth and then examine relationships between HDI and economic growth with granger
causality technique and some final considerations are included in last section.
2. Literature review
Every period of time has its own rhetoric comprising communicating goals or directing
human beings. Nowadays we are proclaiming that all our effort should be directed towards
better living, towards living of a higher quality (Zgodavová & Grmanová 2009). Human
capital theory suggests that individuals and society derive economic benefits from
investments in people (Sweetland, 1996).
As Haldar and Mallik noted (2010) Education has consistently been emerged as the prime
human capital. the contribution of education to economic development has mainly relied
on cross-country estimates of gross enrolment rates or average years of schooling.
researchers such as Barro and Sala-i-Martin (1995), Sala-i-Martin (1997), McMahon (1998),
Temple (1999), Bils and Klenow (2000), Self et al. (2004) find schooling to be positively
correlated with the growth rate of per capita Gross Domestic Product across countries. For
instance, Mankiw et al. (1992) empirically examine the Solow growth model with and
without human capital as a factor of production and find that the human capital augmented
Solow model fits in explaining cross-country income variations. The study uses a variable
“School” as a proxy for human capital. The variable School was constructed through taking
the percentage of the people aged between 12 to 17 enrolled in the secondary schools.
Eric Hanushek (2013) examines economic growth in developing countries and the role of
human capital. He declares that the focus on human capital as a driver of economic growth for
developing countries has led to undue attention on school attainment. Developing countries
have made considerable progress in closing the gap with developed countries in terms of
school attainment, but recent research has underscored the importance of cognitive skills for
economic growth. This result shifts attention to issues of school quality, and there developing
countries have been much less successful in closing the gaps with developed countries.
Without improving school quality, developing countries will find it difficult to improve their
long run economic performance.
Becker (1993) and Schultz (1997) have argued that health and nutritional expenditure is
also a part of human capital investment. This is because education is perceived to contribute
to health and nutritional improvements. Education, health, nutrition, water and sanitation
complement each other, with investments in any one contributing to better outcomes in
the others (Haldar and Mallik, 2010; see also World Bank, 2001). In models of economic
growth, human capital in the form of schooling or enrollment has been given a central place
while the role of health has remained peripheral. Bloom and Sachs (1998) have obtained
empirical evidence that health plays an important role in determining economic growth rates.
More recent studies have examined the effects of life expectancy on economic growth

Pourmohammadi M.R., Valibeigi M., Sadrmousavi M.S., Regional Science Inquiry, Vol. VI, (2), 2014, pp. 73-86
75
in the subsequent 15 to 25 years, which have consistently been found strong positive direct
effects as well as indirect ones operating through rates of investment in physical capital
or demographic profiles of the populations (Barro, 1997; Sachs and Warner, 1997; Bloom
and Williamson, 1998). The impact of health on income is an important policy issue that has
motivated research at the World Health Organization. Mayer-Foulkes et al. (2001) has
observed in the Mexican states that there has been a significant long-term impact (25-30
years) of life expectancy on economic growth (Haldar and Mallik, 2010). Lorentzen et al
(2005) analysis the impacts of adult mortality rate on economic growth. The study finds that
high mortality rate reduce the economic growth by curtailing the time horizon. Akram and et
al., (2009) investigate the impacts of different health indicators on economic growth in
Pakistan. The Co-integration, Error Correction and Granger Causality techniques were
applied on the time series data of Pakistan for the period of 1972-2006. They find that per
capita GDP is positively influenced by health indicators in the long run and health indicators
cause the per capita GDP. Qadri & Waheed (2011) estimated relationship between human
capita and economic growth in Pakistan for the period 1978 to 2007. A health adjusted
education indicator for human capital is used in the standard Cobb-Douglas production
function confirms the long run positive relationship between human capital and the economic
growth in Pakistan. Haldar and Mallik (2010) examine the time series behavior of investment
in physical capital, human capital (comprising education and health) in India from 1960 to
2006. The results suggest that physical capital investment has no long-run nor short-run
effect but the human capital investment has significant long-run effect on per capita GNP.
Mukherjee and Chakraborty (2010) in “is there any relationship between economic growth
and human development?” attempts to analyze the relationship between economic growth
and human development for 28 major Indian States during four time periods and confirm
that there is need for further investigation to determine the underlying factors (other
than per capita income) which influence human development achievements of a state. In
Iran no research has been done in this area. With respect to other studies and available data in
provinces level, it seems that HDI especially HDI after 2010 make both a more
comprehensive view of development tendencies included health, education and GVA per
capita and provide a data base for analysis these relationships.
3. Materials and Method
The basic idea of this study to understand at what degree and extent HDI will be
influenced economic growth across Iranian provinces and vice versa.
The timeframe covered starts with 1996 and due to the extremely poor quality of data only
three periods was chosen: 1996, 2006 and 2011. Human development is measured by the
Human Development Index after 2010 and long term relationships human development
indicators is tested by Co-integration technique, and Granger causality.
The primary data has been used the study collected from different resources. The primary
data for related educational indicators used in the analysis was obtained from the province
detail results of the population and housing censuses 1996- 2006 & 2011. For GDP per-
capita, available data in regional accounts and the province public revenues in appendix 2
Provincial budgets were used and for life expectancy, indicators of health aspects in Islamic
republic of Iran have been applied.
4. Human Development Index (HDI)
Human development is an expansion of the real freedoms of people to pursue lives that
they value and have reason to value. The Human Development Index (HDI), launched in
1990, was a pioneering measure that went beyond income to reflect health and education
(UNDP 2010). Its emergence, and that of other composite measures of human development,
was motivated by the discontent with income as a single measure of well-being (Laszlo and
Maria-Carmen 2008. see e.g. Crafts 1999). It has been since then the basis of UN Human
Development Report. The primary goal of the Report and of the index is calling attention to
dimensions such as health and education that may not be correctly appraised in the ranking of
the countries by traditional production and income indices (Sant’Anna 2011).

Pourmohammadi M.R., Valibeigi M., Sadrmousavi M.S., Regional Science Inquiry, Vol. VI, (2), 2014, pp. 73-86 76
For the last 20 years, the HDI has been employed to monitor and demonstrate the multiple
dimensions of human elements necessary for a dignified life attained through enlarging
people’s choices (Fukuda-Parr 2001). This index aims to promote a summary measurement
strategy in the analysis of human welfare. The most basic human elements are identified as
adequate nutrition, clean water, housing, healthcare, and educational attainability
(McGillivray and White 1992). Advancement of these elements is recognized through three
fundamental dimensions: (1) access to knowledge, (2) longevity, and (3) a decent standard of
living (Fukuda-Parr 2001). The initial intention of the HDI evaluation was to indicate the
average citizen’s access to these dimensions, however, its impact has expanded to
demonstrate that by ensuring such human elements, a nation-state provides opportunity and
encourages the discussion of rights (Bloom and Cohen 2002 see also Habashi & Others
2012).
Although since its introduction in the first Human Development Report in 1990, the
Human Development Index (HDI) has attracted great interest in policy and academic circles,
as well as in the media and national audiences around the world. Its popularity can be
attributed to the simplicity of its characterization of development - an average of
achievements in health, education and income – and to its underlying message that
development is much more than economic growth. Yet the HDI’s very simplicity prompted
critiques from the start, with some contending that it was too simplistic, while others who
accepted its self -imposed limitations still questioned its choice of indicators and its
computational methodology. In 2010, for the twentieth anniversary edition of the Human
Development Report, a comprehensive review of these critiques was undertaken and several
major changes to the HDI were introduced. Though this is not the first time that the HDI has
been modified, it is the first time that major changes have been simultaneously introduced to
the indicators used to measure progress and the functional form used to convert them to a
single measure of progress (Klugman 2011).
According to this new method that allows a better depiction of the nature of the inequality,
this paper has attempted to evaluate HDI at province level in Iran, which provides a fresh look
at the existing regional development differences and then based on a descriptive approach the
results will be investigated (For more information about the rationale the introduction of new
indicators; see Klugman 2011). The new formula is:
HDI = (H Health * H Education * H Living standard) 1/3 (1)
The indices Hi are still normalized indicators of achievements. Life expectancy (le)
remains the indicator for the health dimension, while Gross National Income (GNI) replaces
GDP as the measure for living standards (Unfortunately, instead of GNI data at the regional
level in Iran which were unavailable, GDP per capita was used), and while mean years of
schooling (mys) and expected years of schooling (eys) now make up the education dimension:
Hh= (le-le min)/ (lemax-lemin), (2)
He= [((mys-mysmin) / (mysmax-mysmin)) *((eys-eysmin)/ (eysmax-eysmin))] 1/2 (3)
And
Hls = (ln (gni)-ln (gnimin))/ (ln (gnimax)-ln (gnimin)) (4)
As mentioned in above, the first step is to create sub-indices for each dimension that in
sum, this form retains the same three-dimensional structure with equal weights and several
key changes. It replaces the indicators for income and education. Minimum and maximum
values (goalposts) need to be set in order to transform the indicators into indices between 0
and 1. Because the geometric mean is used for aggregation, the maximum value does not
affect the relative comparison (in percentage terms) between any two regions or periods of
time (HDR 2010). In this research, following Mazumdar (1999), the maximum and minimum
values (goalposts) selected from the observed values in the data-base being used; as seen in
the following:
{LEmin,LEmax} = {62.8: Kurdestan, 1996, 76.5: Tehran, 2011}
{MYSmin, MYSmax} = {2.9: Sistan and Baluchistan, 1996, 9.9: Tehran, 2011}
{EYSmin, EYSmax} = {7.7: Kurdestan, 1996), 16.04: Qom, 2011}
{GDPmin, GDPmax((2000 constant $))}= {348: Sistan and Baluchistan, 1996, 9339.2:
Tehran, 2011}
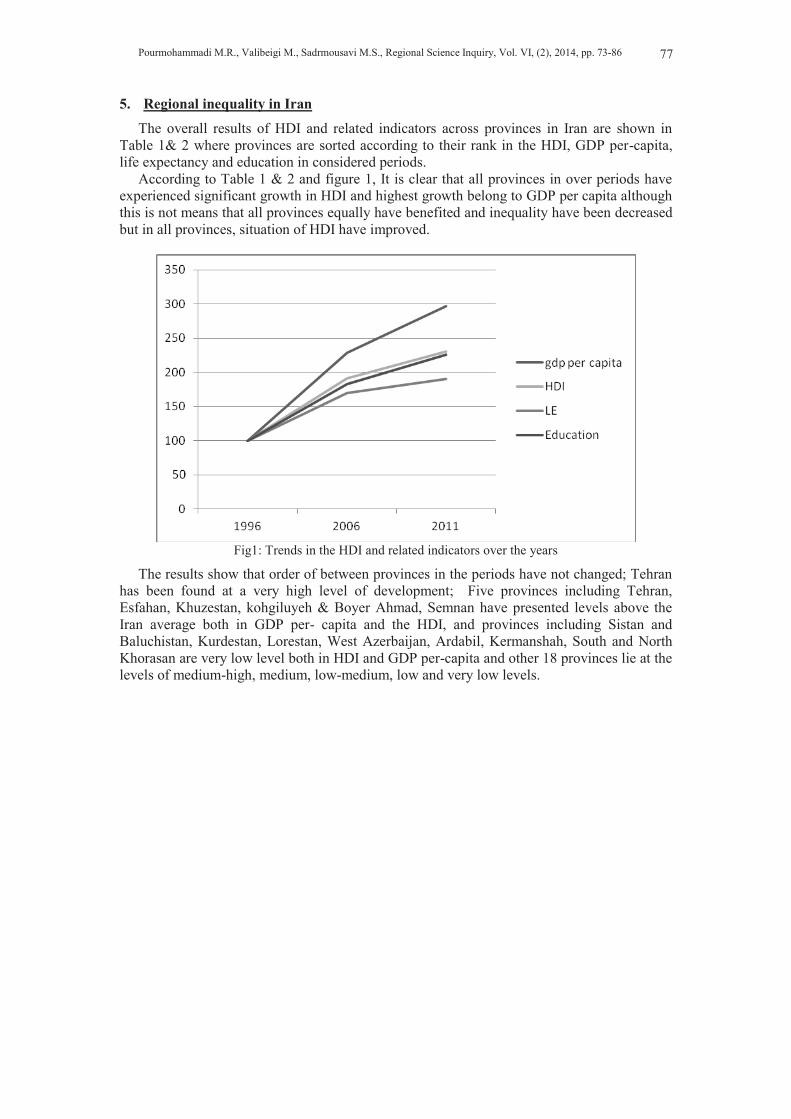
Pourmohammadi M.R., Valibeigi M., Sadrmousavi M.S., Regional Science Inquiry, Vol. VI, (2), 2014, pp. 73-86
77
5. Regional inequality in Iran
The overall results of HDI and related indicators across provinces in Iran are shown in Table 1& 2 where provinces are sorted according to their rank in the HDI, GDP per-capita, life expectancy and education in considered periods.
According to Table 1 & 2 and figure 1, It is clear that all provinces in over periods have experienced significant growth in HDI and highest growth belong to GDP per capita although this is not means that all provinces equally have benefited and inequality have been decreased but in all provinces, situation of HDI have improved.
Fig1: Trends in the HDI and related indicators over the years
The results show that order of between provinces in the periods have not changed; Tehran has been found at a very high level of development; Five provinces including Tehran, Esfahan, Khuzestan, kohgiluyeh & Boyer Ahmad, Semnan have presented levels above the Iran average both in GDP per- capita and the HDI, and provinces including Sistan and Baluchistan, Kurdestan, Lorestan, West Azerbaijan, Ardabil, Kermanshah, South and North Khorasan are very low level both in HDI and GDP per-capita and other 18 provinces lie at the levels of medium-high, medium, low-medium, low and very low levels.

Pourmohammadi M.R., Valibeigi M., Sadrmousavi M.S., Regional Science Inquiry, Vol. VI, (2), 2014, pp. 73-86 78
Table 1: The Human Development Index and GDP per capita in Iranian provinces
GDP per-capita HDI Provinces
1996 R 2006 R 2011 R 1996 R 2006 R 2011 R
Ardabil 62.2 22 191.0 23 261.5 25 76.4 24 173.3 23 210.9 23
Azerbaijan, East 94.3 14 217.1 14 286.0 13 97.2 17 193.1 13 236.8 13
Azerbaijan,West 60.5 23 180.4 28 242.2 29 69.4 25 166.4 27 203.9 27
Bushehr 107.0 11 307.7 3 364.4 4 114.0 12 214.2 8 260.7 7
Chahar Mahaal 50.3 26 184.9 26 264.2 24 86.2 20 178.6 20 218.0 20
Esfahan 120.6 7 249.7 8 320.8 9 143.0 3 230.9 2 271.9 4
Fars 81.8 16 216.1 15 280.8 15 120.7 9 199.6 12 245.3 11
Gilan 87.5 15 205.1 18 279.7 16 110.0 15 186.2 16 234.3 14
Golestan 74.7 19 189.3 25 259.0 26 122.8 8 184.2 18 223.2 17
Hamadan 62.2 21 196.6 21 270.0 21 85.4 21 173.5 22 211.3 22
Hormozgān 128.2 5 244.0 10 308.2 12 100.5 16 171.8 25 210.8 24
Ilam 100.4 13 296.8 4 359.0 5 89.1 18 191.4 14 224.3 15
Kerman 116.0 8 229.3 13 285.5 14 112.9 13 188.7 15 224.2 16
Kermanshah 50.8 25 190.1 24 276.1 20 82.9 23 175.1 21 212.7 21
Khorasan,Razvia 76.0 18 205.4 17 279.2 17 88.1 19 182.5 19 221.7 18
Khorasan, South - - 193.1 22 267.5 22 - - 166.3 28 198.8 28
Khorasan,North - - 199.8 20 264.9 23 - - 172.1 24 209.5 25
Khuzestan 216.5 2 356.5 2 406.1 2 143.2 2 225.6 4 263.6 6
Kohgiluyeh 158.4 3 286.1 5 365.3 3 133.9 6 227.3 3 265.7 5
Kurdistan 39.4 27 174.8 29 246.7 28 21.4 27 134.2 29 181.1 29
Lorestan 55.7 24 181.7 27 250.4 27 54.3 26 170.6 26 205.6 26
Markazi 136.7 4 265.8 6 323.1 8 120.5 10 210.2 9 244.2 12
Mazandaran 105.4 12 229.3 12 309.2 10 117.8 11 200.8 11 254.5 9
Qazvin 124.9 6 239.6 11 308.7 11 110.1 14 202.3 10 245.7 10
Qom 79.8 17 204.4 19 278.8 18 129.5 7 221.0 6 257.2 8
Semnan 114.7 9 250.8 7 325.9 6 141.4 4 219.7 7 275.5 3
Sistanbaluchistan 16.2 28 124.2 30 201.0 30 17.0 28 116.6 30 143.9 30
Tehran 311.6 1 410.4 1 429.1 1 146.4 1 248.7 1 301.8 1
Yazd 107.2 10 247.2 9 325.3 7 135.5 5 225.1 5 278.0 2
Zanjan 74.3 20 211.5 16 278.1 19 83.6 22 184.8 17 221.0 19
Iran 100 - 229 - 297 - 100 - 191 - 231 -
Notes: a South, North & Razavi Khorasan to 2006 was one province by name Khorasan that after 2006,
were separated. After their separation, inequality among these regions obviously became apparent.
Source: Statistical Center of Iran & authors’ own work

Pourmohammadi M.R., Valibeigi M., Sadrmousavi M.S., Regional Science Inquiry, Vol. VI, (2), 2014, pp. 73-86
79
Table2: health & educational indicators
LE EDU Provinces
1996 R 2006 R 2011 R 1996 R 2006 R 2011 R
Ardabil 91.9 20 159.9 21 178.9 21 65.28788 24 170.9614 22 206.1202 24
Azerbaijan, East 110.9 12 188.8 9 207.7 9 79.32355 22 174.5499 20 228.6121 13
Azerbaijan,West 76.4 23 171.8 15 190.7 15 64.86924 25 144.2284 29 185.5107 28
Bushehr 107.9 13 174.6 14 195.4 13 122.3825 11 187.9572 11 237.1962 11
Chahar Mahaal 101.9 16 165.1 17 183.2 18 89.92551 20 184.3043 14 219.3154 17
Esfahan 144.3 4 236.5 1 242.3 3 152.609 2 202.8796 7 263.2754 5
Fars 130.1 8 192.7 8 217.7 7 133.0776 6 189.2799 10 244.7886 9
Gilan 100.1 17 176.5 13 193.6 14 134.0744 5 178.0973 18 242.9058 10
Golestan 147.1 3 203.3 6 209.1 8 123.7717 10 151.252 27 206.9975 23
Hamadan 96.01 18 157.3 23 177.8 22 86.39066 21 170.4401 24 202.6143 26
Hormozgān 102.4 15 132.7 25 151.6 26 75.02678 23 161.355 25 205.2803 25
Ilam 67.2 27 100.1 28 116.4 29 104.1813 17 219.4908 3 250.3295 7
Kerman 93.5 19 162.3 20 181.4 19 130.246 8 184.9559 13 224.2346 14
Kermanshah 85.4 21 158.9 22 172.7 24 99.75422 18 177.7753 19 208.4375 22
Khorasan,Razvia 74.82011 25 162.5251 19 184.0563 17 109.4904 14 184.0812 15 218.4189 18
Khorasan, South 74.82011 24 128.6411 27 138.5553 28 109.4904 16 186.8785 12 215.5869 20
Khorasan,North 74.82011 26 166.206 16 181.28 20 109.4904 15 153.6605 26 196.7334 27
Khuzestan 118.6691 9 187.3504 10 206.2869 10 115.6065 12 170.5472 23 221.9948 15
Kohgiluyeh 53.28479 28 131.2721 26 176.2793 23 99.61759 19 204.4985 6 247.8241 8
Kurdistan 14.62499 30 94.95088 30 147.5777 27 15.87988 29 147.829 28 168.4651 29
Lorestan 77.24175 22 150.2698 24 167.5061 25 23.89082 28 181.3435 17 212.3249 21
Markazi 116.507 11 184.1227 12 203.0592 12 109.7349 13 194.8313 8 229.0711 12
Mazandaran 116.7664 10 186.7796 11 206.2497 11 123.9118 9 190.3965 9 264.9169 4
Qazvin 136.4855 6 198.7356 7 222.2629 6 64.13801 26 173.1835 21 220.603 16
Qom 147.1234 2 210.5808 4 225.1757 5 139.3933 4 237.7008 1 271.5017 3
Semnan 135.3612 7 206.2392 5 232.8178 4 162.8477 1 206.0949 5 281.4202 2
Sistanbaluchistan 19.12233 29 97.50571 29 113.8874 30 14.42772 30 130.2827 30 134.2427 30
Tehran 147.1234 1 236.4371 2 255.4878 1 131.9608 7 228.328 2 301.9018 1
Yazd 139.5126 5 213.8812 3 255.3736 2 146.1817 3 215.2979 4 262.037 6
Zanjan 102.9285 14 164.3361 18 185.1425 16 64.13801 27 183.9979 16 215.7371 19
Iran 100.1534 170.0208 190.6599 100.0373 182.8826 226.2799
Source: Statistical Center of Iran, indicators of health aspects in Islamic republic of Iran & authors’
own work
According to Tables 1 & 2, also it should be noted that, there is some substitutability
between provinces depending on the measure used to investigate quality of life. although to
some extant can be observed a direct relationship but having higher HDI does not necessarily

Pourmohammadi M.R., Valibeigi M., Sadrmousavi M.S., Regional Science Inquiry, Vol. VI, (2), 2014, pp. 73-86 80
imply upper GDP per-capita such as Qom, Golestan and Yazd; for example, the HDI values
of Qom is higher than the values of many provinces such as Razavi Khorasan, Mazandaran,
East Azerbaijan, Kerman, Semnan and Khuzestan but its GDP per-capita is lower. This
province showed remarkable progress since 1996 especially in education and life expectancy
indicators. After two decades of high and sustained development in education index, Qom
graduated to highest level the index in 2011 and catching up with Tehran and other very high
education regions. Similarly, there are several provinces with higher GDP whose HDI is
lower than expected such as Hormozgan, Ilam and Markazi, and vice versa.
Generally, all provinces have also achieved better performance and consequently achieved
upper HDI status in two last decades; however, many of them still face major development
challenges such as inequalities in the per capita GDP and then the HDI, life expectenct and
education.
The following section analyses if the improvements have a significant impact on economic
growth in long run.
6. Impact of HDI on economic growth
In order to find out the long run relationship between variables Co-integration technique is
used that Per capita GDP as the independent variable of the model, as a proxy for economic
growth will be assumed and impact HDI, life expectancy and education on GDPP will be
assessed.
In this paper, we employ Kao and Chiang (2000) panel coefficient estimation by FMOLS
approach. The Fully Modified OLS (FMOLS) methodology is proposed by Kao and
Chiang (2000) to estimate the long-run co-integration vector, for non-stationary panels.
This estimator correct the standard pooled OLS for serial correlation and endogeneity
of regressors that are normally present in long-run relationship (Bangake & Eggoh, 2010).
Let us consider the following fixed effect panel regression (Ibid):
,,...,1,,...,1, TtNiuxy itititi (5)
where yit is a matrix (1,1), β is a vector of slopes (k, 1) dimension, αi is individual
fixed effect, uit are the stationary disturbance terms. It is assumed that xit (k, 1) vector is
integrated processes of order one for all i, where:
ititit xx
1 (6)
Under these specifications, following equation describes a system of co-integrated
regressions:
ititiit uˆˆˆ
1 (7)
That is to say yit is co-integrated with xit. By examining the limiting distribution of the
FMOLS estimator in co-integrated regressions, Kao and Chiang (2000) show that it is
asymptotically normal. The FMOLS estimator is constructed by making corrections for
endogeneity and serial correlation to the OLS estimator and is defined as:
Uit
N
i
N
i
iit
N
i
T
t
iitfm Tyxxxx ˆˆ)(ˆ
1 1
1
1 1
(8)
Where ∆+
£µ is the serial correlation correction term and y+
it is the modified variable of yit to
achieve the endogeneity correction. Table 3 shows results of co-integration estimation where
the dependent variable of the model is Per capita GDP and is used as a proxy for economic
growth.
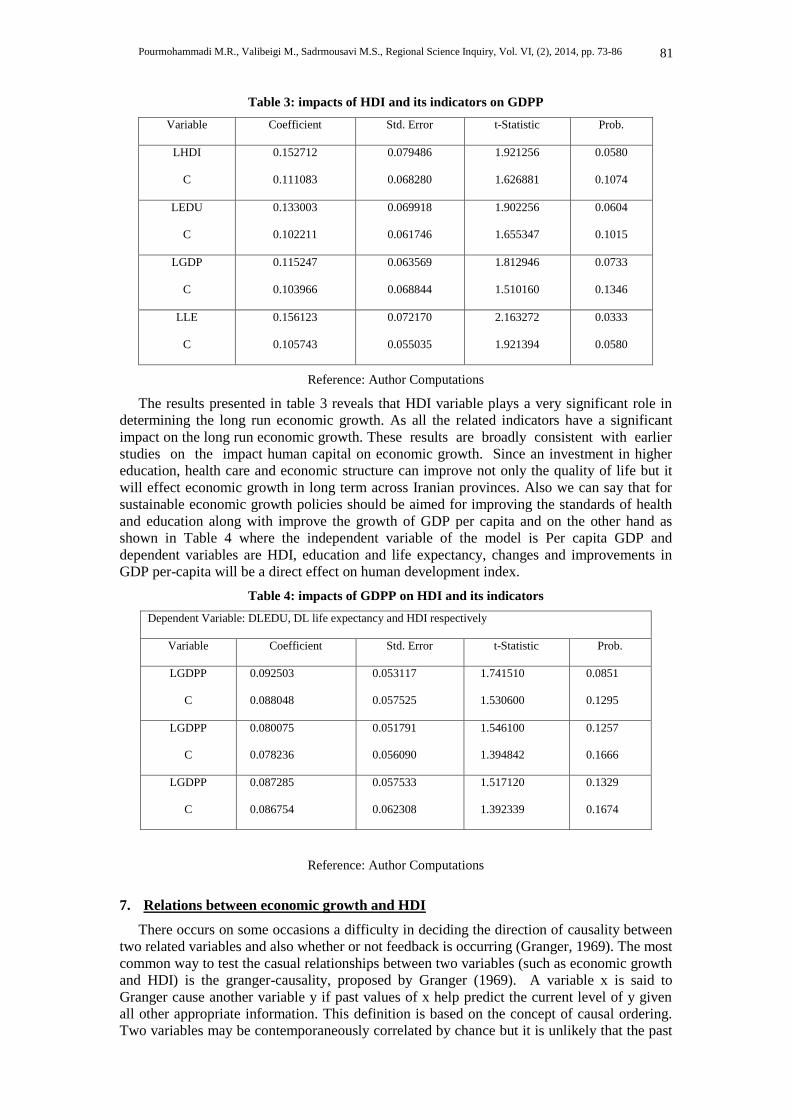
Pourmohammadi M.R., Valibeigi M., Sadrmousavi M.S., Regional Science Inquiry, Vol. VI, (2), 2014, pp. 73-86
81
Table 3: impacts of HDI and its indicators on GDPP
Variable Coefficient Std. Error t-Statistic Prob.
LHDI
C
0.152712
0.111083
0.079486
0.068280
1.921256
1.626881
0.0580
0.1074
LEDU
C
0.133003
0.102211
0.069918
0.061746
1.902256
1.655347
0.0604
0.1015
LGDP
C
0.115247
0.103966
0.063569
0.068844
1.812946
1.510160
0.0733
0.1346
LLE
C
0.156123
0.105743
0.072170
0.055035
2.163272
1.921394
0.0333
0.0580
Reference: Author Computations
The results presented in table 3 reveals that HDI variable plays a very significant role in
determining the long run economic growth. As all the related indicators have a significant
impact on the long run economic growth. These results are broadly consistent with earlier
studies on the impact human capital on economic growth. Since an investment in higher
education, health care and economic structure can improve not only the quality of life but it
will effect economic growth in long term across Iranian provinces. Also we can say that for
sustainable economic growth policies should be aimed for improving the standards of health
and education along with improve the growth of GDP per capita and on the other hand as
shown in Table 4 where the independent variable of the model is Per capita GDP and
dependent variables are HDI, education and life expectancy, changes and improvements in
GDP per-capita will be a direct effect on human development index.
Table 4: impacts of GDPP on HDI and its indicators
Dependent Variable: DLEDU, DL life expectancy and HDI respectively
Variable Coefficient Std. Error t-Statistic Prob.
LGDPP
C
0.092503
0.088048
0.053117
0.057525
1.741510
1.530600
0.0851
0.1295
LGDPP
C
0.080075
0.078236
0.051791
0.056090
1.546100
1.394842
0.1257
0.1666
LGDPP
C
0.087285
0.086754
0.057533
0.062308
1.517120
1.392339
0.1329
0.1674
Reference: Author Computations
7. Relations between economic growth and HDI
There occurs on some occasions a difficulty in deciding the direction of causality between
two related variables and also whether or not feedback is occurring (Granger, 1969). The most
common way to test the casual relationships between two variables (such as economic growth
and HDI) is the granger-causality, proposed by Granger (1969). A variable x is said to
Granger cause another variable y if past values of x help predict the current level of y given
all other appropriate information. This definition is based on the concept of causal ordering.
Two variables may be contemporaneously correlated by chance but it is unlikely that the past

Pourmohammadi M.R., Valibeigi M., Sadrmousavi M.S., Regional Science Inquiry, Vol. VI, (2), 2014, pp. 73-86 82
values of x will be useful in predicting y, given all the past values of y, unless x does actually
cause y in a philosophical sense. Similarly, if y in fact causes x, then given the past history of
y it is unlikely that information on x will help predict y. Granger causality is not identical to
causation in the classical philosophical sense, but it does demonstrate the likelihood of such
causation or the lack of such causation more forcefully than does simple contemporaneous
correlation (Geweke, 1984). However, where a third variable, z, drives both x and y, x might
still appear to drive y though there is no actual causal mechanism directly linking the
variables. The simplest test of Granger causality requires estimating the following two
regression equations (Stern, 2011):
k
t
k
j
jtijtit
tyx
1 1
(9)
k
t
k
j
jtijtit
tyyy
1 1
(10)
Where εt and θt are two white noise series and k is maximum number of lags. Granger
causality is very sensitive with number of lags used. Four findings are possible in Granger
Causality test a) Neither variable ‘Granger Causes’ other b) Unidirectional Causality from x
to y but not vice versa C) Unidirectional Causality from y to x but not vise versa d) Both
variables cause each other (see Akram, 2008; stern, 2011). Table 5 shows the null hypothesis
of Granger no-causality between HDI and its indicators and GDP per-capita in Iranian
provinces.
Table5: empirical results of granger causality in Iranian provinces
Null Hypothesis F-Statistic Probability
Lag: 1
LHDI does not Granger Cause LGDPP
LGDP does not Granger Cause LHDI
0.23116
20.5109
0.6319
2.E-05
Lag:2
LHDI does not Granger Cause LGDP
LGDP does not Granger Cause LHDI
0.56685
7.52207
0.5695
0.0010
Lag:1
LEDU does not Granger Cause LGDP
LGDP does not Granger Cause LEDU
0.04845
29.6814
0.8263
5.E-07
Lag:2
LEDU does not Granger Cause LGDP
LGDP does not Granger Cause LEDU
1.99736
8.00310
0.1422
0.0007
Lag:1
LLE does not Granger Cause LGDP
LGDP does not Granger Cause LLE
0.13831
23.7480
0.7109
5.E-06
Lag: 2
LLE does not Granger Cause LGDP
LGDP does not Granger Cause LLE
0.46466
14.0117
0.6300
6.E-06
Source: Author Computations

Pourmohammadi M.R., Valibeigi M., Sadrmousavi M.S., Regional Science Inquiry, Vol. VI, (2), 2014, pp. 73-86
83
The results suggest that Granger causality from economic growth to HDI, education and
life expectancy exist but there is no relationship vice versa. In other words, HDI, education
and life expectancy cannot influence growth in Iranian provinces.
The positive sum of lagged coefficients implies that economic growth has a totally
positive effect on quality of life. That is to say, a higher economic growth comes with a
higher provincial quality of life.
8. Conclusion and Policy Implication
One of the goals Iran has set up is improvement of regions that have been developed less if
compared to the development level of the regions with more standard living. Trying to
improvement regions economic performance especially in poor regions has strengthened the
debate on impact investments in human development on long term economic growth. In other
words, it is also pertinent to ask whether such investments are causing economic growth and
better performance in long term.
The empirical findings of this study show that the average HDI across Iran provinces have
increased, implying that although still inequality remains but the quality of life also has
raised. Also results support the finding that human development is positively related with
economic growth in Iranian provinces in the long run.
Moreover, the results of granger causality test indicate that there is unilateral causality
from GDP per capita to the HDI, health and education. Hence, for improving of HDI and its
indicators, we should emphasize on the increase of per capita income.
This study supposes that stable and rational economic growth positively influences
both in quality of life and inequality in long term. Speedy economic growth can expand
Iran’s provincial market size and development level, which will be caused better
performance in quality of life in long term and provide more employment opportunities.
An increase of GDP per capita and income can improve the HDI and investment on the
production in Iranian provinces cause to the enhancement of income and quality of life.
With respect to the results of this paper the main policy implications of the study is that in
relation to regional development especially in more poor regions, it can be achieved first by
redistribution of income, the increase of production and employment, structural investment
and other economic opportunities between provinces and then increasing and improving the
stock of HDI and related indicators especially if current stocks of province in special indicator
are at lower end.
References
Akram, Naeem., Padda, Ihtsham ul Haq., Khan, Mohammad. (2008). The long term
impact of health on economic growth in Pakistan. Pakistan Development Review,
4, 487-500.
Bangake, C., Eggoh, J. (2010). International Capital Mobility in African Countries: A
Panel Co-integration Analysis. Center for the Study of African Economies
(CSAE). Oxford University.
Barro, R. J. (1997). Determinants of Economic Growth. Cambridge: MIT Press.
Barro, R. J. and Sala-i-Martin, X. (1995). Economic growth. New York: McGraw-
Hill.
Becker, G. S. (1993). Human Capital. Chicago: Chicago University Press.
Bils, M. & Klenow, P. J. (2000). Does Schooling Cause Growth?. The American
Economic Review, 90(5), 1160-1183.
Bloom, D. E., Sachs, J. D. (1998). Geography, Demography and Economic Growth
in Africa. Brookings Papers on Economic Activity, 2, 207-95.
Bloom, D. E. & Williamson, J. (1998). Demographic Transitions and Economic
Miracles in Emerging Asia. World Bank Economic Review, 12, 419-455.

Pourmohammadi M.R., Valibeigi M., Sadrmousavi M.S., Regional Science Inquiry, Vol. VI, (2), 2014, pp. 73-86 84
Bloom, D. E., Cohen, J. E. (2002). Education for all: An unfinished revolution.
Daedalus, 131 (3), 84–95.
Boozer, M., Ranis, G., Stewart, F., Suri, T. (2003). Paths to Success: The Relationship
between Human Development and Economic Growth. New Haven: Economic
growth Center, Yale University.
Bundala, Ntogwa. (2012). Economic Growth and Human Development; a Link
Mechanism: An Empirical Approach. From Munich Personal RePEc Archive.
47648.
Crafts, N. (1999). Economic growth in the twentieth century. Oxford review of
economic policy, 15, 18 -34.
Fukuda, P. S. (2001). Indicators of human development and human rights- Overlaps,
differences and what about the human development index?. Statistical journal of
the United Nations, 18, 239–248.
Granger, C. W.J. (1969). Investigation causal relations by econometric models and
cross-spectral methods. Econometrica, 37(3), 424-438.
Habashi, J., Wright, L., Hathcoat, J. (2012). Patterns of human development
indicators across constitutional analysis of children’s rights to protection, Provision
and Participation. Social Indicator Research,105, 63–73.
Haldar, S. K., Mallik, G. (2010). Does Human Capital Cause Economic Growth? A
Case Study of India. International Journal of Economic Sciences and Applied
Research, 3 (1), 7-25.
Hanushek, Eric. (2013). Economic Growth in Developing Countries: The Role of
Human Capital. Economics of Education Review, Forthcoming.
Geweke, J.F. (1984). Measures of conditional linear-dependence and feedback
between time series. Journal of the American Statistical Association, 79 (388):
907–915.
Kao, C., Chiang, M. H. (2000). On the estimation and inference of a co-integrated
regression in panel data. Advances in Econometrics, 15, 179–222.
Klugman, J., Rodríguez, F., Choi, H. (2011).The HDI 2010: new controversies, old
critiques. United Nation: United Nations development program human
development reports.
Laszlo, K., Maria-Carmen, G. (2008). What does the human development index tell
us about convergence? Applied econometrics and international development, 8, 19-
40.
Lorentzen, P., McMillan, J., & Wacziarg, R. (2005). Death and development. NBER
Working Paper, 11620.
Management and Planning Organization of Iran (2005). Law of the Fourth Economic.
Tehran: Management and Planning Organization of Iran press.
Mankiw, N. G., Romer, D., Weil, D. (1992). A contribution to the empirics of
economic growth. Quarterly Journal of Economics, 107(2), 407–437.
Mayer-Foulkes, D. (2001). The Long-Term Impact of Health on Economic Growth in
Mexico, 1950-1995. Journal of International Development. 13(1), 123-126.
Mazumdar, K. (1999). Measuring the well-being of the developing countries:
achievement and improvement indices. Social and Industrial Research, 47, 1 – 60.

Pourmohammadi M.R., Valibeigi M., Sadrmousavi M.S., Regional Science Inquiry, Vol. VI, (2), 2014, pp. 73-86
85
McGaw, B. (2001). The role of human capital in long-term economic growth. Seoul:
Korea's five years in the OECD, ISBN 8932230315, 157-178.
McGillivray, M., White, H. (1992). Measuring development? A statistical critique of
the UNDP’s human development index. Working Paper Series No, 135, from
repub.eur.nl.
McMahon, W. W. (1998). Education and Growth in East Asia. Economics of
Education Review, 17(2), 159-172.
Mukherjee, Sacchidananda., Chakraborty, Debashis. (2010). Is there any relationship
between Economic Growth and Human Development? Evidence from Indian
States. From Munich Personal RePEc Archive, 22997, 5-27.
Noorbakhsh, F. (2002). Human development and regional disparities in Iran: a policy
model. Journal of International Development, 14, 927-949.
OECD (2001). Education at a Glance: OECD indicators 2001, Paris: OECD.
Plan and Budget Organization of the Government of Iran (1996). The Province public
revenues. Tehran: Plan and Budget Organization of the Government of Iran press.
Qadri, F, S., Waheed, A. (2011). Human Capital and Economic Growth: Time Series
Evidence from Pakistan.Pakistan Business Review, 1, 815-833.
Sachs, J. D., & Warner, A. M. (1997). Fundamental sources of long run economic
growth. The American Economic Review, 87(2), 183-188.
Sala-i-Martin, X. (1997). I Just Ran Four Million Regressions. National Bureau of
Economic Research (Cambridge MA). Working Paper, 6252.
Sant’Anna, A. P., Arau´ jo Ribeiro, R. O., Dutt-Ross, S. (2011). Employing the
components of the human development index to drive resources to educational
policies. Social Indicator Research, 104, 523–532.
Schultz, T. P. (1997). Assessing the Productive Benefits of Nutrition and Health: An
Integrated Human Capital Approach. Journal of Econometrics, 77(1), 141-158.
Self, S. & Grabowski, R. (2004). Does education at all levels cause growth? India, a
case study. Economics of Education Review, 23, 47-55.
Statistical Centre of Iran (2011). The population and housing censuses. Tehran:
Statistical Centre of Iran press.
Stern, D. (2011). From Correlation to Granger Causality. The AIJOS Capstone
Conference, University of Michigan.
Sweetland, S. R., (1996). Human Capital Theory: Foundations of a Field of Inquiry.
Review of Educational Research, 66(3), 341-359.
Temple, J. (1999). A Positive Effect of Human Capital on Growth. Economic Letters,
65, 131-134.
The Health & Medical Education center (2007). Indicators of health aspects in
Islamic republic of Iran. Tehran: the Health & Medical Education press.
UNDP (1999). Human Development Reports 1993. New York: Oxford University
Press.
UNDP (2010). Human Development Reports 2010. New York: Palgrave Macmillan.

Pourmohammadi M.R., Valibeigi M., Sadrmousavi M.S., Regional Science Inquiry, Vol. VI, (2), 2014, pp. 73-86 86
World Bank (2001). Macroeconomics and Health: Investing in Health for Economic
Development, Report of the Commission on Macroeconomics and Health. Geneva:
WHO.
Zgodavová, Kristína., Grmanová, Eva. (2009). Quality of Life in the Enlarged
European Union: A Comparison and Convergence. Trenčín: Univeristy of Trenčín
Press.

Velissariou E., Amiradis C., Regional Science Inquiry, Vol. VI, (2), 2014, pp. 87-98
87
EMPLOYMENT AND HUMAN CAPITAL IN THE GREEK HOTEL
INDUSTRY
Efstathios VELISSARIOU Department of Business Administration - Division of Hospitality management
Technological Educational Institute of Thessaly, GR
Christos AMIRADIS Department of Business Administration Division of Hospitality management
Technological Educational Institute of Thessaly, GR
Abstract
Tourism can have significant impacts on employment in tourist destinations. It must be
also noted that the human capital in the tourism sector, and more specifically in hotels,
constitutes a basic factor of quality. The effectiveness of service in the Hotel industry is often
linked with the sufficient number of hotel personnel, their individual qualities and efficient
Human resources management. The development of the hotel industry in Greece and the
resulted employment and characteristics of the human resources in relationship to the hotel
classification are presented in the present paper.
The paper presents and compares studies and statistical data related to employment and the
human capital in the hotel industry in Greece. Several studies in the last years dealt with the
volume and the characteristics of employment in the hotel enterprises in Greece. These
studies show that the indicator “employee per bed”, as well as the educational level of the
employees, are directly related to the category classification of the hotels. Furthermore the
employment in the hotel sector in Greece is calculated at 3.2% of total employment, while the
employment in the tourism sector is estimated at 10% of the labor force in Greece. The paper
concludes with proposals regarding the employment of personnel in the Greek hotel industry.
Keywords: Tourism, Hotel, Employment, Human resources, Indicators, Greece
JEL classification: J21, J24, E24, L26
1. The Human resources in Tourism
Tourism can be a basic economic sector or an export activity for countries such as Greece.
Consequently, it stimulates the regional and the national economy. The impact of Tourism on
income and employment can be assessed in direct, indirect and induced effects (Vanhove,
1981). Already in the 1980s and 1990s, it was realized that tourism occupies in an
international level significant economic importance, especially in the field of employment and
income. The conference on “Human Capital in the Tourism Industry of the Twenty-First
Century” in 1996 led to some interesting perspectives (among others): that tourism is growing
at a faster pace than the world economy; that no other economic activity appears to surpass
tourism’s capacity for generating income and jobs; urges all stakeholders to give the highest
priority to the development of human resources; acknowledges that education and training
provides the foundation underlying the development of the tourism profession; (Eduardo
Fayos-Sola & Jafar Jafari, 1996).
Tourism enterprises provide mostly services and thus create large human resource needs.
Tourism offers a diversity of jobs in a variety of operations of varied sizes and types (Szivas,
Riley, & Airey, 2003). The hotel industry is one of the most important sectors in the tourism
industry. A hotel enterprise includes several elements, such as the region and location of
establishment, the building facilities, the services provided, the image and the price. These
five elements are interrelated and constitute integral parts of an entirety, of the total
enterprising idea of hotel (Medlik, 1994). The hotels constitute enterprises that provide
services and the personnel of the companies constitute the more important capital of the
enterprises. The creativity of the personnel, the ability and their work, moves the company.
(James A.F. Stoner & R. Edward Freeman, 1989). The personnel can give a company the
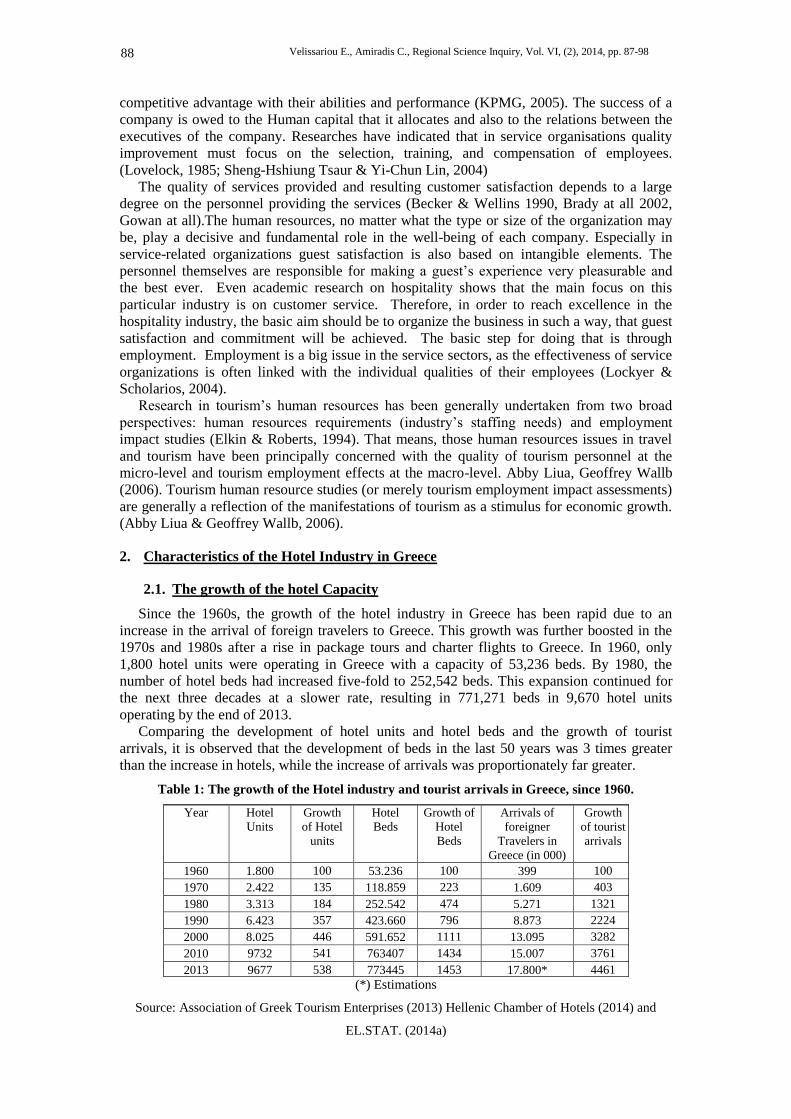
Velissariou E., Amiradis C., Regional Science Inquiry, Vol. VI, (2), 2014, pp. 87-98 88
competitive advantage with their abilities and performance (KPMG, 2005). The success of a
company is owed to the Human capital that it allocates and also to the relations between the
executives of the company. Researches have indicated that in service organisations quality
improvement must focus on the selection, training, and compensation of employees.
(Lovelock, 1985; Sheng-Hshiung Tsaur & Yi-Chun Lin, 2004)
The quality of services provided and resulting customer satisfaction depends to a large
degree on the personnel providing the services (Becker & Wellins 1990, Brady at all 2002,
Gowan at all).The human resources, no matter what the type or size of the organization may
be, play a decisive and fundamental role in the well-being of each company. Especially in
service-related organizations guest satisfaction is also based on intangible elements. The
personnel themselves are responsible for making a guest’s experience very pleasurable and
the best ever. Even academic research on hospitality shows that the main focus on this
particular industry is on customer service. Therefore, in order to reach excellence in the
hospitality industry, the basic aim should be to organize the business in such a way, that guest
satisfaction and commitment will be achieved. The basic step for doing that is through
employment. Employment is a big issue in the service sectors, as the effectiveness of service
organizations is often linked with the individual qualities of their employees (Lockyer &
Scholarios, 2004).
Research in tourism’s human resources has been generally undertaken from two broad
perspectives: human resources requirements (industry’s staffing needs) and employment
impact studies (Elkin & Roberts, 1994). That means, those human resources issues in travel
and tourism have been principally concerned with the quality of tourism personnel at the
micro-level and tourism employment effects at the macro-level. Abby Liua, Geoffrey Wallb
(2006). Tourism human resource studies (or merely tourism employment impact assessments)
are generally a reflection of the manifestations of tourism as a stimulus for economic growth.
(Abby Liua & Geoffrey Wallb, 2006).
2. Characteristics of the Hotel Industry in Greece
2.1. The growth of the hotel Capacity
Since the 1960s, the growth of the hotel industry in Greece has been rapid due to an
increase in the arrival of foreign travelers to Greece. This growth was further boosted in the
1970s and 1980s after a rise in package tours and charter flights to Greece. In 1960, only
1,800 hotel units were operating in Greece with a capacity of 53,236 beds. By 1980, the
number of hotel beds had increased five-fold to 252,542 beds. This expansion continued for
the next three decades at a slower rate, resulting in 771,271 beds in 9,670 hotel units
operating by the end of 2013.
Comparing the development of hotel units and hotel beds and the growth of tourist
arrivals, it is observed that the development of beds in the last 50 years was 3 times greater
than the increase in hotels, while the increase of arrivals was proportionately far greater.
Table 1: The growth of the Hotel industry and tourist arrivals in Greece, since 1960.
Year Hotel
Units
Growth
of Hotel
units
Hotel
Beds
Growth of
Hotel
Beds
Arrivals of
foreigner
Travelers in
Greece (in 000)
Growth
of tourist
arrivals
1960 1.800 100 53.236 100 399 100
1970 2.422 135 118.859 223 1.609 403
1980 3.313 184 252.542 474 5.271 1321
1990 6.423 357 423.660 796 8.873 2224
2000 8.025 446 591.652 1111 13.095 3282
2010 9732 541 763407 1434 15.007 3761
2013 9677 538 773445 1453 17.800* 4461
(*) Estimations
Source: Association of Greek Tourism Enterprises (2013) Hellenic Chamber of Hotels (2014) and
EL.STAT. (2014a)

Velissariou E., Amiradis C., Regional Science Inquiry, Vol. VI, (2), 2014, pp. 87-98
89
2.2. Regional distribution of the Hotel industry in Greece
The regional distribution of hotel capacity in Greece is interesting. According to the
statistical data (Table 2) 60.6% of hotel capacity in Greece is located on the Greek islands.
The majority of hotels are found in the most dominant and popular tourist destinations such as
Crete and the Dodecanese Islands, while on the mainland, the majority of hotel beds are to be
found in Athens (in Central Greece) and Thessaloniki (in Macedonia).
Table 2: Regional distribution of Hotels and bed capacity in Greece in 2013
Region Hotels Distribution Beds Distribution
Dodecanese 1040 10.75% 143864 18.60%
Epirus 380 3.93% 15228 1.97%
Thessaly 573 5.92% 28523 3.69%
Thrace 107 1.11% 6956 0.90%
Central Greece 1267 13.09% 91815 11.87%
Crete 1540 15.91% 166370 21.51%
Cycladic Islands 1033 10.67% 48962 6.33%
Macedonia 1586 16.39% 106408 13.76%
Aegean islands 395 4.08% 22273 2.88%
Ionian Islands 916 9.47% 89917 11.63%
Peloponnesus 840 8.68% 53129 6.87%
Total 9677 100.00% 773445 100.00%
Source: Hellenic Chamber of Hotels (2014)
2.3. The hotel capacity per hotel classification
In Greece, according to Act 43/2002 (FEK 43/A/7.3.2002), as was modified with Article
16 of Act 3190/2003 (FEK 249/A/30-10-03), a new system of classification of hotels was
established. This classifies hotels according to a star system (from 1 star up to 5 stars
maximum) and is based on a complex system that takes into consideration a great number of
parameters (Hatzinikolaou E. 2002).
Table 3: Hotel and bed capacities per Hotel classification in Greece
Hotel classification
Year 5 stars 4 stars 3 stars 2 stars 1 star Total
1980 hotels 37 192 432 1305 1347 3313
Beds 16031 58470 63590 76659 37792 252542
1990 hotels 45 470 1571 2722 1615 6423
Beds 20231 94293 122269 140662 46205 423660
2000 hotels 83 792 1499 4027 1672 8073
Beds 36117 149782 145097 209414 53580 593990
2010 hotels 312 1234 2268 4349 1569 9732
Beds 102429 196862 177923 230358 55835 763407
2013 hotels 361 1277 2358 4203 1478 9677
Beds 117555 194010 183722 223932 55226 773445
Capacity
1980-2013
733% 332% 289% 292% 143% 306%
Source: EL.STAT (2013a) and Hellenic Chamber of Hotels (2014)
As for the hotel categories, a continual growth is noted in the number of hotel as well as
the bed capacity in all categories. This growth is more evident in the higher categories. More
specifically, the increase in beds in 5-star hotels during the period of 1980-2013 was 733%.
The corresponding increase was 332% in 4-star hotels, 289% in 3-star hotels, and 143% in 1-
star hotels. The above data indicates that a qualitative upgrade of the hotel infrastructure in
Greece has been recorded in recent decades. The growth at the lower categories appears

Velissariou E., Amiradis C., Regional Science Inquiry, Vol. VI, (2), 2014, pp. 87-98 90
during the decades 1980-1990 while in 5 and 4-star hotels the increase is more obvious during
the period 1990 up today. As a result of the above developments, there was a gradual increase
in the number of 5-star hotels to 15.2% and a significant decrease in 1-star hotels to 7.0%. At
present 4 and 5-star hotels comprise 40.3% of hotel bed capacity.
Table 4: Hotel capacity per category classification in Greece.
Hotel Category 1980 1990 2000 2010 2012
5 stars 6.3% 4.8% 6.1% 13.4% 15.2%
4 stars 23.2% 22.3% 25.2% 25.8% 25.1%
3 stars 25.2% 28.9% 24.4% 23.3% 23.8%
2 stars 30.4% 33.2% 35.3% 30.2% 29.2%
1 star 15.0% 10.9% 9.0% 7.3% 7.0%
Total 100.0% 100.0% 100.0% 100.0% 100.0
Source: Calculated data from EL.STAT (2014a).
2.4. Size of the Hotel enterprises
The data concerning the hotel size in relation to the hotel category, demonstrates that in the
higher hotel categories the capacity is larger. In 2013 the average bed capacity in 5-star hotels
was 326 beds, in 4-star 152 beds, in 3-star 78 beds, while in 2 and 1-star hotels the capacity
was usually lower than 50 beds due to the small size of hotel enterprises.
From the 1980s to the present, the average bed capacity has remained stable at about 80
beds, regardless of minor fluctuations evident in some years. It should be noted that the
average capacity of 3, 4 and 5-star hotels has gradually decreased. One possible interpretation
of this fact may be that hotels no longer adhere to the 80s model which demanded large hotel
complexes. On the contrary, 3, 4 and 5-star hotel units which are presently being constructed
are smaller in capacity and take into consideration the environmental and cultural
characteristic of Greece.
Table 5: Bed capacity of hotels per hotel category in Greece.
Hotel
Category
Bed/ Hotel
1980
Bed/ Hotel
1990
Bed/ Hotel
2000
Bed/Hotel
2010
Bed/ Hotel
2013
5 stars 433 450 435 328 326
4 stars 304 201 189 160 152
3 stars 147 78 97 78 78
2 stars 59 52 52 53 53
1 star 28 29 32 36 37
1-5 stars 76.2 65.9 73.7 78.5 79.9
Source: Calculated data from SETE (2013) and Hellenic Chamber of Hotels (2014)
3. Employment in the Greek Hotel Industry
A direct impact of tourism development is the increase of employment in the enterprises
that support tourism. The hotel industry employs a large number of the total employees in
tourism. Employment in the hotel industry in Greece shows many particularities due to the
seasonality of employment in resort hotels. The seasonality of the businesses poses
difficulties for both, the employees and the hotel enterprises. Taking into consideration that
most hotel units are located in regions with natural resources which are however not very
well-developed, finding a large number of employees which are also specialized for only a
limited period of time is very challenging. Therefore, hotel enterprises need to provide
incentives such as high salaries, bonuses, free accommodation and board to attract potential
employees.

Velissariou E., Amiradis C., Regional Science Inquiry, Vol. VI, (2), 2014, pp. 87-98
91
According to the data of the Hellenic Statistical Authority (El.Stat., 2014b), the number of
employees in the hotel and restaurant–catering sectors in Greece was (in 2012) 275,100, or
7.25% of the total employment in Greece. Even in the period 2008-2012 the employment in
this sector fell about 8.9%, the employment in the Hotel – restaurant sector increased from
6.91% to 7.25% of the total employment in Greece, showing the importance of the tourism in
the Greek economy. Considering that the unemployment rate in the period 2008-2012 was
tripled and reached 23.6%, the economic crisis had smaller effects in the Tourism sector.
The seasonality of the employment in the hospitality sector is another characteristic of
tourism in Greece. The difference between the 1st year quarter and the 3rd year quarter which
can be seen in the table 6, is about 15% to 24% of the total employees in the sector. The fact
that since the beginning of 2000 until 2012 there is a gradual decrease of seasonality in the
employment is interesting.
Table 6: Employment in the Hotel and Restaurant sector in Greece.
Year 2000 2002 2004 2006 2008 2010 2012
1st Quarter 235.1 248.2 240.5 273.0 288.2 288.0 258.2
2nd
Quarter 272.8 293.9 279.6 300.9 325.5 302.2 275.1
3rd
Quarter 289.0 306.3 298.0 324.4 339.5 333.4 296.0
4th Quarter 265.0 278.8 278.8 297.4 307.1 296.7 262.3
Mean 265.5 281.8 274.2 298.9 315.1 302.2 275.1
% to the
employment
in Greece
6.49% 6.75% 6.36% 6.71% 6.91% 6.83% 7.25%
Difference
1st & 3
rd
Quarter
53.9 58.1 57.5 51.4 51.3 45.4 37.8
Difference
in % 22.93% 23.41% 23.91% 18.83% 17.80% 15,76% 14.64%
Unemploym
ent 11.0 10.2 10.4 8.8 7.2 11.8 23.6
Source: Calculated based on El.Stat., (2014b) and El.Stat., (2013)
According to Vorlow, (2007), 5-star hotels have the most seasonal employees at a rate of
27.3%, 4-star hotel have 14.3%, 3-star hotels have 13.5%, 2-star hotels have 7.3% and finally
1-star hotels have 10.4%. Of the total number of seasonal employees, 4-star hotels account for
40.3% of seasonal employees, 5-star hotels 8.2%, 3-star hotels 12.8% and 2-star hotels 10.1%.
Apart from the difficulties in finding the necessary number trained employees, the
personnel cost in a service providing enterprise is proportionally very high in relation to its
total costs. Consequently, hotels need to hire the required personnel at the lowest possible
cost. In Greece, one solution to this problem is to hire a large number of trainees from Greece
or abroad doing their vocational placement training. Alternatively, unskilled foreign
employees from other Balkan or East European countries are hired at a low cost.
According to a recent survey of the Association of Greek Tourism Enterprises (Zacharatos,
2013) the percentage of foreign employees in hotels in Greece amounts to about 21.42%
(August 2012). The highest rates of employment of foreign employees appear in the regions
of Cyclades and Dodecanese with 33.1% and the smallest percentage appears in the regions of
Thessaly and Epirus with only 13%. From this data it is evident that the regions of Greece that
record high incoming seasonal tourism have the highest rate of employment of foreign
employees. In contrast, regions with a low seasonality and minor tourism development have a
low rate of employment of foreign employees.
3.1. Surveys about the employment in the Hotel industry in Greece
The employment in the Greek Hotel industry and in the Tourism market in general, attracts
great economic interest. In the last decade several studies have been conducted on this topic.
The most significant are presented below.

Velissariou E., Amiradis C., Regional Science Inquiry, Vol. VI, (2), 2014, pp. 87-98 92
Research by the Aegean University in 2001 for the Association of Greek Tourism Enterprises (SETE, 2003) found that employment created by hotel enterprises ranges from 0.315 to 0.080 employees per hotel bed on the hotel category (table 7). According to the data below in year 2000 the employment in the hotel industry represented one employee for 6.13 hotel beds. However, it should be noted that the particular study took place when an older classification applied in Greece (before 2003) and 6 hotel categories existed.
Table 7: Employment Indicators in Hotels in Greece in the year 2000.
Hotel Category
Indicator (E/B)
Employees/Bed Lux 0.315 A 0.195 B 0.17 C 0.13 D 0.08 E 0.08
L to E Mean 0.163
Source: SETE, (2003).
In another study conducted in 2006 (Vorlow, 2007) investigating the total number of employees in hotel enterprises, on average, there were 18 employees per business. On average, 5-star hotel units had 142 employees, 4-star hotels had 55 and 3-star hotels had 20. Despite the fact that there are a greater number of 2-star hotels, they averaged only 9 employees per enterprise. Finally, 1-star hotels averaged 5 employees per business (table 8). Estimating the employment per bed, shows a very high indicator of 0.236 employees per bed.
Table 8: Employment Indicators in Hotels in Greece in the year 2006
Hotel category Employees per hotel Indicator Employees/Bed(*) 5 stars 142 / Hotel 0.385 4 stars 55 / Hotel 0.294 3 stars 20 / Hotel 0.221 2 stars 9 / Hotel 0.173 1 star 5 / Hotel 0.146
5 to 1 stars 18 employees per hotel 0.236
Source: Vorlow (2007) and own calculations (*)
According to the results of a study conducted in the year 2008, in a sample of 140 hotels (2 to 5-star), the number of employee per bed in the Hotel enterprises was 0.181 (Velissariou & Krikeli 2008). The difference from findings of previous research (0.163) is due to the fact that Velissariou & Krikeli did not include small, 1-star hotels in the study, which show a lower indicator (employees/bed).
The Indicator Employee/Bed was 0.391 in 5-star hotels, 0.267 in 4-star hotels and 0.161 in 3-star hotels, whereas in 2-star hotels, it dropped to 0.139 (see table 9). This indicates that as the category decreases, the indicator in the relation of employee/bed decreases as well, while the average in all categories of hotels is 0.181 employees per bed, or 5.53 beds per employee.

Velissariou E., Amiradis C., Regional Science Inquiry, Vol. VI, (2), 2014, pp. 87-98
93
Table 9: Employment Indicators in Hotels in Greece in the year 2008.
Indicator (B/E) Indicator (E/B) Hotel category Bed / Employee Employee/Bed
5 stars 2.56 0.391 4 stars 3.74 0.267 3 stars 6.19 0.161 2 stars 7.15 0.139
5 to 2 stars 5.53 0.181
Source: Velissariou, Krikeli (2008).
In a recent study (Zacharatos, 2013) conducted by the Research Institute for Tourism, in the year 2012 in 1204 hotels, showed that employment in the month of May 2012 amounted to 94.360 and in the month of August to 119.920. In particular, the survey showed an average employment of 0.28 employees per Hotel room (in May) and 0.35 employees per hotel room in the month of August. Specifically, the average employment per room and Hotel classification are given in table no 10. Adjusting the survey results to employees per bed results an indicator of 0.182. This indicator is similar to the results of the study of Velissariou & Krikeli (2008).
Table 10: Employment Indicators in Hotels in Greece, in the year 2012.
Hotel category
Employees per room in Mai
Employees per room in August
Employees per bed
in August* 5stars 0.51 0.62 0.306
4 stars 0.31 0.38 0.197
3 stars 0.19 0.24 0.125
2 stars 0.13 0.18 0.096
1 star 0.09 0.13 0.067
Average 0.28 0.35 0.182
Source: Zacharatos (2013) and own calculations*
In table 11 the results of the four studies mentioned above are presented.
Table 11: Comparison of the Employment indicators in Greece.
Conducted by and Year of research
Hotel category
SETE 2000
Vorlov 2006
Velissariou & Krikeli
2008
Zacharatos 2012
5 stars 0.315 0.385 0.391 0.306 4 stars 0.195 0.294 0.267 0.197 3 stars 0.17 0.221 0.161 0.125 2 stars 0.13 0.173 0.139 0.096 1 star 0.08(*) 0.146 -- 0.067 1 to 5 0.163 0.236 0.181 0.182
(*) D & E category, according the old classification type
Comparing the results of the four surveys above, it is noted that the employment indicator per bed in hotels in Greece remains approximately constant at 0.18.
On the other hand the indicator of employment in each hotel category has decreased. For example, while in the mid-2000s in 5 star hotels the employment indicator was between 0.38

Velissariou E., Amiradis C., Regional Science Inquiry, Vol. VI, (2), 2014, pp. 87-98 94
and 0.39, in the year 2012 the indicator fell to 0.306. A similar decline was also recorded in
the other hotel categories. The employment, however, was not reduced because the rate of 5
and 4 stars hotels increased throughout Greece. Those hotel categories show higher
employment rates and this affects the total employment in the hotels at a greater degree.
According to the employment indicator above (0.18) can be calculated indirectly, but with
great precision the size of employment in hotels in Greece. In particular, it can be estimated
that in the year 2013 the total employment in hotels in Greece amounts to 139,220 employees
(773,445 beds X 0.18), or 3.8% of total employment in Greece (data for August 2013). When
taking into consideration the data from the SETE (2003) study that hotel employees represent
only 37.9% of the employees in the tourism industry in Greece, then the total number of
people employed directly in tourism should amount to 367,335 employees or 10.0% of
employment in Greece.
The Foundation for Economic and Industrial Research in Greece (IOBE, 2012) estimates
the direct and indirect employment in the Tourism Sector in Greece at 446 thousand work
places in the year 2010.The direct employees in the tourism sector are about 320 thousands
and the indirect employees are about 126 thousand. The direct employees represent about 8%
of the employment in Greece (IOBE, 2012). It should be noted that between the years 2010
and 2013, employment in the tourism sector has increased compared to other sectors of the
economy, because it is influenced to a lesser degree by the economic recession in Greece. Οn
the other hand it should be underlined that the percentage of 10% employment in Tourism
applies to the maximum of employment, during the month of August. Due to the seasonality
the employment rate can be decreased by 15% to 24%, as presented in the table 6.
3.2. Educational level of the Hotel employment
Obviously, the hotel industry plays an important role in the domestic economy, offering a
great number of Employment positions in Greece. According to the World Tourism
Organization, based on the Travel and Tourism Competitiveness index, despite the fact that
Greece is in the 24th place worldwide among 133 countries, it is only 44th in the area of
“Human resources” and 53rd in the area of “Education and Training”, due to the lack of
specialized personnel 41st in the “Availability of qualified labor” (World Economic Forum,
2009). The plethora of small hotel units in Greece which function fundamentally as family-
run businesses serves as obstacle in the hiring of highly educated personnel in services as well
as in administration. Moreover, pressure rising from an increased demand in the Greek
tourism industry in turn results in a demand for improved quality in hotel units. The
professionalism and education of the personnel acts as a link between effective-quality
service, professionalism and profit in the field. Although the number of people employed in
the tourism industry in Greece is quite high, the education background of these employees is
low. This is due to the seasonal nature of employment in tourism. It should be noted that
Greece is a tourist destination mainly for summer holidays. The fundamental problem among
seasonal employees is their lack of education/training in tourism. This is ‘covered’ by the
support of well-trained personnel which makes up the core staff and is that which defines the
overall quality of services provided in tourism
According to Velissariou & Krikeli (2008), table 12 clearly shows that as expected, the
education level of personnel in the upper Hotel categories is higher. For example in 5-star
hotels the employees with a university degree or a post graduate degree represent 30.82% of
all personnel. On the contrary in 2 stars hotels the corresponding percentage is only 18.42%.
In general the employees’ educational level in total is very low. Employees with only a
Secondary School (Lyceum) diploma or with “obligatory education” represent a total of
62.3% of the overall hotel personnel in Greece. Only 20.35% of the employees in the Greek
hotel industry have a university degree or a postgraduate degree. It is also interesting to note
that seasonal employees in hotels have a lower level of education in comparison with
employees in hotels in general. The employees without technical or scientific education
represent 67.4% of the personnel in the seasonal operating Hotels.
The hotels are trying to correct the low educational level with the realization of continuing
training programs. According to Velissariou & Krikeli (2008) the majority of 5-star hotels, at
a rate of 95.5% and the 4 and 3-star hotels at a rate of 75% realised training programs for the
hotel personnel. On the contrary, a high percentage of 2-star hotels did not provide any

Velissariou E., Amiradis C., Regional Science Inquiry, Vol. VI, (2), 2014, pp. 87-98
95
training programs nor did they participate in training programs at other institutions. It’s quite
interesting to mention that 59.1% of 5 star hotels provide training programs for their new
personnel, while in 4 star hotels the percentage goes up to 32.6% and in the 3 star hotels it
reaches 2.3%, while in 2 star hotels only 7.89% of new staff takes training on the job.
The study of the Foundation for Economic and Industrial Research in Greece (IOBE,
2012) presented similar results about the educational level of the hotel employees. According
to this study, the majority (45%) of employees in the accommodation services in Greece are
graduates of secondary education. The graduates of higher education make up only 16% of
employees. This percentage is very low, considering that in all sectors of the Greek Economy
this figure stands at 26%. According to the Foundation, the seasonality in the tourism industry
in Greece and the (usually) small size of hotel units turn part of the human capital with higher
level of education to professions outside the tourist market.
Table 12: Educational level of personnel in Hotels in Greece
Educational level of the employees
Hotel
category
Post
graduate
University
degree
Technical
school
Secondary
School
(Lyceum)
Basic
education
Basic +
Lyceum
5 stars 2.33% 28.49% 26.37% 24.95% 17.86% 42.81%
4 stars 1.76% 18.86% 21.76% 33.76% 23.87% 57.63%
3 stars 1.58% 17.54% 16.08% 42.02% 22.78% 64.80%
2 stars 1.17% 17.25% 12.87% 46.49% 22.22% 68.7%
5 to 2 1.55% 18.80% 17.40% 39.84% 22.42% 62.26%
Seasonal
hotels 1.52% 14.19% 16.88% 37.97% 29.44% 67.41%
Source: Velissariou & Krikeli (2008).
The research about “Greek Hotel Employees’ Education Level and Company
Performance” conducted in 2006 in Greece (Vorlow, 2007), came to better results (table 13).
This research has especially shown, that the employees with basic education, or with a
Lyceum degree, represents about 59.1%. Employees with a Postgraduate degree (Ph.D. or
Master) or a university degree in Tourism represents about 20.7% of the personnel in hotels.
This research has also shown, that in the upper hotel categories, the educational level of the
employees is higher.
Table 13: Educational level of hotel personnel according to hotel category
Hotel classification
Educational level 1 star 2 stars 3 stars 4 stars 5 stars In total
Postgraduate (PhD or
Master degree) 0.0 1.1 1.4 2.6 3.0 8.1
University degree in
Tourism 0.1 2.5 2.7 4.2 3.0 12.6
Other University
degree 0.1 1.1 0.8 1.9 0.8 4.7
Technical school in
Tourism 0.3 2.0 2.2 5.5 2.9 12.8
Other Technical
school 0.0 0.4 0.7 1.2 0.4 2.6
Secondary school
(Lyceum) 3.1 12.7 9.5 12.1 3.5 40.9
Basic education 0.9 4.7 4.7 6.6 1.2 18.2
4.6 24.4 22.1 34.2 14.8 100.00
Source: Vorlow C. (2007)
On average, enterprises with a high number of degree holders should also have higher
functional costs. Nevertheless, this is not evident in the hotel industry in Greece. There isn’t

Velissariou E., Amiradis C., Regional Science Inquiry, Vol. VI, (2), 2014, pp. 87-98 96
much difference in the functional costs as a percentage of turnovers. Moreover, units
employing more tertiary education graduates show slightly lower functioning costs in relation
to their turnover than those employing mainly primary and secondary school graduates.
Therefore, employing highly educated staff does not also entail higher functioning costs
relative to the unit’s turnover. On the contrary, on average, it positively relates to higher
turnover (Vorlow, 2007).
4. Conclusions
In the Greek hotel industry, the Indicator employees per bed and their education level
constitute basic parameters defining the quality of services provided. The development of
tourism in Greece has led to an abundant supply of hotels, which vary significantly in terms
of personnel, depending on their category. The main conclusions are:
Since 1960, the hotel industry in Greece has a continuing growth reaching a
capacity of 773 thousand beds.
Since 1980 there has been a significant increase in 4 and 5-star hotels
representing the 40.3% of the Hotel capacity.
At the same period a reduction in the average size of these hotels at 70 beds
per Hotel was recorded.
The higher hotel categories show a significant greater bed capacity reaching
326 beds on average in the 5 star Hotel category.
The Islands of Greece concentrate about the 60% of the Hotel capacity in
Greece.
According to several studies, the number of employees per bed amounts to
about 0.18. Among the hotel categories, the Indicator employment per bed
varies significantly.
The Hotel industry in Greece concentrates about 3.2% of the total
employment in Greece.
The educational level of personnel in hotel enterprises is very low, with
about 60% of employees having only basic education or secondary degree
and only 16-20% having a university degree.
The education level is lower in seasonally operating hotels.
Continuing education is evident in the majority of 5-star hotels (95.5%). On
the contrary, a high percentage (26%) of 3 and 4-star hotels do not provide
any educational programs.
5. Proposals for the Human Resource management
The personnel in hotel enterprises make up the most important “capital” in its
development. The success of an enterprise depends on its human “capital” and their
relationship with management. Human resource management in hotel accommodation
therefore must follow the next guidelines:
1. Ensure that people educated and experienced in the hotel and tourism sector are hired.
2. The Indicator of employees per bed should be high and not less than 0.3 in the upper
categories and 0.1 in the lower categories.
3. The hotel should provide opportunities to the employees for skill improvement and
development, while satisfying the needs of the employees.
4. The hotel must provide training programs for newly recruited employees and also for
the existing personnel due to advances in technology and changes in the services provided as
well as in the customers’ preferences, etc.
5. The hotels should give priority to the rehiring of seasonal employees.
6. Good communication between personnel and management should be strived for so as
to create a harmonic relationship between them.

Velissariou E., Amiradis C., Regional Science Inquiry, Vol. VI, (2), 2014, pp. 87-98
97
7. It should make its personnel feel important as it is the most significant asset the hotel
has.
In conclusion, the future of the Greek hotel industry and the Greek tourism economy in
general is related to the improvement in quality of hotel services. This will in turn lead to an
improvement in competitiveness and will depend on its human resources. More specifically, it
will depend on their number, education level and experience.
REFERENCES
Abby Liua, Geoffrey Wallb (2006) Planning tourism employment: a developing country
perspective Tourism Management 27 (2006) 159–170.
Association of Greek Tourism Enterprises (2013), Tourism statistics. Available in:
http://sete.gr/EN/TOURISM/Statistics/Statistics%20categories/?form_catID=82
Becker W.S., R.S Wellins, 1990, “Customer - Service Perceptions and Reality,” Training and
Development Journal, 4 (3), 49-51.
Brady, M.K., J.J. Cronin, R.R. Brand, 2002, “Performance-only measurement of service
quality: A replication and extension”, Journal of Business Research, 55 (1),17-31.
Eduardo Fayos-Sola & Jafar Jafari Tourism Human Resources Development Conference
Reports 1996 in: Human Resources Development and Quality Tourism: A Multi-
Conference Report. Annals of Tourism Research 23:228-23 1.
Elkin, R. D., & Roberts, R. S. (1994). Evaluating the human resource (employment)
requirements and impacts of tourism developments. In J. R. B. Ritchie, & C. R. Goeldner
(Eds.), Travel, tourism and hospitality research: a handbook for managers and researchers,
(2nd ed) (pp. 403–412). New York: Wiley.
EL.STAT. (2013) Hellenic Statistical Authority “Hellas in Numbers 2013” available in
http://www.statistics.gr/portal/page/portal/ESYE/BUCKET/General/ELLAS_IN_NUMBERS
_GR.pdf.
EL.STAT. (2014a) Hellenic Statistical Authority. “Hotel, similar establishments and camping
occupancy” available in
http://www.statistics.gr/portal/page/portal/ESYE/PAGE-themes?p_param=A2001
EL.STAT (2014b), Hellenic Statistical Authority. “Labor force Quarterly” available in
http://www.statistics.gr/portal/page/portal/ESYE/PAGE-themes?p_param=A2001.
FEK (43/A/7.3.2002). Official Journal of the Hellenic Republic. Act. 43/2002
FEK (249/A/30-10-03). Official Journal of the Hellenic Republic. Article 16 of Act
3190/2003
Gowan, M. S., C. Seymour, Ibarreche, C. Lackey, 2001, “Service Quality in a Public Agency:
Same Expectations but Different Perceptions by Employees, Managers, and Customers,”
Journal of Quality Management, 6 (1), 275–91.
Hatzinikolaou E, 2002, “The Law for the Accommodations and other tourist installations”,
Athens (in Greek).
Hellenic Chamber of Hotels, (2014) Regional Distribution of hotel units and beds by category
and prefecture. Available in: http://www.grhotels.gr/GR/BussinessInfo/library/
DocLib/2013_HOTELS_TOTAL.pdf
IOBE, (2012) The Employment in the Tourism Sector. Foundation for Economic and
Industrial Research. Available in http://sete.gr/_fileuploads/entries/Online%20library/GR/
Hapasxolisistontouristikotomea.pdf
James A.F. Stoner & R. Edward Freeman, 1989, “Management”, fourth edition, Prentice Hall.
KPMG, 2005, 8th Symposium for Human Resources, 22-23/2/2005.

Velissariou E., Amiradis C., Regional Science Inquiry, Vol. VI, (2), 2014, pp. 87-98 98
Lockyer, C. D. Scholarios, 2004, “Selecting hotel staff: why best practice does not always
work”, International Journal of Contemporary Hospitality Management, 16(2):125-135.
Lovelock, C. H. (1985). Developing and managing the customerservice function in the service
sector. In J. A. Czepiel, M. R. Soloman, C. F. Surprenant, & E. G. Gutman (Eds.), The
Service Encounter (pp. 42–54). Lexington, MA: Lexington Books.
Medlik S, 1994, “Dictionary of Travel, Tourism and Hospitality”, Oxford: Butterworth-
Heinemann.
SETE, 2003, “Tourism and Employment”, Athens, (in Greek). Available in:
http://sete.gr/_fileuploads/entries/Studies%20&%20Publications/GR/Tourismos%20kai%20A
psxolisi.pdf
Sheng-Hshiung Tsaur, Yi-Chun Lin (2004) Promoting service quality in tourist hotels: the
role of HRM practices and service behavior. Tourism Management 25 (2004) 471–481
Szivas, E., Riley, M., & Airey, D. (2003). Labor mobility into tourism: attraction and
satisfaction. Annals of Tourism Research, 30(1), 64–76.
Vanhove, N. (1981) Tourism and employment International Journal of Tourism Management
September 1981.
Velissariou E., O. Krikeli, 2008, “The Human factor as criteria of quality in hotels.
Measurements in the Greek Hotel sector”. 1st International Conference on Tourism and
Hospitality Management. Athens 13-15 June 2008.
Vorlow E. Costas (2007) “Greek Hotel Employees’ Education Level and Company
Performance”, Eurobank Research ECconomy & Markets, Issue 4 vol. 2, May 2007.
Available in http://www.eurobank.gr/Uploads/Reports/Econ%20Markets%204(2)%20. pdf
World Economic Forum (2009): The Travel & Tourism Competitiveness Report 2009.
available in http://www.weforum.org/documents/TTCR09/ index.html
Zacharatos (2013): Developments in Tourism and Key figures of Greek Hotels in 2012.
Research Institute for Tourism. Athens.

Mazis I., Regional Science Inquiry, Vol. VI, (2), 2014, pp. 99-118
99
THE PSYCHOLOGICAL AND SYMBOLIC FACTOR OF GREAT
BRITAIN'S GEOSTRATEGY IN THE CYPRUS-SUEZ ISSUE
Ioannis Th. MAZIS Faculty of Turkish Studies and Modern Asian Studies
School of Economic and Political Sciences
National and Kapodistrian University of Athens
[email protected]; [email protected]
Abstract
In the present paper I argue that, since Cyprus came under the British rule and for at least
seven decades, Britain did not consider Cyprus a “territory of major strategic importance for
the Crown”. I also argue that the policy makers of colonial Britain probably considered this
island one of the “poor colonies”, since it did not have raw material deposits or any kind of
industrial infrastructure. Thus, I suggest that Greek researchers should examine how Great
Britain was perceiving the strategic importance of Cyprus until the end of World War II and,
therefore, should not insist on blaming the Greek side that, supposedly, did not take into
account Britain’s sensitivity and “unwisely sought the Union (Enosis) of Cyprus with Greece,
which annoyed Britain and led to the well-known traumatic events”.
Keywords: Psychological and symbolic factor, great Britain’s Geostrategy, Cyprus-Suez
JEL classification: F52, F55, F59
1. First Stage: Cyprus as a class II British colony
The fact that, even after – and despite – the construction of naval and air bases, Cyprus did
not have a prominent role, neither during World War I nor during WW II, is indicative of the
minor geo-strategic, as well as, operational and even tactical importance which policy makers
of Britain’s Grand Strategy attached to Cyprus.
Around the mid-20th century, the population of Cyprus was estimated at 500,000, the vast
majority of whom (more than 80%) were Greek. Turks (or to be more accurate, Muslims)
constituted 18% of the population, while the remaining 2% were Armenians, Maronites,
“Latins” (Levantines) and British. Of course, it was well- known, to the British coloniser as
well, that the burning desire of the vast majority of residents (Greek, in all respects), was the
“Union” of Cyprus with Mother Greece – something as much obvious, reasonable and
legitimate, as the equivalent request of the vast majority of the other Greek Great Island,
Crete (also Greek, in all respects), or the Dodecanese or, shortly before, the Ionian Islands.
The fact is, though, that whenever the issue of the Union of Cyprus with Greece emerged –
whether spontaneously as an instant action and an exclusive initiative of the Greek residents
of the island, first in 1931, or after thorough planning followed by constant actions on many
levels, and eventually, with the official support of Greece in 1955 – the reaction of London
was absolutely negative.
In this context, it would be useful to remind that, as a result of the brutally suppressed
popular uprising of 1931, Britain revoked the status of restricted self-administration that had
been in force up until then, abolished the Charter in force and the elected local parliamentary
body, and Cyprus became a direct-rule colony controlled through the Governor.
Some time later and amidst a turbulent international situation in the late 1930s and during
the World War that followed, Cyprus seemed an absolutely “forgotten” colony. This can be
presumed by the fact that, according to the hierarchical-evaluative ranking of the British
bureaucracy that concerned the wages and the ranks of the officials of the colonial

Mazis I., Regional Science Inquiry, Vol. VI, (2), 2014, pp. 99-118 100
administration, out of a total of 38 colonies of the British Crown, in 1947, Cyprus was a class II colony, occupying a position under Hong-Kong or Jamaica (first class colonies) in the list of the Colonial Office.1
After the war, the issue of the self-determination of Cyprus re-emerged imperatively by the Greek-Cypriots, i.e., the union of the island with Mother Greece. Much has been said and written during
the last decades, in Athens as well as in Nicosia, by members of the academia, journalists and politicians that seem to suffer from a self-accusation syndrome and always blame the Greek-Cypriots (and Greeks in general). Thus, it would be useful and purposeful to remind some undeniable truths, such as:
1) First, the request for Self-determination was in principle fair and legitimate, since it had an indisputable objective basis.
2) Second, the Greek-Cypriot population requested its self-determination in a historical period, that later would appear in schoolbooks and scientific literature as the “Era of Decolonisation” or “the End of Colonialism” – in a historical conjuncture, during which for different reasons, the whole international system was being shaken from end to end due to national liberation movements; from Ireland to Indochina, from Algeria to Malaysia, and from Congo to India.
3) Third, the request for self-determination emerged in the echo of the recently ended World War and of the dynamics which that war had unleashed, but also in the echo of the Victorious Powers’ rhetoric that persistently, systematically, skilfully and repeatedly had sought to attribute the character of a “total combat between the light and the darkness”, between freedom and tyranny, to their struggle against the defeated powers.
4) A further important remark should be added to the above-mentioned points: The Colonial Power to which Greek-Cypriots addressed their (completely legitimate, fair and timely) request for self-determination was the Ally of Greece par excellence, both historically and diachronically, and particularly during the recently ended Great War. Indeed, after 1940, the “small but honest Greece” remained literally the only active ally of Britain in the entire old continent, when every other state had “turned its back” to London, either voluntarily by joining the Axis (e.g., Hungary, Romania, Bulgaria, Finland), by flirting with the Axis and violating its commitments, without eventually being able to avoid violation (e.g., Yugoslavia, Belgium), by flirting with the Axis and achieving an evasive neutrality (e.g., Turkey, Sweden), or subordinating to the Axis after a symbolic resistance of a couple of minutes (e.g., Denmark, Netherlands, etc.).
At this point we should add a couple of remarks: 4.1) First, London could not but be aware of the fact that the Greek-Cypriots would not
accept anything less than a pure and genuine self-determination by the Greek-Cypriots, i.e., the union of the island with Greece. Even a possible acceptance of a transitional solution of restricted self-governance could only be interpreted as a temporary transition stage before the final solution, i.e., absolute self-determination and union.
4.2.) Second – and crucial: the only truly strategically important issue for Britain, that was to maintain and use one or more military bases on the island had never been, not even slightly, a problem to the Greek-Cypriots or to the Greek Government. Already in 1953, Field Marshal Alexandros Papagos, then Prime Minister of Greece, had assured the then Foreign Secretary (and later Prime Minister) of Great Britain, Sir Anthony Eden, that if Britain consented to the union of Cyprus with Greece, the latter would guarantee the maintenance of the British military presence on the island.2
This point is considered crucial, since for half a century now, we have repeatedly heard and read from academic men (and women), but also from politicians, a severe criticism
1 Kirk-Greene 1999, 14.
2 Cf. Newsinger 2002, 88.

Mazis I., Regional Science Inquiry, Vol. VI, (2), 2014, pp. 99-118
101
against the Greek-Cypriots who are accused of raising the issue of self-determination,
overlooking the enormous strategic value that the island had for Britain. Concerning the
actual – and not a supposed or imaginary – strategic value of the island to Britain, at least
until the 1950s, the answer lies in what we have already mentioned. But also during the
1950s, concerning the only tangible – and not fictitious or imaginary – strategic interest of
Britain on Cyprus, no one, nor even a Briton, had ever claimed that the leaders of the National
Liberation Struggle, or any Greek Government had denied to their ally, Britain, the possibility
or the privilege of maintaining and using (in fact, largely) military facilities on the island – or
that it had the slightest objection on that.
4.3) Besides – and this is another rarely mentioned point – the highly coherent Greek
population of the island did not have anti-British feelings, nor regarded the Colonial
Administration as particularly oppressive. Obviously, Greek-Cypriots shared, due to historical
reasons, the same Anglophile feelings as their brothers in Greece (the British Ambassadors in
Athens, Sir Sydney Waterlow and Sir Michael Palairet, like so many others before them, had
recently confirmed again these feelings in reports during the late 1930s). Not even the most
enthusiastic Greek-Cypriot supporters of the Union, regardless of the class they belonged to,
had feelings of hatred against Britain.
Besides, many of them had fought on the side of Britain against Germany and Italy,
serving the Greek Army or joining the British Armed Forces. We should not forget that even
the 1st Brigade of the famous SAS (Special Air Service), a specially selected and highly
trained British Special Unit of Commandos-paratroopers, that scoured the sea and the insular
region between the Aegean Sea, Crete, Cyprus and the Middle East from 1942 to 1945 (many
of them are still associated with the British bases of Cyprus) was formed by the British
Colonel Sir David Sterling and the Greek Colonel Christodoulos Tsigantes in the midst of
World War II i.e., by a British Commando Regiment and the Greek “Sacred Band” of the
Middle East, under the command of the Colonel Christodoulos Tsigantes (the name “Sacred
Band”, was honoris causa, but it rapidly grew to the size of a regiment).3
Having in mind so recent and strong bonds of alliance (and even friendship), it was
absolutely normal and reasonable for Greeks, both in Cyprus as in the rest of Greece, to
expect a goodwill gesture from Britain, even more so, since, as we already mentioned, its
strategic interests and sensitivities would be completely guaranteed in a Greek-ruled Cyprus.
On the other hand, in an intriguing historical irony, the above-mentioned attitude of the
Greek-Cypriots towards Britain – the lack of hatred and of its possible consequences – may
be what actually made Britain not to seriously consider the Greek-Cypriots’ repeated calls for
self-determination. Britain thought that a Cypriots’ aggressive reaction, like that of the
Egyptians was improbable.4 A passing remark: those “Greeks” that for so many decades have
been using their pens to construct the infamous industry of “wrongology” and “lost chances”
do not have, not even once, criticised the spectacular incompetence that the British showed in
correctly interpreting the stance of the local population.
Yet, the erroneous evaluation of the situation from the viewpoint of the local element by
London is, to put it in modern terms, one of the most striking failures on the level of what
contemporary military participating in international interventions call “Cultural Awareness”.
The British had before them a Christian, European, civilised, with low literacy rates, hard-
working, non violent population that sociologically was what we use to call “peaceful
citizens”. Moreover, in Cyprus there had never been cases of heinous crimes or riots or
massacres against members of the Colonial Administration or against foreign nationals, or
even worse, against their families (as had repeatedly happened in Congo, Algeria, Kenya and
elsewhere). Britain, instead of appreciating these facts, misinterpreted them as evidence that
Greek-Cypriots did not seriously mean that they wanted to overthrow the colonial rule, or that
3 Cf. Iliopoulos 2013.
4 Holland 1993.

Mazis I., Regional Science Inquiry, Vol. VI, (2), 2014, pp. 99-118 102
even if they meant it, they did not have the required strength and courage to fight for their
cause.
2. Second Stage: Cyprus as a major strategic factor for Britain
After World War II, the Grand Strategy was fundamentally revised, as were also the
strategic interests and priorities of the British Empire. These revisions would turn out to be
fateful for the Cyprus Issue. Quite ironically, a British dominion, that until then seemed to be
of secondary importance, suddenly appeared to have a major strategic value. And while the
former sea-rule of Britain, willingly or not, granted independence to a never ending series of
big and small colonies, at the same time it was declaring that it would never lower the flag of
St. George, St. Andrew and St. Patrice on this colony. “Never!”, according to the infamous
statement, that remained indelibly etched in the memory of the Greek-Cypriots.5
What had happened? Britain was officially one of the winners of World War II, but was
absolutely unable to maintain its former status of Great Power, even more so of a World
Hegemonic Power. The country was facing the spectre of bankruptcy and was totally
depending on external (i.e., American) borrowing and the American financial aid. The former
sea-rule and global leader was dying. The day after the war, Britain was still alive, only due to
the American loan of USD 4.34 bn. (an incredibly oversized amount for those times).6
Sir Winston Churchill, called “the architect of victory”, that had been defeated in the first
peace elections, in 1945, handed over to his successor, Clement Attlee, first Prime Minister of
the Labour Party, a country in crisis. The British people continued to live – until the early
1950s – with harsh restrictions concerning food, coal and clothing, as well as imported goods;
restrictions already imposed since 1939. More than 2.4 million people were unemployed in
1947, while many had suffered due to a severe lack of coal supplies and very low
temperatures, during the harsh winter of 1946-1947. And while this was the situation at the
economic and social levels, the level of military expenditures remained extremely high, due to
the constant need to maintain and sustain the military bases and garrisons throughout the
British Empire. For example, the defence budget reached ₤1,091 during the 1946-1947, an
amount corresponding to 15% of the country's GDP.7
From the viewpoint of the policy makers of the Grand Strategy of the British Empire,
especially from the viewpoint of the Military, the situation that had emerged and which they
had to confront the day after the “great victory” seemed a to be a nightmare. Apart from the
obligation to maintain significant occupation forces on the lands of the recently defeated
Germany, there were pleas to London– and to the Imperial Defence Staff – from everywhere
to immediately send troops and reinforcement in order:
- either to suppress nationalist uprisings and to defend the Sovereignty of the Crown in
the British colonies (in the Middle East and in Asia – see Indies, Ceylon, Burma,
Palestine, etc. – and shortly in Sub-Saharan Africa);
- or to re-establish Sovereignty and also the public order in those British colonies that,
during the war, had come under foreign (Japanese) occupation and now that the
Japanese had withdrawn, were shaken by anti-colonial uprisings (such as Malaysia);
- or to safeguard peace and order in colonies of other allied countries until they would
be able to control their dominions by themselves (such as the Dutch East Indies,
where anti-colonial uprisings and a civil war were taking place, and Britain sent
strong forces during 1945 and 1946, until the establishment of a Dutch Government
that could have the colony under its responsibility – and could confront the latent
guerilla warfare);
5 Said by the British officer of the Colonial Secretary, Harry Hopkinson, that precluded any
possibility of changing the British Rule regime in Cyprus with his statement on 28th
July 1954. Madden
(ed.) 2000, 424. 6 “British Finish Repaying U.S. Loan to Fight WWII”, Arizona Daily Star, 29/12/2006
7 Cf. Barnett 1995, 76-77.

Mazis I., Regional Science Inquiry, Vol. VI, (2), 2014, pp. 99-118
103
- or to reinforce allied countries and governments that were facing the mortal danger of
the imposition of communist regimes (as in the case of Greece in December, 1944).
Under these circumstances, a reassessment from scratch of the colonial, overseas and
global obligations of Britain and the subsequent drastic reduction of military expenditures was
an inviolable condition for the salvation of the British National Economy and the survival of
society.
However, also from a merely geopolitical/geo-strategic standpoint, it became absolutely
necessary to radically reassess the strategic priorities of Britain. In view of the then incipient
(1946-47) Cold War (that would shortly reach its first culmination with the “first Berlin
Crisis”), the British Armed Forces had to focus on the defence against the “Soviet Threat”
and, thus, on the defence of the metropolitan territory (British islands), but also of Western
Europe against the enormous solid mass of the Red Army.
Taking into account the above-mentioned facts, the Attlee Government took the initiative
to start a discussion on all the matters concerning the strategic situation of Britain, on the
level of planning and implementing a Grand Strategy and a Defence Strategy. In the
beginning of 1946, it took the painful, though imperative, decision to grant independence to
India (the infamous “Diamond of the Crown”), while Ceylon and Burma followed in 1948.
Moreover, in the beginning of 1947, Britain, exhausted after being a long lasting global sea-
ruler and empire, asked its “transatlantic daughter” to undertake the support of the legitimate
Greek Government in its fight against the armed burst of Communism (something that led to
the proclamation of the “Truman Doctrine”).
With regard to the geopolitical sub-system or complex of the Eastern Mediterranean and
the Middle East (which is highly related to Cyprus), the Attlee Government, sent a
memorandum to the Members of the Cabinet and the Chiefs of Staff, questioning the
necessity of constantly maintaining a strong military presence in this region as a consequence
of the new post-war geo-strategic reality. The purpose of the British (robust) military presence
in the Mediterranean and in the Middle East, during the precedent era, had the aim to
safeguard the sea corridors of Metropolitan Britain and its extensive colonies in Asia (in other
words, the protection of the infamous “Indies route”. Now, however, in view of the upcoming
independence of the Indies and the rest of the Asian colonies (Ceylon, Burma, Malaysia) from
the British Crown, there was no reason for maintaining the British military presence in the
Mediterranean and in the Middle East any longer.
Furthermore, taking into account the Soviet Threat, that according to the Prime Minister of
the Labour Party, should have been the first strategic priority of Britain, the Government and
Staffs should, thereafter, focus on the development and maintenance of offensive and
defensive capabilities of the Royal Air Force, as well as on the development of the national
nuclear deterrence capabilities, rather than on the traditional imperial/colonial obligations
which according to the Prime Minister, were a minor priority.8
However, the judicious and careful Attlee’s attempt to suggest a sober and realistic
interpretation of the new geo-strategic environment, in which Britain, willingly or not, would
act in the future, encountered the fierce and obstinate reaction of the military. At this point we
should, even briefly, have a look to the biographies of these men that, at this critical and
transitional historical juncture, were in charge of the defence and security of the British
Empire. Undoubtedly, they were brilliant officers, great military leaders, and they had a
common characteristic: they were highly attached, personally and emotively, to the idea of the
British Colonial Empire:
- Field Marshal Bernard Montgomery served as Chief of the Imperial General Staff
immediately after the war, and had also served in India and Palestine in the past.
- Air Chief Marshal Arthur Tedder was the first post-war Chief of the Royal Air-Force,
and had also served as a young Officer in the Middle East during the 1920s.
8 Butler 2002, 76.

Mazis I., Regional Science Inquiry, Vol. VI, (2), 2014, pp. 99-118 104
- Air Chief Marshal John Slessor, successor of Tedder in the leadership of the Air Force
General Staff in 1950, had also served in India as a young Officer in the early 1920s and, then
again, as a Senior Officer during the second half of the 1930s.
For them, and for many other Officers, the global colonial Empire of Great Britain had
been part of their lives. It is where they matured, where they emerged as leaders, and beyond
that, where they became “social men”, where they received or broadened their social
education, where their personality was formed – and of course it is there, in the colonies of
the Crown, where they enjoyed, along with their families, all these (official and “collateral”)
privileges that the enviable “status” of British Officer entailed; privileges that were a pipe
dream for members of the Army who served in any other city of the metropolitan territory.
Fact is that in this multiply critical period of transition, right after the last great war (while
Britain had lost an empire, but had yet to find a role, according to the legendary saying), those
in charge of the Defence Strategy of the nation were clearly guided by emotion instead of
reason.9
This observation was to play a key, truly crucial role, in how British decision makers were
to understand the Cypriot request for self-determination. What is really strange, is the fact that
(I repeat it!) so many of “our” historians, international relations experts, journalists, and
politicians have spent decades in over-psychologistic approaches to the Cyprus issue, they
have harshly criticised our side, because we have supposedly always acted emotionally, and
not reasonably (in 1931, in 1955, in 1964, but also in April 2004!), but they have never, to my
knowledge at least, bothered to analyse the psychological profile of the men that were in
charge of the British Strategy or that had a crucial role in its planning – so that we (the…
ignorants!) could learn if and up to what point the stance of the Lords and the Staff Officers of
Britain corresponded to what modern textbooks of Strategic Studies teach in relation to the
Principle of Rationality and Decision-Making.
In their reply memoranda, the Chiefs of Staff intended to prevent a large-scale shrinkage
of the colonial possessions of Britain (that would be a nightmare to them), cleverly but
abusively relying on Clausewitz's “language of military necessities” and bombarding
politicians with pompous but void terminology such as the “maintenance of the imperial
influence”.
More in particular, they formulated the doctrine of the “hub of Defence Planning”, as well
as the doctrine of the “Three Pillars” of the sub-system of Middle East/Eastern Mediterranean
(which directly concerns us here). According to this reasoning, the Middle East was a hub for
the whole Defence Planning of Britain and one of the three pillars of its national defence
system. The other two were: the British Islands and the sea corridors. Subsequently, there was
the belief that if one of the three pillars collapsed, then the whole defence system of the
country would also collapse.10
At this point we could detect an early version of the “Domino”
theorem (well known because of the American involvement in Vietnam) – one of the most
significant influences of Henry Kissinger in the American Grand Strategy and one of the most
typical cases of failure to understand the scientific Theory, in this case that of Political
Realism, for reasons of political expediency, as the father of the School of Political Realism,
Hans J. Morgenthau, himself, denounced.
It is obvious that the assertions of the leaders of the British Strategy could not withstand
the test of systemic geopolitical analysis, nor corresponded to the newly formed geo-strategic
environment. Given that the USA had emerged as an impressive Naval Force of global status
and taking into account, in particular, the presence of the mighty Sixth Fleet in the
Mediterranean, but also considering, on the other hand, the then extremely feeble size of the
Soviet Fleet, what was said about the need to maintain the British military presence in the
region in order to safeguard the sea corridors sounds rather as an historical anachronism – or
as a “denial of reality” on the part of people suffering from mental disorder.
9 Cf. Barnett 1995, 46-69.
10 See, Butler 2002, 76.

Mazis I., Regional Science Inquiry, Vol. VI, (2), 2014, pp. 99-118
105
The resistance of the Staffs – especially of Marshal Montgomery, who was overtly
blaming the Labour Government for defeatism11
– had such an impact that affected even
members of the Government. Finally, the Prime Minister was not able to persuade not even
the Foreign Secretary, Ernest Bevin. Besides, the “Empire” became an “idée fixe” for the
politicians and the officers of the state-bureaucratic elite and also for the Military.
Thus, already in 1946, a Government Committee that was established in order to examine
the issue of the British Military Power, while it was describing in detail the enormous burden
for the National Economy, that was the maintenance of troops around the world, ended
proposing that is was of tantamount importance to maintain “British prestige abroad” and that
there was a need “to live up to our responsibilities as one of the three Leading Powers of the
world”.12
All this was taking place in an era, where day by day it was becoming patently clear
that Britain was no longer able to respond to the Military Crisis Management in its own and
that it was completely dependent on the American aid, that in the period 1952-53 reached the
inconceivable for that time amount of ₤244 million.13
It is well known, and has been historically proven on many occasions, that a bureaucratic
organisation, in Wember's terms, always tends to vigorously resist to any attempt of shrinking
its power. In Greece, the case of the Organisation for the Drainage of Lake Copais is
legendary. It kept and is still alive, almost a century after the completion of the drainage
works of the lake (1880-1931). On the international political level, the most typical similar
case is, of course, NATO, that survived the dissolution of its (alleged) opponent (the Warsaw
Pact), and even survived the collapse of the USSR (1991), seeking anxiously every probable
or even improbable “threat”, so as to have some kind of “raison-d’être” (Let the wise hope
that it will not intervene – more actively – in Ukraine!).
In the 1950s, the best similar example was the British Empire, whose strategists were
struggling, exhausting their admittedly feverish inventive imagination, in order to justify the
continuation of the “Empire’s” life, and thus of the British presence, at least in the Eastern
Mediterranean and in the Middle East (read: Cyprus and Egypt), especially since Britain had
withdrawn from its Asian dominions.
In fact, it is very strange that (apart from the above-mentioned personal attachment to the
idea of the Empire that characterised many British politicians and the military bureaucratic
elite) the impressive strengthening of the “obsession” with the Eastern Mediterranean/Middle
East was inversely proportional to the speed with which, for example, Indies, Burma or
Malaysia were abandoned. A quite satisfactory explanation is that the complex of Eastern
Mediterranean – Middle East was by then, the only wider region of the world that was still
under the domination of the British Crown. It may not be coherent with an analysis of the
rational behaviour of international actors, but, on a human level, the reluctance of Britain to
abandon this last colonial heritage was certainly expected.
To confirm, thus, what we have already mentioned concerning the endurance of
bureaucratic organisations to changes, London started now to try to justify (at first, before
itself and before the American allies and “sponsors”) the continuous imperial presence in the
Middle East, using George Kennan's “Containment” Doctrine against the Soviet Threat.
We have seen that Churchill's successor, Attlee, had asked for a radical redefinition of the
British Defence Strategy and, thus for the drastic reduction of the number of colonies as well
as of troops stationed in the imperial dominions – and instead asked that emphasis be given on
the development of military, and especially strategic, capabilities of the RAF, due to the
radical change of the international geo-strategic environment, whose main feature was now,
from a western point of view, the Soviet Threat.
Very well then: Adopting Attlee’s aforementioned axiomatic assumptions, the Chiefs of
Staff, assisted by the political-bureaucratic elite, were now considering the Middle
11
Cf. Hamilton 1987, 650ff , 660ff, 676ff. 12
Barnett 1995, 74. 13
Rosecrance 1968, 138ff, 156.

Mazis I., Regional Science Inquiry, Vol. VI, (2), 2014, pp. 99-118 106
East/Eastern Mediterranean to be a privileged field of application of the Western Containment
Strategy against the Soviet Threat, since the region was perfect for the installation of the
strategic (and soon of strategic nuclear) bomber aircraft of the RAF.14
Taking off in Egypt,
for example, the strategic (i.e., long-range) bombers of the British Royal Air Force (which
would soon carry nuclear weapons) would be able to seriously hit the Soviet Union in its soft
underbelly. Note that the British bases under discussion could certainly be used by the
American Air Forces to seriously attack the USSR.15
Both Marshal Lord Alanbrooke, Chief of the Imperial General Staff of Defence, and Chief
of the General Staff of the Royal Air Force, Sir Arthur Tedder, developed this argument,
which clearly aimed at gaining USA's political support in favour of the idea that the British
Empire should not shrink any further – at least not in the Middle East. In 1949, Sir Arthur
wrote a “Strategic Report” justifying the British presence in the region and arguing that the
British Armed Forces were the “only stabilising influence in areas of immense economic
consequence to the Western World”. Moreover, the Chief of the British Royal Air Force dared
to predict that a withdrawal of Britain from the region “could hardly fail to lead to the
disintegration of the Commonwealth and the eventual fall of Africa to Communism”.16
What is surprising, in this case, is that the British were reckoning without their host – i.e.,
the Arabs and especially the Egyptians. It is truly surprising to what point the leaders of
Britain had underestimated the extent and the intensity of the anti-British feelings of the Arab
countries and populations of the region, and mostly of the Egyptians (and this even though
World War II had preceded and – in view of the initial impressive success of Marshal Erwin
Rommel's “German (Expeditionary) Africa Corps” in the desert and the expected German
march to Alexandria – Arab-Muslim populations' pro-Nazi sentiments were now explicit,
while anti-British uprisings had already taken place from Egypt to Iraq).
Directly proportional was the surprise of London, when, suddenly Egypt made clear,
already during the second half of the 1940s, that it had no intention to renew the earlier
Anglo-Egyptian Treaty that was about to expire, and was permitting the installation and
operation of British bases on Egyptian lands. While a forced withdrawal of the British troops
from Egypt was about to take place, the Chiefs of Staff considered for a moment Palestine to
be an adequate place to install the Headquarters and the major basis of the Middle East British
Army.17
However, the escalation of the national-political conflict between the Arabs and the
Jews, along with the uprising of the Jews against the British Administration (which had taken
dimensions that had upset the British – just think of the deadly explosion of the Headquarters
of the British Army in King David Hotel in Jerusalem18
), forced London to make a 180
degrees turn and to hurriedly abandon Palestine.
Under these circumstances, the zone of the Suez Canal became the main military base of
the British Empire in the region, given that it was under a different regime than Egypt, and
could guarantee the continuation of the British presence in the infamous “hub of defence
planning” of the Empire – or, at least, that was what Britain thought.
However, what happened already before the Suez Crisis in 1956 forced the British to
change their attitude once again. Under constantly growing frictions in the relations between
London and Cairo, even the solution of Suez proved, over time, far from being an ideal one.
Egyptians made the lives of the British unbearable, sometimes resorting to the strategy of
civil disobedience (barrage of strikes), or to the strategy of terrorism (sabotages against the
14
Cf. Cohen 1977. 15
Cf. Ball 1991, 515-533. 16
Barnett 1995, 96.
17 Ibid., 65ff.
18 22nd July 1946, by the Israeli military organisation Irgun (Irgun Zeva'i Le'umi, abbreviated
as Etzel) <http://goo.gl/P1c1Zl>.

Mazis I., Regional Science Inquiry, Vol. VI, (2), 2014, pp. 99-118
107
British installations).19
And after the Suez Crisis, the decision-makers of the British Strategy
were forced to seek, once again, another solution.
And it was then that the gaze of the British Lords and Officers turned to Cyprus. Expelled
from everywhere, they discovered Cyprus and considered it to be the only alternative. Thus,
they decided to “hook” themselves onto this “green leaf thrown into the sea”, giving at the
same time the promise to themselves that they would not permit, under any circumstances, to
be humiliated again, as had happened in the Indies, Egypt, Palestine and Suez – “never”!
3. Third Stage: The return of the Tories and the denial to “shrink the Empire”
In the meanwhile, while these were the developments in the international environment, in
Britain an important change was taking place: the return of the Tories – and of an ageing
Churchill in 10, Downing Street – in 1951. This was his “revenge” for 1945.
Obviously, a conservative Government – especially one of Sir Winston – was even more
reluctant – than the Labour Government – to accept the territorial shrinkage of the Empire. On
the contrary, for the man who served as a First Lord of the British Admiralty (Navy
Secretary), War Secretary and Prime Minister in two World Wars, the Empire had an
enormous geo-strategic and geo-economic importance – apart from its importance as a
political symbolism and for the national imaginary.
The “joy of joys” for the Military Leaders! Their position about the need to maintain the
Empire was expressed in the “The Chiefs of Staff Global Strategy Paper” of October 1952:
“Our standard of living stems in large measure from our status as a great power and this
depends to no small extent on the visible indication of our greatness, which our forces,
particularly overseas, provide”.20
Objectively, it was just empty words with no strategic
content that, however, reveal the degree of the emotional attachment to the idea of the Empire
which we have already mentioned.
We have also mentioned that the obsession with the idea of the “Empire”, and
consequently, with the idea of maintaining the British presence in the Eastern
Mediterranean/Middle East was not limited to the military, but affected also the political elite.
In a further and very disturbing irony of the History, the man that was officially at least no. 2,
and unofficially no. 1 of the political elite (would shortly officially become no. 1) was
possessed not just by this “obsession” with the East, but was also “modestly” considering
himself as the absolute expert in the issues of the region and the best and most adequate,
among all the citizens of Britain, to plan and implement a policy for the Middle East. We are
talking about Sir Anthony Eden (the most “fateful man” for Cyprus, on the side of Britain of
course).
Anthony Eden, born in 1897, had an impressive resume. After World War I, where he
served as a reserve officer, he studied Oriental Languages (Arabic and Persian) at the
prestigious University of Oxford, with a view to join the Diplomatic Corps of the British
Empire. But, while still a student at Oxford, he got involved in politics in the side of the
Tories and opted for a political career, instead of a diplomatic one. He entered the electoral
arena and succeeded in being elected as a Conservative Member of the parliament, in 1923 –
really young, especially for that time.
From the very beginning, this promising young politician emerged – and was seeking to
emerge – as the expert par excellence of the Conservative Party in foreign policy matters. Of
course, there were much senior, more experienced and wiser – also in foreign affairs – but
who could compete the academic “credentials” of a graduate of Oxford?
In 1935, Eden became Foreign Secretary. Three years later something happened that was
to take off the reputation and prestige of the young politician and to establish him as a wise
and brave “statesman” who knows to go against the tide, even by denying chairs and offices,
19
David Lee, Air Chief Marshal, 1989, 45ff. 20
Cf. Butler 2002, 98.

Mazis I., Regional Science Inquiry, Vol. VI, (2), 2014, pp. 99-118 108
in order to defend national interests – and whose positions are, finally, rewarded by the
results: Eden strongly disagreed with the infamous “Appeasement” policy, which Prime
Minister Sir Neville Chamberlain was following against Hitler’s Revisionary Germany and
Mussolini’s Revisionary Italy that led to the Shameful Munich Agreement (October 1938) –
and resigned. Eden's absence from the Council of Ministers did not last long. When a little
later, the Appeasement policy collapsed and Sir Neville Chamberlain was replaced by Sir
Winston Churchill, Eden was asked by Churchill to take the lead of British Diplomacy.21
In 1951, Anthony Eden was undertaking, once again, the portfolio of Foreign Affairs, in a
Churchill government once again – at a time when, as we have seen, the once global and
overseas “British Empire” had shrunk, mostly in the complex of the Middle East/Eastern
Mediterranean.
One could easily understand the enormous self-confidence of a man, who did not hesitate
to “drop out” back in 1938, shortly after being chosen as a Minister in a then spectacular act,
risking a brilliant political career, only to come back vindicated some little later when Hitler
breached the Munich Agreement, splitting the remaining Czechoslovakia and preparing for an
attack against Poland. We should add here, the absolute faith of this man to his ability to
perceive, better than anyone else, Middle East issues, since he was an Oxonian scientist in the
field of Oriental Languages, with accumulated experience in the region etc. – and you can tell
if this man was willing to listen to the opinion or advice of any other political or
administrative actor on issues of the Middle East (let alone to follow it)!
First of all, Eden was not willing to accept any suggestion of the Colonial Office – and it
made this clear from the outset without quite respecting the British diplomacy elegance of that
time. To put it simply: Eden “grasped” the (then arising) Cyprus Issue from the jurisdiction of
the “Colonial Office”, prohibiting strictly any questioning of his leadership on this issue to
everyone (to his colleagues in the Cabinet or diplomats).
At this point, it would be useful to clarify some points, in order to understand the actual
power of Eden in the last Churchill Government. For some reason, in 1951, the British People
felt the need, to offer one more, last, maybe symbolic, victory to the man that with his robust
and explosive personality had indelibly marked the faith of their nation during half a century
– the man they had followed, when he promised them “blood, toil, sweat and tears”, and that
they rejected in 1945, the day after the victory. However, it was a “common secret” that the
“old man” would not live much more (not long after he deceased). Similarly, it was a
“common secret” that Eden (the only secretary with sound judgement and courage that was
following Churchill in 1938 – then, politically isolated and considered extremist and “ultra-
patriot – in the solitary path of objecting the policy of concessions vis-a-vis Germany), was
not only preparing himself for the position of Prime Minister, when Churchill would die, but,
he actually already had informally the role of the Prime Minister while Churchill was still
alive.
The Foreign Secretary and potentially Prime Minister, therefore, made it clear to everyone
that the Cyprus Issue would be, thereafter, an issue of his own exclusive jurisdiction. But
perhaps a question arises: Why are we interested (once again) in an intra-system/intra-
bureaucratic rivalry about power and influence? Unfortunately, this development concerns us
because it was to have a fateful influence on the Cyprus Issue.
4. Fourth Stage: The Eden Period
Diachronically, a permanent principle of the Colonial Office was that the administration of
every colony was an internal issue of the British Empire and, thus, no involvement of foreign
countries was allowed on this issue. An intervention of a foreign Government in the internal
affairs of the Dominions of the Crown – even in the form of “friendly” exhortations or
suggestions – was by no means accepted. It was even more inconceivable for a British
diplomat that London would recognise to a foreign Government the right or the privilege to
express an opinion on what should happen in a colony of the Crown.
21
For Eden's life and opinions cf. Eden 1962.
Mazis I., Regional Science Inquiry, Vol. VI, (2), 2014, pp. 99-118
109
However, in the case of Cyprus this is what actually happened. The Foreign Secretary,
after taking the jurisdiction of this specific portfolio from the Colonial Office, he himself
involved Turkey in the Cyprus Issue and turned an issue of self-determination concerning the
relations of a colonised country and a colonial power, into a dispute of two Governments of
sovereign states, i.e., between Greece and Turkey (of course, in order to resolve this dispute,
Britain was ready and willing to offer its services).
Besides, Eden totally agreed with the position of the Military Leaders about the paramount
importance that the Middle East/Eastern Mediterranean space had for the interests and, thus,
for the strategy of the British Empire. As the Foreign Secretary of the last Churchill
Government, Eden was asked to resolve the torturous dilemma which Britain was facing in
the post-war era:
- Which should be the hierarchy of strategic priorities within the new geo-strategic
environment?
- That is to say: Should the main goal be to fulfil the new roles and duties that derived
from the participation of the country in the Western collective defence and security system
(i.e. NATO) – or to fulfil the traditional roles and duties that derived from the nature and the
status of Britain as an Empire?
- Which should then be the principal mission of the British Strategy? The defence of
Western Europe in the context of the already latent Cold War – or the defence of the overseas
dominions of the Crown?
The answer that Eden gave was that the first priority was to defend Western Europe and,
consequently, to support the North Atlantic Alliance. However, this was immediately
followed by the responsibilities that derived from the role of Britain as an Empire, including
particularly the need to defend the Middle East.22
Eden strongly objected any idea or
suggestion to abandon the imperial obligations of Britain in the Middle East, and on the
contrary emphatically argued that there was a need to continuously maintain a strong British
presence in the Middle East.
However, taking into account that, as we have already mentioned, the British abandoned,
willingly or not, Palestine as well as Egypt, and were later (in 1954) forced to enter into an
agreement that included their retirement from the Zone of the Suez Canal, Cyprus was their
only remaining safe base of operation and base for projecting power in this wider sub-system.
Note that, similarly to the Military that were turning their gaze toward their American
counterparts, Eden was also skilfully seeking to interconnect two missions that were in
principle contradictory, i.e., the defence of the West against the USSR and the defence of the
Empire: the defence of the British position and the British interests in the Middle East were
simultaneously contributing to the defence of the West, since this region (i.e., Cyprus – the
only one they had left!) was the ideal base of operations against the soft underbelly of the
USSR.
However, Eden’s idea of the Middle East was not limited to the capabilities which the
region, in general, and particularly Cyprus, offered on a strategic and tactical level against the
Major Continental Eurasian Power. This ambitious and decisive British politician had in mind
one more parameter whose name was Nasser.
The Colonel of the Egyptian Army Abdul Nasser, who rose to power in 1952 and was
vigorously expressing a request for a full emancipation of Egypt and of the entire Arab World
from any form of tutelage by the once Colonial Western Powers, was to become Eden’s
obsession. This charismatic leader attempted to give a quasi regulatory legitimacy to his
policy, using an ideological mixture comprised of elements of pan-Arab nationalist, socialist
and anti-colonial/anti-Western rhetoric.
Although this may surprise us, Eden right away saw in Nasser a dangerous new version of
Hitler, this time not in the geo-cultural context of Central Europe but in the Middle East. Let
us not hurry to assume that it was all about trivial pretexts of Western propaganda. In this case
22
Cf. Butler 2002, 99.

Mazis I., Regional Science Inquiry, Vol. VI, (2), 2014, pp. 99-118 110
(of Anthony Eden) there are some good reasons to make us believe that the British politician, stigmatised by the trauma of Munich in 1938, actually meant what he was saying and writing about the Egyptian leader:
- Nasser was ruling, as another Hitler, with an iron fist and was severely persecuting his opponents, while in the meantime he was enjoying a rather delusional worship by the masses.
- He was declaring, as another Hitler, a peculiar national socialism (Arab/Third World type).
- He aimed, as another Hitler, not only to satisfy certain rational and limited objectives of a nation-state actor (Egypt), but also the realisation of a supranational entity (the Arab World), whose ideological superstructure was not an Egyptian ethnocentric nationalism, but a pan-Arab one (along the lines of Pan-germanism).
- He raised, in that regard, a request for a historical “revanche” and geopolitical Revisionism, since Nasser was also asking the traditional Western Colonial Powers to set aside (national socialist Germany spoke about “saturierte Mächte” – “sated Powers” in a free version) in favour of the vigorous, dynamic and uprising factor of the geopolitical foreground named “Arab Nation”.
If we add to the above analysis the willingness of Nasser to accept, under conditions, the Soviet military aid, we realise that for the British Foreign Secretary, the Egyptian dictator constituted a great danger to the interests of Britain. These views were also shared by the Eden's colleague, Harold Macmillan (one of the few Conservatives that had followed him in 1938, when he objected Chamberlain’s appeasement policy against Germany).23
Obviously, a sober and an as possible as objective analysis can trace the actual dimensions of the threat posed by Nasser for the interests of the West, beyond fictions or psychotic obsessions of some Londoners that were stubbornly refusing to see and accept the new geopolitical reality.
What concerns us here, however, is the fact that, as if everything else was not enough (British withdrawal – or expulsion – from Palestine, Egypt etc.), in view of Nasser's above-mentioned ideas and obsessions, the British leaders were, suddenly, even less willing to discuss the cession of Cyprus to Greece. All of a sudden, Cyprus became not only a precious, safe base for the confrontation with the Soviet Union, but also an ideal, truly irreplaceable base for any military operation against Nasser, any air attack against Egypt and any invasion into the Zone of the Suez Canal. Especially now, under these circumstances, there could be no discussion about ending the British rule in Cyprus. Unfortunately, Cyprus was witnessing a sharp increase of its “shares” in this peculiar international “stock market” of geo-strategic values, while every other colony was, finally, left to its destiny.
And as if this was not enough, a new parameter arose: Not only did Eden consider the Middle East of paramount importance to Britain (for the reasons we have already mentioned) – and Cyprus the centre of the whole British defence system in the Middle East, but, much worse, he considered Turkey to be the keystone of the Middle East.
Eden, complacently promoting himself as an expert in matters of the geographical complex of Eastern Mediterranean/Middle East, was far from being a model of objective observer. On the contrary, he had strong anti-Greek and pro-Turkish feelings.24 In the eyes of Eden, Turkey was for Britain what we would call today a “pivotal state”. Every policy about the Cyprus Issue, that would exclude or would offend Turkey, damaging British-Turkish relations, was strictly excluded. On the contrary, in a memorandum of February 1955, Eden refers to Greece, as an “unstable country”, while Papagos (at that time prime Minister) is described as “unworthy of trust”.25
23 Cf. Horne 1988, 393.
24 Cf. Eden 1960, 395-413. 25 Anthony Nutting (Foreign Office Parliamentary-Undersecretary), secret memorandum,
February 1955, doc. 128a, In: Madden 2002, 424ff.

Mazis I., Regional Science Inquiry, Vol. VI, (2), 2014, pp. 99-118
111
We do not know if his strong anti-Greek bias was, possibly, a side effect of the fact that as
a young student and scientist he chose an unconventional path, i.e., to follow the Oriental
Studies path– in a historical time when it was self-understood that the Western “hommes des
lettres” primarily ought to follow Classical (i.e., Greek) Studies and Classical Studies were
the core of the curriculum of every prestigious University.
It could be assumed that his obsession against the Greeks perhaps derived from the
experience he had during his personal involvement in Greek affairs, during the period before
the attack of Germany to Greece.26
However, it could be reasonable to ask ourselves: if we
here detect the beginnings of a strong bias of the then Foreign Secretary – and a little later
Prime Minister – of Britain against the Greeks, what did he feel towards Turkey? Because,
even if we accept that Eden was not satisfied with the Greeks, because Greece and the Greek
Policies and Military Leaders (Metaxas – Papagos) – i.e., a country, along with its leaders,
that was the only one in Europe to honour their commitment and stay actively and not only
formally by the side of Britain when everyone had abandoned it – insisted on asking a deeper
and more reliable commitment of Britain to the Greek front and hesitated to permit the
descent of a negligible number of British soldiers, that would only provoke Wehrmacht's
attack.
Even if this reasoning is correct, how should Eden feel for Turkey, a country that failed to
fulfil every single international commitment it had signed, refusing to complete any
obligation that resulted from the Anglo-French-Turkish Treaty of 1939? Moreover, for these
commitments, Turkey, in total contrast to Greece, had received in advance a wealthy reward,
both in pounds sterling, as well as in war materials.
How did Eden remember, in the mid-1950s, any unfortunate moments he had lived during
his contact with Greece (that did not stop being, in any case, one of the few allies of Britain,
“in practice”) – and did he not feel ashamed for the humiliation that the Turkish leadership
made him suffer, when he rushed (he, the Foreign Secretary of the Planetary British Empire!)
to Turkey in 1941, to supplicate the Turkish leaders to finally respect their commitments, only
to receive Ankara’s outright denial.
Unfortunately, at this point, we should talk about immorality and meanness. Because, how
else could we characterise a British politician, and especially one that leads British
diplomacy, when he refers to Greece, the firm ally of Britain, as an “unstable country”, and to
Papagos as being “unworthy of confidence”, when the elder Marshal –unlike Pétain in France,
Horthy in Hungary, Antonescu in Romania, Mannerheim in Finland, Franco in Spain or his
26
During that period, from late December 1940 to April 1941, a serious disagreement arose
between London and Athens, since the Greek part (at first, Prime Minister Ioannis Metaxas and after
his mysterious death, Field Marshal Alexandros Papagos) reasonably insisted that Britain should
respect what Athens, London and Paris had agreed before long, and thus that they should send to
Greece sufficient fire power with a British Expeditionary Corps that would be able to confront a
German invasion – while, on the contrary, the British side (Churchill and Eden), due to its own geo-
strategic and operational needs and expediencies, was willing to send to Greece less expeditionary
forces that would not be able to confront a possible German attack, however would be capable of
provoking it. This friction culminated with a sharp disagreement that led to the well-known “incident”
between Eden and Papagos during the Greek-British working meeting in the Greek General Staff
(Hotel “Grande Bretagne”) and rupture was avoided due to the direct intervention of King George II.
Fact is – especially if we consider Britain's strong denial, and especially the persistent denial of the
Chiefs of Staff, until 28 October 1940, to send even the slightest reinforcement to the Greek Army –
that there is, and will always be, an inkling that Britain's decision, as shown around late 1940 / early
1941, to suddenly send a quite limited military force to Greece, was not actually aiming to avert a
German attack, but, on the contrary, to provoke it (with the ultimate goal being not to let close – since
it had opened thanks to Mussolini – the open wound of the Balkans, but to “anchor” Germany in a
“lateral” front, not included in its original planning).

Mazis I., Regional Science Inquiry, Vol. VI, (2), 2014, pp. 99-118 112
Turkish counterparts – fought on the side of Britain and had also been imprisoned in a
concentration camp in Germany?27
This meanness was obvious also during the infamous incident that followed the dialogue
between Papagos and Eden in September 1953, when the Marshal (and at the same time
Prime Minister) raised the question of the union of Cyprus with Greece. Eden's legendary
answer was, in all respects, unethical: “New York has a large Greek population, so why not
claim that?”28
It was obviously an absolutely improper and disgraceful attitude, not only in
terms of diplomatic courtesy, but even of common politeness. After all, that arrogant Briton
had before him a much older man, that had passed some years as a war prisoner in the Dachau
camp.
Macmillan, who succeeded Eden in the Foreign Office when the latter moved to Downing
Street in the beginning of 1955, followed Eden’s policy on the Cyprus Issue, namely: the
Foreign Office was handling the issue, while side-lining the Colonial Office, and practically,
absolutely declined the request for self-determination/union, and activated at the same time
two factors:
- a) Turkey, that should be supported, and
- b) a “legitimate” Greek-Cypriot party, that “would emerge in order to support the
continuity of the British rule on the island. Macmillan's phrase was quite eloquent and
indicative of London's stance and plans: “It should be possible to organise a pro-
British party among the Greeks. After all, Xerxes had no difficulty…”29
A clear reference to the historical precedent of the King of the Persians' bribe to political
actors of the ancient Greek city-states, with the infamous “darics” (Persian coins that bore the
image of Darius) and also the Peace of Antalcidas, a peace treaty that the Greeks (Spartans)
signed with the Medes, abandoning Cyprus, as well as Greeks of the Eastern Mediterranean
and Ionia, at the mercy of the barbarians (about 2,400 years later, in 1959/60, there would be
some Greek actors, both in Athens and Nicosia, that would sign the Antaclidas’s Zurich-
London Agreements, like there would be Greeks on the island, and among them some
“progressive” ones, that would become fanatic enemies of a national self-determination and
supporters of the foreign occupation).
In the meanwhile, during the night of 31st March to 1
st April 1995, appeared the armed
National Liberation Struggle of the Greek-Cypriot People, under the enlightened and robust
leadership of the Cyprus-born, General of the Greek Army, Georgios Grivas, a veteran of the
past wars of the nation, an excellent military leader and a sincere patriot. The aim of this
introduction is not, of course, to refer to the armed national liberation struggle of EOKA
(National Organisation of Cypriot Fighters) (nor to the political developments of the Cyprus
Issue), but to highlight, once again, the interconnection of the Cyprus Issue with the
developments in the Middle East, and especially in Suez. For that reason, and for the sake of
historical justice, we will only mention that:
- a) from a military viewpoint, in terms of preparation, organisation, planning and
operation, Georgios Grivas (the legendary “Digenis”) had proven to be a truly great
military leader and an expert of the Strategy and Tactics of Guerilla Warfare
(ultimately recognised, by his own rival, Marshal Harding, as the best enemy whom
he had ever fought),
- b) in terms of policy, Grivas proved to be an expert of what is considered to be the
milestone of the success of every guerilla and anti-guerilla war, in the eyes of
Clausewitz, Mao and modern experts: i.e., the need to have the support of the
population (in other words to win “the hearts and minds” of the civilian population, as
mentioned in the NATO manuals); and
27
In Dachau among others. He stayed in concentration camps from 1943 to 1945. 28
Newsinger 2002, 88. 29
Horne 1988, 364.

Mazis I., Regional Science Inquiry, Vol. VI, (2), 2014, pp. 99-118
113
- c) in all respects, the struggle of EOKA was magnificent and unique and should form
part of the long history of the National Resistance of Hellenism against any foreign
conqueror.
As deduced from a memorandum of the Foreign Office in the beginning of 1955, Eden's
administration believed that:
- a) the dominance of Britain on Cyprus should be continued and, thus, the request for
self-determination/union should be rejected without question and should be dealt
with, on one hand, using repressive methods (hence the emphasis on the
reinforcement of the Police), and on the other hand, by affiliating with “moderate”
Greek-Cypriots in favour of the continuous British Colonial Rule, offering them a
status of restricted self-government as an alibi30
,
- b) they should support and cooperate with the Turkish factor,31
obviously as a
counterweight to the Greek requests, and
- c) the Greek Government would be, ultimately, convinced to withdraw its support to
the request for self-determination/union of the Greeks of the island and to accept
instead the “fig leaf” of a nominal (in fact, very limited) self-government, that
London would offer, both to “save face” and to help the Government of Athens to
“save face” by presenting to the Greek public opinion, which was strongly in favour
of the Greek-Cypriots, that there was a settlement of the issue, no matter how virtual.
As we have already explained, Eden’s inexorable stance on the issue of self-determination
was connected, among others, to the “Nasser” factor and the problems that London was facing
with regard to Egypt and the Suez Canal, already before the international Crisis of 1956. It is
obvious that the consequent escalation of the simmering conflict of interests between London
and Cairo, until the Suez Crisis, and a little later, the Suez War of 1956, made the British even
more intransigent on the Cyprus Issue – stance that related, of course, to the worsening of the
condition in the internal front (armed activity of EOKA).
However, in an oddity of History (once again), the developments in the Middle East, in
general, and in Suez, in particular – that, by the early 1950s, had for a long time a crucial and
almost fateful role in shaping the (absolutely negative) stance of London towards any idea of
ending the British rule, would now, suddenly, become the trigger for the processes that would
lead – even partially – to the independence of Cyprus from the British rule.
More specifically, the crucial fact that made the leaders of the British Strategy to change
attitude was the sudden pitiful failure of the common British-French military intervention
against Nasser at Suez in October-November 1956. The unexpected, spectacular, and thus
humiliating and painful fiasco of Britain and France, was for Britain a so-called “Scottish
shower” and made the political and bureaucratic elite of London, as well as the British public
opinion realise, albeit with a delay of eleven years since the end of the last great war, that the
“days of the Empire” were long gone. It is what we know from Thucydides as “change to the
opposite”32
». There could be no stronger symbolism for this fact than Prime Minister's Eden
resignation, in the beginning of the next year (1957). The inglorious end of the political life of
the once mighty, arrogant and selfish “orientalist” of Oxford coincided with the end of the
British fantasies and obsessions about the “imperial” presence in Eastern
Mediterranean/Middle East.
And, as before, the fact that Britain's Chiefs of Staff, declared this geographical complex
to be one of the three security pillars of Great Britain, but also the cornerstone of the whole
system of the Imperial Defence, had made any substantial discussion on the request for self-
determination of Cyprus prohibitive for the political elite in London. Thus, it was now
imperative to develop a new defence doctrine that would actually take into account and reflect
30
F.O. Memo, 8 Feb 1955, F.O. 371/117625, cf. Madden 2000, 427-429. 31
Ibid. 32
“...by those who will wish to discern the truth about the events of the past and about the
events of the future history ... the plans of the actors and the change to the opposite”, Thucydides, On
Platea.

Mazis I., Regional Science Inquiry, Vol. VI, (2), 2014, pp. 99-118 114
the rapid and total collapse of the British domination on the sub-system of Eastern
Mediterranean/Middle East (where it ruled for one and a half century, since the defeat of
France in Abukir, in 1798).
Actually, a new Defence Policy was introduced in 1957 by Macmillan, who succeeded
Eden in 10, Downing Street. Macmillan, possibly feeling and being freed by the shadow of
his once “eternal” supervisor, developed and implemented a defence plan, whose main
characteristics were:
- a) drastic cuts in defence expenditures; and
- b) emphasis on the defence of Britain and Western Europe, instead of the previous
focus on issues of the Empire and, consequently, of the Middle East.33
However, once the British domination in the Middle East had ended, Cyprus was no longer
considered irreplaceable, at least for the General Staffs. Thus, for the first time, and de facto,
the way was open for an effective political solution to the Cyprus Issue, even for the
satisfaction of the request for self-determination.
Moreover, it is interesting to note the fact that the causal – and not just temporal – relation
between the Suez Crisis and the Cyprus Issue was fully understood by the Greek public
opinion, not only in Cyprus, but also in the (rest of) Greece. Already during the massive
nationwide protests that made Athens and the rest of the major urban centres of Greece
vibrate as soon as the Greeks heard the horrible news that the heroes-national martyrs
Karaolis and Dimitriou were sent to the gallows, there were slogans in favour of Nasser and
in favour of an Athens-Belgrade-Cairo axis.
During the Suez War, the newspaper “Vima” published an article written by the retired
Lieutenant Sergios Gyalistras, former Deputy Minister of Aviation during Papagos’s
Government. In this article, the former military was relating the Issues of Suez and Cyprus,
presenting a quite interesting estimation, that would later be confirmed by the developments
on many occasions: The fact that both Superpowers (USA and USSR) held the hydrogen
bomb was inevitably leading to an “automatic rapprochement”, even if only “unintentional”,
between them. And that would happen because the “fear of mutual retaliation” diminished the
possibilities of a war between them. But, that was exactly what made local wars more
probable.34
The most advanced, daring and ground-breaking positions, in relation to the
interconnection of the Issues of Cyprus and Suez, as well as to the (consequent) need for a
redefinition of the Greek Foreign Policy, in a way that would reflect the new international
situation were expressed by the newspapers “Estia”, “Eleftheria” and “Avgi”.
These positions were accompanied by harsh critics against the so-called “October’s”
Governments on the national issue. “October’s” was called the first government of
Kostantinos Karamanlis, who was suddenly appointed Prime Minister in October 1955, after
the death of Marshal Papagos, and while everyone in Athens had for granted that two
historical members and Vice-presidents of the conservative party (Panagiotis Kanellopoulos
and Stefanos Stefanopoulos) would take the lead.
It was a common place that Karamanlis was appointed Prime Minister following a
decision imposed by foreign factors. Furthermore, there is a legendary text, “Pipinelis’s
Memorandum”, i.e., a concise text of what today we would call bullet-points, of the period
prior to Karamanlis’s government that was written on behalf of Karamanlis by the veteran
Ambassador, Minister of Foreign Affairs and once shadow advisor of King George II,
Panagiotis Pipinelis.35
The Memorandum was encoding the commitments that the then MP of
the “Greek Rally” (Ellinikos Synagermos), K. Karamanlis, was to make to the foreign agent.
It included a series of controversial questions, primarily on the Cyprus Issue. In this text,
33
See Jackson 1986, 170 34
Gyalistras, Sergios, “Greece-Cyprus-Suez” [Ελλάς-Κύπρος-Σουέζ], In: “To Vima” [Το Βήμα],
12/10/1956. 35
“How Karamanlis came to power” [Πώς ανήλθε ο Καραμανλής εις την εξουσίαν], Neologos
Patron [Νεολόγος Πατρών], 21/12/1958.

Mazis I., Regional Science Inquiry, Vol. VI, (2), 2014, pp. 99-118
115
Karamanlis appears to reassure that, if he assumed the responsibility of governing Greece,
“on the Cyprus Issue, there would be efforts to eliminate the public opinion’s reactions
through a compromising solution on this issue”.36
Remarks on Pipinelis’s Memorandum:
- first, it was published by the Director of Pipilelis's Office, P. Sotiropoulos, in
person
- second, it was published in the prestigious daily newspaper of Patras “Neologos”
in 1958,
- third, at that time, Pipinelis did not renounce it, but on the contrary, confirmed
the authenticity of the “Memorandum” and,
- fourth and most important, everything written in the legendary Pipinelis’s
Memorandum was fulfilled, word for word. Or as Panos Kokkas’s “Eleftheria”, put it
in September 1956, answering to the Prime Minister (Karamanlis), who had stated
that the government was fulfilling its duty in regard to the Cyprus Issue: “However,
he did not mention towards whom: the nation or, improbably, the ones who had
placed him as Prime Minister. Because, in fact, the whole policy of “October’s”
leaders on the Cyprus Issue and on its complications, that this appointed government
has followed, proved to be a policy of accomplishing an undertaken duty”.37
Of course, the fact that during the same period, the same newspaper published an article
written by the President of Egypt, Colonel Nasser, that was in favour of Cairo in regard to its
conflict with London, is also quite interesting. At the same time “Eleftheria” was promoting
the idea that there was a common ground of strategic interests between Greece and Egypt
against Great Britain, given that “Britain's imperialism” was threatened by the national
liberation struggle of the Greek-Cypriots and by the Arab emancipation, expressed mainly by
Egypt.38
Even more interesting are the relevant articles of “Avgi”, especially if we juxtapose the
highly and purely patriotic spirit of the Left of that time with the post-national and
“multicultural” ideological constructions of part of today’s Left in Greece and in Cyprus. The
editor of “Avgi”, Vasileios Efraimidis, was writing in September 1956: “The government has
been and still remains silent. This is coherent with its origins and with the role it assumed. It
remains silent because everything in Cyprus, in Greece and in the Middle East takes place
according to the prescribed plan of its “ALLIES”. If executioner Harding proceeds to the
uprooting of Hellenism and Orthodoxy in Cyprus. If French troops disembarked on the island
of Cyprus, the government does not have the will or the strength to protest because both serve
the imperialist terrorist attack and demonstration of the front of the colonists in the region of
the Middle East (…) in the Eastern Mediterranean colonisation clashes with anti-
colonisation. Freedom clashes with slavery. A new situation is emerging in sea- regions that
in antiquity were the cradle of the Greek-Egyptian civilisation. With Nasser, with the colonial
peoples and with Cyprus (and) Greece or with British-Americans, French-Turks, i.e., with
imperialism and its jackals, this is the dilemma. This is the historical dilemma”.39
In the meanwhile, in mid-October in Athens circulated a leaflet written by Grivas, asking
the replacement of Karamanlis’s government by a “National Front” Government, supported
by a solid internal front, but also the re-examination of Greece's foreign policy, implying the
withdrawal from the North-Atlantic Alliance: “For the political world of Greece an issue
arises for our future stance towards various International Organisations, since there is no
respect for the principles of Justice and Ethics, but only an arena of unethical bargaining,
where interests and deals rule”.40
36
Ibid. 37
“The duty” [Το καθήκον], Eleftheria [Ελευθερία], 5/9/1956. 38
Nasser, G. A., “My policy” [Η πολιτική μου], and (editorial) “The great danger” [Ο μέγας
κίνδυνος], Eleftheria [Ελευθερία], 2/9/1956. 39
V.Ε. (Efraimidis, Vasileios), “Tongue Twister” [Γλωσσοδέτης], Avgi [Αυγή], 2/9/1956. 40
To Vima [Το Βήμα], 19/10/1956.

Mazis I., Regional Science Inquiry, Vol. VI, (2), 2014, pp. 99-118 116
The leader of the Liberal Party, Georgios Papandreou, soon declared that “Digenis was
fully expressing the nation’s feelings”. Skilfully, avoiding to position himself in favour of
abandoning NATO, Papandreou was actually asking “the Regulator of the Polity” to
intervene. The leader of the “Democratic Party of the Working People”, Georgios Kartalis,
stated that Grivas was making the ultimate effort to stop Karamanlis from closing the Cyprus
Issue. The President of the United Democratic Left (EDA), Ioannis Pasalidis, was openly in
favour of Digenis’s proposal.
The reaction of the Press, was in many ways revealing what was happening (and not only
at that time) with the foreign “Protection” in Greece. As one would expect, “Vima” and
“Kathimerini” – had a highly negative attitude towards Grivas’s positions, while the more
“popular” daily newspaper of the Lambrakis Group, i.e., “Nea”, chose to follow the method
of “death by silence”.41
On the contrary, Panos Kokka’s “Eleftheria” vehemently turned against the “puppets of
October 6th” (read as: Karamanlis, Averof-Tositsas and Co.), openly and directly threatening
that if they would try “to ignore the logic of things” and “to fulfil their mission by
surrendering, they would some day be found strangled with pliers of logic, that will throw
their moral corpses in the sewer of History”.42
Of course, the most militant stance in favour of the National Struggle was that of “Estia”,
published by the Kyros family. Note that there is no relation between that – historical –
“Estia”, directed by three generations of the Kyros family and the present namesake
newspaper, both in terms of their political orientation and their stance towards national issues.
So, “Estia” was asking the resignation of the Government, or, otherwise, the intervention
of the King. In view of the rumours of the highly conciliatory stance of Karamanlis and
Averof and their willingness to accept whatever the British would “serve” them as a
supposedly “self-governance”, “Estia” was directly making threats of a “new Goudi”.43
On 31 October 1956, the day after the Israeli attack against Egypt, and in view of the
British-French attack that was taken for granted, Kyros Kyrou denounced through the
columns of “Estia” the “predatory raid” of Britain and France, “whose world record make
Mussolini’s dishonesty seem innocent”. he also denounced “October’s Government” (of
Karamanlis) because it “stupidly” declared three days ago that “we are inseparably
connected to our Western Allies”, emphasising that the bonds with the “brigands of
imperialism” were continuously becoming more dangerous.44
This newspaper, considered as pre-eminent conservative, was asking a withdrawal from
NATO. Immediately, an adequate answer came from “Kathimerini” and “Vima” (“leave to go
where? Maybe to the Warsaw Pact…”).45
Finally, to prove once again the connection the public opinion was seeing between the
Cyprus Issue and Suez, it is worth mentioning an article, published in “Vradini”, on 25th
October 1956, by the once Grivas’s comrade, Konstantinos Efstathopoulos: “we admire and
appreciate the brave policy of our friends, the Egyptians, but at the same time we feel
ashamed because in our valiant country no one worthy of Nasser was ever found”.46
*** ***
41
Cf. To Vima [Το Βήμα] and Kathimerini [Καθημερινή], 18/10/1956, Ta Nea [Τα Νέα],
19/10/1956. 42
“Simple Words” [Απλά λόγια], Eleftheria [Ελευθερία], 21/10/1956.
43 Estia [Εστία], 18, 19 and 22/10/1956.
44 “The robbers of the West” [Οι λησταί της Δύσεως], Estia [Εστία], 31/10/1956.
45 “In view of the ultimate dangers, the people should concentrate its aims” [Εν όψει των
υπερτάτων κινδύνων ο λαός να πυκνώση τους στόχους του], To Vima [Το Βήμα], 1/11/1956. Cf.
Kathimerini [Καθημερινή], 1/11/1956. 46
Efstathopoulos, K. “Grivas's Message” [Το μήνυμα του Γρίβα], Vradyni [Βραδυνή],
25/10/1956.

Mazis I., Regional Science Inquiry, Vol. VI, (2), 2014, pp. 99-118
117
What followed is well known – and is outside the scope of the present paper. Let us only
add a couple of observations:
First, for the sake of historical justice, we must recognise that the rapid, radical and
dramatic change of the British attitude – from the obstinate denial of every substantial
discussion on the Cyprus Issue (beyond pretentious virtual “offers” of a fictitious, highly
limited self-governance) to the readiness and willingness to end the British rule and to
recognise even the independence of the island – is not only due to the developments of the
Suez Crisis in 1956 (that had started under quite different conditions and had ended quite
differently), but also due to the absolute success of the Strategy of Georgios Grivas-Digenis
and the National Organisation of Cypriot Fighters (EOKA).
An expert of the so called “Strategy of (the enemy’s) Attrition”, Grivas had rightly pointed
out (and recorded, as early as in 1953, in the General Plan of Revolutionary Action, which he
had prepared) that he did not expect, nor one should assume, that through the means used by
EOKA, it would achieve an absolute military predominance on the British forces. “Our aim”,
was explaining this great strategist and warlord, “is to win a moral military victory through a
war of attrition, which will consist in the harassment, confusion and, finally, the exhaustion of
the enemy’s forces. In other words, the aim was not a military victory against the British over
the territory (hence there was no discussion about compiling large-scale rebel military
formations – something that actually would have proven to be self-destructive).
On the contrary, as Grivas put it, the aim was – using only a small number of armed
militants, supported by the passive resistance and civil disobedience of the entire population –
to continuously provoke such damage and confusion to the British forces, that, on the one
hand, it would become clear internationally that the British are not any more the absolute
lords of the situation on the island, and on the other hand, to expose London to the continuous
pressure of the international public opinion – and to keep disturbing the British, as Grivas
said, until they would be forced by the international Diplomacy, conducted through the UN,
to accept to discuss the Cyprus Issue and to solve it according to the will of the Cypriot
people and the entire Greek nation.
The second observation that must be made, in conclusion, is that, taking into account the
outcome of the Suez Crisis and War and the “shock” that it meant to London, but also
considering the absolute success of the Guerilla Strategy adopted by the Greek-Cypriots, the
Greek political leaders, that were called upon to resolve the issue of self-determination/union
(and rushed to bury it, accepting, instead, a status of fictitious, partial and compromised
independence and mortgaging the future of the Greek-Cypriot people eternally), objectively
proved to be completely incapable or unwilling to take advantage of the world-historical
change of the international and regional geo-strategic environment as well as the mighty
“card” of the undeniable ethical and, thus, strategic victory of EOKA. This card was trusted to
them by the fighting Greek-Cypriot People and the whole nation, as a precious heritage, when
Greek-Cypriots wished them “farewell” on their way to Zurich and London, with the hope
they would return to a “Greek Cyprus”.
Thus in an (truly tragic!) irony of History, it seemed that Sir Anthony Eden’s opinion was
right (although he had completely failed and was humiliated on everything else), when he had
foretold that sooner or later the Greek political leaders would be convinced to abandon the
request for union, accepting instead what the British would offer them.
Unless, of course, Macmillan’s opinion about Xerxes’s ways to manage to find, among the
Greeks, some willing to align themselves with his wills proved to be true…

Mazis I., Regional Science Inquiry, Vol. VI, (2), 2014, pp. 99-118 118
References
Ball, Simon, “Bomber Bases and British Strategy in the Middle East, 1945-1949”, Journal of
Strategic Studies 14, 1991.
Barnett, Corelli, The Lost Victory: British Dreams, British Realities 1945-1950, London,
Macmillan, 1995.
Butler, L. J., Britain and Empire: Adjusting to a Post-Imperial World, London, I. B. Tauris, 2002.
Cohen, Michael, Fighting World War Three from the Middle East: Allied Contingency Plans
1945-1954, London, Frank Cass, 1977.
David Lee, Wings in the Sun: A History of the RAF in the Mediterranean 1945-1986, London, 1989.
Eden, Anthony, Full Circle, London, Cassells, 1960.
Eden, Anthony, The Eden Memoirs: Facing Two Dictators, London, Cassells, 1962.
Hamilton, Nigel, Monty Volume 3: The Field Marshall 1944-1976, London, Hodder and Stoughton,
1987.
Holland, Robert, “Never, Never Land: British Colonial Policy and the Roots of Violence in
Cyprus, 1950-1954”, The Journal of Imperial and Commonwealth History XXI
(September 1993, no 3) 148-176.
Horne, Alistair, Harold Macmillan, Vol. 1, 1894-1956. London, Macmillan, 1988.
Iliopoulos, Ilias, The operations of the 'Sacred Band' during the Second World War [Οι
Επιχειρήσεις του Ιερού Λόχου κατά τον Β΄ Παγκόσμιο Πόλεμο], Athens, Irodotos, 2013
Jackson, William, Withdrawal from Empire: A Military View, St. Martin’s Press, 1986.
Kirk-Greene, Anthony, On Crown Service: A History of HM Colonial and Overseas Civil
Services 1837-1997, London, I.B. Tauris Publishers, 1999.
Madden, Frederick (ed.), The End of Empire: Dependencies Since 1948 Part I, Westport,
Greenwood Press, 2000.
Newsinger, John, British Counterinsurgency From Palestine to Northern Ireland, London,
Palgrave, 2002.
Rosecrance, R. N., Defence of the Realm: British Strategy in the Nuclear Epoch, Oxford,
Oxford University Press, 1968.
Newspaper Articles
“British Finish Repaying U.S. Loan to Fight WWII”, Arizona Daily Star, 29/12/2006
“How Karamanlis came to power” [Πώς ανήλθε ο Καραμανλής εις την εξουσίαν], Neologos
Patron [Νεολόγος Πατρών], 21/12/1958.
“Simple Words” [Απλά λόγια], Eleftheria [Ελευθερία], 21/10/1956.
“The duty” [Το καθήκον], Eleftheria [Ελευθερία], 5/9/1956.
“The robbers of the West” [Οι λησταί της Δύσεως], Estia [Εστία], 31/10/1956.
Efstathopoulos, K. “Grivas's Message” [Το μήνυμα του Γρίβα], Vradyni [Βραδυνή], 25/10/1956.
Gyalistras, Sergios, “Greece-Cyprus-Suez” [Ελλάς-Κύπρος-Σουέζ], In: “To Vima” [Το Βήμα],
12/10/1956.
Nasser, G. A., “My policy” [Η πολιτική μου], and (editorial) “The great danger” [Ο μέγας
κίνδυνος], Eleftheria [Ελευθερία], 2/9/1956.
To Vima [Το Βήμα], 19/10/1956.
V.Ε. (Efraimidis, Vasileios), “Tongue Twister” [Γλωσσοδέτης], Avgi [Αυγή], 2/9/1956.

Regional Science Inquiry, Vol. VI, (2), 2014
119
Announcements, Conferences, News

Regional Science Inquiry, Vol. VI, (2), 2014 120

Regional Science Inquiry, Vol. VI, (2), 2014
121
INTERNATIONAL CONFERENCE ON “Innovative Trends in Multidisciplinary Academic Research – ITMAR-2014”
Conference Overview1
The International Conference on “Innovative Trends in Multidisciplinary Academic
Research” was hosted by the Global illuminators in Istanbul, Turkey. The Conference has
been held from 20th October to the 21st October at Gonen Hotel. The conference had abroad
focus, covering many areas such as human rights, social, economic and engineering
development and science.
The Organizing Committee – Chairmen of the Conference were Farooq Ahmed Jam, Tariq
Iqbal Khan (Conference Co-Chair), Felicia Chong (Head of Organizing Committee), Khalid
Usmani (Ph.D) (Conference Secretary), Najm Us Sahar (Manager Research & Coordination,
Global Illuminators).
The papers are divided into seven subject areas:
Business , Management and Economics Studies
Health and Medicine Studies
Engineering and Technology Studies
Social Science and Humanities
Physical Life and Applied Sciences
Regional and Religious Studies
Multidisciplinary and Interdisciplinary Studies
This conference was a productive discussion between scientists, academicians,
practitioners, and scholars regarding issues of social-economic matters. They provided
innovative solutions to the emerging problems and challenges of our society. The conference
was an opportunity to deliver innovative ideas and the challenges by developing countries in
the conversion from the traditional economy to a knowledge economy.
1 Conference overview by Antonia Obaidou, Aristotle University of Thessaloniki, Greece

Regional Science Inquiry, Vol. VI, (2), 2014 122
14th SAET Conference on Current Trends in Economics Conference
Conference Overview1
The 14th SAET Conference on Current Trends in Economics Conference was organized in
cooperation with Waseda University in Tokyo, Japan on 19th August to the 21st August.
Conference Venue was Waseda University, Waseda Campus, 10th Building. Workshop A
Organized by Masao Ogaki & Toyotaka Sakai and cosponsored by Japanese Economic
Review (JER), Keio Economic Society, and Wiley. Workshop B Organized by Yukihiko
Funaki & Hans Peters, workshop C Organized by Chih Chang & Jeff Kline and workshop D
Organized by Simona Settepanella, Hiroaki Terao, Masahiko Yoshinaga and Makoto Nishibe
which took place at Hokkaido University.
The conference chair was Mamoru Kaneko. The Organizing Committee of the Conference
was Akiyama Eizo and Ishikawa Ryuichiro from the University of Tsukuba, Araki Kazunori,
Funaki Yukihiko, Kaneko Mamoru, Shimizu Kazumi, Suga Koichi and Tanaka Hisanori from
Waseda University and Yannelis Nicholas C.
The Conference was separated into following special sessions: Advances in International
Trade; Allocation and Mis-allocation; Behavioral Economics; Behavioral Game Theory;
Contemporary Topics in Econometrics; Cooperative Game Theory; Decision Theory;
Equilibrium Indeterminacy and Macroeconomic Stability; Evolutionary Foundations of
Preferences; Experiments in Games; Experiments on Learning; Fairness in Economics;
Foundational Issues in Game Theory; Foundational Issues in Game Theory and Economics;
Foundations of Game Theory and Mechanism Design; Incomplete Information in Games and
Mechanisms; Industrial Organization; Industrial Organization and Contracts; International
Trade; Logical Perspectives on Social Interaction and Epistemic Justification;
Macroeconomic Policies; Matching and Market Design; Mathematical Economics; Monetary
Economics and Mechanism Design; New Directions in Applied Game Theory; Persuasion
and Communication; Political Economy; Revealed Preference; Simulation on Social
Behavior; Social Choice and Cooperative Game Theory; Social Networks; Solutions of
Cooperative Games; Stochastic Choice; Stochastic Games and Their Applications; Time
Consistency; Topic on Economic Theory and Its Application; Topics in Decision Theory;
Topics in Economic Theory; Topics in Matching Theory; Topics in Taxation; Trade and
Hetergenous Productivity.
Many scientists and researchers from all around the world participated in the SAET
Conference who discussed about the issues facing the global economy and the new situations.
1 Conference overview by Olga Gioti-Papadaki, Panteion University - Antonia Obaidou, Aristotle
University of Thessaloniki

Regional Science Inquiry, Vol. VI, (2), 2014
123
Academic Profiles

Regional Science Inquiry, Vol. VI, (2), 2014 124
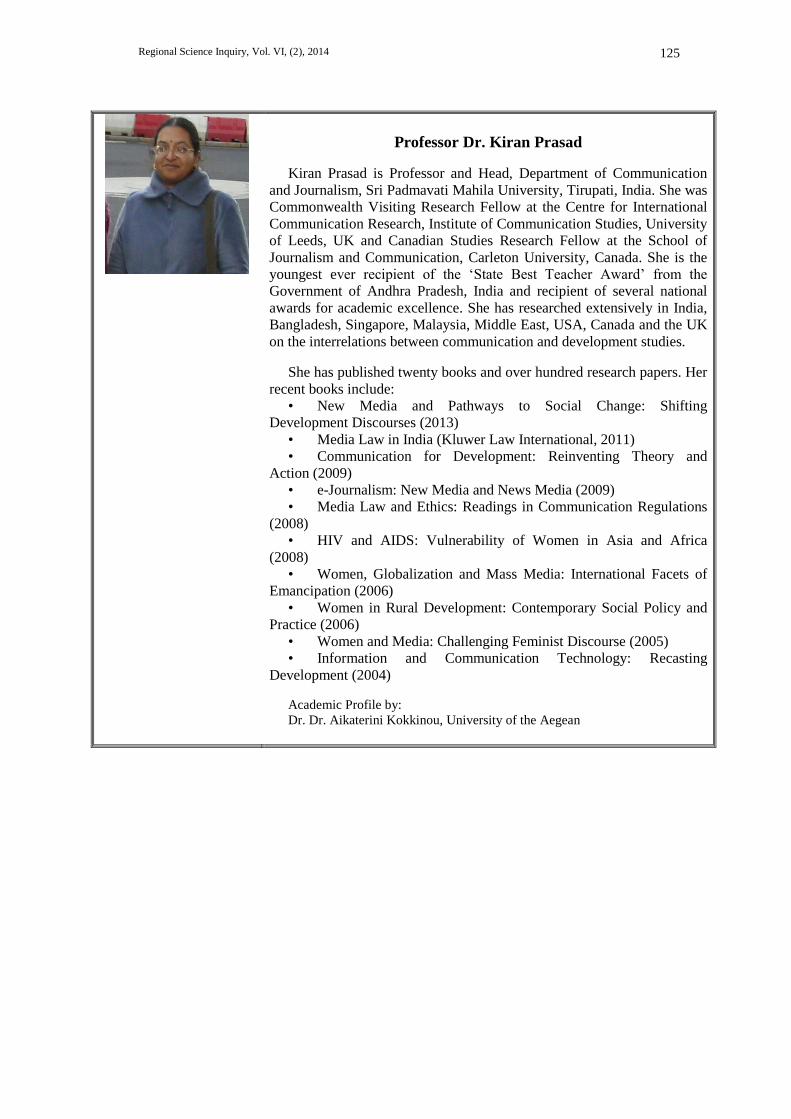
Regional Science Inquiry, Vol. VI, (2), 2014
125
Professor Dr. Kiran Prasad
Kiran Prasad is Professor and Head, Department of Communication
and Journalism, Sri Padmavati Mahila University, Tirupati, India. She was
Commonwealth Visiting Research Fellow at the Centre for International
Communication Research, Institute of Communication Studies, University
of Leeds, UK and Canadian Studies Research Fellow at the School of
Journalism and Communication, Carleton University, Canada. She is the
youngest ever recipient of the ‘State Best Teacher Award’ from the
Government of Andhra Pradesh, India and recipient of several national
awards for academic excellence. She has researched extensively in India,
Bangladesh, Singapore, Malaysia, Middle East, USA, Canada and the UK
on the interrelations between communication and development studies.
She has published twenty books and over hundred research papers. Her
recent books include:
• New Media and Pathways to Social Change: Shifting
Development Discourses (2013)
• Media Law in India (Kluwer Law International, 2011)
• Communication for Development: Reinventing Theory and
Action (2009)
• e-Journalism: New Media and News Media (2009)
• Media Law and Ethics: Readings in Communication Regulations
(2008)
• HIV and AIDS: Vulnerability of Women in Asia and Africa
(2008)
• Women, Globalization and Mass Media: International Facets of
Emancipation (2006)
• Women in Rural Development: Contemporary Social Policy and
Practice (2006)
• Women and Media: Challenging Feminist Discourse (2005)
• Information and Communication Technology: Recasting
Development (2004)
Academic Profile by:
Dr. Dr. Aikaterini Kokkinou, University of the Aegean
Regional Science Inquiry, Vol. VI, (2), 2014 126
Associate Professor Dr. Maria P. Michailidis
Dr. Maria P. Michailidis is the Dean of the School of Business at the
University of Nicosia, Cyprus, she is a Community-Social Psychologist
and a Vocational Counselor.
She is the author of several book chapters, journal articles and editor of
several books.
Dr. Michailidis has a long industrial experience as she worked in the
United States and Cyprus, as well as teaching experience from teaching in
tertiary education both in the United States and Cyprus. She is a
researcher and a regular speaker and presenter at International
conferences.
Her research interests include occupational health, illness and wellness,
gender and intercultural studies, unemployment issues, working women
and stress, occupational stress, women entrepreneurs.
Most of her research work has been supported by grants; she has also
been a research partner in European Union projects such as Leonardo da
Vinci; Socrates/Erasmus Thematic Networks and Grundtvig Multilateral
Projects.
Academic Profile by:
Dr. Dr. Aikaterini Kokkinou, University of the Aegean

Regional Science Inquiry, Vol. VI, (2), 2014
127
Book Reviews

Regional Science Inquiry, Vol. VI, (2), 2014 128

Regional Science Inquiry, Vol. VI, (2), 2014
129
Book Title: Planning London for the Post-War Era 1945-1960
Author: Emmanuel V. Marmaras
ISBN: 978-3-319-07646-1 (Print) 978-3-319-07647-8 (Online)
A very interesting book which deals with the formation of the post-
Second World War reconstruction and planning machinery in Great
Britain, on the one hand and, on the other, with the re-planning efforts
undertaken in post-war London and in particular the redevelopment
programme regarding its central area in the form of the comprehensive
development projects. The book is structured into three parts. The first one
has the title “Reconstruction and Planning Machinery”. The second part
has the title “Re-planning London” and the third part, is under the title
“Redeveloping Central London”. The book recounts an example of
harmonious collaboration between the private and public sector in the
planning of post-war London. In addition, the book extracts research
material from original sources, not published before, to make those
available to scholars and the general interested public. Finally, the book
presents, step by step the British post war urban construction machinery in
order to provide an intelligence source for future students, researches and
policy makers.
Book Review by Professor Dr. George M. Korres,
Department of Geography, University of the Aegean

Regional Science Inquiry, Vol. VI, (2), 2014 130
Book Title: The Evolution of Personal Incomes Across Greece:
2001-2008
Author: Prodromos Prodromidis
ISBN: 9789603519553
The book studies the personnel income mosaic of Greece at the local
community level, from the time the country joined the European Union’s
and the Economic Monetary Union to the financial and economic crisis.
The book process as follows:
Chapter 1: The introduction
Chapter2: The Spatial and temporal patterns of the
disaggregated data. This chapter offers a description of
the country in terms of the data and the spatial and
temporal patterns of personal income and its components
during the period under consideration.
Chapter 3: An inquiry into the features of the
unexplained element. This chapter looks into the steady
or not steady evolution of those elements that cannot be
readily explained across space.
Chapter 4: Conclusions, references and appendix. The
final chapter emphasised in conclusion, while the
appendix provide tables, maps and a comprehensive
index of the country’s revenue districts.
Book Review by Dr. Dr. Aikaterini Kokkinou, University of the Aegean