volume xlv number 01 january-february 2017 - welcome …
TRANSCRIPT

VOLUME XLV NUMBER 01 JANUARY-FEBRUARY 2017
The Institute of Cost and Management Accountants of Bangladesh(An autonomous professional institution under the Ministry of Commerce, GOB)
The Institute of Cost and Management Accountants of Bangladesh(An autonomous professional institution under the Ministry of Commerce, GOB)
01
01
02
0304
05
06
07
08
09
10
11
12
14
13
15
Widening Cost Audit and Other
Practicing Horizon
02 Branding CMAsand PromotingCMA Profession
03 Enhancing
InternationalCollaboration 04
AcademicExcellence
09Members' Welfare
10Service
DeliverySystem of
the Institute
05 Members'CapacityBuilding
06 Young
Members'Empowerment
12 Representationin Regional and
InternationalAccounting
Forums
15Continueon-going
Projects/Activities
13Research
andDevelopmentDevelopment
14Strengthen
FinancialSustainability
of the Institute
07 Women
Members'Empowerment Empowerment Empowerment
08 Governance
11Social
Branding
ICMAB 16th National Council 2017- 2019Journey towards Good to Great

ISSN 1817-5090 n VOLUME XLV n NUMBER 01JANUARY-FEBRUARY 2017
� Editor�Mr. Naba Krishna Muni FCMA� �[email protected]
� Associate Editors�Mr. Shawkat Hossain FCMA� �Mr. R. Tareque Moudud FCMA�Journal and Publication� Committee� Chairman�Prof. Dr. Swapan Kumar Bala FCMA� Vice-Chairman�Mr. Roomee Tareque Moudud FCMA � Members�Prof. Mamtaz Uddin Ahmed FCMA� �Mr. Mohammed Salim FCMA� �Mr. Md. Abdur Rahman Khan FCMA� �Mr. M. Abul Kalam Mazumdar FCMA� �Mr. Abu Bakar Siddique FCMA� �Mr. A. K. M. Delwer Hussain FCMA� �Mr. Arif Khan FCMA� �Mr. Md. Munirul Islam FCMA� �Kazi Muhammad Ziauddin FCMA� �Mr. Md. Yusuf FCMA� �Mr. Hamid Monirul Azam FCMA� �Mr. S.M. Elias Amin FCMA� �Mr. Md. Shafiqul Islam FCMA� �Mr. Muhammad Shahid Ullah FCMA� �Sk. A.H. Md. Imtiaz Hossain FCMA� �Mr. Mohammad Nazrul Islam FCMA� �Mr. Sabbir Ahmed FCMA� �Mr. Syed Kabir FCMA� �Mr. Mohammad Abul Mansur FCMA� �Mr. Hasan Faisal ACMA� �Mr. Md. Mizanur Rahman ACMA� �Kazi Md. Siddikul Azam ACMA� �Mr. Saleh Ahmmad ACMA� �Dr. Anup Kumar Saha ACMA� �Mr. Mohammad Siful Islam ACMA� �Mr. Shah Aziz ACMA� �Mr. Mohammad Rabioul Hasan ACMA� �Kazi Ruhul Amin ACMA� Secretary�Mr. Mohammed Mizanur Rahman� �Additional Director (R & P)
� Publisher�Mr. Md. Mahbub-Ul-Alam� �Executive Director, ICMAB
� All supervision�Mr. Mohammed Mizanur Rahman
� Photography�Mr. Md. Moslem Uddin
� Design & Print �Orchi Logistics� �159, Arambag (1st floor), Motijheel, Dhaka-1000.� �Ph.: +88 02 7192152, email: [email protected]
� Editorial Office�The Institute of Cost and� �Management Accountants of Bangladesh� �ICMA Bhaban, Nilkhet, Dhaka-1205.� �GPO Box No. 2629� �Tel.: 9615460 & 9611799� �[email protected]� �[email protected]
Contents01Editorial
02PRESIDENT'S Message
03Environmental Reporting Practices and it's Relationship with Corporate Characteristics: An Evidence from Manufacturing Companies Listed in Dhaka Stock Exchange (DSE)
12Sustainability and Climate Change Challenge:Are We Ready?
16Impact of advertisement & promotional cost: Study on Marketing Cost of Pharmaceutical Industry in Bangladesh
28E-waste management: A study on legal framework and institutional preparedness in Bangladesh
36An Analysis of Liquidity Position of Non-Bank Financial Institutions: A Study on Some Selected Non-Bank Financial Institutions in Bangladesh
45Financial Performance & Customer Satisfaction of Islamic and Conventional Banks in Bangladesh:A Comparative Study
55Key Performance Index: A Tool to Upgrade Teachers' Skills and Produce Quality Professionals
56CMAs Working in the Corporate World- An Interview
58Update on IFRS, IAS, IFRIC and SICfor Professional Accountants
63Update on Income Tax
68Update on Dhaka Stock Market
71CMA Students' World
73ICMAB News
Bi-monthly Journal of the ICMAB
All rights reserved. No part of this publication may be reproduced, duplicated or copied by any means without the prior consent of the holder of the copyright, requests for which should be addressed to the publisher.

Making ICMAB (The Institute of Cost and Management Accountants of Bangladesh) into a world class professional institute to serve and build a better Bangladesh is the top most priority of the present time. In the Vision 2021 of Bangladesh Government highlighted that "Our final goal is, people's socio-economic emancipation and build a poverty and hunger-free developed prosperous country," and to make Bangladesh a' mid-level-income' country. But, in a country, where there are so many crises prevailing in Bangladesh, which is mainly due to politics without principles, wealth without hard work, knowledge without character, commerce without morality and pleasure without conscience. By building an ethical CMA profession for Bangladesh, ICMAB intends to support to the journey of the Government to build a better Bangladesh and to achieve Vision 2021 and Rupokalpa 2041. Good governance, people's capability and empowerment should be the guiding principles of this robust journey.
The cost and management accounting profession has emerged as a highly prestigious profession and positioned as a critical component of the market economy. When Government has been providing legal and institutional support by creating professional accounting bodies (ICMAB and ICAB) with rules and acts to support economic growth of the country, then cost and management accounting profession has also played a critical role in establishing oversight by reporting to various stakeholders like shareholders, investors, entrepreneurs, civil society and the Government at large.
ICMAB has been producing CMAs since its inception. A CMA is an agent of positive change in the field of CMA profession covering business, trade, commerce, industries and economics. A CMA is an entrepreneur who could change everyone including every stakeholders in the society. CMAs could be the prime mover of building Bangladesh in the era of rapid global competition in the business environment worldwide. CMA profession is an ethical and value driven life time profession that could influence every one including corporate, NGOs and Government sectors covering Ministry of Finance, Ministry of Commerce, Ministry of Industries, Ministry of Planning, Ministry of Information, Ministry of Law, Ministry of Education, Ministry of ICT, Ministry of Women and Child Affairs and Ministry of Youth. Cost and Management Accounting is more that we think because the environment is continuously changing. So, CMAs are connected to a dynamic profession. CMAs are not only cost and management
accountant but also 'value for money' creating accountant. CMAs will not only to give you something to drink but also make you thirsty. They will put you on a path to success in the long run.
ICMAB has strongly stressed on maintaining 'global standards' in forming the proposed Financial Reporting Council (FRC) in order to materialize the purposes of its establishment. The FRC will be the supreme body under the proposed Financial Reporting Act (FRA) 2015. ICMAB expects FRC will be formed with composition of diversified stakeholders of money and capital market consisting representatives from bar association, Bangladesh Securities Exchange Commission, economists, non-practicing accountants from ICAB/ICMAB, university professors and regulators. Among all the stakeholders, ICMAB is considered one of the prime stakeholders in the above mentioned group and its inclusion in the FRC is important to strengthening institutions and establishing good governance, transparency and accountability in the money and capital market in Bangladesh. In a democratic country, government's decision making is characterized by openness and transparency to prevent discrimination and promotes equal opportunity for all. ICMAB's founder, Ruhul Kuddus, FCMA who established this institute in 1977 with a hope to build CMA profession to become number one profession in the country and we all have been working to implement his dream and transform it into action every day.
ICMAB has been in process of transformational leadership. In 2014, the institute has been under the leadership of Mr. Mohammed Salim, FCMA who initiated and signed Memorandum of Understanding (MoU) between ICMAB and CIMA, UK and implemented CIMA curriculum. In 2015, the institute has been under the leadership of Mr. A.S.M. Shaykhul Islam, FCMA who assisted the Government to approve FRA from Bangladesh Parliament. In 2016, Mr. Arif Khan FCMA has been leading ICMAB to become as a world class professional institute. In 2017, ICMAB has been under the leadership of Mr. Jamal Ahmed Choudhury, FCMA, a young and inclusive leader who promised to keep continue ICMAB's Journey Towards Good to Great. We always address where there is darkness, let there be light and keep continue the legacy of former leaders of ICMAB as candle bearers. Let's make CMA profession as number one profession in the country, together.
ISSN 1817-5090 n VOLUME XLV NUMBER-1, JANUARY-FEBRUARY 2017
Bi-monthly Journal of the ICMAB
Naba Krishna Muni FCMAEditor, The Cost & Management
Editorial
01 THE COST AND MANAGEMENTISSN 1817-5090, VOLUME-45, NUMBER-1, JANUARY-FEBRUARY 2017
Visionary CMA Profession

PRESIDENT'SMESSAGE
Jamal Ahmed Choudhury FCMAPresident, ICMA Bangladesh
02 THE COST AND MANAGEMENTISSN 1817-5090, VOLUME-45, NUMBER-1, JANUARY-FEBRUARY 2017
PRESIDENT'SMESSAGE
Respected member of the CMA profession
It is indeed a great privilege for me to represent you as President of ICMAB for the year 2017. This is certainly one of the greatest honor I have ever been bestowed with. I express my deep gratitude to you all for giving me the opportunity to serve such a prestigious profession. Your unceasing support and co-operation in every endeavor is my biggest strength to carry out the new responsibility.
The economy of Bangladesh has got a spectacular record of growing at the rate of six percent plus for over a decade. It is now poised to become a middle income country by 2021. Research and studies shows that there exists a strong link between the economic growth and the demand for accounting expertise. This means, the Cost and Management Accountants being a partner to the development of the business and industries of the country, has got wider responsibilities and roles to play. Member of the Institute must envisage and comprehend the changes to maintain and widen their leadership positions. The Institute will continue to act as a catalyst to meet the changing demands ensuring highest standard of professional services that its members are always respected for.
The successful negotiation done by the past council has widened our practicing avenues. Recognizing the benefits of cost audit, companies are now finding it important to carry out cost audit in their organizations. Corporate Governance and Transfer Pricing certification are two new areas where our members are now eligible to work. This means more engagement of our members in public practices which calls for added responsibility of the Institute to ensure the quality of audit and other services performed. We have specific plan to train and develop our members interested to pursue public practices. Members of the profession are committed to deliver high quality services and the institute will continue to do everything possible in this direction.
There has been a significant change in our academic curriculum as part of our education and examination reform initiatives. This time we need to concentrate on question setting and assessment process as well as training of the teachers and others associated with assessment to make it more aligned with international standards.
Student enrollment in recent years has improved; more attention however, needs to be given to further increase our intake especially, we need to devise strategies to attract brilliant students to the profession. Gender diversification is also a matter to be taken care of. Out of 1263 members, so far we have only 37 female members. We would therefore, promote to enroll more female students. Moreover, we will take initiative to provide mentorship and teaching support for our students particularly our senior students to overcome their hurdles.
Branding the CMA profession and increased linkage with private sector will continue to remain our focus to create employment opportunities for our new members. Persistent liaison with the government and Policy makers to promote and protect the interest of the profession shall also be an important priority agenda of the new council.
The professional wisdom and excellent leadership of all my predecessors has given the profession a strong foothold. I inherit a wonderful legacy and just as it happens in a relay race, the baton has now been handed over to me to carry it forward to the next level. I seek support, co-operation and guidance from you all to shoulder this enormous responsibility.
Sincerely yours
03 THE COST AND MANAGEMENTISSN 1817-5090, VOLUME-45, NUMBER-1, JANUARY-FEBRUARY 2017
Abstract
The study explores the volume of the environmental reporting practices of 30 manufacturing companies listed in Dhaka Stock Exchange (DSE) and it's relationship with the company's corporate characteristics (i.e., total assets, gross revenue, age and EPS). To measure the level of environmental accounting disclosure practices in the annual reports, the study goes through in two-step process: (i) construction of the environmental accounting disclosure index, and (ii) scoring the environmental accounting disclosure items. For analyzing the collected data, some statistical tools (Descriptive Statistics, OLS Regression model, Correlation analysis) have been used. The result depicts that, a diverse set of factors influence the level of environmental accounting disclosure practices in the annual reports of the manufacturing companies. The study have the implication for current professional practice and are an important addition to existing literature in the arena of environmental accounting disclosure. The study also found that the company's total assets, gross revenue and EPS have the positive relationship with the level of environmental accounting disclosure whereas company's age has negative relationship with the level of environmental accounting disclosure practices in the annual reports.
Keywords: Environment, Environmental Reporting, Corporate Characteristics, OLS Regression.
Professor Md. Nazim Uddin Bhuiyan FCMAProfessorDepartment of Accounting & Information SystemsDhaka University, [email protected]
S. M. Khaled HossainLecturerDepartment of Business AdministrationCity University, [email protected]
Fatema AktherLecturerDepartment of Business AdministrationInstitute of ScienceTrade & Technology, [email protected]
it's Relationship with Corporate Characteristics: An Evidence from Manufacturing CompaniesListed in Dhaka Stock Exchange (DSE)
it's Relationship with Corporate CharacteristicsAn Evidence from Manufafaf cturing Companies
EnvironmentalReportingPractices and

i. To know the volume of environmental accounting information reported in annual reports of the selected manufacturing companies listed in Dhaka Stock Exchange; and
ii. To justify whether there is any relationship between extent of environmental disclosure and company's corporate characteristics.
3. Literature ReviewThe concept of environmental accounting disclosure practice is relatively new. Very few studies have been conducted on this issue. The related literatures are presented below:
3.1 Status of Environmental Accounting Information Disclosure Practices
In Hong Kong, Ho et al. (1994) conducted a research study on 182 organizations and found that exclusive 9 out of these 182 organizations (4.9 percent) uncovered environmental accounting information in their annual reports for the year 1991. In Korea, the investigation of Choi et al. (1998) reveals that out of 770 listed companies only 64 companies revealed environmental accounting information in their annual reports for the year 1997. Tsang (1998) led a longitudinal investigation of social and environmental reporting rehearses by the banking, food and beverages and hotel industries over a ten-year time span from 1986 to 1995. The analyst found that 17 (52 percent) out of 33 listed companies made social and environmental accounting disclosure in their yearly reports. Kisenyi and Gray (1998) studied just four organizations in Uganda and watched that none of them made any environmental accounting disclosure in their yearly reports. Silver and Savage (1994) concentrated on 115 South African organizations and found that only 63 percent organizations had made environmental accounting disclosure in their yearly reports.
Dutta and Bose (2007) directed another study in Bangladesh; likewise found that corporate environmental accounting disclosure in Bangladesh is still in it's earliest stages as the level of environmental accounting disclosure on sites is low. Bose (2006) investigated 5 years' annual reports of 11 Petrobangla organizations for looking at their environmental accounting disclosure status. He found that in 1998-1999 and 1999-2000, just 45.45% and in 2000-01, 63.63% and in 2001-02 and 2002-03, just 81.81% of Petrobangla organizations disclosed these information in their annual reports.
1. IntroductionPresently a-days environment has turned into an extremely urgent issue for individual life as well as for business life and henceforth, environmental development and environmental reporting rehearses by various associations all through the world have got a significant concern at present time. Lodhia (2006) has characterized Corporate Environmental Reporting (CER) as a procedure through which "organizations regularly unveil environmental data to their stakeholders to prove that they are responsible for environmental accounting and the resultant effect on the environment." Traditionally, organizations uncover environmental data through yearly reports, remain solitary environmental reports, corporate social responsibility reports, official statements, news media, notices, booklets, bulletins, inner magazines and leaflets (Zéghal and Ahmed, 1990; Tilt, 2001; Lodhia, 2005).
This paper investigated the extent of environmental accounting information disclosure in the annual report of selected manufacturing companies listed in Dhaka Stock Exchange. To prevent result from being contaminated by inter-industry factors, the study has been chosen different organizations from various segments. Since environmental pollution in the industries is very alarming, hence it needs to justify how much they are delivering environmental accounting information in their annual reports in creating consciousness among the stakeholders of the organizations. The more environmental accounting information disclosure in annual reports of the companies supposed to create more awareness regarding environment. The present study found that more and more companies came forward to disclose more environmental accounting information in annual reports. But the present disclosure volume is considered to be insufficient in creating environmental awareness. Therefore, it is necessary to encourage or compel them in reporting environmental accounting information in their annual reports. So, this study deserves importance in reporting the present position of environmental accounting disclosure in annual reports of the selected manufacturing companies listed in Dhaka Stock Exchange and in identifying the relationship between company's characteristics and the volume of disclosure.
2. Objectives of the StudyThe major objectives of the study are:
04 THE COST AND MANAGEMENTISSN 1817-5090, VOLUME-45, NUMBER-1, JANUARY-FEBRUARY 2017

of the normal data in their yearly reports. Hossain et al. (2006) found 8.33% of Bangladeshi organizations reveal environmental accounting information in their annual reports, and the disclosure levels connected with the nature of the company, presence of debentures in the corporate annual reports, and the net profit margin.
4. Methodology of the Study:4.1 Research Design and Sample SizeThis study is empirical research by nature which investigates the extent of environmental accounting disclosure in annual reports of Bangladeshi companies. There are 22 sectors in Dhaka Stock Exchange (DSE). Seven sectors were purposively selected from the available sectors which are listed with DSE. The selected sectors are textile, cement, steel, food & allied, ceramics, pharmaceutical and miscellaneous. Again, from these stratified seven sectors, purposively 30 companies from this seven were selected conveniently.
4.2 Data Sources The study is conducted on the basis of secondary data. The data has been collected from the annual reports of the selected companies listed in Dhaka Stock Exchange (DSE) of Bangladesh. Annual report, the key communication tool of a company (Lang & Lundholm 1993), is chosen as the reliable source of data for the study as because it is available widely (Hooks, Coy & Davey 2002) and it communicates company's overall image to the stakeholders (Cameron & Guthrie 1993). All annual reports are collected from the websites of the respective companies.
4.3 Development of Environmental Disclosure Index
Disclosure Index Approach has been used to provide an evaluation of the environmental accounting disclosure in corporate annual reports. There is no generally accepted theory to predict user information needs and there is an absence of an appropriate generally accepted model for the selection of the items of environmental information to be included in a disclosure index. The items of environmental information included in the disclosure were selected from the study of Wiseman (1992), Porwal and Sharma (1991), and Singhand Ahuja (1983) which were considered essential for complete environmental accounting disclosure.
Rahman and Muttakin (2005) conducted a study on 125 assembling organizations listed in the Chittagong Stock Exchange (CSE) as on May 7, 2005. They broke down the annual reports of these 125 organizations and found that only 5 organizations (4 percent of 125 organizations) uncovered environmental accounting information in their yearly reports. Shil and Iqbal (2005) reviewed 121 assembling organizations listed in the Dhaka Stock Exchange (DSE). They reported that only 13 organizations (11 percent of 121 organizations) revealed environmental accounting data in their yearly reports. Bala and Yusuf (2003) has analyzed the yearly reports of 249 public limited companies (listed in Dhaka Stock Exchange) for the year of 2001. They report that 26 (10.4 percent of the aggregate) organizations uncovered environmental accounting data in the Directors' Report or in the Chairman's Statement.
3.2 Relationship Between Environmental Reporting Practices and Company's Corporate Characteristics
Akrout and Othman (2013) analyzed determinants of environmental reporting in Arab Middle Eastern and North African (MENA) organizations. Utilizing a specimen of 153 sites of listed companies, discoveries demonstrate a negative and noteworthy relationship between environmental reporting and 'family ownership', the level of environmental reporting is considerably influenced by organization size and performance. Ortaset al. (2014) inspected the impact of organizations' budgetary components on the degree of environmental reporting in a noteworthy example of 3931 organizations working in 51 businesses and 59 nations. Utilizing a quintile regression they found that, legitimacy theory, agency theory, political costs theory, and signal theory offers a better understanding of the complex structure of the dependencies found among factors such as company size, leverage, return on assets, research and development spending, market return and market capitalization, and commitment to environmental reporting.
Hafij Ullah et al. (2013) made an exact examination of the degree of environmental accounting disclosure in selected listed companies in Bangladesh. This concentrate likewise attempted to report the relationship between organization's particular characteristics and environmental accounting disclosure of these selected companies. The study uncovered that on an average companies disclosed only 8.53 (15.23%)
05 THE COST AND MANAGEMENTISSN 1817-5090, VOLUME-45, NUMBER-1, JANUARY-FEBRUARY 2017

expected to earn is calculated as follows:
Where, MEADIS = Maximum Environmental Accounting Disclosure Index Score.
n = the number of information items in the environmental accounting disclosure index
expected to be disclosed, where n 35.
Therefore, the Total Environmental Accounting Disclosure Index Score (TEADIS) for the individual company for each year is calculated as follows:
TEADIS = AEADIS ÷ MEADIS
A company with higher value of disclosure score demonstrates the greater level of environmental accounting disclosure in its published annual reports.
4.4 Hypothesis DevelopmentThe hypothesis of the study are:
H1(I) = There is significant relationship between the company's total assets and the level of their environmental accounting information disclosure in the annual reports
H1(II) = There is significant relationship between the company's profitability (measured by gross revenue) and the level of their environmental accounting information disclosure in the annual reports
H1(III)=There is significant relationship between the company's age and the level of their environmental accounting information disclosure in the annual reports
H1(IV) = There is significant relationship between the company's EPS and the level of their environmental accounting information disclosure in the annual reports.
4.5 Data Analysis TechniqueVarious statistical tools and techniques are used to analyze the data and to test the research hypotheses. The multivariate OLS longitudinal panel model is used in this study to test the simultaneous effect of 30
On the ground of literature total of 35 items of information are finally identified as relevant to environmental accounting disclosure and are applicable to all sampled companies. These 35 environmental accounting disclosure information items are then classified into five key categories according to their nature:
For the purpose of this study it therefore, an un-weighted approach (dichotomous scale) is adopted for use, in which if a company discloses an item of information included in the disclosure index it is assigned a score of 1, and 0 if it is not disclosed.
After all the environmental accounting disclosure items have been scored, the Total Environmental Accounting Disclosure Index Score (TEADIS) for each of the 27 annual reports from the companies in the sample (this score as dependent variable), is calculated as the ratio of the Actual Environmental Accounting Disclosure Index Score (AEADIS), which is awarded to a bank, divided by the Maximum Environmental Accounting Disclosure Index Score (MEADIS), which that particular company is expected to earn.
The Total Environmental Accounting Disclosure Index Score (TEADIS) for each company for each year is calculated as follows:
The Actual Environmental Accounting Disclosure Scores (AEADIS) for per company in the sample of the study in each year is additive as:
Where, AEADIS = Actual Environmental Accounting Disclosure Index Score for per company.
dj = 1 if the j information item is disclosed in the annual reports.
dj = 0 if the j information item is not disclosed in the annual reports.
n = the total of information items which a bank is expected to disclose.
The Maximum Environmental Accounting Disclosure Index Score (MEADIS) that an individual company is
06 THE COST AND MANAGEMENTISSN 1817-5090, VOLUME-45, NUMBER-1, JANUARY-FEBRUARY 2017
Table: 01Number of environmental disclosure items under each category
Category Disclosure Topic Number ofInformation
Percentage(%)
Category- A�Environmental policy� 05� 14.29Category- B�Environmental pollution � 14� 40.00Category- C�Environmental audit � 07� 20.00Category- D�Environmental financial information � 05� 14.29Category- E�Environmental others information � 04� 11.42 � Total � 35� 100.00

5.2 Frequency Distribution of Environmental Accounting Disclosure Score
Table-2 shows the distribution of environmental accounting disclosure performance by expressing the number of items disclosed as percentages of the total of 30 companies. Column one distinguishes ranges of disclosure performances in these terms. The distribution shows a skewness toward relatively low levels of the environmental accounting disclosure for the sample manufacturing companies listed in Dhaka Stock Exchange.
5.3 Total Environmental Accounting Disclosure Practices under Specific Category
Total environmental disclosure was calculated by adding the disclosure scores of the scores of five separate categories, that are, the scores of environmental policy items, environmental pollution items, environmental audit items, environmental financial items, and environmental other items. Table-3 shows that the mean disclosure score, standard deviation, variance, minimum and maximum score of each category and of total as a whole. It is found that maximum mean of 2.93 items disclosed by environmental pollution items followed by environmental policy items (1.20) and by environmental audit items (0.83).Maximum variation is also observed in case of environmental pollution items and maximum 10 items out of 14 were disclosed by this category.
company's corporate characteristics (i.e. size, profitability, age and EPS of the companies) on the level of overall environmental accounting disclosure. The multivariate OLS regression model will be represented by the following equation:
Where, EADI = total score received from each sample company under environmental Accounting disclosure index;
LOG_TA= Log value of Total Assets
LOG_GR= Log value of Gross Revenue
AGE= Age of listing of the companies
EPS= Earnings per share
= the constant, and
= the error term.
5. Data Analysis
5.1 Environmental Reporting Levels by the Manufacturing Companies in Bangladesh
Appendix-3 provides the ranking of the companies on the basis of un-weighted total environmental accounting disclosure score to evaluate their relative position. It is found that the BSRM STEELS LTD. disclosed maximum 18 items (51.42%) out of 35 expected items in their annual reports and Gemini Sea Food, disclosed no information regarding environmental accounting issues in their annual report. In the ranking, BSRM STEELS LTD. followed by BRITISH AMERICAN TOBACCO BANGLADESH COMPANY LTD. which disclosed 17 items (48.57%), ACI disclosed 16 items (45.71%), PREMIER CEMENT MILLS LTD. disclosed 14 items (40.00%). Average environmental accounting disclosure is 16.37% of the expected items.
07 THE COST AND MANAGEMENTISSN 1817-5090, VOLUME-45, NUMBER-1, JANUARY-FEBRUARY 2017
Score Range
Total number of items inDisclosure Index
No. ofcompanies
% in thesample
Companies with Disclosure
� 0- 5� 18� 60.00� 6-10� 6� 20.00� 11-15� 3� 10.00� 16 - 20� 3� 10.00� 20-Over� 0� 0� Total� 30� 100
Table: 02
� Mean� 1.20� 2.93� 0.83� 0.13� 0.63� 5.73�Std. Deviation�1.031� 2.876�1.147� .346� 1.066� 5.245� Variance� 1.062� 8.271�1.316� .120� 1.137� 27.513� Minimum� 0� 0� 0� 0� 0� 0�Maximum� 3� 10� 4� 1� 3� 18
Envi
ronm
enta
lPo
licy
Envi
ronm
enta
lPo
llutio
n
Envi
ronm
enta
lA
udit
Envi
ronm
enta
lFi
nanc
ial
Envi
ronm
enta
lO
ther
Tota
lEn
viro
nmen
tal
Disc
losu
re
Table: 03

The regression result indicated that the effect of Profitability (EPS) on environmental accounting disclosure, as represented by current ratio is positive, with the coefficient of 0.083. Therefore, "Hypothesis (H3): There is significant relationship between Profitability (measured by EPS) and the volume of environmental accounting disclosure" is accepted.
Finally, according to the regression results, it can be inferred that there is no significant positive relationship between the Age of listing of the company and the extent of environmental accounting disclosure in annual reports as the regression coefficient for the predictor variable (Age) is -0.81. Consequently, "Hypothesis (H4): There is significant relationship between Age and the volume of environmental accounting disclosure" is rejected.
6. FindingsAfter reviewing the related literature and analyzing statistical data of the selected manufacturing companies, some mentionable findings are arrived. Some of these are:
1. Companies have been found to disclose only positive qualitative information about their environmental activities.
2. None of the companies separately disclosed the amount of normal provisions or provisions set aside for contingent liabilities in respect of the environment.
3. They do not classify the expenditure (incurred for the improvement of the environmental performance) between capital and operating nature. They should consider the entire expenditure as operating expenditure.
4. All the companies examined in the study prepare their accounts in accordance with the traditional accounting system, i.e., there is no determination and classification of environmental expenditures.
5. The companies do not maintain any approaches (either monetary or physical approaches) of environmental accounting.
6. There is significant relationship of the company's Assets, Gross Revenues and Earnings Per Share (EPS) with the level of their environmental accounting information disclosure in the annual reports.
7. There is no relationship between company's Age and the level of their environmental
5.4 Correlation AnalysisPearson product moment correlation coefficients (r) were computed to justify the correlation between the dependent and independent variables. Appendix-2 shows a correlation matrix of all values of r for the independent variable along with the dependent variable. The result of Pearson product-moment correlation exposes that Total Environmental Accounting Disclosure Index Score (TEADIS) is positively correlated with Log of Total Assets of the companies (Log_TA); Log of Gross Revenue (Log_GR) of the companies and Earning Per Share (EPS) and is significant (sig. 0.000). On the other hand, TEADIS has a negative relationship with Age of the companies.
5.5 Multivariate AnalysisIt was hypothesized that for the sample companies, Total Asset, Gross Profit, Age of Listing and EPS would be positively associated with the extent of environmental disclosure. An Ordinary Least Square (OLS) regression model was fitted for the environmental accounting disclosure score as dependent variable and company attributes as independent, and the results are presented in Appendix-2. The multiple regression model is significant at 5% level. The coefficient of determination R2 indicates that only 31.60% of the variation in the dependent variable is explained by variations in the independent variables. A detailed discussion of the further regression result on the basis of research hypotheses is presented in the following paragraphs.
The regression results as shown in the Appendix-2 revealed that the most company attributes that helps explain variations in the extent of environmental accounting disclosure in the annual reports is total assets. The regression coefficient for the log value of total asset is 1.864 which is positive. As a result, "Hypothesis (H1): There is significant relationship between the company's assets and the level of their environmental accounting information disclosure in the annual reports" is strongly accepted.
Again, the regression result show that gross revenues of the company has a positive correlation with the extent of environmental accounting disclosure as the regression coefficient for the predictor variable (Gross Revenue) is 1.279. As a result, "Hypothesis (H2): There is significant relationship between Gross Revenues and the volume of environmental accounting disclosure" is accepted.
08 THE COST AND MANAGEMENTISSN 1817-5090, VOLUME-45, NUMBER-1, JANUARY-FEBRUARY 2017

environmental contamination restrains no limit. The study is an endeavor in investigating the environmental accounting disclosure hones by Bangladeshi manufacturing companies and found that a few organizations are uncovering more information with respect to environmental issues, a large number of yet a few organizations are not disclosing any or unveiling unimportant data in regards to environmental perspectives. This study also found that there is a positive relationship among level of environmental accounting disclosure practices and organization characteristics in particular namely total assets, gross revenues and EPS of the companies whereas a negative relationship between environmental accounting disclosure practices and age of the companies. But the results may be different if different sample or data are used for a study. So, in using and interpreting the results of the study, the limitations are also to be considered. The real impediments of the study include: the study is based on only secondary data; it depends on purposively selected listed companies in Bangladesh, and annual reports of one year were used for the study. The study expects that the organizations would encourage in disclosing more information on environmental aspects and would aware the general people with respect to environmental protection in environmentally most vulnerable countries like Bangladesh.
References:
Akrout, M. M., & Othman, H. B. (2013). A study of the determinants of corporate environmental disclosure in MENA emerging markets. Journal of Reviews on Global Economics, 2, 46.
Ang, B. W., Zhang, F. Q., & Choi, K. H. (1998). Factorizing changes in energy and environmental indicators through decomposition. Energy, 23(6), 489-495.
Bala, S. K., & Yusuf, M. A. (2003). Corporate environmental reporting in Bangladesh: a study of listed public limited companies. Dhaka University Journal of business studies, 24(1), 31-45.
Cameron, J., & Guthrie, J. (1993). External annual reporting by an Australian university: changing patterns. Financial Accountability & Management, 9(1), 1-15.
Das, H. K., Sengupta, P. K., Hossain, A., Islam, M., & Islam, F. (2002). Diversity of environmental arsenic pollution in Bangladesh. Bangladesh environment, 1, 234-244.
de Villiers, C., Naiker, V., & van Staden, C. J. (2011). The effect of board characteristics on firm environmental performance. Journal of Management, 0149206311411506.
Dutta, P., & Bose, S. (2007). Corporate Social and Environmental Reporting on corporate websites: a study on listed companies of Bangladesh. The Cost & Management, 35(4), 31-49.
Ho, K. M., Chan, C. T., Soukoulis, C. M., Biswas, R., &Sigalas, M.
accounting information disclosure in the annual reports.
7. Recommendations and SuggestionsThe following are the recommendations based on the findings of the study:
1. This study indicated that the companies have already given much effort in the field of environmental protection. However, the current accounting system does not reflect such efforts for its stakeholders. So, companies should take the initiative showing such activities in their accounts. Environmental expenditures incurred by companies should be classified into capital expenditures and operating expenditures.
2. Companies should maintain the provision for environmental liability and should show data on environmental expenditure, environmental costs should be charged to income in the books of the accounts in their annual reports.
3. Companies should show fines and penalties paid by the company, environmental liabilities of the company, environmental provisions, and environmental costs capitalized in the notes to the accounts in their annual reports.
4. Regulatory bodies should develop rules and regulations to guide the rehearses of Environmental Accounting and Reporting.
5. Research and studies should be encouraged in the field of Environmental Accounting and Reporting.
6. The corporations in Bangladesh should quantify the environmental costs and maintain the procedure for presentation of environmental costs in financial statements. To ensure this ICAB should formulate separate guidelines and pronounce those to be strictly practiced.
7. The Government and other regulatory bodies should give more concentration on the setting up of waste management or recycling plants to protect the environment.
8. ConclusionEnvironmental issues are burning tale in the present world. Not only the first world but the third world countries are also worried about environmental issues. The unsafe impact of
09 THE COST AND MANAGEMENTISSN 1817-5090, VOLUME-45, NUMBER-1, JANUARY-FEBRUARY 2017

(1994). Photonic band gaps in three dimensions: new layer-by-layer periodic structures. Solid State Communications, 89(5), 413-416.
Hooks, J., Coy, D., & Davey, H. (2002). The information gap in annual reports. Accounting, Auditing & Accountability Journal, 15(4), 501-522.
Hossain, M., & Reaz, M. (2007). The determinants and characteristics of voluntary disclosure by Indian banking companies. Corporate Social Responsibility and Environmental Management, 14(5), 274-288.
Hossain, M., Islam, K., & Andrew, J. (2006). Corporate social and environmental disclosure in developing countries: Evidence from Bangladesh.
Kisenyi, V., & Gray, R. (1998). Social disclosure in Uganda? A research note on investigating absence.
Lang, M., &Lundholm, R. (1993). Cross-sectional determinants of analyst ratings of corporate disclosures. Journal of accounting research, 246-271.
Lodhia, S. K. (2006). Corporate perceptions of web-based environmental communication: an exploratory study into companies in the Australian minerals industry. Journal of Accounting & Organizational Change, 2(1), 74-88.
Ortas, E., M. Moneva, J., &Álvarez, I. (2014). Sustainable supply chain and company performance: a global examination. Supply Chain Management: An International Journal, 19(3), 332-350.
Porwal, L. S., & Sharma, N. (1991). Social responsibility disclosure by Indian companies. The Chartered Accountant, 39(8), 630-635.
Rahman, M. A., &Muttakin, M. B. (2005). Corporate Environmental Reporting Practices in Bangladesh: A Study of Some Selected Companies. The Cost & Management, 33(4), 13-21.
Shil, N. C., & Iqbal, M. (2005). Environmental disclosure-a Bangladesh perspective.
Silver, P. G., & Savage, M. K. (1994). The interpretation of shear-wave splitting parameters in the presence of two anisotropic layers. Geophysical Journal International, 119(3), 949-963.
Singh, D. R., & Ahuja, J. M. (1983). Corporate social reporting in India. International Journal of Accounting, 18(2), 151-169.
Tilt, C. A. (2001). The content and disclosure of Australian corporate environmental policies. Accounting, Auditing & Accountability Journal, 14(2), 190-212.
Tsang, A. H. (1998). A strategic approach to managing maintenance performance. Journal of Quality in Maintenance Engineering, 4(2), 87-94.
Ullah, M. H., Yakub, K. M., & Hossain, M. H. (2013). Environmental Reporting Practices in Annual Report of Selected Listed Companies in Bangladesh. Research Journal of Finance and Accounting, 4(7), 45-58.
Wiseman, J. W. (1992). U.S. Patent No. 5,168,446. Washington, DC: U.S. Patent and Trademark Office.
Zeghal, D., & Ahmed, S. A. (1990). Comparison of social responsibility information disclosure media used by Canadian firms. Accounting, Auditing & Accountability Journal, 3(1).
10 THE COST AND MANAGEMENTISSN 1817-5090, VOLUME-45, NUMBER-1, JANUARY-FEBRUARY 2017
Appendix: 01
Environmental Accounting Disclosure Items Considered for Development of Disclosure Index
A.Environmental policy (05)1. Actual statement of policy2.Statements of formal intentions3.General statements of "the company will, the company does" nature4. Investment appraisal to include consideration of the environment5.Establishment of environmental management systemsB.Environmental pollution (14)1. Waste(s) management2.Eco-efficiency3.Packaging and take-back4.Pollution and emissions- noise, spills, visual quality, including any attempts to identify, improve, control, treat or prevent5.Carbon sequestration, climate change6. Air emission information7.Water discharge information8.Research on new methods of production to reduce environmental pollution9.Pollution -prevention technologies10.Pollution control of industrial process11.Solid waste disposal information12.Conservation of natural resources13.Recycling plant of waste products14.Land reclamation and forestation programs.
C.Environmental audit (07)1.Reference to environmental review, scoping, audit, assessment, including independent attestation2.Incidents of and fines for non-compliance3.Obtaining certification for Environmental Management Systems/ISO 140014.Conducting Environmental Impact Assessment (EIA) / air quality assessment5.Execution of environmental policies6.Compliance with environmental standards and regulation7.Environmental risk assessment and estimationD.Environmental financial (05)1.Discussion of environmental-economic interaction2.Contingencies& provisions3.Environmentally-related loans, grants; costs of purchasing and installing environmental friendly machines and equipment; maintenance and consultancy costs4.Past and current expenditure for pollution control5.Future estimates of expenditures for pollution control equipment and facilitiesE.Environmental other (04)1.Environmental education (note: care should be exercised noting the overlap with community)2.Environmental awards; employee environmental training and awareness; partnerships between environmental research institutions and business3.Involvement with initiatives and schemes4.Maintenance of the balance of environment.

11 THE COST AND MANAGEMENTISSN 1817-5090, VOLUME-45, NUMBER-1, JANUARY-FEBRUARY 2017
Appendix: 03Summary of Company's Attributes
S.LNo.
Name of the Company Log_Total Asset
Log_Gross Profit
EPS TEADSAge of Listing(Years)
1. BSRM STEELS LTD. 11.51 9.44 5 3.28 18
2. BRITISH AMERICAN TOBACCO BANGLADESH COMPANY LTD. 9.51 10.09 38 104.7 17
3. ACI 10.11 9.90 39 16.68 16
4. PREMIER CEMENT MILLS LTD. 9.99 9.11 2 4.78 14
5. GLAXO SMITHKLINE BANGLADESH LTD. 9.70 9.43 39 68.63 13
6. GPH ISPAT LTD. 9.21 8.93 3 2.35 11
7. MAKSONS SPINNING MILLS LTD. 9.75 8.67 6 0.73 9
8. ANLIMA YARN DYEING LTD 8.73 7.70 18 1.19 7
9. PRAN FOOD LTD. 9.99 9.28 19 6.93 7
10. FU-WANG FOODS LTD. 9.07 8.25 15 0.91 6
11. RATANPUR STEEL RE-ROLLING LTD.(RSRM) 9.67 8.81 2 5.24 6
12. SQUARE PHARMACEUTICALS LTD. 10.43 9.96 20 10.26 6
13. SINGER BANGLADESH LIMITED 9.58 8.73 32 5.91 5
14. BARGER PAINTS BANGLADESH LTD. 9.72 9.03 9 47.33 5
15. THE IBN SINA PHARMACEUTICALS LTD. 9.07 9.02 26 5.95 5
16. SHINEPUKUR CERAPICS LTD. 9.83 8.62 7 0.02 4
17. RAK CERAMICS LTD. 9.97 9.35 5 1.67 3
18. SQUARE TEXTILES LTD. 9.79 8.93 13 3.66 3
19. RENETA PHARMA 9.75 9.16 36 38.77 3
20. APEX TENARY 9.17 8.35 30 5.51 3
21. OLYMPIC INDUSTRIES LTD. 9.70 9.35 26 7.39 2
22. BEXIMCO PHARMACEUTICALS LTD. 10.46 9.70 29 4.15 2
23. ORION PHARMA LTD. 10.41 8.96 2 1.77 1
24. APEX KNITTING LTD. 9.05 8.34 21 2.24 1
25. CONFIDENCE CEMENT LTD. 9.61 8.74 20 6.23 1
26. FUWANG CERAMICS LTD. 9.13 8.21 17 0.49 1
27. APEX FOODS LTD. 9.22 8.47 34 2.99 1
28. NATIONAL POLYMER INDUSTRIES LTD. 9.23 8.42 22 3.09 1
29. BATA SHOES 9.69 9.49 30 51.22 1
30. GEMINI SEA FOOD LTD. 8.33 7.14 30 1.39 0
Appendix: 02
Spearman Rank Correlation
Total Log_TotalLog_Gross EPS Age of Disclosure Asset Margin Listing
Total Disclosure 1.000
Log_TA .396* 1.000
Log_GM .477** .720** 1.000
EPS .381* .038 .491** 1.000
Age of Listing -.041 -.268 .139 .476** 1.000
*. Correlation is significant at the 0.05 level (2-tailed).
**. Correlation is significant at the 0.01 level (2-tailed).
Analysis of Variance
Model Sum of df Mean F Sig. Squares Square
1 Regression 252.128 4 63.032 2.887 .043a
Residual 545.738 25 21.830
Total 797.867 29
a. Predictors: (Constant), Age of Listing, Log_Gross Margin, EPS, Log_Total Asset
b. Dependent Variable: TEADS
Variables in the Equation
Model Unstandardized Standardized t Sig. Coefficients Coefficients
B Std. Error Beta
1 (Constant) -23.203 15.311 -1.5 15 .142
Log_Total Asset 1.864 2.625 .215 .710 .484
Log_Gross Margin 1.279 2.651 .160 .482 .634
EPS .083 .050 .385 1.665.108
Age of Listing -.081 .088 -.189 -.920 .366
a. Dependent Variable: TEADS
Summary of the regression output
1 .562 .316 .207 4.672
a. Predictors: (Constant), Age of Listing, Log_Gross Margin, EPS, Log_Total Asset
Model Coefficient ofmultiple regression
(Multiple R)
Coefficient ofdetermination R2
Adjusted R2 Std. Error ofthe Estimate
12 THE COST AND MANAGEMENTISSN 1817-5090, VOLUME-45, NUMBER-1, JANUARY-FEBRUARY 2017
Abstract
This is a brief commentary about sustainability and climate change and how these are posing a growing challenge towards the corporate environment globally as well locally. The author finds that there are some initiatives from the government to raise the climate change issue in different global climate summits and it is trying to get more funding to cope with the risk that might potential due to the climate change. This paper also emphasizes the lack of research attentions of academics towards these issues of concerns. The author argues that in order to achieve long-term success in an increasingly carbon-constrained world, the Bangladeshi corporate sector will need to respond to the challenges of climate change with appropriate strategies. Finally this paper calls for developing some accounting standards/guidelines to properly reporting sustainability and climate changes issues.
Keywords: Sustainability, Climate Change, Corporate Environment & Bangladeshi Corporate Sector.
Dr. Yousuf KamalAssociate ProfessorDepartment of Accounting & Information SystemsUniversity of [email protected]
Sustainability andClimate ChangeChallenge:
Are We Ready?

13 THE COST AND MANAGEMENTISSN 1817-5090, VOLUME-45, NUMBER-1, JANUARY-FEBRUARY 2017
consumption which results in emission of pollutants. It is estimated that during the last 30 years the CO2 emissions have gone up by 73% (SATRC, 2012). Almost all countries face problem due to climate change; however, Bangladesh is likely to be one of the most vulnerable among all as a result of this climate change (Zaman and Islam, 2012). Nearly every sector of socio-economic life in Bangladesh is likely to be affected by climate change. Research finds that a one meter rise in the sea levels will inundate 17% of Bangladesh's total land area by the year 2050 (Zaman and Islam, 2012).
What initiatives Bangladesh has taken so far?Bangladesh has developed an elaborate policy and planning framework to face the challenges of climate change and associated adversities. The government is an active signatory to the United Nations Framework Convention on Climate Change (UNFCCC). The key relevant policy documents include the Bangladesh National Adaptation Program of Action, Bangladesh Capacity Development Action Plan (CDAP) for Sustainable Environmental Governance, Millennium Development Goals Progress Framework, Bangladesh National Capacity Self-Assessment for Global Environmental Management (NCSA), and National Conservation Strategy. Besides, the country also has a number of sectoral (e.g., forestry, environment, agriculture, and energy) policies to combat the challenge caused by climate change. Within the limits of its meager resources, Bangladesh government allocated $100 million from its own source to take up 44 different climate change related projects under various ministries (Khan et al, 2012). In addition, different voluntary organizations and NGOs are taking various awareness programs regarding the effects of climate change. The government also recently established a National Climate Change Fund, with an initial capitalization of $45 million - mainly focusing on adaptation.
So far, Bangladesh has established two climate funds - Bangladesh Climate Change Trust Fund (BCCTF) financed by itself and Bangladesh Climate Change Resilience Fund (BCCRF) run on foreign aid. From 2010-2014, the Bangladesh government has allocated Tk 2,700 crore for these funds; 66% of the fund was allocated to different short term projects and the remaining 34% has been reserved to tackle aftermaths of disasters. Bangladesh has been granted €8.7 million by the European Union
What is sustainability and climate change? Sustainability and climate change issues are getting growing attention to researchers globally. Both of these issues have also attracted significant attention to the corporate world. However, there is lack of academic attention towards these issues within Bangladesh. So far there is no significant research that comprehensively investigates these issues within the context of Bangladesh. Given that Bangladesh is a developing country and it is seriously affected by these issues, a brief commentary might help academic community and aspiring students/researchers to conduct further research in these areas.
According to the Brundtland Commission of the United Nations (1987), Sustainability means that a company can meet the needs of the present without compromising the ability of future generations to meet their own needs. Sustainability reporting involves the production of information about the social, environmental, and economic performance of an organisation. GRI (2013) defines sustainability reporting as the practice of measuring, disclosing, and being accountable to internal and external stakeholders for organizational performance towards the goal of sustainable development. Sustainability reporting is a broader term considered synonymous with other terms such as triple bottom line (TBL) reporting or corporate responsibility reporting.
Why climate change is a challenge? Climate change is also a global challenge and a major environmental issue of concern to the global community. Climate change represents one of the biggest risks to the planet and to businesses (Zaman and Islam, 2012). Climate change occurs because of an effect referred to as the 'greenhouse effect'. The 'greenhouse effect' describes how natural gases in the earth's atmosphere allow infrared radiation from the sun to warm the earth's surface. These gases prevent heat escaping from the earth's atmosphere. Human actions are increasing the concentrations of these gases, creating global climate change. There has been a considerable increase in the average temperature of the earth in the past century. This rise in temperature is attributed to the effects of global warming brought about by the accumulation of greenhouse gases (GHG) in the atmosphere. The reason for increased GHG, mainly Carbon Dioxide (CO2), is because of the increased energy

14 THE COST AND MANAGEMENTISSN 1817-5090, VOLUME-45, NUMBER-1, JANUARY-FEBRUARY 2017
What effects would likely for Bangladeshi corporate sector as a result of climate change? As noted earlier, given the importance of both climate change and sustainability challenge within the context of Bangladesh, we did not find any significant measures taken by the corporate sector of Bangladesh. If we consider the philosophical notion of 'social contract' we assume that corporations have implicit contracts with the broader society/community that their business operations would not do any kind of harm to the society or broader environment. This notion of social contract also implies that companies operating within the society must inform in whatever medium that their activities would not affect future sustainability and they have appropriate measures to tackle the problems that they created because of their operation such as carbon emission. It is notable that no matter what is the business operation, there is hardly any business that would not emit carbon even for a smaller scale. So it does meant that business organizations should and must provide some reporting as to how they are actually taking measures to ensure sustainability and to reduce the effect of carbon emission.
In other words, we can hold businesses operating in Bangladesh that they must provide reporting as
in order to help the vulnerable people of the country to build resilience against climate change and climate related disasters. The grants will be routed through the Global Climate Change Alliance. Besides, delegates of Bangladesh claimed in the recent Paris climate conference COP21 that Bangladesh would not seek soft loan but grant for climate change adaptation and mitigation purposes. In the Paris climate conference, as victims of global warming, the least developed countries like Bangladesh justifiably demanded that Green Climate Fund should be increased from the proposed $100 billion to even higher amount so that the affected countries can fruitfully carry out their adaptation and mitigation efforts (The Daily Star, 2016).
Given the significant impact of the climate change on businesses and economies, Asian CSR report predicts that climate change is going to be the ''number one stakeholder concern'' which needs to be addressed by the companies in Asia (CSR Asia, 2009). However, if we look back to Bangladeshi private sector, we find that although there are policies and programmatic efforts by the government, the contribution and attention of the private sector and business community in this regards remain marginal. Accordingly, it is argued that in order to achieve long-term success in an increasingly carbon-constrained world, the Bangladeshi companies will need to respond to the challenges of climate change with appropriate strategies.

15 THE COST AND MANAGEMENTISSN 1817-5090, VOLUME-45, NUMBER-1, JANUARY-FEBRUARY 2017
to how they account for sustainability and climate changes issues. Many Westerns countries such as Australia already provided some guidelines for the corporate sector to minimize the effect of climate change. For example, for emitting every ton of carbon, companies need to pay AU $ 23 (Clean Energy Regulator, 2012). Australia has also adopted carbon trading scheme where the higher/lower carbon emitting organizations can trade between them to reduce/increase their allocated emission levels.
However, within the context of Bangladesh we did not see any such initiative so far. Even the corporate regulatory body such as Bangladesh Securities and Exchange Commission (BSEC) so far did not provide any guidelines regarding the reporting of these issues of concerns. As there is no unique guideline, some organizations provide some voluntary reporting because of their stakeholders' pressure or to strengthen their claim for legitimacy. However, these reporting qualities are very poor and lack transparency and accountability. Some of these reports are just a glossy window dressing and does not incorporate any relevant information regarding how they actually take measures to ensure sustainability and to overcome climate change related challenge.
Conclusion
This paper provides a brief discussion about sustainability and climate change issues and their potential implication on the socio-economic condition of Bangladesh. The author finds that recently some initiatives were taken by the government to raise the climate change issue in different global climate summits and it is trying to get more funding to cope with the risk that might potential due to the climate change. However, access to such funding will depend on the local capability in ensuring accountability and transparency and how does Bangladesh actually handle this issue locally. In other words Bangladesh needs to develop its own measures to tackle the challenges caused by the climate change. Any such
measures would benefit the longer time survival and credibility of the corporate sector of Bangladesh. The author believes that having a guideline for sustainably and climate change reporting would provide more accountability and transparency of the organizations. In addition, the accounting professional bodies such as ICAB or ICMAB also need to think proactively about how to develop and adapt accounting standard to properly accounting for these issues of concerns. As an increasing global challenge we cannot and would not ignore the challenges of climate change or sustainability. But definitely we can build our own capability to get ready to undertake these challenges.
References:
Brundtland Commission of the United Nations (1987). Sustainable Development: From Brundtland to Rio 2012, available at http://www.un.org/wcm/webdav/site/ climatechange/shared/gsp/docs/GSP1-6_Background %20on%20Sustainable%20Devt.pdf
Clean Energy Regulator (2012). About the Mechanism, 14 May 2012.
CSR Asia (2009). The future of CSR 2009 Report. Hong Kong, China: CSR Asia.
Global Reporting Initiative (2013). 'Sustainability Reporting Guidelines & Apparel and Footwear Sector Supplement', available at http://www.globalreporting.org.
Khan, M. H., Huq, S. and Shamsuddoha, M. (2012). The Bangladesh National Climate Funds; A brief history and description of the Bangladesh Climate Change Trust Fund and the Bangladesh Climate Change Resilience Fund, LDC Paper Series, IIED.
SATRC, (2012) Green Telecommunication. Kathmandu,Nepal: Asia-Pasific Telecommunity. [Online] Available At:http:// www.aptsec.org/sites/default/files/Uploadfiles/SATRC/SAPI II%20Outcomes/SATRC-SAPIII-02_SATRC _Green _Telecom_Report.doc>. Accessed 20 October, 2014
The Daily Star (2016). Paris Agreement and the Bangladesh Perspective, published on January 01, 2016
Zaman, A. K. and Islam, M. J. (2012). Managing Climate Change: Bangladesh Perspective; ASA University Review, Vol. 6, No. 1.
The individual investor should act consistently as an investor and not as a speculator.
- Ben Graham

16 THE COST AND MANAGEMENTISSN 1817-5090, VOLUME-45, NUMBER-1, JANUARY-FEBRUARY 2017
Abstract
Pharmaceutical enterprise stands at the basic foundation level of Bangladesh's healthcare sector, and serves as one of the most important manufacturing industry. Like other business enterprises, such enterprises need to incur marketing cost. The impact of such marketing cost on revenue and profit was examined with reference to five sample firms. We found that marketing cost is correlated with revenue and operating profit and the coefficients of correlation are 0.9899, 0.9448 respectively. Correlation of advertisement & promotional cost with revenue and operating profit is reflected by coefficients, which are 0.8632, 0.7692 respectively. It is also found that, the dependence of sales revenues and operating profit of pharmaceutical industry on marketing cost are represented by equations, b = 6.4596, b = 1.3802 respectively. And dependence of sales revenues and operating profit of pharmaceutical industry on advertisement & promotional cost is shown by the equation, b = 11.7421, b = 2.2988. It seems that, pharmaceutical companies can generate more revenue and operating profit from advertisement & promotional cost compared to the marketing cost. However, for public interest these enterprises need to avoid unnecessary costs and attempt to cost reduction approach significantly.
Keywords: Pharmaceutical Companies, Marketing Cost, Advertisement & Promotional Cost, Sales Revenue, Operating Profit.
Golam ShahriaLecturer in Accounting BGC Trust University BangladeshChandanaish, [email protected]
Nusrat JahanLecturer in Accounting Premier University Prabartak Circle,[email protected]
Dr. Md. Salim Uddin
Professor Department of Accounting University of [email protected]
MBA, FCA, FCMA
Study on Marketing Cost ofPharmaceutical Industry in Bangladesh
Impact ofImpact ofadvertisement &promotional cost:

17 THE COST AND MANAGEMENTISSN 1817-5090, VOLUME-45, NUMBER-1, JANUARY-FEBRUARY 2017
The MDGs highlight the imperative to adopt collaborative approaches. In particular, Goal 8 promotes global partnership for development, and Target 8e specifically aims to, "in co-operation with pharmaceutical companies, provide access to affordable, essential medicines in developing countries". Collaboration is now part and parcel of the research-based pharmaceutical industry's approach to improving the effectiveness of healthcare systems. The pharmaceutical industry constitutes one of the building blocks of an effective and well-functioning healthcare system. Research-based pharmaceutical companies make a unique contribution to improving global health through the innovative medicines they develop. In addition, they have a strong track record of sustaining programs to improve the health of patients in low and middle income countries like Bangladesh. The contribution of the research-based pharmaceutical industry is vital in the fight against neglected tropical diseases (NTDs).
2. Statement of the Problems:The crux of the problem in the context of marketing of pharmaceutical industry is that the market in Bangladesh remains tiny compared to the population size because of the lack of spending power of the population. Pharmaceutical spending is also amongst the lowest in the world in per capita terms. On the contrary the encouraging feature is that the increased awareness of healthcare and the government's increased expenditure in this sector is causing the demand to increase in this sector. In addition to the demand of therapeutic drugs, the demand for "wellness" drugs such as vitamins and minerals are increasing gradually and the future growth of the sector lies in it. Domestic market size of pharmaceuticals has a direct relationship with economic variables, such as population growth, healthcare expenditure, income level, etc. In Bangladesh, the industry has been experiencing a good growth over the last few years. The growth is attributable to rising population with increasing healthcare expenditure per capita. Noticeably, the increase in healthcare expenditure is due to higher level of private spending, demonstrating rising health awareness among the people. In this connection it is also notable that a significant number of drug consumers obtain drugs without a prescription. When consumers lack a prescription, they will usually either ask a pharmacist for a specific drug or describe their
1. IntroductionThe pharmaceutical industry of Bangladesh is now one of the well-established manufacturing companies. It is now the third largest taxpayer industry in Bangladesh. The history of Pharmaceutical's industry dates back to 1950s. Over the years, the industry has gone through some significant changes. After liberation of Bangladesh in 1971, the industry was largely dominated by MNCs, and the country was very much import dependent. In this context it may be mentioned that due to finance constraint, Bangladesh after several years of liberation, could not increase (in relative terms) budgetary allocations for the health sector. At that time, most of the people had little access to the essential lifesaving medicines. In 1982, through the formulation of national drug policy, and drug control ordinance, a defined guideline for the development of the industry was provided. National Drug Policy (NDP) had established the Drugs Control Ordinance 1982, to ensure availability, affordability and safety of essential drugs. The Drugs Control Ordinance banned certain types of drugs from the market, imposed limits on the marketing rights of foreign companies and established a price control for both finished drugs and their raw materials. Since then, the local firms established a stronger foothold, and the country has now transformed from an import dependent to an active exporter of pharmaceutical products. After the promulgation of Drug Control Ordinance-1982, the development of pharmaceutical industry has accelerated. The skills and knowledge of the professionals and innovative ideas of the people involved in this industry are the key factors for these developments. In fact, the pharmaceutical sector, which is widely regarded as a "hi-tech" industry, is the most developed among the manufacturing industries in Bangladesh. Due to recent development of this sector, the country is exporting medicines to global market including European countries and on the top of it, the industry has been supplying about 95 per cent of the domestic demand for medicines (http://www.pharmadu.net). From the perspective of business nature, the industry can be classified as- 1. High-End products (Anti-Cancer, Insulin, Vaccines etc.), 2. Branded generics (products with a brand presence) 3. Low End generics 4. Contract manufacturing (domestic and export).Top Listed Pharmaceutical Companies in Bangladesh are Square Pharmaceuticals Limited, Beximco Pharmaceuticals Limited, Renata Limited, GlaxoSmithKline Bangladesh Limited, ACI Limited, IBN Sina Pharmaceuticals Limited, Pharma Aids Limited, and Central Pharmaceuticals Limited.

18 THE COST AND MANAGEMENTISSN 1817-5090, VOLUME-45, NUMBER-1, JANUARY-FEBRUARY 2017
Pharmaceuticals have greatly improved health in developing countries, but many people in developing countries do not obtain even inexpensive pharmaceuticals and thus pharmaceuticals research & development (R&D) oriented towards products is needed to be undertaken by developing countries, such as malaria vaccine and access to existing products could be improved by facilitating differential pricing. He suggested that under conditions of rapidly changing demand (as found in pharmaceuticals), price-caps could be manipulated. Morgenson (2011) in a study defined profitability as a measure of the difference between the purchase price and the cost of bringing to market i.e the revenue the company derives from its operations, minus all explicit costs. He emphasized on profitability denoting sustainability of excess earnings of a venture or from product. According to him it is a reflection of the value consumers get from the product or service, the employees getting fair wages and the company making an expected return on their investment.
In the context of the aspect of profit and profitability a number of studies were found. For instance, Nimalathasan (2009) defined profit as an absolute measure of earning capacity, while profitability is a relative measure of earning capacity. On the other hand, Harvey et al (2012) labeled profitability ratio as a benchmark for evaluating the financial position and performance of a firm. Engel (1996) outlined financial ratios such as Gross Profit Margin, Operating Profit Margin and Net Profit Margin as the main indicators of profitability. Engel (1996) stressed a company's gross margin as a very important measure of profitability, because it looks at the company's major inflows and outflows of money. The Operating Profit Margin is the indicator of the company's earning power from its current operations, obtained by dividing Operating Profit by sales. This particular ratio can evaluate a firm's competitiveness. According to Raval (2006)a financial ratio can give a financial analyst an excellent picture of a company's financial situation and the trends that are developing. Profitability of pharmaceutical industries follows the same general definition as profitability of other commercial institutions. As to impact of marketing cost and advertisement cost on sales and profit some studies came to our notice. For example, Pagan (2001) is seen to have conducted a study on the effectiveness of advertising on sales using bivariate Vector Auto Regression model and showed that one time increase in advertising expenditure leads
ailment to a pharmacist who diagnoses the problem and recommends a drug on the spot. In this regard the popular products include a variety of antibiotics, painkillers, and gastric remedies. Consumers purchase one to ten tablets or capsules at a time. The quantity of drugs purchased often depends more on the consumer's finances than on the required dose of medicine. Medicine is very essential for each and every person, when it is needed. But the cost/price calculation of medicine does not consider 'the ability to pay' of population in under developed or developing counties like Bangladesh. In case of some drugs that are not subject to a fixed price, there is considerable price sensitivity in Bangladesh, which is explained by the very high variation in quality with significant incidents of health-damaging spurious drugs and fake drugs that contain no active ingredient. Thus, it is not uncommon for the high quality branded generics of the leading manufacturers to have a 100% price premium over their competitors. In some cases the premium is even higher. Marketing cost which includes also advertisement and promotional expense is one of the elements of cost of sale of medicine. Marketing cost and advertisement & promotional cost are necessary for providing medicine to the customers. But unfortunately, it includes some irrelevant expenses such as physician sample, gift to doctor & clinic etc. From the view point of consumer, this is unwarranted expenditure are burden which need to borne by the ultimate consumers. In this context the nature of marketing cost, its relation to profit, the extent of advertisement cost in the marketing cost and its impact on profit too reveals to be an important area of investigation to which this paper makes an attempt.
3. Literature ReviewAt the global level, valuable studies are available on pharmaceuticals industry and related sectors on various aspects. But such studies are not many in Bangladesh especially in the aspect of marketing costs and their impact on sales revenue, profit. In such a context a brief review on some select studies are made below with reference to aspects of marketing costs and advertising costs. Verdon et al (1968) while studying the relationship between advertising and aggregate demand found that advertising has a positive relation with aggregate demand. Elliot (2001) revealed that advertising has a significantly positive effect on food industry sales and that the relationship between advertising expenditure and sales appears to be stable. Kremer (2002) in a study observed that the

19 THE COST AND MANAGEMENTISSN 1817-5090, VOLUME-45, NUMBER-1, JANUARY-FEBRUARY 2017
reports of Bangladesh Association of Pharmaceutical Industries (BAPI), companies' websites and different government and non-government organizations' websites, etc. have been consulted to collect necessary data for the study. After collection of data, they were tabulated and analyzed.
Simple statistical tools like percentage, regression and correlation have been used to interpret the data and draw inferences there from.
6. Scope of the study:The scope of this study is limited to five pharmaceutical companies out of 11 listed pharmaceuticals companies in the country. These five companies which have nation - wide operational area have been selected as sample for this study with the expectation that they will be of representative character. Data for three years were collected which have been analyzed for arriving at conclusions. The data thus collected have been tabulated and explained by the researchers as per need of the analysis. It is to be mentioned that, for three sample companies accounting year is 1st January to 31st December of each financial year. In two sample companies, the accounting year was 1st July to 30th June, which was converted into 1st January to 31st December.
7. Marketing Cost: The Conceptual Aspects A marketing cost is an amount of money the company spends on marketing. Marketing costs are an important consideration for all businesses because marketing is a primary business function that creates a customer for the business. It includes employee costs, agency fees, advertising, digital marketing, direct marketing, publications, sponsorships, seminars, business travel, gifts to clients, etc.
In fact marketing costs are essential for every type of business. Businesses enterprises invest in marketing to increase marketing orbit, enhance sales revenue and accelerate growth. To ensure that a company spends required amount it is essential to set budget vis - a - vis its elements. It requires proper planning and ensures along with a properly set operating programs together.
As regards elements of marketing cost, the employee costs can be significant if there is an internal marketing department. Businesses houses may employ specialists, such as website managers,
to increase in the sales of orange with a one month lag. Joshi & Hanssens (2010) stated that, there exists a long - term relationship between advertising spending and market capitalization. Dan et al (1984) explained, the effects on profitability that occur when a firm advertises increase significantly when the product is introduced and decreases advertising as the product moves through its life cycle and interpersonal communications take effect. Kamber (2002) found a measurable relationship between advertising expenditure and sales, even after controlling other factors, such as, company size and past sales growth, etc.
The above review divulges that there is some consensus on the economic impact of marketing cost and advertising & promotional costs on sales revenue and operating profit although some studies have shown diverse results. In such a context it is considered worthwhile to examine the situation as to the impact of marketing cost and advertising & promotional costs on sales revenue and operating profit of pharmaceutical industry in Bangladesh.
4. Objectives of the StudyThe present study has been designed to examine the impact of marketing cost, specially advertisement costs and promotion costs on sales and revenue of pharmaceutical industry in Bangladesh. In such a context the following were taken as the major objectives:
a. To identify the elements of marketing costs and the constituents of advertising & promotional costs and to point out the basic difference between these two sets.
b. To evaluate the extent to which the marketing costs and specially the advertising & promotional costs effect on sales revenue and operating profit.
c. To examine the growth pattern and trend of sales revenue and operating profit with marketing - advertising - promotional costs.
5. Methodology of the StudyThe study is mainly based on secondary data and information. Most of the organizational data and information have been collected from the annual reports of the respective sample companies. Along with, this information revealed in case studies, journal articles, books, newspapers, bulletins,

20 THE COST AND MANAGEMENTISSN 1817-5090, VOLUME-45, NUMBER-1, JANUARY-FEBRUARY 2017
8. Elements of Marketing Costs:In the context of study of marketing costs of the sample enterprises, first an attempt was made to identify the elements / items of marketing costs that are spend by the sample firms. In this regard the following items of marketing costs are found to have been incurred by the Pharmaceutical companies in Bangladesh:
Salaries, wages, bonus and welfare &allowances to relevant staff, Sales Deport Rent; Sales Promotion & Business Development; Carriage Outward; Mobile Bill; Postage; Motorcycle Maintenance; TA/DA; Utility; Contributions to retirement benefit scheme; Advertisement and sales promotion; Travelling & training; Physician samples; Professional books; Communications; Conference and seminar; Vehicle running expenses; Depreciation; Office expenses; Insurance; fees, charges and incentive; detailing bag & brief case; product development expenses; product pad & literature; market survey & research; delivery expenses; staff uniform; Telephone, Fax & Telex; Tiffin and Refreshment; Godown Rent; Head office & sales centers rent; Printing& stationery; Repairs & maintenance; building equipment repairs& maintenance; Water, electricity & gas; Filed forces conference expenses; Handling; freight and transport; Entertainment Staff welfare; Licence Fees; Field Staff Salaries, Packing Expenses Export Expenses; Special Discount; Sample Expenses; Security Services; Depreciation of Software; Hardware Support & VSAT; Other expenses, etc.
9. Advertisement and Promotion costs: Importance and Constituents
As to marketing products and enhancing sales, the role of advertising and sale promotion is found to be very significant. It is especially important to face competition, expand market share both for maintaining status and an enlarge the orbit of market share for sustaining and growth. Advertising is any form of non - personal presentation and promotion of ideas, goods, or services by an identified sponsor. An advertising objective is a specific communication task to be accomplished with a specific target audience during a specific period of time. Advertisement encompass activities relevant to suggesting new uses for a product, informing the market of a price change, describing available services and support, correcting false impressions, persuading customers to purchase now and to receive a sales call, convincing customers to tell others about the brand, reminding consumers
marketing communications managers or press officers, in addition to a marketing manager or director. It is further reported that hiring of freelance specialists or contract staff to handle specific projects, such as exhibitions, brochure design, copywriting, provides a lower cost alternative to employing full-time marketing specialists. However, if advertising agencies or public relations consultancies are hired to handle campaigns, this will incur agency fees.
As to advertising and promotion costs, companies with small advertising budgets may plan and manage campaigns internally, rather than using an agency. It requires paying the media owner for the space or time slot with discounts available for booking a series of advertisements or running advertisements in positions or time slots that are less popular. Large companies often resort to agency help and use their expertise, which of course requires large advertising expenditure.
Digital marketing has becoming popular now. Such marketing expenses include the internal or external costs of designing and managing the website together with the ongoing costs of developing and updating site contents.
Companies, especially small ones significantly emphasis on direct marketing. Direct marketing by mail or email is a cost-effective way to communicate with customers and prospective customers. One can compile mailing lists from internal sales and customer records or rent a database of prospects from a specialist company. Product leaflets, data sheets, corporate brochures and annual reports form an important part of a company's marketing communications program.
If a company offers seminars, webinars and workshops to the staff or customers, these are marketing expenses. Any travel, refreshments, materials and wages for presenters that to present seminars to potential customers qualify as marketing expenses. When one travels to meet clients or prospective clients, such travel expenses count as marketing expenses. The gifts to clients including promotional coupons are also be included in marketing costs to the effort.
Indirect marketing effort can be resorted with social efforts. For example, when a company sponsors a local sporting event, charity fundraiser or a local athlete or artist, this is a marketing expense. The cost of having a logo applied to sportswear, as well as any funding of an event's marketing efforts is included under this head.

21 THE COST AND MANAGEMENTISSN 1817-5090, VOLUME-45, NUMBER-1, JANUARY-FEBRUARY 2017
many a times accuse some marketing approach as harmful with regard to aggressive sales strategy and window dressing. The costs relevant to this, some of such costs are accused of increasing the greedy channel intermediary's mark up prices beyond the value of their service. Large pharmaceutical companies have too many intermediaries. Those intermediaries are either inefficient or they advocate for unnecessary or wrong products and services. Such distribution costs are many a times too much and consumers pay for these excessive costs in the form of higher price. Kotler (2010) gave an example about some medicine of pharmaceutical industry, where a pill costing Rs. 0.50 to make may cost the consumer Rs. 2 to Rs. 200 to buy. He asserted that consumers' senses are being constantly assaulted by marketing and advertising. Pharmaceutical firms sometimes undertake serious programs; pages of advertisements in obscure magazines; billboards mar beautiful scenery; spam fills our inboxes. These efforts continually pollute people's minds with message of materialism, power or status. In fact like all other business, pharmaceutical firms need to incur marketing cost specially undertaking advertisement / sales promotion costs. But what is required is to ensure ethics in marketing and sales promotion costs as pharmaceuticals are the enterprises which are engaged in peoples' health care sector. Here humanitarian approach and overall improvement of people's health and hygine are of utmost important. They have special responsibility which must not be ignored and that along with enterprises, government and concerned agencies have a role to play in this regard.
12. Financial Performance of Sample Firms vis - a - vis Marketing Costs and Advertisement and Promotional Costs:
Against the backdrop of the significance of marketing costs, especially advertisement and promotion costs, now an attempt is made below to evaluate performance of sample pharmaceutical firms with reference to marketing costs and sales / promotion costs.
At the set an attempt is made to depict average revenue, profit, marketing costs and advertisement costs of the sample firm. Table 1 below shows the picture:
where to buy the product and finally keeping the brand in customer's mind during off - seasons.
In this study, the following heads of advertisement & promotional costs have been segregated from marketing cost which is incurred by the Pharmaceutical companies in Bangladesh:
Printing and stationery expenses, marketing and promotional expenses, advertisement, delivery and packing expenses, special discount, sample expenses, books and periodicals, field force conference expenses, product pad and literature, communications, promotional allowance, physician's sample, Health Care Organization (HCO) support expenses, Health Care Professionals (HCP) expenses, Professional books, Training expenses, etc.
10. Significance of Measurement and Evaluation Marketing Cost and Advertisement & Promotional Cost
Marketing costs are considered as an expense under a profit and loss statement. But it is also an investment in supporting company's greatest asset concerned with production and brand. As such, it's important to measure the marketing expense against its return on investment. In other words, although marketing costs in fact can be called an expense for accounting purposes, a profitable marketing campaign that returns a net profit should be considered a practical investment and primary driver of immediate sales and revenues. All these requires evaluation of overall costs, it impact vis - a - vis impact of each element of costs towards achieving goals, role in sales revenue earning and overall impact on profit performance and growth of sales. This study makes an attempt towards this end.
11. Social impact of marketing cost and Advertisement & Promotional Cost in the context of Pharmaceutical firms in Bangladesh: A fantastic scenario
Consumers of pharmaceutical products hold mixed or even slightly unfavorable attitudes toward marketing practices and costs thereof. Consumers and some other concerned parties

22 THE COST AND MANAGEMENTISSN 1817-5090, VOLUME-45, NUMBER-1, JANUARY-FEBRUARY 2017
The above table shows that, the percentage of marketing cost of sample 1 of its revenue and operating profit are 18.67 and 227.41 respectively. And it also found that, the percentage of advertisement and promotional costs to its revenue and profit are 15.80 & 192.51 respectively. In case of sample 2, the percentage of marketing cost in terms of revenue and operating profit are 31.69 and 671.27respectively. And it also revealed that, the percentage of advertisement and promotional costs in terms of its revenue and operating profit are 3.31&70.21 respectively. On the other hand, the percentage of marketing cost of sample firm 3 of its revenue and operating profit are 15.52 and 71.56 respectively. Further, it also reveals that, the percentage of advertisement and promotional costs of its revenue and profit are 6.27 & 28.90 respectively. It also found that, the percentage of marketing cost of sample 4 of its revenue and operating profit are 8.99 and 26.15 respectively. And that the percentage of advertisement and promotional costs of its revenue and profit are 0.95 & 2.76 respectively. The table also shows that, the percentage of marketing cost of sample 4 of its revenue and operating profit are 1.89 and 10.00 respectively. And that, the percentage of advertisement and promotional costs of its revenue and profit are 0.66&03.50 respectively. It is revealed from an analysis of the table that, the sample firm 2 incurred more marketing cost in terms of revenue and operating profit than other sample firms and sample firm 1 and sample firm 2 invest a significant amount in marketing in terms of operating profit. The table also reveals that, sample firm 1 invests a significant amount in advertisement and sales promotion in terms of both revenue and operating profit than other sample firms.
Table - 1: Status of Financial Performance of Pharmaceutical Industry: context of Revenue and Operating Profit vis - a - vis Marketing and Advertisement Costs.
* Marketing cost means Selling and Distribution Expenses.
** Advertisement and Promotional costs are segregated from Selling and Distribution Expenses.
Against this backdrop of absolute figure as to revenue, profit, marketing and advertising costs an attempt is made to evaluate the picture as to share of marketing and advertising costs to revenue and profit. Table below exhibits the picture.
Table - 2: Average Revenue, Profit and Share of Marketing Costs and Advertisement and promotional cost thereof of Sample Enterprises:
(Figures in Million Taka)
Companies Year Revenue MarketingCost*
Advertisement &Promotional Cost*
OperatingProfit
� 2013� 6,775� 1,341� 1,112� 605� 2012� 5,554� 1,087� 876� 354� 2011� 4,735� 756� 709� 441�Average� 5,688� 1,062� 899� 467� 2013� 2,209� 702� 66� 115� 2012� 20,09� 634� 67� 87� 2011� 1,755� 558� 65� 79�Average� 1,991� 631� 66� 94� 2013� 19,435� 3,046� 1,185� 4,482� 2012� 17,007� 2,626� 1,061� 3,587� 2011� 14,763� 2,276� 964� 3,036�Average� 17,068� 2,649� 1,070� 3,702� 2013� 539� 43� 6� 208� 2012� 339� 33� 4� 112� 2011� 255� 26� 1� 70�Average� 378� 34� 3.6� 130� 2013� 112� 2� 0.6� 20� 2012� 103 3� 0.6� 18� 2011� 103� 2� 0.8� 23�Average� 106� 2� 0.7� 20
GlaxoSmithKlineBangladesh Ltd.
IbnSinaPharmaceuticals
Industry Ltd.
SquarePharmaceuticals
Ltd.
CentralPharmaceuticals
Ltd.
Pharma Aids Ltd.
Source : Annual Reports of respective companies.
(Figures in Million Taka)
Samplefirms
Revenue Operatingprofit
Marketing costs Advertising andpromotional costs
ToRevenue(%)
Tooperatingprofit (%)
ToRevenue(%)
Tooperatingprofit (%)
Sample 1� 5688� 467� 18.67� 227.41� 15.80� 192.51Sample 2� 1991� 94� 31.69� 671.27� 3.31� 70.21Sample 3� 17068� 3702� 15.52� 71.56� 6.27� 28.90Sample 4� 378� 130� 8.99� 26.15� 0.95� 2.76Sample 5� 106� 20� 1.89� 10.00� .66� 3.50
[Source: Annual Reports of sample firms. Computations have been made by author.]

23 THE COST AND MANAGEMENTISSN 1817-5090, VOLUME-45, NUMBER-1, JANUARY-FEBRUARY 2017
Ibn Sina Pharmaceuticals Industry Ltd will increase by Tk. (6250.2694 - 5,688) = Tk. 562.2694, and Tk. (3466.1818 - 1,991) = Tk. 1475.1818 (in million) respectively. It may positively influence the growth of pharmaceutical industry in Bangladesh. Secondly, estimated revenue of Square Pharmaceuticals Ltd is not largely depended on marketing. It may cause economy of scale of sales and very strong marketing channel. Thirdly, estimated revenues of Central Pharmaceuticals Ltd and Pharma Aids Ltd are negative. In this backdrop a regression analysis was restarted to the findings of regression analysis is shown below.
Table - 5: Regression and Correlation Analysis of Marketing Cost& Operating Profit
The above table revealed that, marketing cost and operating profit is strongly correlated. The relationship between marketing cost and revenue is high. This relationship also implies that, 94.48% of operating profit is affected by marketing cost and remaining 5.52% is affected by other factor.
In this context a further attempt was in this regard to show what would be the impact on operating profit, if sample enterprises spend same amount of marketing costs, the result is shown in the following table:
Table - 6: Estimated operating profit in terms of marketing costs
Evaluation of the Effect of Marketing Cost on Operating Profit:
It has been revealed that, the relationship between marketing cost and operating profit is significantly correlated (r = 0.9448). The slope of the regression equation is b = 1.3802. It indicates that,
Against this backdrop the correlation of marketing costs to revenue taking all the samples together has been evaluated. Table 3 below shows the picture.
Table - 3: Regression and Correlation Analysis of Marketing Cost & Revenue
The above table shows that, the revenue and marketing cost is highly correlated. The relationship between marketing cost and revenue is positively strong. This relationship also implies that, 98.99% of sales revenue is affected by marketing cost and remaining 1.01% is affected by other fact.
In this regard an attempt was made to show what would be position on revenue of companies if they spend same amount of marketing and advertisement costs. i. e. impact of marketing costs on revenue. Table below shows the picture.
Table - 4: Estimated Revenue in terms of marketing cost expenditure
Evaluation of the Impact of Marketing Cost on Revenue
The above findings as to impact on marketing and sales cost on revenue reveals that marketing costs and revenues are very highly correlated (r = 0.9899). The slope of the regression equation is b = 6.4596. It indicates that, if a company increases Tk. 1 in marketing cost, sales revenue will increase by Tk. 6.4596. As a result, we observed three different scenarios as to natures of dependence of revenue on marketing cost. Firstly, estimated revenues of GlaxoSmithKline Bangladesh Ltd. and IbnSina Pharmaceuticals Industry Ltd are largely depended on marketing cost. Because estimated revenue of GlaxoSmithKline Bangladesh Ltd. and
� 875.60� 5,046.2Constant of Regression Equation = a� - 609.8258Slope of Regression Equation = b� 6.4596Regression Equation� y = - 609.8258 + 6.4596xCoefficient of Correlation = r� 0.9899
� 875.600� 882.6000Constant of Regression Equation = a� - 325.9031Slope of Regression Equation = b� 1.3802Regression Equation� y =- 325.9031 + 1.3802xCoefficient of Correlation = r� 0.9448
Companies AverageMarketingCost (x)
AverageRevenue (y)
EstimatedRevenueY = a + bx
GlaxoSmithKline Bangladesh Ltd.� 1,062� 5,688� 6250.2694
IbnSina Pharmaceuticals Industry Ltd.� 631� 1,991� 3466.1818
Square Pharmaceuticals Ltd. � 2,649� 17,068�16,501.6546
Central Pharmaceuticals Ltd. � 34� 378� - 390.20
Pharma Aids Ltd. � 2� 106� - 596.91
Companies AverageMarketingCost (x)
AverageRevenue (y)
EstimatedOperatingProfitY = a + bx
GlaxoSmithKline Bangladesh Ltd. � 1,062� 467�1,139.8693
IbnSina Pharmaceuticals Industry Ltd.� 631� 94� 545.0031
Square Pharmaceuticals Ltd. � 2,649� 3,702� 3,330.2467
Central Pharmaceuticals Ltd. � 34� 130� - 278.9763
Pharma Aids Ltd. � 2� 20� - 323.1427

24 THE COST AND MANAGEMENTISSN 1817-5090, VOLUME-45, NUMBER-1, JANUARY-FEBRUARY 2017
Table - 8: Schedule showing if the selected five companies incurred the same amount on Advertisement & Promotional in the subsequent year, the estimated sales revenue will be:
Influence of Advertisement and Promotional Cost on Revenue
The above table reveals that, the relationship between advertisement & promotional cost and revenues is strongly correlated (r = 0.8632). The slope of the regression equation is b = 11.7421. It indicates that, if a company increases in Tk. 1 in advertisement & promotional cost, the sales revenue will increase by Tk. 11.7421. As a result, three types of dependence of revenue on advertisement & promotional cost are observed. Firstly, estimated revenue of GlaxoSmithKline Bangladesh Ltd is largely depended on advertisement & promotional costs. Because estimated revenue of GlaxoSmithKline Bangladesh Ltd. will increase by Tk. (10,813.2149 - 5,688) = Tk. 5,125.2149 (in million) as a direct influence of this cost. It is also seen that, this change will occur by 90.105%. Secondly, estimated revenues of IbnSina Pharmaceuticals Industry Ltd and Square Pharmaceuticals Ltd are not largely depended on advertisement & promotional cost. Basically, advertisement of pharmaceuticals industry is not found in the electronic and print media. Its advertisement basically depends on frequent visits of sales representatives to the hospitals, clinics and practicing doctors. Thirdly, estimated revenue of Central Pharmaceuticals Ltd and Pharma Aids Ltd are observed to be negative. Newly setup cost of advertisement & promotional channels and fixed advertisement & promotional cost incurred at the moment are known to be the principal causes for this situation.
In this connection regression analysis was resorted to. Follow table show the picture.
if a company increases Tk. 1 in marketing cost, operating profit will increase by Tk. 1.3802. As a result, three types of dependence of operating profit on marketing cost have been observed among the sample units. Firstly, estimated operating profits of GlaxoSmithKline Bangladesh Ltd. and IbnSina Pharmaceuticals Industry Ltd are found to largely depend on marketing cost. Because estimated revenues of them may increase by Tk. (1,139.8693 - 467) = Tk. 672.8693, and Tk. (545.0031 - 94) = Tk. 451.0031 (in million) respectively. The estimated change will be 144.08%, and 479.79% respectively. It may be a cause of substantial growth of pharmaceuticals industry in Bangladesh. Secondly, estimated operating profit of Square Pharmaceuticals Ltd is not largely depended on marketing cost. The root causes may be the operation of economy of scale of sales and presence of a very strong marketing channel. Thirdly, estimated operating profit of Central Pharmaceuticals Ltd and Pharma Aids Ltd are known to be negative. The reasonable cause may be newly setup marketing channel and large amount of fixed marketing cost incurred at that time.
Against this backdrop of evaluation of marketing cost with reference to revenue and profit, now an attempt is made to evaluate advertisement and promotion costs in the same angle. In this context table below shows evaluation results thereof.
Table - 7: Regression and Correlation Analysis of advertisement & promotional cost and Revenue
The above table reveals that, advertisement & promotional cost and revenue is strongly correlated. The relationship between advertisement & promotional cost and revenue is high. This relationship also implies that, 86.32% of revenue is affected by advertisement & promotional cost and remaining 13.68% is affected by other factor.
Against this backdrop attempt is made below to evaluate the impact of advertisement and promotional cost of revenue keeping the cost as it is.
� 407.86� 5,046.2Constant of Regression Equation = a� 257.0670Slope of Regression Equation = b� 11.7421Regression Equation� y = 257.0670 + 11.7421xCoefficient of Correlation = r� 0.8632
Companies AverageAdvertisementand PromotionalCost (x)
AverageRevenue(y)
EstimatedRevenueY = a + bx
GlaxoSmithKline Bangladesh Ltd.� 899� 5,688�10,813.2149
IbnSinaPharmaceuticals Industry Ltd.� 66� 1,991� 1,032.0456
Square Pharmaceuticals Ltd.� 1,070� 17,068�12,821.1140
Central Pharmaceuticals Ltd. � 3.6� 378� 299.3386
Pharma Aids Ltd. � 0.7� 106� 265.2865

25 THE COST AND MANAGEMENTISSN 1817-5090, VOLUME-45, NUMBER-1, JANUARY-FEBRUARY 2017
GlaxoSmithKline Bangladesh Ltd. is largely depended on advertisement & promotional cost. Because estimated operating profit of GlaxoSmithKline Bangladesh Ltd. will increase by Tk. (2,011.6326 - 467) = Tk. 1,544.6326 (in million). It is also seen that, the change will occur by 330.75%. Secondly, estimated operating profit of IbnSina Pharmaceuticals Industry Ltd is insignificantly depended on advertisement & promotional cost. The estimated operating profit of IbnSina Pharmaceuticals Industry Ltd will increase by Tk. (96.7322 - 94) = Tk. 2.7322 (in million). It is also seen that change will occur by only 2.91 %. Thirdly, estimated operating profit of Square Pharmaceuticals Ltd is not largely depended on advertisement & promotional cost. The basic cause of this is the presence of large distribution channel. As a result, it regularly incurred huge fixed cost. Fourthly, estimated operating profits of Central Pharmaceuticals Ltd and Pharma Aids Ltd are known to be negative. It may be due to newly setup marketing channel and fixed advertisement & promotional cost incurred at that time.
13. Evaluation of the FindingsIn this study, the relationship between marketing cost and revenue and marketing cost and operating profit are found to be very high, which are 0.9899 and 0.9448 respectively. The relationship between advertisement & promotional cost and revenue and advertisement and promotional cost and operating profit are also found very high, which are 0.8632 and 0.7692 respectively. The dependence of sales revenues and operating profit of pharmaceuticals industry on marketing cost is represented by b = 6.4596 and b = 1.3802 respectively. It means that, if pharmaceuticals companies spend additional one taka on marketing cost, the company will generate revenue of Tk. 6.4596 and operating profit of Tk. 1.3802 respectively. And dependence of sales revenues and operating profit of pharmaceuticals industry on advertisement and promotional cost are shown by b = 11.7421, b = 2.2988 respectively. It also means that, if pharmaceuticals companies incur additional one taka on advertisement& promotional cost, they will generate revenue of Tk. 11.7421 and operating profit of Tk. 2.2988 respectively. Upon verification of the above data it seen that, pharmaceuticals companies generate more revenue and operating profit through spending on advertisement & promotional cost. Because, the positive change in revenue on advertisement & promotional cost (11.7421) is greater than revenue on marketing cost (6.4596).
Table - 9: Regression and Correlation Analysis of advertisement & promotional cost and Operating Profit
It is found from the above table that, advertisement & promotional cost and operating profit is strongly correlated. The relationship between advertisement & promotional cost and operating profit is high. This relationship also implies that, 76.92% of operating profit is affected by advertisement & promotional cost and remaining 23.08% is affected by other factor.In this context, an attempt was made to evaluate estimate operating profit of sample farms on advertisement and promotional costs in same level with reference to five select samples. Table below shows the picture.
Table - 10: Schedule showing if the selected five companies incurred the same amount on Advertisement & Promotional cost in the subsequent year, the estimated Operating Profit will be:
Influence of Advertisement and Promotional Cost relating to Operating Profit:
It is revealed from the table that, the relationship between advertisement & promotional cost and operating profit is moderately correlated (r = 0.7692).which is less than such coefficient of correlation as found in case of marketing cost. The slope of the regression equation is, b = 2.2988. It indicates that, if a company increases Tk. 1 in advertisement & promotional cost, operating profit will increase by Tk. 2.2988. As a result, four types of dependence of operating profit on advertisement & promotional cost have been observed. Firstly, estimated operating profit of
� 407.8600� 882.6000Constant of Regression Equation = a� - 54.9886Slope of Regression Equation = b� 2.2988Regression Equation� y = - 54.9886 + 2.2988xCoefficient of Correlation = r� 0.7692
Companies AverageAdvertisementand PromotionalCost (x)
AverageOperatingProfit (y)
EstimatedOperatingProfitY = a + bx
GlaxoSmithKline Bangladesh Ltd. � 8,99� 467�2011.6326
IbnSina Pharmaceuticals Industry Ltd.� 66� 94� 96.7322
Square Pharmaceuticals Ltd. � 1,070� 3,702�2,404.7274
Central Pharmaceuticals Ltd. � 3.6� 130� - 46.7192
Pharma Aids Ltd. � 0.7� 20� - 53.3794

Marketing costs are an important consideration for all businesses because marketing is a primary business function that creates a customer for the business. It includes employee costs, agency fees, advertising, digital marketing, direct marketing, publications, sponsorships, seminars, business travel, gifts to clients, etc.
MMMMaaaarrrrkkkkekekeeettttiiiinnnngggg ccccoooossssttttssssaaaarrrreeee aaaannnn iiiimmmmppppoooorrrrttttaaaannnnttttccccoooonnnnssssiiiiddddeeeerrrraaaattttiiiioooonnnn ffffofofooofofofoffffoffffofffofofofffof rrrraaaallllllll bbbbuuuussssiiiinnnneeeesssssssseeeessssbbbbeeeeccccaaaauuuusssseeeemmmmaaaarrrrkkkkekekeeettttiiiinnnngggg iiiissss aaaapppprrrriiiimmmmaaaarrrryyyy bbbbuuuussssiiiinnnneeeessssssssffffufufuuufufufuffffufff nnnnccccttttiiiioooonnnn tttthththhhthththtthtttthttt aaaattttccccrrrreeeeaaaatttteeeessss aaaaccccuuuussssttttoooommmmeeeerrrr ffffofofooofofofoffffoffffofffofofofffof rrrr tttthththhhthththtthtttthttt eeeebbbbuuuussssiiiinnnneeeessssssss.... IIIIttttiiiinnnncccclllluuuuddddeeeessss eeeemmmmppppllllooooyyyyeyeyeeeeeeeccccoooossssttttssss,,,, aaaaggggeeeennnnccccyyyy ffffefefeeefefefeffffeffffefffefefefffef eeeessss,,,,aaaaddddvdvdvvveveveeerrrrttttiiiissssiiiinnnngggg,,,,ddddiiiiggggiiiittttaaaallll mmmmaaaarrrrkkkkekekeeettttiiiinnnngggg,,,,ddddiiiirrrreeeecccctttt mmmmaaaarrrrkkkkekekeeettttiiiinnnngggg,,,,ppppuuuubububbblllliiiiccccaaaattttiiiioooonnnnssss,,,,ssssppppoooonnnnssssoooorrrrsssshhhhiiiippppssss,,,,sssseeeemmmmiiiinnnnaaaarrrrssss,,,,bbbbuuuussssiiiinnnneeeessssssss ttttrrrraaaavavavvvavavavaavaaaavaaa eveveeellll,,,,ggggiiiifffftftftttftftftfffftfff ssss ttttoooo cccclllliiiieeeennnnttttssss,,,,eeeettttcccc....
26 THE COST AND MANAGEMENTISSN 1817-5090, VOLUME-45, NUMBER-1, JANUARY-FEBRUARY 2017
This change (5.2825) in revenue can be attributable significantly to advertisement & promotional cost as its role is greater than that of marketing cost. And the change in operating profit due to advertisement and promotional cost (2.2988) is greater than operating profit on marketing cost (1.3802). This change (0.9186) in operating profit is attributable significantly to advertisement & promotional cost whose contribution is greater than that of marketing cost.
14. ConclusionThe marketing costs, which are incurred for persuasive communication that attempts to change or reinforce ones' prior attitude and are basically done not only to inform customers about products, rather than as a process to ease the availability of products, enhancing further to influence and persuades customers to purchase the product. All such related costs are called marketing costs and advertisement & promotional costs. The study is based on secondary data collected with reference to the marketing costs and advertisement & promotional costs and sales revenue and operating profit of 5 listed large and nation - wide marketing operational pharmaceuticals companies working in Bangladesh. The data and related information have been collected from annual reports and available other related information as available in their respective websites of pharmaceuticals companies. From the evaluation of the findings of the study, it is seen that, if the pharmaceutical industry incurs Tk. 1 more on marketing cost it may generate Tk. 6.4596 more of revenue and Tk. 1.3802 more of operating profit. And if the pharmaceutical industry incurs Tk. 1 more on advertisement & promotional cost, it may generate Tk. 11.7421 more of revenue and Tk. 2.2988 more of operating profit. It is also ascertained that, the pharmaceutical companies will be benefited by incurring Tk. 1 in advertisement & promotional cost than in marketing cost by Tk. 5.2825 in revenue and Tk. 0.9186 in operating profit. Through this process the Pharmaceutical industry has greatly improved their operation and strength in Bangladesh and such scope remain much for future. But the crux of the problem is that though it has favorable scenario, the interest of consumer is found neglected. Many people of Bangladesh cannot reach even some inexpensive pharmaceuticals and products of companies for comparatively high price, flaws relevant to little R & D facilities and distribution along with cost efficiency. Access to existing products could be improved by cost reduction along with facilitating

27 THE COST AND MANAGEMENTISSN 1817-5090, VOLUME-45, NUMBER-1, JANUARY-FEBRUARY 2017
differential pricing. It is even found that under conditions of rapidly changing demand in pharmaceuticals products, price-caps could be manipulated by using simulations. For example - a few dozen tablets of a heavily promoted brand of pain reliever sell for the same price as 100 tablets of less - promoted brand. It usually occurs for rural less educated consumers. Some educated rural consumers also face medicine problem due to lack of availability of required medicine. Sales representative of pharmaceuticals companies are reported under pressure from companies for enhancing sale through persuades people or doctors to buy or prescribe the medicine through different unethical means. Poor and disadvantaged rural consumers are also need to pay more prices for medicine due to long marketing distribution channel and some unnecessary distribution costs. In the context of public interest and social responsibility consideration specifically the pharmaceutical companies need to consider the purchasing power of lower - income consumer at the time of pricing. This warrant attempts and cut off and reduces some unnecessary advertisement & promotional cost such as physician sample, gift to doctor & clinic, etc.
References
Annual Report of GlaxoSmithKline Bangladesh Ltd.(2014). Annual Report 2013. Retrieved www. Gsk.com.bd
Annual Report of GlaxoSmithKline Bangladesh Ltd. (2013). Annual Report 2012. Retrieved from www.Gsk.com.bd
Annual Report of IbnSina Pharmaceuticals Industry Ltd. (2014). Annual Report 2013. Retrieved from www.Ibnsinapharma.com
Annual Report of IbnSina Pharmaceuticals Industry Ltd. (2013). Annual Report 2012. Retrieved from www.Ibnsinapharma.com
Annual Report of Pharma Aids Ltd. (2014). Annual Report 2013 - 2014. Retrieved from www.pharmaaids.com
Annual Report of Pharma Aids Ltd.(2013). Annual Report 2012 - 2013. Retrieved from www.pharmaaids.com
Annual Report of Pharma Aids Ltd. (2012). Annual Report 2011 - 2012. Retrieved from www.pharmaaids.com
Annual Report of Square Pharmaceuticals Ltd. (2014). Annual Report 2013 - 2014. Retrieved from www.squarepharma.com.bd
Annual Report of Square Pharmaceuticals Ltd. (2013). Annual Report 2012 - 2013. Retrieved from www. squarepharma.com.bd
Annual Report of Square Pharmaceuticals Ltd. (2012). Annual Report 2011 - 2012. Retrieved from www. squarepharma.com.bd
Auditor's Report of Central Pharmaceuticals Ltd. (2014). Auditor's Report 2013 - 2014. Retrieved from www. cerntralphl.com
Auditor's Report of Central Pharmaceuticals Ltd. (2013). Auditor's Report 2012 - 2013. Retrieved from www.cerntralphl.com
Auditor's Report of Central Pharmaceuticals Ltd. (2012). Auditor's Report 2011 - 2012. Retrieved from www.cerntralphl.com
Dan H., Leonard S. S. (1984).Advertising and the Diffusion of New Products. Journal of Marketing Science(2).pp.- 1-17.
Elliot, C. (2001)."A Cointegration Analysis of Advertisement and Sales Data". Review of Industrial Organization. Vol. 18.pp.417-26.
Harvey, Mary, Innocent, Matthew (2012).Financial Ratio Analysis as a Determinant of Profitability in Nigerian Pharmaceutical Industry. Canadian Centre of Science and Education.
Engel, P. (1996).Budgeting and Finance (First Books for Business).McGraw-Hill.
Joshi A., Hanssens D.M. (2010). The Direct and Indirect Effects of Advertising Spending on Firm Value. Journal of Marketing.Vol. 74, pp. 20 - 32.
Kamber, T. (2002). "The Brand Managers Dilemma: Understanding How Advertising Expenditures Affect Sales growth during the recession". The Journal of Brand Management.Vol.10 (2).pp.106-120.
Kotler P., Armstrong G., Agnihotri P. Y., Haque E. U. (Edition 13). (2010). Principles of Marketing.P. 365. pp. 494 - 501.
Kremer M. (2002). "Pharmaceuticals and the Developing World" American Economic Association. The Journal of Economic Perspectives. 16. Number 4. pp. 67- 90(24)
Morgenson, C. R. (2011).Dictionary of Money and Investing. The New York Times.
Nimalathasan, B. (2009).Profitability of Listed Pharmaceutical Companies in Bangladesh: an Inter and Intra Comparison of AMBEE and IbnSina Companies Ltd.
Pagan J., Sethi, S. and Soydemir, G.A. (2001). "The Impact of Promotion/Advertising Expenditures on Citrus Sales". Applied Economic Letters, Vol.8 (10), pp.659-63.
Raval, D. S. (2006).Analysis of Profitability in Pharmaceutical Industry. Saurastra University.
Scott B. M., Richard J. L. (1989). An Empirical Examination of the Structural Antecedents of Attitude-towards-the-Ad in an Advertising Pretesting Context. Journal of Marketing (53). PP. 48-65.
Shawon S. A. (2011). Research Report: Pharmaceuticals Industry of Bangladesh. IDLC Finance Limited.
Verdon, Walter A., Campell, McConeell R., Theodore, Roester W. (1968). "Advertising Expenditures as an Economic Stabilizer: 1945-64".Quarterly Review of Economics and Business. (spring). pp. 7-18.

28 THE COST AND MANAGEMENTISSN 1817-5090, VOLUME-45, NUMBER-1, JANUARY-FEBRUARY 2017
Muhammad Anisur RahmanSenior Assistant Secretary
Finance Division, Ministry of Finance, [email protected]
A study on legal framework andinstitutional preparedness in Bangladesh
Abstract
This paper attempts to look into E-waste management scenario in Bangladesh. It studies the existing institutional preparedness and legal framework in the context of ever- increasing volume of E-waste in the country. Against this backdrop, the role of different stakeholders in the field of E-waste management, with the particular focus on mobile phone, laptop, PC and television wastes. A significant shortage of policy instruments in the field of E-waste management has been felt very deeply. In addition, the concerned organizations are not prepared at all to manage the ever-growing E-waste in Bangladesh. Due to the absence of legal framework and institutional preparedness, some private profit making organizations are treating E-waste in an unscientific way causing further severe damage to the environment and human health.The study found that for E-waste management though there are some policy frameworks in place, but no specific rules as such in operation. In 2011, Ministry of Environment and Forest (MoEF) and Department of Environment (DoE) had taken initiative to formulate E-waste management rules which is yet to see the light. Currently, MoEF and DoE has started to prepare guidelines for E-waste management. The study suggests that the enforcement capacities of institutions / agencies concerned are weak. However, for solid waste management it is found that existing policy and supplementary rules are supportive. By and large, the existing policies,rules, regulation, except ICT policy 2015 Act, in general, are supportive and complementary to solid waste management. Instructive, trained and skilled personnel on E-waste management and clarity with regard to the environmental hazards are found to be inadequate in such governmental agencies concerned. As no specific e-waste management policy, act, rules exist no e-waste management infrastructure and institutional capacity have been developed yet. The study therefore strongly argues that there is an urgent need for designing an e-waste management policy.
Keywords: E-waste, institutional capacity, institutional preparedness, legal framework.
E-wastemanagement:

29 THE COST AND MANAGEMENTISSN 1817-5090, VOLUME-45, NUMBER-1, JANUARY-FEBRUARY 2017
2003). Rapid socio-economic growth and technological advancement are the main operators of this trend. This has turned out to be a challenging issue, especially, for the developing countries, as they do not have safe technology to manage. The developing countries have turned out as the global dumping grounds of E-wastes.
E-wastes are very hazardous to human and environment. A long exposure to E-waste can cause many life taking diseases. However, developing countries for cheap labor has taken the market of E-waste recycling as an opportunity of flourishing economic activities.
Bangladesh for its development policy is gradually more inclined to using information and communication technology. Besides this, with the development of the economic activities coupled with easy access of electronic gadgets, appliances and equipment at the low price, the uses of electronic and electrical products are being used more frequently. This trend is conspicuous to the young generation of the country, who belong to the largest share of the country's population.
The volume of E-waste is increasing exponentially, with a global annual growth rate of 4 percent, due to the fast technological development and ever-shortening product lifespans (Lundgren, 2012). Table 1.1 presents the life span and weight of electronic goods.
Table 1.1: Lifespan and weight of electronic equipment
Data Source: a. K. Betts (2008), b. M. Cobbing (2008),c. J. H. Li at all(2009),
Table 1.2 shows the volume of E-waste in Dhaka. The study was conducted by a Japanese company 'Re-team Corporation' with the assistance of Waste Concern Consultants in mid of 2015.
1. Introduction:1.1E-waste:E-waste is defined as all types of electrical and electronic equipment (EEE), and its portions that have been discarded by its holder as waste without the intent of re-use. In the study of Global E-waste Monitor it has been classified as discarded Electrical and Electronic Equipment divided into the following six categories: a. Temperature exchange equipment (cooling and freezing equipment), b. Screen Monitors (televisions, monitors), c. Lamps (fluorescent, LED lamps), d. Large Equipment (washing machines, dish washing machines), e. Small Equipment (vacuum cleaners, microwaves), f. Small IT and Telecommunication Equipment (mobile phones). E-waste contains various materials including hazardous metals like heavy metals (mercury, lead) and chemicals (chlorofluorocarbon, flame retardants). E-waste also contains valuable materials (copper, iron) and precious metals (gold, silver). (Bladé C.P., Wang, F., Kuehr, R., Huisman, 2015). E-waste may comprise around 60 metals (Resources and Technology Transfer Industrial Sector Studies 2009).
1.2. Statement of the problem
E-waste has been recognized as the fastest growing waste stream across the globe at present (Nnorom and Osibanjo 2008, Jain 2008, Cui and Forssberg
� Item� Mass of Item � Estimated life � � (kg)� (years)
Desktop Computer a� 25� 2-4
�Laptop computer� 2.15� 2-3
� Cell phone b� 0.1� 1-3
� Television c� 30� 5-13
Raw MaterialInput
EEEProduction Re
use
WEEEGeneration
WEEETreatment
New Product/WEEE Residues
WEEEDisposal
Landfill
EEEProduction
EEESalesEEE
Sales
EEGeneration
WEE
WEEETreatment
WEEE
WEEEDisposal
EEEConsumption
Figure 1.1: Life Cycle of Electrical and Electronic product (Source: UNEP 2007)

30 THE COST AND MANAGEMENTISSN 1817-5090, VOLUME-45, NUMBER-1, JANUARY-FEBRUARY 2017
institutions scholar having stake in E-waste management.
Case study: LGIs mainly perform the responsibility of waste management in rural and urban areas. 5 cases studies have been performed on the LGIs working in the city and rural areas. The LGIs in the cities are: Dhaka South City Corporation, Dhaka North City Corporation and Chittagong City Corporation. The institutions have been chosen by considering number of population, likelihood of ICT use by the citizens. Besides, two LGIs in the rural areas (Sultanganj Union Parishad and Kishoreganj Sadar Pauroshava) have been randomly selected to draw the scenario of E-waste management in the rural areas.
2. Findings and Discussion
2.1 Institutional preparedness forE-waste management
2.1.1 Institutional infrastructure:
Environment is a cross-sectoral issue. Various ministries and departments are working on policy and implementation level in this regard. Besides, as a key implementing body, the role of different local government institutions has been identified namely City Corporation, Pauroshova and Union Parishad. In addition, 15 Cantonment Boards and Chittagong Hill Tracts Development Board work in their respective area for waste management.
Policy formulation bodies: The Ministry Of Environment and Forest (MoEF)
According to Allocation of Business, 1996 (Amendment 2014) Ministry of Environment and Forest (MoEF) is mandated with planning, promoting,
Table: 1.2 Electronic item consumptions and e-wastes for Dhaka
Source: Report on follow-up research, Re-Team Corporation and Waste Concern Consultants, 2015
1.3 ObjectivesThe core objective of this research is to explore the role of stakeholders in E-waste management in Bangladesh. The study has a fourfold objective. Those are:
I. Examining the present status of E-waste management system in Bangladesh,
II. Identifying the legal framework and institutional preparedness of E-waste management in Bangladesh,
III. Understanding the roles of various stakeholders involved in sustainable E-waste management and
IV. Finding out the barriers of E-waste management in Bangladesh
The focus of the study is limited to four electronic products: desktop PC, laptop PC, cell phones and television. These four items are assumed to be the most frequently used electronic items in Bangladesh.
1.4 Methodology:The research uses qualitative data analysis methodology. The techniques applied in the study are Key Informant Interview, content analysis and observation.
Area of field study: Dhaka and Chittagong Metropolitan cities offer more employment opportunities and higher income levels, which leads to migration of population from different parts of the country to it. These two cities are likely to be the largest E-waste generating city in Bangladesh. For this reason, these areas have been selected as the study area of the project. In addition to that, two rural LGIs(Local Government Institution) have been studied after selecting on random basis.
Content analysis: For developing a concrete idea on the existing institutional preparedness and legal framework in the field of E-waste management, a total of 25 relevant documents have been analyzed. The literature includes policy documents of the government, industrial reports, reports and analysis of media, reports of different private business institutes involved in E-waste recycling process, reports of different international bodies and research articles.
Key Informant Interview: 12 numbers of semi-structured interviews were taken to substantiate the existing information on E-waste. Key informants were selected from government agencies, private business organization, non-government organization, trade bodies and academic
Sl. No. Item Name Dhaka Statistical Metropolitan Area (DSMA) Bangladesh
ConsumptionIn Dhaka(Piece/Year)(2009)
ConsumptionIn Dhaka(Piece/Year)(2014)(Base Year)
ConsumptionIn Dhaka(Piece/Year)(2020)
E-wasteGenerated inDSMA(Piece/Year)(2014)
SecondaryInformation onConsumptionIn Bangladesh(Piece/Year)(2014)
2.88 million(considering growth of 20%)
Mobile1 7.16 million 21.37 million (consideringgrowth of 20%)
1.32 million 18.00 million
0.24 million(consideringgrowth of 10%)
Computer2 0.39 million 0.68 million (considering growth of 10%)
0.10 million 0.30 million
0.39 million (consideringgrowth of 20%)
Television3 0.97 million 2.90 million (consideringgrowth of 20%)
0.07 million 1.20 million

31 THE COST AND MANAGEMENTISSN 1817-5090, VOLUME-45, NUMBER-1, JANUARY-FEBRUARY 2017
The research studied 3 city corporations, namely Dhaka North City Corporation, Dhaka South City Corporation and Chittagong City Corporation. The assumption is that these three city corporations are home to the top three e-product users in the country. It has also studied a paurahava-Kishoreganj Sadar Paurashava and a union parisad-Sultangong Union Parishad to investigate into the condition of E-waste management in the rural areas.
Two city corporations of Dhaka cityMost of the E-waste dumping and storage sites of Dhaka city are located in Dhaka South City Corporation (DSCC). The specific areas of DSCC are Nimtali, Kamrangirchr, Islampur, Dholaikhal and Jinjira. On the other hand, the e-equipment dismantling areas of DNCC are Mohmmadpur and Mirpur and Elephant road, etc. The shops in these areas buy electronic products in bulks by auction and from the hawkers.
However, most of these business organizations dismantle the discarded e-products in informal means. The business organizations following informal means of recycling use very simple tools like screwdriver, pliers to dismantle different parts of the equipment. The efficiency of recycling and recovery of different useful elements by informal techniques is very low.
The waste management departments of the city corporations collect solid waste from domestic, business, hospital, street, public toilets and drains. The corporation provides dustbins and other receptacles for accumulating the waste. Besides, the cleaners clean the roads, drains and sewerage lines. They also collect and transport medical waste and landfill the waste. However, it is observed that DNCC and DSCC have not developed any infrastructure for separate collection of E-wastes.
Chittagong City Corporation (CCC)The conservancy department of CCC is mandated with the responsibility of cleaning. There are a good number of cleaning workers as well as waste carriage vans and different instruments for cleaning drainage systems, roads and clearing off the daily accumulated wastage.
A huge quantity of E-waste is produced in Chittagong for the existence of ship breaking industry. The key areas of discarded E-waste storage are Vatiary, Ice factory road, Kadamtali, CDA Market, etc. The business organizations of discarded e-products in these areas follow informal means of dismantling. However, still no system has been developed in the corporation for managing special waste like e-waste.
coordinating and overseeing the environmental issues in various sector of the country. MoEF cooperates with other ministries for clarifying the issues related to environmental pollution and provides with expert opinion so that, no development program of the government can overlook the stake and interest of environment.
Department Of Environment (DoE)
The Department of Environment (DoE) is the technical arm of the MoEF. The mandate of the DoE includes assessment and monitoring of tasks such as on-site surveillance of environmental improvement components of development projects; promoting environmental awareness through public information program; controlling and monitoring in pollution; environmental impact assessment, and in formulating guidelines for the line agencies.
DoE can declare any ecosystem as Ecologically Critical Area (ECA).Till date 13 ECAs have been declared. However, it has been found that, the management issues of the declared ECAs have not been resolved. Furthermore, DoE shows inability to consistently respond to its complaints. However, the inabilities are largely manifested by field resources.
Bangladesh Atomic Energy Regulatory Authority (BAERA): This institution provides license, permissions, No Objection Certificate (NOC) on radioactive substance and renders training on running radioactive instruments. The study found that if scrap metals do not contain radioactive elements, NOC is issued by following Bangladesh Atomic Energy Regulatory Act, 2012 from Bangladesh Atomic Energy Regulatory Authority. If radiation generation equipment contains radioactive within tolerance level or permissible limit, NOC is also issued by following provisions of Nuclear Safety and Radiation Control Act, 1993 and Nuclear Safety and Radiation Control Rules, 1997 from the same institution for E-waste management.
Bangladesh Telecommunication Regulatory Commission (BTRC): BTRC provides permission for recycling obsolete telecommunication equipment following the framework provided by Telecommunication Act, 2001 (Amendment, 2010). But there are other conditions to be complied including permission from DoE, following import and export policy of the government.
Service providing agencies: By and large, City Corporations, Pourasavas, Union Parishads and Cantonment Executive Boards are responsible for managing waste in their respective jurisdiction. The role of Local Government Institutions (LGIs) is very important in the institutional framework from the standpoint of providing services to the people.

32 THE COST AND MANAGEMENTISSN 1817-5090, VOLUME-45, NUMBER-1, JANUARY-FEBRUARY 2017
government is not strong enough. There is shortage of institutional capacity in other ministries and departments on the issue of environmental protection. Furthermore, there is scarcity of baseline data on environmental resources and areas environmental concern. In addition, the MoEF itself lacks skill, equipment and other logistics support for assessing and monitoring the impact on environment.
Private initiative: It is observed that there is mushrooming private entrepreneur managing e-waste in a rudimentary way in different part of the city. They collect, transport, segregate, dismantle and rest of them are sent to waste stream. They extract metals through incineration or by using raw process. They have lack of sound technology to manage e-waste. In this way they create environmental pollution. As there are no rules / guidelines regarding e-waste management, it adds more pollution to the environment then managing of e-waste.
2.2 Legal framework:In this part of the paper all the regulatory frameworks in regards with E-waste management are studied. This part of the study is done on the basis of content analysis. The findings are summarized below.
Key Policies and Laws of E-waste Management: The following policy instruments that shoulder the key issues of environment are discussed below.
Kishorgonj Sadar Paurashava: Kishorgonj Sadar Pourashava is located in the heart of the Kishoregon District. The paurashava handles local solid waste through collection, transportation and disposal from dustbin to landfill by garbage truck/hand trolley. 20 cleaners collect wastes daily from 6 am to 10am. There is designated land filling site in Jelkhanamoore for dumping waste. However, the paurashava has no system for collecting E-waste and its disposal.
Sultanganj Union Parishad: Sultanganj Union Parishad is situated in the western part of Dhaka district under Karenigonj upzila. The Clause 19 of the Local Govt. (Union Parishad) Act, 2009 instructs that union parishad will ensure collection, elimination and management of waste. However it is found during the study, Sultanganj Union Parishad does not have any arrangement for waste management in reality, let alone E-waste management.
Cantonment Executive Board, Ghatail: In the cantonment area, Cantonment Executive Board works for civil population and provides services to them. Cantonment Executive Board acts as local govt. institution like Municipality or City Corporation. The Cantonment Executive Board in Ghatail provides different civic services to the local people. But, the board does not provide any sorts of service regarding managing E-waste separately.
2.1.2 Institutional capacity:Monitoring, evaluation and enforcement: The Environmental Conservation Act 1995 (ECA), Environment Conservation Rules 1997 (ECR), and Environment Court Act 2000 outline the environmental regulatory regime to establish environmental administration in Bangladesh and give DoE mandate for their enforcement. In line with these acts and rules the DoE has published Inspection and Enforcement Manual -2008.
A Conservancy Inspector is assigned for each ward to look after the waste management in the local government institution. However, the study reveals that there were no budget allocations for developing E-waste infrastructure like training, technological knowledge etc. Besides, LGIs have no collection center or designated place with temporary storage facilities of E-waste.
Lack of resources and capacity: It is observed that LGIs do not have adequate rules, technical capacity and the capability to implement and enforce the disposal of E-waste separately. These pose serious constraints to the ability of local officials to make a sustainable impact on environmental issues.
Lack of regulatory and institutional capacity: Coordination between MoEF and different departments under it and other stakeholder in the
Sl. LegalInstrument
Key features encompassingE-waste management
Constitution Article 18A of the constitution of Bangladesh narrates that : "[t]he State shall endeavor to protect and improve the environment and to preserve and safeguard the natural resources, bio-diversity, wetlands, forests and wild lives for the present and future citizens".
1.
The Seventh Five Year Plan (2016-2020)
In the sub-section of internal environment management, the Seventh Five Year Plan has given impetus on preparing a guideline of e-wastes based on a baseline survey.
In addition to that the plan proposes some activities for E-waste management. Taking cognizance of the nature and scale of E-waste problem in the country, the plan suggests the following programs.
1. Initiating assessment / studies to understand the nature and magnitude of E-waste nationwide and developing an Action Plan accordingly.
2. Undertaking measures to implement the Action Plan.
3. Establish efficient collection system for selected electronic waste.
In line with the E-waste Management Rules (Draft) 2011, and Hazardous Waste Management Policy of Bangladesh (Draft) 2009, the Sixth Five Year Plan prominently sheds light on the E-waste issues in Bangladesh.
2.
Basel convention
3. The Basel Convention provides embargo on trans-boundary movement of hazardous waste (Leitzman, Levinson and Folman 2009).

33 THE COST AND MANAGEMENTISSN 1817-5090, VOLUME-45, NUMBER-1, JANUARY-FEBRUARY 2017
Sl. LegalInstrument
Key features encompassingE-waste management
Sl. LegalInstrument
Key features encompassingE-waste management
Bangladesh is a signatory to Basel convention and also has accessed to this Convention on April 01, 1993. The Convention asks the signatory countries to take measures on hazardous waste management (Rahman et al 2014).
So it is evident that Bangladesh is committed to international community for taking measures on E-waste management within its boundary
The National Environment Policy, 1992
The National Environment Policy (NEP), 1992 has set the policy framework for environmental action with a set of sector-wise guidelines. The Policy embraces a number of related different sectors including ecological balance and overall development. The central theme of the policy is to ensure the protection and improvement of the environment. It also gives the direction of amending the existing laws, formulating the new laws and implementing the same. It also assigned the Ministry of Environment and Forests to coordinate the implementation of the policy and to constitute a high level National Environmental Committee (NEC) with the head of the government as the chairperson.
However, it is learnt from DoE that it has revised the Environment Policy '92 to make it updated and compatible with the current national and international situation. The Policy covers the environmental issues in a whole package. It does not give emphasis on any issues of the environment separately. Likewise, regarding E-waste the Policy does not suggest any guidelines or measures for E-waste management (moef.gov.bd).
4.
Environment Conservation Act 1995 (Revision up to 2012)
5. The Environment Conservation Act 1995 (ECA 1995) is currently the main act governing environmental protection in Bangladesh. The Act was designed to preserve the environment through improving environmental standards and controlling and mitigating environmental pollution. The major objectives of ECA'95 are: conservation of the natural environment and improvement of environmental standards, and control and mitigation of environmental pollution. The strategies of the act focus on promulgation of standard limit for discharging and emitting waste and hazardous waste import, transportation, storage etc.
Environment Conservation Act (ECA), 1995, authorized the DoE to undertake any activity necessary to conserve and enhance the quality of the environment and to control, prevent and mitigate pollution. The DoE was also mandated to give clearance on environmental issues for any new project (moef.gov.bd).
The Act was subsequently amended 2000, 2002, and 2012.As said by the Act in its regulation number 20, the government can enact rules for the control of environment pollution. Subsequently, circulars and notifications were issued for implementing the Act.
However, the Act failed to suggest any monitoring mechanism for the enforcement of its provisions (MoEF 2006).
Environmental Conservation Rules 1997
The Environmental Conservation Rules (ECR) 1997 set by the government of Bangladesh for the protection of environment. ECR has the mandate for all industries to carry out Environmental Impact Assessment (EIA). The Rules instructs all industries to install waste/pollutant treatment plants for controlling environment pollution. In addition to that all industries will conform to environmental quality standards, report accidents or unforeseen discharge of pollutants and take remedial
measures under ECR (MoEF 2006). Environment Conservation Rules of 1997, divided industries and projects into different categories depending upon the pollution load and likely impact on the environment. ECR gives mandate to DoE to issue 'No Objection Certificates' (NOC) to those E-waste management companies that conform to mandated ECR standard.
However no rules found in ECR to deal particularly with E-waste issue in Bangladesh (moef.gov.bd).
6.
The Environment Court Act, 2000
The Environment Court Act (ECA), 2000 was subsequently amended in 2002. The Act provides frameworks for setting up one or more environmental courts with clear and specific terms of reference to deal with environmental offences (MOEF, 2006:25). Initially, in every division of the country a court will be established(moef.gov.bd).
7.
Ozone Depleting Substance (Control) Rules 2004 (Amendment 2014)
Ozone Depleting Substance (Control) Rules 2004 have been prepared under the Environmental Conservation Act 1995. Ozone depleting substances are prohibited to use under the schedule (1) column (2) of this rule. In addition to that according to regulation 4 of sub section 2 of the Rules, anybody could not produce, import, and export ozone depleting substance.
8.
Ship breaking and Hazardous Waste Management Rules, 2011
The rules have been formulated under Environmental Conservation Act 1995. In the rules described the process of hazardous waste safe management. It includes waste which is by nature physically reactive, toxic, flammable, explosive and corrosive or other waste properties that can damage health and environment.
9.
Medical Waste Management Rules, 2008
The rule is prepared under the environmental conservation act 1995. The rules described important definition; formation of authority and responsibility; license issue and cancelation; responsibility of registered vendors; segregation, packaging, transportation and hoarding; elimination and purification; classification waste for medical waste management. The rules address waste management issues mainly in the context of medical wastes.
10.
Clean Development Mechanism (CDM)
Under the Kyoto Protocol, CDM is a mechanism that allows developed countries to achieve part of their greenhouse gas emissions reduction obligations through investment in projects in developing countries that reduce greenhouse gas, fix, or sequester carbondioxide from the atmosphere(Waste Concern Consultants, 2010). The strategy is promoting pro-poor through CDM projects on waste sector by harnessing carbon financing (ESDO, 2012).
11.
National 3R Strategy for Waste Management, 2009
The solid waste management rules based on the 3R principle as well as hazardous waste management rule. 3R means reducing waste, reusing and recycling resources and products. The strategy clarifies the concepts of reducing, reusing and recycling. The Strategy facilitates four manuals on four different types of wastes: solid waste, bio-medical waste, industrial waste and agricultural waste. It does not address e-wastes, as a separate category of waste.
However, the recycling of E-waste is required to be regulated due to presence of hazardous constituents in the components of waste electrical and electronic assemblies.
12.
Lead Acid Battery Recycling and Management Rules, 2006
The rules have improved the collection and recycling lead acid battery (Waste Concern Consultants, 2010).

34 THE COST AND MANAGEMENTISSN 1817-5090, VOLUME-45, NUMBER-1, JANUARY-FEBRUARY 2017
Summary of key policies and laws: Bangladesh has international commitment to take measures on E-waste management in terms of hazardous wastes. But in the whole framework that categorically focuses on the environmental aspect of the country, it is found that only the Seventh Five Year Plan has provided some suggestions and measures and programs for E-waste management. The Plan suggests rules and regulations that will particularly look after the E-waste issues. Besides, it proposes some programs for E-waste management.
In addition to that National ICT Policy has addressed E-waste problem in a trivial manner. Other than these two policy instruments, the whole policy framework on environment lacks focus on the issue of E-waste in the country.
Relevant Policies and Laws Influencing E-waste Generation and Management:The following policy instruments that shoulder some issues of environment are discussed below.
Sl. LegalInstrument
Key features encompassingE-waste management
Import policy Order 2015-2018
The Kha part of the policy describes list of import of prohibited goods. Paragraph number (5) defines prohibition of imported goods like recondition office equipment, photocopier, type writer machine, telex, phone, fax, old computer, and refurbished computer and electronics accessories. It means that Bangladesh has banned import of all sorts of E-waste in the Import Policy Order (mincom.gov.bd).
2.
Export Policy 2015-2018
The policy has influenced information and communication technology sector by providing various facilities to the citizens. The section 5.9 of this policy defines opportunities of ICT business. No restriction has imposed to export refurbished goods including e-devices (mincom.gov.bd).
3.
Land Use Policy
The National Land Use Policy 2001, of the Ministry of Land focused on the necessity, the importance and modalities of land zoning for integrated planning and management of land resources of the country. It also mentioned the need of formulating a Zoning Law and Village Improvement Act for materializing the identified land zoning area. Provision of 3(Ka) of Non Agriculture Khash Land Management and Allocation Guideline 1995 require a body purchasing khash land from government to fulfill their objectives. Therefore identified location is required in every district for E-waste management and there should have a provision in the Non Agricultural Khash Land Management and Allocation Guidelines to that purpose (minland.gov.bd).
4.
Sl. LegalInstrument
Key features encompassingE-waste management
National Information and Communication Technology (ICT) Policy 2015
The objective of the National ICT policy the section D 9 tells that steps will be taken for the reduction of risk on climate change. By the innovation of environmental friendly green technology initiatives will also be taken for safe E-waste management, climate and disaster management.
In addition to that, the policy in section E defines strategic themes. The section describes the five strategies for environment, climate and disaster management. E 9 clearly mentions about safe management of electronic waste. Action plan of this policy includes that industry ministry will establish a plant for reuse of extract metal from refurbish PC device and other ICT gadgets (ictd.gov.bd).
1.
National Information and Communication Technology Act, 2006 (Amendment up to 2013)
Objectives of the National ICT Act 2006 describe the relevancy to management of discarded ICT equipment. None of the clause regarding E-waste management has found in the Act(ictd.gov.bd).
National Science and Technology Policy-2011
5. The preamble of the National Science and Technology Policy paragraph number 1.4 highlighted that science and technology is an instrument of change that can play a decisive and pivotal role in achieving the national goals on poverty reduction and ensuring sustainable development through value addition to resources, creation of jobs, reducing environmental pollution, control and mitigation of natural hazards, increasing production and improving life style of people belonging to different strata of the population. One of the mission of this policy is to encourage research on green technology to harness natural resources; ecosystem which acts as a carbon sink and a buffer against climate change; information and communications technology, biotechnology, nanotechnology etc. (most.gov.bd).
National Industry Policy 2016
Chapter 14 of National Industry Policy 2016 highlighted environment friendly Industry management. The policy stated that Government will provide all sorts of co-operation and incentives to the local and foreign entrepreneur for managing and processing industry waste. Besides, industry entrepreneur has to be influenced to follow 3R (Reduce, Reuse and Recycle) strategy for waste management (moind.gov.bd).
6.
National Renewable Energy Policy, 2008
This policy focuses on promoting production of biogas and other green energy from waste and also providing incentives for Clean Development Mechanism to encourage green energy projects (mpemr.gov.bd).
7.
National Urban The policy has given emphasis on following CDM and Recycling.
8.
Income Tax Ordinance 1984
By providing tax rebate to the citizens, the ordinance encourages citizens for using new computer and its accessories that has defined in the sixth schedule, part B, paragraph 23 of this ordinance (nbr.gov.bd).
9.
Bangladesh Atomic Energy Regulatory Act 2012
Management and transportation of atomic waste define in the chapter 5, section 38 (baec.gov.bd).
10.
Telecommunication Act 2001 (Amendment, 2010)
This Act focused on controlling of radiation (ptd.gov.bd/).
11.
Sl. LegalInstrument
Key features encompassingE-waste management
National Environmental Management Action Plan (NEMAP), 1992
National Environmental Management Action Plan (NEMAP) is an environmental planning exercise undertaken by the government through MOEF. In companion with NEP the Plan was carried out in three phases between 1992 and 1994 (moef.gov.bd).
During the first phase undergoing rapid environmental degradation was identified. The second phase saw prioritization of sectoral issues. Finally, the third phase witnessed elaborate public consultation exercise with assistance from NGO personnel, academicians, lawyers, journalists and other professionals.
However, E-waste issue was not addressed in it.
13.
Governments should encourage E-waste recycling under public-private partnership mode for environment friendly production.

35 THE COST AND MANAGEMENTISSN 1817-5090, VOLUME-45, NUMBER-1, JANUARY-FEBRUARY 2017
Summary of relevant policies and laws: The legal instruments having some stake on environmental issues, do not specifically address the issue of e-waste, with few exceptions. National Information and Communication Technology (ICT) Policy 2015 has promoted the issue of safe E-waste management though green initiatives. By the innovation of environmental friendly green technology initiatives will also be taken for safe E-waste management, climate and disaster management.
It is evident that Bangladesh has commitment to international community for adopting measuring against e-wastes within its boundary. DoE formulated draft policies like National Environmental Policy (Draft) 2015, E-waste Management Rules (Draft) 2011, and Hazardous Waste Management Policy of Bangladesh (Draft) 2009. These laws have some clause regarding E-waste management but the laws are yet passed. These to be key instruments of E-waste management are under consideration of Ministry of Laws and Parliament Affairs, according the attest information during the study.
Bangladesh has no specific Environmental Policy, Act, Rules or Guidelines on E-waste management. There is no specific definition of E-waste mentioning in the National Environment Conservation Act 1995 and Environment Conservation Rules 1997. But a number of existing policies have found that focused on safe E-waste management.
Summary of legal framework: With few exceptions most of the legal instruments having stake on environmental issues, do not specifically address the issue of E-waste. National Information and Communication Technology (ICT) Policy 2015 has promoted the issue of safe E-waste management though green initiatives. The innovation of environmental friendly green technology initiatives will also be taken for safe E-waste management, climate and disaster management in the country.
Besides, Import policy Order 2015-2018 puts an embargo on importing all kinds of E-waste. In addition to that, National Export Policy does not put any embargo on exporting refurbished goods including e-devices.
However, some of the very important policy instruments having significant bearing on the E-waste, do not address the issues of E-waste categorically. A few of them are Land Use Policy, National Urban Policy 2006, National Science and Technology Policy-2011, etc.
3. Concluding remarks: The key objective of this research is to investigate into the roles of stakeholders played in the E-waste management in Bangladesh. It also examined the existing policy gap and environmental management issues in terms of E-waste. This study relied on qualitative data analysis techniques. 12 Key Informant Interviews and content analysis on 25 documents were performed for the study. In addition to that,5 case studies were also performed.
The findings of the study regarding E-waste management in Bangladesh are being presented in bullet form below:
l Specific E-waste management policies , act, rules,
suffer from adequacy l Insufficient E-waste management infrastructurel Institutional capacity is yet to be developedl Weak enforcement on the existing policies and
regulation on E-waste management except ICT policy 2015
l Lack of national statistics/database on E-waste generation
l Inadequate understanding and lack of skilled personnel on E-waste management related environmental hazards
l Lack of comprehensive awareness programsl Land policy does not have provision for dumping of E-
wastel Mushrooming of informal recycling center l E-waste management is not likely to attract private
investors because of its economic non-viability.
Reference
Baldé, C.P., Wang, F., Kuehr, R., Huisman, J (2014).The Global E-waste Monitor, Quantities, flows and resources
Bangladesh Atomic Energy Regulatory Authority (http://baera.portal.gov.bd/) (accessed 7 July 2016)
Bangladesh Telecommunication Regulatory Commission ( http://www.btrc.gov.bd/) (accessed 23 July 2016)
Chittagong City Corporation (http://www.ccc.org.bd/) (accessed 8 October2016)
Department of Environment (http://www.doe.gov.bd/) (accessed 4 October 2016)
Dhaka North City Corporation (http://dncc.gov.bd/) (accessed 5 August 2016)
Dhaka South City Corporation (http://www.dhakasouthcity.gov.bd/) (accessed 25 September 2016)
Environment and Social Development Organization( http://esdo.org/)(accessed 11 November2016)
Information and Communication Technology Division (http://www.btrc.gov.bd/)(accessed 8 July 2016)
JR Enterprise (www.jr-enterprise.com) (accessed 15 August 2016)
Levinson, T, Folman, C and Leitzman, J 2009, E-waste: implication, regulations, and management in India and current global best practices, Ed. by RakeshJohri , TERI Press, New Delhi
Local Government Division (http://www.lgd.gov.bd/) (accessed 28 October 2016)
Lundgren, K., 2012. The global impact of e-waste: Addressing the challenge
Ministry of Environment and Forest (http://www.moef.gov.bd/) (accessed 8 June 2016)
Ministry of Post, Telecommunication and Information Technology (http://www.ptd.gov.bd/) (accessed 15 September 2016)
Ministry of science and technology (http://www.most.gov.bd/) (accessed 27 October 2016)
Muhani, D.A., 2014, A framework for sustainable E-waste management in manufacturing and processing industries, Industrial area Nairobi County, Doctoral dissertation, Kenyatta University.
Shah Khan, S., Aziz Lodhi, S., Akhtar, F. and Khokar, I., 2014, Challenges of waste of electric and electronic equipment (WEEE) Toward a better management in a global scenario. Management of Environmental Quality: An International Journal, 25(2), pp.166-185.
Waste Crime - Waste Risks, Gaps In Meeting The Global Waste Challenge, UNEP (2015)
Environmental Governance 2009, United Nations Environment Program, <http://www.unep.org/pdf/brochures/EnvironmentalGovernance.pdf>, (accessed 29 June 2016
Waste Concern, Bangladesh (http://www.wasteconcern.org/) (accessed 4 November 2016)

36 THE COST AND MANAGEMENTISSN 1817-5090, VOLUME-45, NUMBER-1, JANUARY-FEBRUARY 2017
Gouranga Chandra DebnathAssistant ProfessorDepartment of Business AdministrationDaffodil International [email protected]
A A yy iL qq dd yy P
kFii i ::::
An Analysis ofLiquidity Position ofNon-BankFinancial Institutions:
Shah-noor RahmanSenior LecturerDepartment of Business AdministrationDaffodil International [email protected]
Sabrina AkhterSenior LecturerDepartment of Business AdministrationDaffodil International [email protected]
Abstract
The global economy has suffered a great shockwave following the recession at onset of 21 century. The multifaceted phenomenon has hit hard the global banking system like other financial institutions. Many a giant banks with global reputation were forced to close in the face of bankruptcy. Foreseeing the looming crisis, a number of large banking institutions have opted for merger. Alike other developing countries, financial institutions in Bangladesh bore the brunt of financial crisis. It was a common instance that clients of big financial institutions (FIs) came out of the ATM booths with dejection as the ATM machines ran out of cash. FIs have repeatedly failed to lend loan to the entrepreneurs. As a resulted entrepreneurial rate lost the momentum it gained before the period of global financial crisis. The Bangladesh Bank has come up with diverse bailout measures to revitalize the moribund financial institutions. This study focused on the liquidity management of five non-bank financial institutions (NBFIs). A comparative analysis has been carried out to compare the liquidity position of the leading NBFIs in Bangladesh from the period of 2011 to 2015. The analysis took into account both the short-term and the long-term liquidity position and also maturity-wise liquidity position of the five NBFIs. The researchers also analyzed the liquidity position by using sources and uses fund approaches and find that only few numbers of NBFIs can maintain positive liquidity.
Keyword: NBFI, Liquidity, Net liquidity Gap, Short term liquidity, Long term liquidity, Key performanceindicators.
A Study on Some Selected Non-Bank Financial Institutions in Bangladesh
Liquidity

37 THE COST AND MANAGEMENTISSN 1817-5090, VOLUME-45, NUMBER-1, JANUARY-FEBRUARY 2017
sign that a bank is in serious financial trouble. Though maintaining liquidity is considered to be the most important task for banking organizations, NBFI sector is not out of this issue. As a financial institution NBFI also have to maintain liquidity with proper concern not for the purpose of meeting customer's requirement immediately, but for meeting demand for short term fixed deposit with maturity of 3 months or 6 months. Like banks non bank FIs also have to maintain the proper amount of cash in hand, balance with Bangladesh Bank and other banks as the source of liquidity. The central bank has a specific rule about liquidity. About 5% of the total deposit must be maintained as Statutory Liquidity Reserve, where as 2.5% must be maintained as Cash Reserve Ratio. In this study we are trying to focus this liquidity position of five non bank Financial Institutions under different categories in Bangladesh. In line with the objective of the research, we carried out a comparative analysis of liquidity position of these five companies.
2.0 Objectives:The study is conducted to evaluate the liquidity position of some selected non-banks financial institutions in Bangladesh and make a comparison of their respective liquidity position during the period of 2011 to 2015. To attain the objective, the study covers the following specific objectives:
1. To evaluate the liquidity position of selected non-bank FIs in Bangladesh.
2. To carry out a comparative study of liquidity position of selected non-bank FIs with some parameters used for judgment.
3. To give an overview of theoretical development and previous studies.
3.0 Methodology:This study is based on the 5 years data of liquidity position of the selected non-banks financial institutions (NBFIs) in Bangladesh. We have taken five leading non-bank financial institutions and compare among them. For this purpose we have chosen IDLC Finance Ltd, United Finance Ltd, Prime Finance Ltd, Industrial and Infrastructure Development Finance Company Ltd (IIDFC) and Lanka Bangla Finance Ltd. We have taken the liquidity position from the year 2011 to 2015 from the annual reports of the mentioned selected NBFIs. The study is an empirical analysis and for the analysis our main source of information is the annual reports of
1.0 Introduction:Non-banking financial institutions (NBFIs) represent one of the most important parts of a financial system. In Bangladesh, NBFIs are new in the financial system as compared to banking financial institutions (BFIs). Economy of Bangladesh is particularly jeopardized by the banking financial institutions. Although NBFIs have immense necessity and greater importance in the financial system of Bangladesh, they are severely suffering from some problems including the fund problem in terms of both availability and cost.
A non-bank financial institution (NBFI) is a financial institution that does not have a full banking license or is not supervised by a national or international banking regulatory agency. NBFIs facilitate bank-related financial services, such as investment, risk pooling, contractual savings, and market brokering. While banks may offer a set of financial services as a packaged deal, NBFIs unbundle and tailor these services to meet the needs of specific clients. Additionally, individual NBFIs may specialize in one particular sector and develop an informational advantage.
Non-bank financial companies (NBFCs) offer most sorts of banking services, such as loans and credit facilities, private education funding, retirement planning, trading in money markets, underwriting stocks and shares, TFCs(Term Finance Certificate) and other obligations. The number of non-banking financial companies has expanded greatly in the last several years as venture capital companies, retail and industrial companies have entered the lending business. Non-bank institutions also frequently support investments in property and prepare feasibility, market or industry studies for companies. Financial institutions are often evaluated on their liquidity, or their ability to meet cash and collateral obligations without incurring substantial losses. In either case, liquidity management describes the effort of investors or managers to reduce liquidity risk exposure. The issue of maintaining liquidity by financial institutions (FIs) is a very important aspect for the FIs. As a depository institution, every financial institution has to maintain enough liquidity to meet legal obligation of central bank and other regulatory agencies.
Maintaining liquidity is the most important and complex procedure for any banking organization. Lack of adequate liquidity is often one of the first
38 THE COST AND MANAGEMENTISSN 1817-5090, VOLUME-45, NUMBER-1, JANUARY-FEBRUARY 2017
4.0 Literature Review:Though several researches have been conducted regarding liquidity management of banks in Bangladesh, but liquidity management of NBFI is still not that much common. Das, Chowdhury, Rahman and Dey in their study of "liquidity management and profitability analysis of private commercial banks in Bangladesh" (2015) concluded that proper liquidity management can increase the profitability of the Banks if other factors move positively. Though profit position moves positively with the positive movement of advances of the commercial banks but in 2012 first & second generation banks did not prove this theory. There were several reasons behind this occurrence. Among all these; unrest political situation, higher amount of default loan, decrease of loan rate, decrease the investment scope and lack of emerging investor were the main reasons for decreasing the profit position of the banks of first & second generation. On the other hand, first generation banks held the highest advance deposit ratio and third generation banks held the lowest advance deposit ratio.
The Islamic banks have been making significant contributions to economic development of our country. The Islamic banking set out its glorious journey in this country three decades ago. Now, this banking system covers one-fifth of the country's total banking. (Islamic Banking in Bangladesh: Progress and Potential).Islam and Chowdhury (2009) in their research concluded that Islamic Bank Bangladesh Ltd. showed comparatively better performance in liquidity management then the conventional AB Bank Limited for the period 2003 to 2006 on both short term and long term basis. According to their findings EPS, P/E ratio, ROA and ROE had influential role in determining the extent of liquidity.
Some studies have been conducted regarding liquidity risk which arises when a company or bank will be unable to meet short term financial demands. This usually occurs due to the inability to convert a security or hard/fixed asset to cash without a loss of capital and/or income in the process. Kleopatra Nikolaou (2009) assumed that the root of liquidity risk lies in information asymmetries and the existence of incomplete markets. The causes of liquidity risk lie on departures from the complete markets and symmetric information paradigm, which can lead to moral hazard and adverse s-election. In order to eliminate systemic liquidity risk, greater transparency of liquidity management practices in needed. Supervision and regulation are the
the selected non-banks from where we have taken the yearly liquidity statement. Our analysis is divided into two segments. In the first segment we have prepared maturity wise liquidity position of individual NBFIs, compared the liquidity position of NBFIs and in the second segment we have used sources and uses of fund approach and structure of deposit method for measuring liquidity needs. For analyzing data following processes are used in this study.
3.1 Data Analysis Process:We have started the analysis with arranging the data by maturity wise liquidity position of selected NBFIs individually to calculate year wise Net Liquidity Gap which is calculated from the difference between total assets and total liabilities. The maturity buckets are segmented as up to 1 month maturity, 1-3 months maturity, 3-12 months maturity, 1-5 years maturity and more than 5 years maturity.
From that information we have calculated the year wise net liquidity gap of each year and NBFIs. By using the formula, Net liquidity gap= Total assets - Total liabilities or NLG=TA-TL. Liquidity position of a FI can be described by following criteria.
If, Total Asset>Total liability = Surplus or Positive Liquidity Position
Total Asset<Total liability = Deficit or Negative Liquidity Position
Total Asset=Total liability = Net Liquidity Position
Positive net liquidity gap implies that the NBFI has sufficient assets to satisfy the liabilities of the same maturity bucket and negative net liquidity gap implies that the liabilities exceed the assets for that particular maturity bucket.
Next we calculate the short term and long term liquidity position of the selected banks.
Finally we have estimated the liquidity needs of selected NBFIs by using sources and uses of fund method and structure of deposit method. Where again we use a formula of calculating liquidity needs, Liquidity Needs= Total Loan - Total Deposit. Liquidity needs of FIs are described as positive and negative liquidity needs. For data analysis, we have used MS Excel and own calculation.

39 THE COST AND MANAGEMENTISSN 1817-5090, VOLUME-45, NUMBER-1, JANUARY-FEBRUARY 2017
5.1 Comparative analysis of liquidity position of selected NBFIs:
Table-5.1.1 stated 5 year's average maturity wise net liquidity gap of selected NBFIs. The table explain that net liquidity gap of all the NBFI's are positive and Appendix A, Table: 1 to 5 shows the year on year net liquidity gap of selected NBFIs, where we can find that the selected NBFIs are maintaining positive liquidity year on year that means their assets are sufficient to cover the liabilities.Table-5.3.1 also shows that IDLC Finance Ltd, the market leaders of current NBFIs in Bangladesh, has maintained the largest amount of total liquidity among the selected NBFIs.
fundamental weapons against systemic liquidity risk. Anam, Hasan, Huda, Uddin and Hossain (2012) defined Liquidity risk as the excessive transaction cost, excessive loss of value and excessive exertion of time that banks have to face at the time of allocating liquidity to the third party when stipulated. Because of the unique constitutional features and regulatory conformity with the Shariah principle Islamic banks have to exert much more to manage liquidity. Incontrast to the conventional banks, Islamic banks were proven to be successful to predict the liquidity risk level. As liquidity risk is an ever present hazard for both Islamic and conventional sort of banks, financial institutions need to be proficient enough to assess the extent of liquidity risk and take necessary preventive measures in order to remain safe from the liquidity crisis.
From table-5.1.2 we can observe the year wise growth rate of total liquidity gap of the NBFIs. This stated that the growth rate of net liquidity gap is fluctuating year on year. For some companies the growth rate is negative (Lanka Bangla 2014, Prime Finance 2012 to 2015).However, IDLC Finance and United Finance are showing consistent positive average growth rate of net liquidity gap of 20% and 10.75% respectively.
Table 5.1.3 demonstrates year wise decomposition of net liquidity gap from which we can find that, in case of short term liquidity IDLC faced deficit liquidity position from 2011 to 2015. Short term liquidity position is calculated by adding the figures of up to 1 month, 1-3 months and 3-12 months liquidity position of selected NBFIs. Also Lanka Bangla Finance faced deficit liquidity position except year 2013. Prime finance has faced negative liquidity in 2014 and 2015. That means except these companies others have sufficient current assets to meet the current obligations.
Table: 5.1.1 Average Net Liquidity Gap (Amount in Taka)
� IDLC� IIDFC� Lanka Bangla� United Finance� Prime Finance
up to 1 month � 54,812,109� 330,726,662� (649,384,938)� (8,405,506)� 115,227,633
1-3 months � (904,634,142)� 591,507,407� (502,223,259)� 215,361,444� 53,899,409
3-12 months � (8,231,815,389)� 418,696,673� 270,336,720� 601,949,147� (435,469,109)
1-5 years � 8,488,278,742� (27,057,814)� 2,416,268,859� 996,369,545� 1,553,820,715
Morethan 5 years � 5,409,622,945� 99,971,510� 2,151,925,236� 402,401,522� 2,905,341,355
Total� 4,816,264,265� 1,413,844,237� 4,570,322,618� 2,207,676,151� 4,192,819,202
Table: 5.1.3 Comparison of Short Term Liquidity Gap (amount in Taka)
� Year� IDLC� IIDFC� LankaBangla� United Finance� Prime Finance
� 2011� (1,638,752,724)� 5,634,219� (6,578,651,057)� 1,374,652,715� 288,878,614
� 2012� (6,123,902,041)� 476,272,881� (73,938,430)� 1,092,721,326� 432,170,719
� 2013� (8,473,211,152)� 5,015,728,141� 4,316,905,542� 966,429,711� 372,708,004
� 2014� (14,081,937,838)� 582,933,353� (662,789,205)� 452,254,646� (3,257,486,104)
� 2015� (15,090,383,355)� 624,085,113� (1,407,884,232)� 158,467,025� (266,342,068)
�Year� IDLC� IIDFC� Lanka� United� Prime� � � � Bangla�Finance�Finance
�2011
�2012� 18.0%� 2.8%� 109.9%� 8.9%� -8.2%
�2013� 21.0%� 10.9%� 81.6%� 10.8%� -0.8%
�2014� 23.0%� 9.3%� -33.9%� 12.0%� -0.8%
�2015� 18.0%� 0.7%� 17.5%� 11.3%� -17.6%
Table: 5.1.2 Growth rate of Total Liquidity Gap of Selected NBFIs

40 THE COST AND MANAGEMENTISSN 1817-5090, VOLUME-45, NUMBER-1, JANUARY-FEBRUARY 2017
Table-5.1.4 refers to the long-term liquidity gap for the NBFIs. Long term liquidity gap of all NBFIs are positive for the whole period except IIDFC in 2013. However other NBFIs data indicates that the overall short-term liquidity management was not as good as its management of long-term liquidity. That is why the NBFIs were unable to satisfy the current liability requirement by using the available current assets.
6.0 Estimating Liquidity needs based on a Sources and Uses of Fund Method: In this section we are trying to measure the liquidity needs of selected NBFIs by developing a sources and uses of funds statement. For measuring this, we evaluate the amount of loan and deposit of past five years and calculate.
Table 6.1 measures the liquidity needs of IIDFC and shows that from 2012 to 2015 the company's loan demand is lower than deposit supply, outcome is a negative liquidity.
From table 6.2 we can see that, the liquidity needs of IDLC Finance mostly positive as their loan investment is more than deposit or liability. One of the reasons behind this scenario is that, they are the market leader and their number of customer is higher than that of others.
From table 6.3 we can observe the liquidity needs of Prime Finance Ltd and the table describes that the liquidity needs of the company is negative for all the year. That means their deposit or liability is higher than loan or asset. That means a negative liquidity.
Table: 5.1.4 Comparison of LongTerm Liquidity Gap (Amount inTaka)
� Year� IDLC� IIDFC� LankaBangla� United Finance� Prime Finance
� 2011� 4,859,268,298� 1,241,911,812� 4,006,329,157� 420,029,408� 4,684,396,992
� 2012� 9,933,617,884� 805,716,532� 3,945,167,455� 861,676,039� 7,544,101,032
� 2013� 13,093,933,988� (3,594,210,087)� 2,712,588,928� 1,198,943,062� 7,075,648,067
� 2014� 19,775,758,189� 970,834,529� 5,310,271,571� 1,973,149,848� 4,230,594,920
� 2015� 21,826,930,078� 940,315,692� 6,866,613,363� 2,540,056,975� 3,487,809,697
Table: 6.1 Sources and Uses of Fund Method (IIDFC Finance Ltd)
Sources: Annual Report and Own Calculation
� Year� Estimated Loan� Estimated Deposit� Changes in Loan� Changes in Deposit� Estimated Liquidity� � � � Demand� � Need
� 2011� 8,678,263,667� 4,239,671,479
� 2012� 8,970,982,947� 5,104,751,769� 292,719,280� 865,080,290� -572,361,010
� 2013� 9,306,074,447� 5,618,140,608� 335,091,500� 513,388,839� -178,297,339
� 2014� 9,991,417,681� 7,083,870,049� 685,343,234� 1,465,729,441� -780,386,207
� 2015� 10,893,579,693� 9,319,021,782� 902,162,012� 2,235,151,733� -1,332,989,721
Table: 6.2 Sources and Uses of Fund Method (IDLC Finance Ltd)
Sources: Annual Report and Own Calculation
� Year� Estimated Loan� Estimated Deposit� Changes in Loan� Changes in Deposit� Estimated Liquidity� � � � Demand� � Need
� 2011� 25,540,199,582� 17,638,848,598
� 2012� 30,938,682,259� 22,998,899,099� 5,398,482,677� 5,360,050,501� 38,432,176
� 2013� 38,677,966,492� 30,287,439,084� 7,739,284,233� 7,288,539,985� 450,744,248
� 2014� 45,348,701,212� 36,595,819,049� 6,670,734,720� 6,308,379,965� 362,354,755
� 2015� 53,857,714,206� 47,760,365,293� 8,509,012,994� 11,164,546,244� -2,655,533,250

41 THE COST AND MANAGEMENTISSN 1817-5090, VOLUME-45, NUMBER-1, JANUARY-FEBRUARY 2017
Incase of Lanka Bangla Finance Ltd, they can maintain positive liquidity in the first two years but in the following two years they have negative liquidity (Table: 6.4).
Refer to the Table 6.5 United Finance Ltd has faced negative liquidity needs from 2012 to 2015. As their asset (Loan) is lower than liability (Deposit).
After analyzing all the data and information we can conclude that, the company who face a negative liquidity should increase the loan disbursement. As loan is the asset of a financial institution
6.1 Structure of Deposit Method:In this segment we have used structure of deposit methods for measuring liquidity needs of selected NBFIs. The basic idea of this approach is to list the different types of deposit that the FIs is using to acquire funds and then assign a assign a probability of withdrawal to each type of deposit within a specific planning horizon. The major strength of the structure of deposits method is that it directs management attention to the probable cause of liquidity pressure namely, deposit withdrawals.
Table: 6.3 Sources and Uses of Fund Method (Prime Finance Ltd)
Sources: Annual Report and Own Calculation
� Year� Estimated Loan� Estimated Deposit� Changes in Loan� Changes in Deposit� Estimated Liquidity� � � � Demand� � Need
� 2011� 8,705,279,178� 4,315,609,590
� 2012� 9,751,352,472� 5,614,795,490� 1,046,073,294� 1,299,185,900� -253,112,606
� 2013� 10,778,958,556� 6,770,963,595� 1,027,606,084� 1,156,168,105� -128,562,021
� 2014� 11,453,231,600� 7,763,327,204� 674,273,044� 992,363,609� -318,090,565
� 2015� 12,343,396,372� 9,544,207,157� 890,164,772� 1,780,879,953� -890,715,181
Table: 6.4 Sources and Uses of Fund Method (Lanka Bangla Finance Ltd)
Sources: Annual Report and Own Calculation
� Year� Estimated Loan� Estimated Deposit� Changes in Loan� Changes in Deposit� Estimated Liquidity� � � � Demand� � Need
� 2011� 10,414,959,692� 5,569,772,020
� 2012� 13,773,777,275� 7,676,958,646� 3,358,817,583� 2,107,186,626� 1,251,630,957
� 2013� 19,258,875,786� 10,875,949,549� 5,485,098,511� 3,198,990,903� 2,286,107,608
� 2014� 24,265,994,073� 16,794,752,643� 5,007,118,287� 5,918,803,094� -911,684,807
� 2015� 36,018,816,850� 30,196,004,667� 11,752,822,777� 13,401,252,024� -1,648,429,247
Table: 6.5 Sources and Uses of Fund Method (United Finance Ltd)
Sources: Annual Report and Own Calculation
� Year� Estimated Loan� Estimated Deposit� Changes in Loan� Changes in Deposit� Estimated Liquidity� � � � Demand� � Need
� 2011� 7,866,945,557� 5,098,308,529
� 2012� 9,014,166,542� 6,403,049,894� 1,147,220,985� 1,304,741,365� -157,520,380
� 2013� 9,841,243,557� 7,390,044,711� 827,077,015� 986,994,817� -159,917,802
� 2014� 10,727,025,555� 8,540,473,821� 885,781,998� 1,150,429,110� -264,647,112
� 2015� 11,938,923,856� 11,931,209,665� 1,211,898,301� 3,390,735,844� -2,178,837,543
Table: 6.1.1 Year wise Structure of Deposit of Prime Finance Ltd (Amount in Lac Tk.)
Sourcesof Deposit
Prob
abilit
y
Deposit
2011
Withd-rawal
Deposit
2012
Withd-rawal
Deposit
2013
Withd-rawal
Deposit
2014
Withd-rawal
Deposit
2015
Withd-rawal
1-3 months� 0.6� 23,137� 13,882� 18,890� 11,334� 47,694� 28,616� 10,171� 6,103� 57,597� 34,558
3-12 months� 0.4� 15,750� 6,300� 11,419� 4,568� 13,103� 5,241� 15,149� 6,059� 19,862� 7,945
1-5 years � 0.3� 1,112� 334� 18,718� 5,615� 1,690� 507� 30,640� 9,192� 6,134� 1,840
More than� 0.2� 153� 31� 165� 33� 73� 15� 15,006� 3,001� 1,271� 2545 years
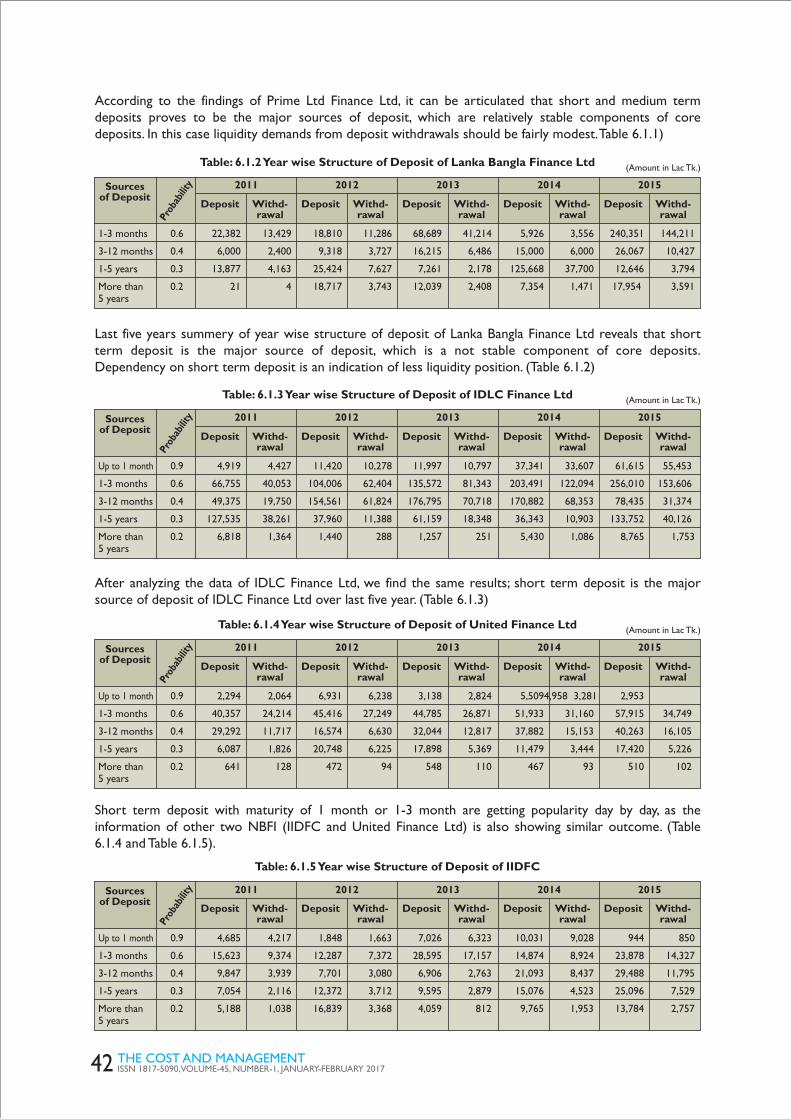
42 THE COST AND MANAGEMENTISSN 1817-5090, VOLUME-45, NUMBER-1, JANUARY-FEBRUARY 2017
According to the findings of Prime Ltd Finance Ltd, it can be articulated that short and medium term deposits proves to be the major sources of deposit, which are relatively stable components of core deposits. In this case liquidity demands from deposit withdrawals should be fairly modest. Table 6.1.1)
Last five years summery of year wise structure of deposit of Lanka Bangla Finance Ltd reveals that short term deposit is the major source of deposit, which is a not stable component of core deposits. Dependency on short term deposit is an indication of less liquidity position. (Table 6.1.2)
Table: 6.1.2 Year wise Structure of Deposit of Lanka Bangla Finance Ltd (Amount in Lac Tk.)
Sourcesof Deposit
Prob
abilit
y
Deposit
2011
Withd-rawal
Deposit
2012
Withd-rawal
Deposit
2013
Withd-rawal
Deposit
2014
Withd-rawal
Deposit
2015
Withd-rawal
1-3 months� 0.6� 22,382� 13,429� 18,810� 11,286� 68,689� 41,214� 5,926� 3,556� 240,351� 144,211
3-12 months� 0.4� 6,000� 2,400� 9,318� 3,727� 16,215� 6,486� 15,000� 6,000� 26,067� 10,427
1-5 years� 0.3� 13,877� 4,163� 25,424� 7,627� 7,261� 2,178� 125,668� 37,700� 12,646� 3,794
More than� 0.2� 21� 4� 18,717� 3,743� 12,039� 2,408� 7,354� 1,471� 17,954 � 3,5915 years
After analyzing the data of IDLC Finance Ltd, we find the same results; short term deposit is the major source of deposit of IDLC Finance Ltd over last five year. (Table 6.1.3)
Table: 6.1.4 Year wise Structure of Deposit of United Finance Ltd (Amount in Lac Tk.)
Sourcesof Deposit
Prob
abilit
y
Deposit
2011
Withd-rawal
Deposit
2012
Withd-rawal
Deposit
2013
Withd-rawal
Deposit
2014
Withd-rawal
Deposit
2015
Withd-rawal
Up to 1 month� 0.9� 2,294� 2,064� 6,931� 6,238� 3,138� 2,824� 5,509�4,958 3,281� 2,953
1-3 months� 0.6� 40,357� 24,214� 45,416� 27,249� 44,785� 26,871� 51,933� 31,160� 57,915� 34,749
3-12 months� 0.4� 29,292� 11,717� 16,574� 6,630� 32,044� 12,817� 37,882� 15,153� 40,263� 16,105
1-5 years� 0.3� 6,087� 1,826� 20,748� 6,225� 17,898� 5,369� 11,479� 3,444� 17,420� 5,226
More than� 0.2� 641� 128� 472� 94� 548� 110� 467� 93� 510� 102 5 years
Short term deposit with maturity of 1 month or 1-3 month are getting popularity day by day, as the information of other two NBFI (IIDFC and United Finance Ltd) is also showing similar outcome. (Table 6.1.4 and Table 6.1.5).
Table: 6.1.3 Year wise Structure of Deposit of IDLC Finance Ltd (Amount in Lac Tk.)
Sourcesof Deposit
Prob
abilit
y
Deposit Withd-rawal
Deposit Withd-rawal
Deposit Withd-rawal
Deposit Withd-rawal
Deposit Withd-rawal
Up to 1 month� 0.9� 4,919� 4,427� 11,420� 10,278� 11,997� 10,797� 37,341� 33,607� 61,615� 55,453
1-3 months� 0.6� 66,755� 40,053� 104,006� 62,404� 135,572� 81,343� 203,491� 122,094� 256,010� 153,606
3-12 months� 0.4� 49,375� 19,750� 154,561� 61,824� 176,795� 70,718� 170,882� 68,353� 78,435� 31,374
1-5 years � 0.3� 127,535� 38,261� 37,960� 11,388� 61,159� 18,348� 36,343� 10,903� 133,752� 40,126
More than� 0.2� 6,818� 1,364� 1,440� 288� 1,257� 251� 5,430� 1,086� 8,765� 1,7535 years
Table: 6.1.5 Year wise Structure of Deposit of IIDFC
Sourcesof Deposit
Prob
abilit
y
Deposit Withd-rawal
Deposit Withd-rawal
Deposit Withd-rawal
Deposit Withd-rawal
Deposit Withd-rawal
Up to 1 month� 0.9� 4,685� 4,217� 1,848� 1,663� 7,026� 6,323� 10,031� 9,028� 944� 850
1-3 months � 0.6� 15,623� 9,374� 12,287� 7,372� 28,595� 17,157� 14,874� 8,924� 23,878� 14,327
3-12 months� 0.4� 9,847� 3,939� 7,701� 3,080� 6,906� 2,763� 21,093� 8,437� 29,488� 11,795
1-5 years � 0.3� 7,054� 2,116� 12,372� 3,712� 9,595� 2,879� 15,076� 4,523� 25,096� 7,529
More than� 0.2� 5,188� 1,038� 16,839� 3,368� 4,059� 812� 9,765� 1,953� 13,784� 2,7575 years
2011 2012 2013 2014 2015
2011 2012 2013 2014 2015

43 THE COST AND MANAGEMENTISSN 1817-5090, VOLUME-45, NUMBER-1, JANUARY-FEBRUARY 2017
8. Policy implication:Dependency on short term deposit indicates that the companies cannot preserve fund for long term period. This means those funds are to be liquidated more quickly, resulting in less liquid scenario. In order to improve their liquidity position, they need to accumulate fund from long term deposit. They should offer attractive interest rate for long term fixed deposit, so that people will find this as good source of savings and invest their surplus fund on long term fixed deposit.Companies should increase their loan activities to create positive liquidity.
9. Conclusion:The overall study has been conducted to evaluate the liquidity position of selected NBFI's and also make comparison regarding liquidity position. Our analysis is extended to the evaluation of the liquidity position of some selected non bank financial institutions in Bangladesh and compare among their liquidity position for the period of 2011 to 2015. From the entire analysis, we have found that total liquidity position of all the selected financial institutions are positive and increases year to year. But the growth rate of liquidity is fluctuated. The study also shows that most of the company's short term liquidity position is negative. The NBFIs are improving their liquidity position by maintaining positive long term liquidity gap for last five years.
Table 6.1.5 reveals that the major source of deposit of IIDFC Ltd over last five year is also short term deposits.
7. Findings:After analyzing the liquidity position of the selected NBFIs we have observed following findings.
a. Overall liquidity positions of the IDLC Finance are better than the others. However, Lanka Bangla Finance and Prime Finance are also close to IDLC for maintaining liquidity.
b. If we consider the short term liquidity position we have found that IIDFC and United Finance are more efficient than others.
c. In case of long term liquidity position of selected NBFIs, we have found that every company is efficient to maintain long term liquidity.
d. However the total amount of liquidity is the highest for IDLC Finance as they are the country's largest NBFI. Their total assets and liabilities are higher than others.
e. When we analyze the sources and uses of fund statements, we have found that only IDLC finance can maintain positive liquidity for most of the years.
Appendix: A
Net Liquidity GapNet Liquidity GapNet Liquidity GapNet Liquidity GapNet Liquidity Gap Average
2011 2012 2013 2014 2015
Up to 1 month 533,481 54,821,469 809,351,348 311,041,897 477,885,113 330,726,662
1-3 months 4,365,646 124,914,523 2,004,715,166 448,241,698 375,300,000 591,507,407
3-12 months 735,092 296,536,889 2,201,661,627 (176,350,242) (229,100,000) 418,696,673
1-5 years 3,922,873 219,786,840 (608,671,528) 32,869,607 216,803,136 (27,057,814)
More than 5 years 1,237,988,939 585,929,692 (2,985,538,559) 937,964,922 723,512,556 99,971,510
Total 1,247,545,031 1,281,989,413 1,421,518,054 1,553,767,882 1,564,400,805 1,413,844,237
Growth Rate 2.76% 10.88% 9.30% 0.68%
Table-01: Year wise Net Liquidity Gap of IIDFC
Net Liquidity Gap Net Liquidity Gap Net Liquidity GapNet Liquidity GapNet Liquidity Gap
2011 2012 2013 2014 2015
Up to 1 month 16,860,678 128,182,574 33,948,181 26,165,575 (247,184,537)
1-3 months 8,327,063 405,042,529 200,344,391 262,785,242 200,307,994
3-12 months 1,349,464,974 559,496,223 732,137,139 163,303,829 205,343,568
1-5 years 255,547,424 562,594,324 950,873,234 1,652,629,347 1,560,203,395
More than 5 years 164,481,984 299,081,715 248,069,828 320,520,50 979,853,580
Total 1,794,682,123 1,954,397,366 2,165,372,772 2,425,404,495 2,698,524,000
Growth Rate 8.90% 10.79% 12.01% 11.26%
Table - 02: Year wise Net Liquidity Gap of United Finance

44 THE COST AND MANAGEMENTISSN 1817-5090, VOLUME-45, NUMBER-1, JANUARY-FEBRUARY 2017
Reference
Anam, S., Hasan, S. B., Huda, H. A. E., Uddin, A. & Hossain, M. M. (2012), Liquidity Risk Management: a Comparative Study between Conventional and Islamic Banks of Bangladesh", Research Journal of Economics, Business and ICT, Volume 5, ISSN-2045-3345.
Akhter, S., & Rahman, S. (2013). Comparative analysis of liquidity position of Banks: A study on some selected Conventional and Islamic Banks in Bangladesh. Daffodil International University Journal of Business and Economics, Vol. 7, No. 1.
Barua, A. (2001).Liquidity Scenario in Commercial Banks of Bangladesh. Journal of Business Research, vol. 3.
Das, B. C., Chowdhury, M. M., Rahman, M. H., & Dey, N. K. (2015). Liquidity management and profitability analysis of private commercial banks in Bangladesh. International Journal of Economics, Commerce and Management, Vol. III, Issue 1, Jan 2015. ISSN 2348 0386.
Islam, M. M., & Chowdhury, H. A. (2009). A Comparative Study of Liquidity Management of an Islamic Bank and a Conventional Bank: The Evidence from Bangladesh. Journal of Islamic Economics, Banking and Finance, Volume-5, Number-1.
Mannan, M. A., Islamic Banking in Bangladesh: Progress and Potential. Islami Bank Bangladesh Limited.
Nilolaou, K. (2009) liquidity (risk) concepts, Definitions and interactions. Working paper series, no 1008.
Gup, Benton E. & Kolari, James W. Commercial Banking: The Management of Risk, 3rd Edition .
www.idlc.com
www.primefinancebd.com
https://www.lankabangla.com
www.iidfc.com
www.unitedevv.com
Net Liquidity GapNet Liquidity GapNet Liquidity GapNet Liquidity GapNet Liquidity Gap Average
2011 2012 2013 2014 2015
Up to 1 month (3,797,292,833) (143,574,652) 365,133,813 130,968,464 197,840,520 (649,384,938)
1-3 months (2,989,632,795) (134,769,546) 1,186,210,685 (309,674,508) (263,250,132) (502,223,259)
3-12 months 208,274,571 204,405,768 2,765,561,044 (484,083,161) (1,342,474,620) 270,336,720
1-5 years 3,515,671,845 1,106,807,080 1,827,982,618 1,952,882,035 3,678,000,718 2,416,268,859
Morethan 5 years 490,657,312 2,838,360,375 884,606,310 3,357,389,536 3,188,612,645 2,151,925,236
Total 1,844,678,098 3,871,229,023 7,029,494,469 4,647,482,366 5,458,729,132 4,570,322,618
Growth Rate 110% 82% -34% 17%
Table - 04: Year wise Net Liquidity Gap of Lanka Bangla
Net Liquidity GapNet Liquidity GapNet Liquidity GapNet Liquidity GapNet Liquidity Gap Average
2011 2012 2013 2014 2015
Up to 1 month 207,617,827 124,028,593 144,799,745 60,469,117 39,222,881 115,227,633
1-3 months 51,264,265 73,511,497 196,597,052 171,377,399 (223,253,170) 53,899,409
3-12 months 29,996,522 234,630,629 490,621,632 140,861,488 (3,073,455,815) (435,469,109)
1-5 years 3,090,773,274 1,053,142,086 1,449,705,617 1,896,331,696 279,150,901 1,553,820,715
Morethan 5 years 1,304,745,104 2,813,308,754 1,980,952,796 1,961,555,220 6,466,144,900 2,905,341,355
Total 4,684,396,992 4,298,621,559 4,262,676,842 4,230,590,920 3,487,809,697 4,192,819,202
Table - 05: Year wise Net Liquidity Gap of Prime Finance
Net Liquidity Gap Net Liquidity Gap Net Liquidity GapNet Liquidity GapNet Liquidity Gap
2011 2012 2013 2014 2015
Up to 1 month 798,113,133 315,142,767 (1,258,393,046) 1,356,394,554 (937,196,865)
1-3 months (219,634,835) (438,669,450) 2,759,112,434 (3,440,688,089) (3,183,290,768)
3-12 months (2,217,231,022) (6,000,375,358) (9,973,930,540) (11,997,644,303) (10,969,895,722)
1-5 years 2,973,097,915 7,190,825,019 7,565,126,664 12,424,834,047 12,287,510,066
Morethan 5 years 1,886,170,383 2,742,792,865 5,528,807,324 7,350,924,142 9,539,420,012
Total 3,220,515,574 3,809,715,843 4,620,722,835 5,693,820,351 6,736,546,722
Growth Rate 18% 21% 23% 18%
Table - 03: Year wise Net Liquidity Gap of IDLC

45 THE COST AND MANAGEMENTISSN 1817-5090, VOLUME-45, NUMBER-1, JANUARY-FEBRUARY 2017
Abstract
In this modern competitive banking era two banking stream are doing business in Bangladesh. One is conventional banking and another is Islamic banking. The purpose of this empirical study is to analyze and compare the performance of Islamic and conventional banking in Bangladesh and to find out which of the banking stream is performing better than other. For this study, sample of 15 conventional banks and 5 Islamic banks were selected. For in-depth understanding and sound comparison, key performance indicators were divided into external and internal bank factors. The external factor analysis includes studying the customer behavior and perception about both Islamic and conventional banking. Internal factor analysis includes measure of differences in performance of Islamic and conventional banks in terms of profitability, liquidity, credit risk and solvency. Nine financial ratios were used to gauge profitability, liquidity and credit risk; and a model known as "Bank-o-meter" is used to gauge solvency. Summery result of the study was found that in terms of profitability, liquidity and credit risk management conventional banking is in leading position, while in solvency maintenance Islamic banking dominates. Motivating factors for customers of Islamic banking is the Sharia's compliance, while in case of conventional banking it is wide range of services provided by them.
Keywords: Performance evaluation, Islamic banking, Conventional banking, Customer survey, Sharia's Compliance.
Md. Nur NabiAssociate ProfessorDepartment of Finance and Banking,[email protected]
Md. Omar FaruqueAssistant ProfessorDepartment of FinanceJagannath [email protected]
Fatema-Tuj-JoharaFormer student of master's programDept. of SociologyEden Mohila [email protected]
Islamic and Conventional Banks in Bangladesh:
A C o m p a r a t i v e S t u d y
FINANCIAL PERFORMANCE &CUSTOMER SATISFACTION of

46 THE COST AND MANAGEMENTISSN 1817-5090, VOLUME-45, NUMBER-1, JANUARY-FEBRUARY 2017
credit risk) conventional banking has performed better than Islamic banking. In last KPIs (solvency) performance of Islamic banking dominated the conventional banking. Survey results arealmost same for both streams of banking showing overall satisfaction for financial services. Major motivational factor for customers of Islamic banking was Sharia's compliance and for customers ofconventional banking it was facilities wide range of products provided.
Literature ReviewBanks performance can be measured both by using qualitative and quantitative methods and techniques. Different variables and statistical techniques have been used for analysis by different studies and results are drawn from them aiming at performance evaluation. Banks performance can be measured in terms of profitability, growth, efficiency, liquidity, credit risk performance, and solvency.
There is a general agreement in literature that conventional banks are superior to Islamic bankor mainstream banks in terms of their performance (Samad, 2004; awan, 2009; Rosly and Abu Bakar, 2003; Safiullah, 2010). Keeping in view the importance of banking sector, different studies have been carried out for evaluating performance of banks.
Iqbal (2001) studied the performance of conventional and Islamic banking. This study used data for the years 1990-98 and numerous hypothesis and general perceptions about the practice of Islamic banking have been tested. The techniques used to evaluate performance of Islamic banks was both trend and ratio analyses. The performance of Islamic banks was compared with conventional banks that are the control group.
Islamic banking is interest free banking; making it compulsory to take active part in business profit and loss sharing. Islamic banks prefer to take less risk. Sheikh & Ali (2009), in their paper analyzed the risk management procedures of Islamic banking by giving differential analysis of risk management based on unique characteristics. This paper has used ROE as a bench mark. A sample of two Islamic banks and two conventional banks was taken.
IntroductionEver expanding role of modern financial services has changed the way business is taking place in the market. Revolution in telecom sector duly utilized by financial sector has eliminated the physical presence of businessmen and geographical location of markets to transect the business. Banking sector has become vital for the development as well as smooth running of the economy of any nation on the planet. Till fourth quarter of 20th century, the whole financial sector world wide was operating on interest basis which is contradicting with injunctions of Islam and a large number of world population (Muslims) were at discomfort with the prevailing system, which led to the development of interest free (Sharia's compliant) banking.
Performance evaluation is an important tool to assess the success of any business including Islamic financial industry. For performance evaluation setting the benchmark is also vital to make the comparison of desired and actual performance. In this study we have explored the performance of both streams of banking (Conventional and Islamic). In order to study performance we have divided our population in two portfolios (conventional and Islamic) to conduct analysis. Our analysis consist of two phases; phase one consist of financial analysis for five years (2009-13) and includes profitability, liquidity management, credit risk management and solvency. To study the profitability we calculated ROA, ROE and cost to income ratio. For documenting liquidity management we calculated loan to asset ratio, liquid assets to deposits ratio and loan to deposits and borrowings ratio. In order to uncover credit risk management we calculated equity to total assets, equity to loans and percentage of impaired loans. Finally to determine the solvency we used bank-o-meter adopted from Sharet al (2010). Phase two of the studywas consisting of customer survey. Total 100 (50+50) questionnaires were filled by customers representing 5 Islamic and 15 conventional banks of Bangladesh.
Findings of study are very interesting. Out of the four financial analysis key performance indicators (KPIs) including profitability, liquidity, credit risk and solvency, in first three (profitability, liquidity &

47 THE COST AND MANAGEMENTISSN 1817-5090, VOLUME-45, NUMBER-1, JANUARY-FEBRUARY 2017
Jaffar and Manarvi ( 2011),examined and compared the performance of Islamic and conventional banks operating inside Pakistan during 2005 to 2009 by applying CAMEL test. A sample of 5 Islamic banks and 5 Conventional banks were selected to measure and compare their performance. CAMEL test is a standard test to check the health of financial institutions and to determine the performance of banks. Different ratios were used to evaluate eachelement of CAMEL. The study found that Islamic banks performed better in possessing adequate capital and better liquidity position while conventional banks pioneered in management quality and earning ability. Asset quality for both streams of banking was almost the same; conventional banks recorded slightly smaller loan loss ratio showing improved loan recovery policy whereas, UNCOL ratio analysis showed a nominal better performance for Islamic banks.
Safiullah (2010) did the comparative study of performance of interest based and interest free banking in Bangladesh. For this study four conventional banks and four Islamic banks were selected. The time period for this study was 5 years from 2004 to 2008. Ratio analysis was conducted to gauge business developments, profitability, liquidity and solvency, commitment to economy and community, efficiency and productivity of both banking streams. Results showed that conventional banks were doing better than Islamic banks based on commitment to economy & community, productivity and efficiency.
Profitability is also another measure to determine the performance of banks. Javaid, Anwar and Zaman (2011) gave the analysis of the determinants of top 10 banks' profitability in Pakistan over the period 2004-2008 using the pooled Ordinary Least Square (POLS) method to examine the impact of assets, loans, equity, and deposits on one of the major profitability indicators, return on assets (ROA). This study focused on internal factors only. The empirical results showed that these variables have a strong influence on the profitability. However, the results depicted that higher total assets may not necessarily lead to higher profits due to diseconomies of scales. Study also found that higher loans contribute towards profitability but their impact is not significant. However, equity and Deposits have considerable impact on profitability.
For measuring the efficiency of banks, studies have been carried out using different models. Percin and Ayan (2006) studied and evaluated the efficiency of commercial banks in Turkey using a Data Envelopment Analysis (DEA) and Malmquist Productivity Index (MPI) Methodologies. Akhtar (2010) also used Data Envelopment Analysis (DEA) and Malmquist Productivity Index (MPI) to see efficiency scores and productivity indices of banks in Saudi Arabia and concluded that technical inefficiency emerges from both scale as well as pure technical in efficiencies. The results on Malmquist Productivity Index (MPI) showed an improvement in average productivity of banks. The study also found that the major source of productivity gain was the efficiency change relative to technological change.
Bader et, al., (2008), documented that there is no difference between the overall efficiency of conventional and Islamic banks which includes cost, revenue and profit efficiency, after studying performance of 43 Islamic and 33 conventional banks for the period 1990 -2005 in 21 countries using Data Envelopment Analysis. This study assessed theaverage and overtime efficiency of banks basedon their size, age, and region using static and dynamic panels.
To check the vulnerability and solvency of banks, CLSA-stress test, CAMEL and Bank-o-meter are the models that are used in different studies conducted by various researchers. Shar,et, al; (2010a) studied and evaluated the performance and efficiency of banking sector using Credit Leona's Securities Asia stress test (CLSA-stress test). This study enclosed the period of pre and post nationalization of state owned and commercial banks of Pakistan. By using adjusted and unadjusted stress test, it has been analyzed that some banks are mediocre, under stress or sound in regard to the capital strength, assets quality, efficiency and liquidity. This study gauged solvency of individual banks. Shar-et, al; (2010) developed a model known as Bank-o-meter. Ability to predict which bank is defenseless to financial distress is of critical importance to investors, creditors, accountholders and many other stakeholders. For this purpose a model was developed called 'Bank-o-meter'. To confirm the accuracy of Bank-o-meter, it was applied on individual banks during the period 1999-2002 for gauging the solvency of each bank in Pakistan and the results were compared with CAMEL and CLSA-stress test.

48 THE COST AND MANAGEMENTISSN 1817-5090, VOLUME-45, NUMBER-1, JANUARY-FEBRUARY 2017
administered customer survey. Basically, the type of research that we have conducted is a combination of financial statement analysis, ratio analysis and banks external factor analysis of the two streams of banking operating in Bangladesh. We have measured banks performances on set critical factors that we think are specific to performance of any bank. We have calculated required ratios and have done necessary arithmetical and statistical working required to see the performance year wise. After all the working we have separate values for every bank year wise. We then applied mean and percentage to measure the performance sector wise. This gave us two comparative values foreach portfolio i.e. Islamic and conventional Banks on key performance indicators (KPIs), which are the basis of our conclusion.
Based on Literature we found that performance measure is a complex process, so for our better understanding and sound comparison, we have divided key performance indicators into (1) internal factors and (2) external factors. Internal factors include measure of differences in performance ofIslamic and conventional banks in terms of profitability, liquidity, credit risk and solvency. To measure these performance indicators we have used different ratios. The ratios which we have selected to gauge profitability, liquidity and credit risk have been used in a study by Samad (2004). To measure solvency of banks we have used a model named "Bank-o-meter", developed and tested by Shar, et, al; (2010). The selected parameters are explained below.
(1) Internal factors
(i) Profitability ratio:
Profitability is one of the widely used performance indicator to measure the performance of anybusiness. Like all other business, banks earn profit when their income is more than their expenses. Profitability ratios depict banks overall performance and efficiency. Three variables used for gauging profitability are:
(a) Return on Assets (ROA): Return on Assets (ROA) = Net Profit/Total Assets. ROA has been used in a lot of studies to measure the performance of banks. (Samad, 2004). [(See, Ben Naceur (2003) and Alkassim (2005) as cited by Javed, et. al; (2011)].
(b) Return on Equity (ROE): Second ratio used to gauge profitability was Return on Equity
External factor analysis is also important for measuring and evaluating performance of banks. Till date many studies have been conducted to evaluate performance of banks using external factors. From the study of Sheikh et, al; (2010), it was concluded that customers of both banks are satisfied with kinds of products both mediums are providing depending upon their nature. A questionnaire of 15 questions was distributed in banks of Bahawalpur.Muslim customers are mostly satisfied with Availability of ATM in several locations, phone account access, safety of funds, ease of opening a current account, bank image and reputation (Al- Hashash and Bahzadi, 2008). 650 questionnaires were distributed in different banks of Kuwait to measure satisfaction level of Islamic and conventional banks. Descriptive statistical tools and ANOVA test was being used to measure customer satisfaction. The results showed a slight degree of difference in customer satisfaction of both streams. The worst factor noted in the study was interest on loans.
Objectives and Methodology of the study:The purpose of this study is to conduct comparative performance evaluation of Islamic & Conventional bankingsectors in Bangladesh in order to document the results of each sector during period under review. This study will help in channelizing resources in future including deposits, finances, investments and other banking services. In summary following are research questions:
1. Which of the banking stream is relatively more profitable?
2. Which of the banking sector is relatively more liquid?
3. Which of the banking sector is exposed to relatively more credit risk?
4. Which of the banking stream is more solvent?
5. Which of the banks is best performer in both streams?
6. Which of the banking stream has relatively more satisfied customers?
In order to achieve the objectives listed above we selected period of 5 years (2009-2013) and included 15 conventional banks and 5 Islamic banks. To answer the risk and return relationship (first four questions) we calculated financial ratios and for last question we

49 THE COST AND MANAGEMENTISSN 1817-5090, VOLUME-45, NUMBER-1, JANUARY-FEBRUARY 2017
higher the LdCDSF, the more liquid is bank. Excess liquidity decreases earning capacity of the bank.
(c) Net Loans to Deposits and Borrowing (LDBR): Third ratio used to gauge the liquidity was Net Loans to Deposits and Borrowing (NetLD&B) = Net Loans/Total Deposits and Borrowing. This ratio depicts the percentage of total deposits and borrowings that are entrenched into non-liquid asset. The higher the LDBR, the higher is the chance that bank face liquidity risk. Lower the ratio the earning of the bank reduces.
(iii) Credit risk measurement:
Credit risk can be defined as Credit risk arises from the potential that an obligor is either unwilling to perform on an obligation or its ability to perform such obligation is impaired resulting in economic loss to the bank. Hence, Credit risk is the risk of loss that arises from a borrower's or counterparty's inability to meet its obligations. For any financial institution measuring and managing credit risk is very important.
(a) Common Equity to Total Assets (EQTA): First ratio used to gauge credit risk was Common Equity to Total Assets (EQTA)= Common Equity/Assets. This ratio shows common equity as a percentage of total assets. EQTA provides percentage protection required to meet the expense by banks to its investment in asset. It shows the overall shock captivating capacity of a bank for possible expected or unpredicted loan asset losses. The superior the ratio of EQTA, the larger is the capacity for a bank to soak up the assets losses (Samad, 2004).
(b) Total Equity to Net Loans (EQL): Second parameter used was Total Equity to Net Loans (EQL) = Total Equity/Net Loans. This ratio shows the total equity capital as a percentage of total net loans. EQL provides equity as a cushion to take in or adjust loan losses faced by a bank. The higher the ratio of EQL, the higher is the capacity for a bank in absorbing loan losses.
(c) Impaired Loans to Gross Loans (IMLGL): Third parameter used was Impaired Loans to Gross Loans (IMLGL) = Impaired Loans/Gross Loans. This ratio indicates the percentage of nonperforming loans or badloans to gross loans that a bank has on its books. This ratio also assesses the quality of assets or loans of the bank. The lower the ratio of IMLGL, the better is the asset/credit performance of the bank.
(ROE) = Net Profit/Equity. ROE tells the return owners earn on their investment in bank. ROE is of great concern to the investors and shareholders. ROE measures the efficiency of banks in making profits from every unit of shareholders equity/bank capital [(Gul, Irshad and Zaman (2011)]. Potential investors look for ROE before investing in a bank so it is important for a bank to have a higher ROE. Higher the ROE, more efficient the banks performance is.
(c) Cost to income Ratio (COSR): Third parameter to gauge profitability was Cost income Ratio (COSR) = Total cost/Total income. According to Tripe Cost to income ratio is defined as non interest costs excluding bad debts and doubtful expenses, divided by total of interest income and non-interest income. COSR depicts the income generated per dollar cost incurred. Lower the cost to income ratio, better the bank's performance.
(ii) Liquidity ratio:
Maintaining liquidity in all circumstances is one of the major challenges that banks face. Liquidity of a bank means the ability of a bank to meet the financial obligations as and when due. Liquidity tells the capability of a bank to convert its assets into cash at the face value and meet the demands of customers, borrowers and depositors at the time they need it. Liquidity is a prime parameter of banking risk. In order to asses liquidity following ratios were used.
(a) Net Loans to Asset Ratio (NetLTA): First was Net Loans to Asset Ratio (NetLTA) = Net loans/Asset Ratio.This ratio shows the percentage of loans that are rooted in assets. The net loans to assets ratio measure the net loans outstanding as a percentage of total assets. The higher this ratio, lower is the banks liquidity and the bank is tied up in loans. The higher the ratio the more risky a bank is to higher default.
(b) Liquid Assets to Customer Deposits and Short Term Funds Ratio (LdCDSF): Second ratio used was Liquid Assets to Customer Deposits and Short Term Funds Ratio (LdCDSF)= Liquid Asset/Customer deposit and short term funds. According to Samad (2004), LdCDSF is a deposit run off ratio. This ratio shows the percentage of deposit and short term funds that are available to meet the sudden withdrawals. The

50 THE COST AND MANAGEMENTISSN 1817-5090, VOLUME-45, NUMBER-1, JANUARY-FEBRUARY 2017
Islamic Bank Conventional BankAl Arafah Islami Bank Pubali BankFirst Securities Islami Bank Sonali Bank LimitedShahjalal Islami Bank BRAC BankEXIM Islami Bank Rupali BankSocial Islami Bank Janata BankIslami bank Bangladesh limited Dutch Bangla Bank Mercantile Bank
Table 1: Sample of Islamic & Conventional banks forCustomer Survey
questions. For closed ended questions, we developed a scale from one to five to judge the satisfaction level. Open ended questions are more related to customer choice answer and suggestions for improvement. Open ended questions are designed just to ensure that nothing is being left out in evaluating customer choices and prime motivation factors towards selection of a bank. The questions asked by all customers are same, except that two adjustments have been made for Islamic banking questionnaire which is profit and loss sharing and banking Shari'a policies. In our study, the external factor analysis includes studying the customer behavior and perception about Islamic and conventional banking. We have explored the performance of Islamic banks and the conventional banks competitively by quality of the facilities (products and services) they are providing to their customers and satisfactory level of the customers. Our study aims to find the factors that are motivating customersto the Islamic banks and the factors that are motivating customers to the conventional banks in Bangladesh. 5 Islamic and 15 conventional banks have been selected based on random sampling. 100 questionnaires were distributed in different branches of selected banks, 50 being filled out by customers of each stream. Branches of all banksin our sample and other are also selected by applying random sampling technique. Questionnaires are developed for both Islamic and conventional banking.
Main source of data collection for our study is secondary data which is extracted from the financial statements of banks. Primary data collection techniques used for conducting external factor analysis, for both Islamic and conventional banking includes Questionnaires filled by customers.
Empirical Results and AnalysisIn this section results and analysis are presented in two subsections. In subsection one
(iv) Solvency Analysis:
The ability to predict weakness and reliability of banks in financial distress is of vital importance to central banks, creditors and to equity investors. When a bank goes insolvent, creditors often lose portion of principal and interest payments, while equity investors can potentially lose all of their investment (Shar, et, al; 2010). To measure solvency of banks, we will use a model know as Bank-o-meter developed by Shar, et, al; (2010).
Bank-o-meter: Bank-o-meter has a quality that it uses minimum parameters and gives more accurate results on solvency of banks. Shar, Shah and Jamali, 2010; used following parameters in this model:
S = 1.5* CA+1.2*EA +3.5* CAR+0.6*NPL+0.3*CI+0.4*LA
v Where 'S' stands for solvencyv CAR stands for capital adequacy ratiov CA stands for capital assets ratiov EA stands for equity to assetsv NPL stands for non-performing loans to loansv CI stands for cost to incomev LA stands for loans to assets
50<S<70. All banks having 'S' value greater than 70 are solvent and termed as super soundbanks, while those banks having 'S' value below 50 are not solvent. The area between 50 and 70 isdefined as gray area because of the susceptibility to error classification (Altman, 1968 as cited by Shar, et, al; 2010)
(2) External factors:
In order to answer the last question we have incorporated one non-financial performance Indicator that is customer satisfaction. It is an external bank factor. We have judged bank performancein accordance with the customers' perception on the factors we identified based on the nature and the functions we considered vital for effective performance of both banking streams. We took customer satisfaction as a fifth KPI because irrespective of what type of organization it is, the main focus of every business is to achieve maximum customer satisfaction to beat competitors in the market and earn higher profits. To judge customers on their satisfaction level, we made two questionnaires for customers from both banking streams. The questionnaire comprises of eight close ended questions and 2 open ended

51 THE COST AND MANAGEMENTISSN 1817-5090, VOLUME-45, NUMBER-1, JANUARY-FEBRUARY 2017
Table 2: Financial Performance of Islamic Vs Conventional Banking
Islamic banking sector is 68.11% while Net LTA of conventional banking sector is 61.22%. Higherratio of Islamic banking sector shows that this sector is tiedup in loans and has lower liquidity as compared to conventional banks. So, conventional banks are more liquid as compared to Islamic banks. LdCDSF (Liquid Assets to Customer Deposits and Short Term Funds Ratio) shows that there is nottoo much gap between the liquidity of both banking sectors, however conventional banking sector is more liquid as compared to Islamic banking sector as this ratio is higher for conventional banking. This obviously shows that conventional banks are more competent in meeting unexpected and sudden withdrawals as compared to Islamic banks. Net LD & B (Net Loans to Deposits and Borrowing ratio) of Islamic banking sector is 82.30% while that of conventional banking sector is 56.38%. Higher Net LD & B of Islamic banking sector shows that Islamic banks face more liquidity risk than conventional banking sector. Overall liquidity management of conventional banking is better than Islamic banking.
Credit risk of both banking sectors is depicted by EQTA, EQL and IMLGL. It depicts fromtable-2 that EQTA (Common Equity to Total Assets ratio) of Islamic banking sector is 8.23% while EQTA of conventional banking sector is 8.37% . Though EQTA of Islamic and conventional banks are almost same but it is providing evidence that Islamic banks have less capacity of absorbing asset losses as compared to conventional banks. This ratio also shows that conventional banks have more capacity to absorb potential expected or unexpected loan asset losses ascompared to Islamic banks. There is too much difference in the EQL (total equity to net loansratio) of both banking streams however, EQL of conventional banks (29.47%) is more than EQL of Islamic
financial analysis is presented while in second subsection results of customer survey is presented.
A. Financial AnalysisResults of financial analysis are presented in table 2 covering four core areas of profitability, liquidity,credit risk and solvency through simple sectoral averages for both streams of banking.
ROA, ROE and COSR are the financial measures that depict the profitability of Islamic banks and conventional banks. ROA of conventional banking sector is 1.61% which is higherthan Islamic banking sector that is 1.24% and this indicates that assets of conventional banks are capable of yieldingmore return than Islamic banks. Similarly ROE also shows that conventional banks are more profitable than Islamic banks which depicts that conventional banks are more efficient in generating profits fromevery unit of shareholders equity/bank capital. COSR (cost to income ratio) of Islamic banks is 30.54% which is quite lowas compared to conventional banks. So COSR shows that Islamic banks are performing better than conventional banks and also that Islamic banks are more efficient in generating income per dollar cost incurred, as compared to conventional banks, hence in profitability conventional banking stream is dominating in comparison of Islamic banking.
Three different indicators (Net LTA, LdCDSF, NetLD&B) are used to measure the liquidity risk of portfolios of Islamic and conventional banking. Net LTA (net loans to asset ratio) of

Performance measuresLeading Leading conventional bankislamic bankProfitabilityROA Mercantile Bank Shahjalal Bank ROE Dutch Bangla Bank Shahjalal Bank COSR BRAC Bank Al-ArafahIslami BankLiquidity NetLTA Prime Bank Shahjalal Bank LdCDSF Bank Asia Social Islami Bank NetLD&BPrime Bank EXIM BankCredit Risk EQTA National Bank Shahjalal Bank EQL BRAC Bank Social Islami Bank IMLGL AB Bank Al ArafahIslami BankSolvency Prime Bank EXIM Bank
52 THE COST AND MANAGEMENTISSN 1817-5090, VOLUME-45, NUMBER-1, JANUARY-FEBRUARY 2017
Table 3: Five years average result of conventional Banking stream
Ratios AB Jamuna Asia Brac DBBL EBL IFIC MercantileMTBLNationalPremierPrimePubaliRupaliUttara
ROA 2.22 0.97 2.41 1.08 1.69 1.46 1.31 3.81 3.81 0.36 1.24 2.02 1.87 2.13 1.07
ROE 16.77 21.07 21.07 7.69 25.24 12.45 22.18 14.36 14.36 0.90 13.62 4.50 21.37 20.3112.52
COSR 39.64 86.42 86.42 35.74 45.64 39.80 53.27 57.35 57.35 80.59 50.26 64.4453.85 43.5655.29
Net LTA 68.14 69.48 52.00 67.02 60.70 61.64 55.74 69.07 62.63 66.56 65.58 70.3251.69 44.0453.76
LdCDSF 8.20 11.98 28.69 23.28 12.75 3.50 11.05 9.34 10.30 10.00 9.85 10.0213.22 11.0013.43
NetLD&B64.25 57.82 63.56 56.11 52.11 57.98 56.89 46.33 61.54 50.69 58.51 42.1264.56 52.5260.72
EQTA 9.41 9.04 8.67 7.25 6.67 9.82 7.01 7.76 6.28 11.58 9.14 9.63 9.93 4.34 9.05
EQL 14.55 12.81 80.73170.8229.14 18.32 10.62 11.27 10.12 14.96 13.94 13.9815.08 10.4015.34
IMLGL 0.31 0.97 0.47 4.93 0.53 10.67 3.02 2.60 2.60 0.19 0.67 0.33 0.40 0.72 0.50
Table 5: Leading Banks in Each Banking StreamTable 4: Five years average result ofIslamic Banking stream
Ratio AL -arafah FSIBLSocial islamiShahjalal EXIM
ROA 1.4232 0.68 1.284 1.6194 1.18
ROE 15.406 1.482 20.502 21.48 12.832
COSR 4.72 48.786 31.512 34.044 33.62
NetLTA 44.768 65.974 65.568 86.328 77.896
LdCDSF 9.854 11.808 13.7966 12.29412.5512
NetLD&B 79.856 81.912 82.436 90.142 77.174
EQTA 7.35 5.086 9.048 8.10810.1508
EQL 9.87 6.59 13.712 10.9612.3438
IMLGL 0.0670.115159 0.4396 0.5744 0.3663
In this study we have not only traced out which banking medium is performing ahead of other but we have also traced out that which of the banks in each banking stream is performing better than allothers in terms of profitability, liquidity, credit risk and solvency. Following table-3 gives a glance ofthe leading banks in terms of profitability, liquidity, credit risk and solvency.
Performance measurement in case of individual bank of both stream Shahjalal Bank is at top followed by Social Islami Bank and EXIM Islami Bank from Islamic banking stream. While in case of conventional banking Prime bank is at top followed by BRAC bank, Mercantile bank, Dutch Bangla bank, AB bank and Bank Asia. Out of ten financial ratios Shahjalal Bank is topped in four, Prime bankis topped in three and Al Arafah Islami Bank, BRAC Bank, EXIM Bank, Social Islami Bank are topped in two during study period.
B. Customer Survey ResultsSurvey was conducted with different age group of both banking stream. Most of the respondent customers are highly educated. Correspondents are combination of male and female. Majority of correspondents have more than 3 years of experience with their particular bank.
banks (11.18%) which depicts that conventional banking sector is more proficient in absorbing loan losses as compared to Islamic banking sector. IMLGL (Impaired Loans to Gross Loans)of Islamic banking sector (0.36%) is much lower than conventional banking sector (1.77%). This clearly shows that the quality of assets or loans of Islamic banks is better than conventional banks. Credit risk performance of Islamic banking sector is better than credit risk performance of conventional banking sector. Overall dominance of conventional banking in credit risk management is depicted in thisstudy.
To gauge the solvency of each banking sector we have used Bank-o-meter. It was found in our Bank-o-meter analysis is that Bank-o-meter ratio of Islamic banking sector and conventional banking sector are 102.8882 and 95.15 respectively. It is depicted that both the banking sectors are solvent and super sound in the solvency measurement. Our analysis shows that Islamic banking sector is much sounder as compared to conventional banking sector. Solvency of Islamic banking sector is 102.8882 which show that this sector is sound and solvent. The solvency ofconventional banking sector is 95.15 which show that this sector is sound and solvent also but something less than the Islamic banking sector.

53 THE COST AND MANAGEMENTISSN 1817-5090, VOLUME-45, NUMBER-1, JANUARY-FEBRUARY 2017
Islamic banks operate on the principle of profit andloss sharing, Bank policies are according to Islamic Law and location of bank. However in case of conventional banks, maximum number of customers are mostly satisfied with the quality of service of e-banking provided by the bank followed by location of banks, interest rate customers get on their saving accounts or investments and Bank provides fast and efficient services. We know that both banking streams provide different types and different variety of products and services. Customers of conventional banks are more satisfied by the variety of products and services provided by the bank as compared to customers of Islamic banks. 24% customers of conventional banks are satisfied by therange and variety of products and services offered by conventional banks whereas 5% customers of Islamic banks are satisfied by the products and services offered by Islamic banks. Islamic banking isasset based banking, so it cannot diversify its product portfolio as much as of conventional banking. Now it is time to thinking for variety of products and servicesin Islamic banking to maintain its market share. In the customer survey it was depicted that 50% customers are dissatisfied with variety of products and services of Islamic banks. Shari 'a based banking is the only influencing factor that drives the potential customers of Islamic banking towards them.
Highest numbers of customers are fully satisfied with quality service of e-banking provided by conventional bank and second highest 45% numbers of customer are satisfied with Location of bank. There is a matter of concern for conventional banks arethose 40% customers are dissatisfied with Friendliness of bank personnel.
In the modern competitive banking era each of the banking stream are
Table 6, 7 & 8 depicts the results of the responses given by the customers of Islamic andconventional banks operating in Bangladesh. From the results presented above we can clearly see thatmost important factors that are motivating customers to go for Islamic banking are the Shari 'a compliance of Islamic banking. Customers that do business with Islamic banks strongly perceive and believe that the banking is based on the rules and guidelines of Shari 'a. While incase of conventional banking, factors that motivate customers are the wide range of products and services provided by the conventional banks and friendliness of personnel. Generally there's not much difference between the satisfaction level of customers of both Islamic banking and conventional banking in terms of providing fast and efficient services to the customers. Customers of Islamic banks are mostly satisfied by the friendliness of bank personnel, terms and conditions that exist for availing the products or services and the fact that

54 THE COST AND MANAGEMENTISSN 1817-5090, VOLUME-45, NUMBER-1, JANUARY-FEBRUARY 2017
using different types of factors for influencing the potential customers to opening bank account in the specific banking stream. In this study we have been considered eight different factors in questioner for the respondents. It was found that maximum number of customer of conventional banking stream influenced by the attractive facilities of conventional banks followed by return on investment. While only Shari'ah based banking is influencing factor of Islamic banking stream and other factors of Islamic banking cannot attract the customer.
ConclusionThis study covers five years period (2009-13) and includes total population of banking sector (15 conventional banks and 5 Islamic banks) to study the comparative performance of both streams of banking (Islamic and conventional). For performance study we constructed two portfolios of twostreams of banking to performance analysis and document findings in the form of sectoral averages. On thebasis of results we can conclude that in terms of profitability, liquidity & credit risk management conventional banking stream is performing better than Islamic banking. However under solvency maintenance performance of Islamic banking is better than conventional banking sector. Which shows the strength and soundness of this banking stream. Results of customer survey depictoverall satisfaction of customers with both banking streams. Among the factors we identified, singlemost important motivating factor for Islamic banking customer is the Shari'a compliance of Islamic banking (a unique selling point) which is lacking in its competitors. The most important motivating factor for conventional banking is facilities provided by the bank.
Islamic banking is a newly established stream of banking in Bangladesh and captures very little market share as compared to conventional banking. This could be the reason for lesser profitability and liquidity of this stream of banking, however sound credit risk management and solvency indicates the strength of this newly established business sector. Sharia compliance is the only difference of Islamic banking with conventional banking which must be ensured by practitioners. It is the unique selling proposition forthis industry and any weakness on this front can jeopardize its very existence. It is recommended to theusers of this study that size effect of both streams of banking must be kept in view while interpreting results and making decisions on their basis.
References
Akhtar, H., (2010). Technical Efficiency And Productivity Growth Of Saudi Banks: A DataEnvelopment Analysis Approach.Global Business Review11:2.
Al-Hashash, K., &Bahzadi, A. H., (2008). Banks Customer Satisfaction in Kuwait: An exploratory Study. Open University Malaysia (MBA Thesis).
Awan, A., (2009). Comparison of Islamic and Conventional BankingIn Pakistan, Proceedings 2ndCBRC, Lahore, Pakistan, November 14, 2009.
Bader, M.K.I., Mohamad, s., Ariff, M., & Hassan, T., (2008). Cost, revenue and profit efficiency of Islamic verses Conventional banks: International evidence using data envelopmentanalysis. Islamic Economic Studies15:2.
Gul, S., Irshad, F., &Zaman, K., (2011). Factors Affecting Bank Profitability in Pakistan. TheRomanian Economic Journal39.
Iqbal, M., (2001). Islamic And Conventional Ban king In The Nineties: A Comparative Study.Islamic Economic Studies8: 2.
Jaffar, M., &Manarvi, I.,(2011). Performance comparison of Islamic and Conventional banksinPakistan.Global Journal of Management And Business Research11: 1.
Javaid, S., Anwar, J., &Zaman, K., (2011). Determinants Of Bank Profitability In Pakistan:Internal Factor Analysis.Mediterranean Journal Of Social Sciences2: 1.
Percin, S., &Ayan, T.P., (2006). Measuring Efficiency Of Commercial Banks In A DevelopingEconomy: The Case Of Turkey.Investment Management And Financial Innovations3: 2.
Rosly, S.A., and Abubakar, M.A., (2003). Performance of Islamic and mainstream banks inMalaysia.International Journal of Social Economics 30:12.
Safiullah, M. (2010). Superiority of Conventional Banks & Islamic Banks of Bangladesh: A Comparative Study.International Journal of Economics and Finance2: 3.
Samad, A. (2004). Performance Of Interest-Free Islamic Banks Vis-À-Vis Inter est-BasedConventional Banks Of Bahrain,IIUM Journal Of Economics And Management12:2.
SBP-State Bank of Pakistan (2011). Quarterly Islamic Banking Bulletin, 2009-2011.
Shar,A., Ali, M., Jamali, H., (2010). Performance Evaluation Of Banking Sector In Pakistan:An Application Of Bankometer.International Journal of Business and Management5:8.
Shar,A., Ali, M., Jamali, H., (2010a). Performance Evaluation Of Pre-Post Nationalization OfBanking Sector In Pakistan: An Application Of Clsa-Stress Test.International Journal OfBusiness And Management5: 11.
Sheik, S.A., & Ali, A., (2009). Risk management in Islamic and conventional banking: adifferential analysis. Journal of Independent Studies and Research 7: 2.
Sheikh, M., Taseen, U., Haider, S.A., Naeem, M., (2010). Islamic Vs Conventional Banks inPakistan(A case study of Bahawalpur).Journal of Education Research
Tripe, D. Cost To Income Ratios In Australian Banking, Centre For Banking Studies,Massey University.

55 THE COST AND MANAGEMENTISSN 1817-5090, VOLUME-45, NUMBER-1, JANUARY-FEBRUARY 2017
Md. Eaqub Ali, PhD, MRSC, Associate Professor, Nanotechnology and Catalysis Research Centre, University of Malaya, Kuala Lumpur 50603, Malaysia, E-mail: [email protected]
Quality university graduates are a great future and hopes for a nation. They represent the dignity of our education and universities not only at homes but also abroad when they go for higher studies or for any other activities. Of course, some of our graduates have done excellent across world but they are the crème of the crème; not the real pictures of our bulk graduates. I have especially encountered some great problems with our science graduates; generally they are very week in creativity, problem solving and analytical skills and of course in communication. I cannot believe they have got low IQ and not willing to learn but I am convinced that there are great flaws in our education systems, especially with our teachers who are working in our highest institutions, the universities. It has already taken the chronic form and biting our national progress but we cannot blame our consumers for not being prudent without fixing a meter that can monitor how much gas they are using.
The current promotion criteria for university teachers in our beloved BD is very very funny and should be revised without any delay. The current system is based on time and if you join today with a master degree, after 12 years you will be professor without improving your quality and making any contribution to knowledge; this is very very funny, biting our nation, destroying the quality of our university education and of course dishonoring our professors and graduates to the international communities. In Physics, we have learnt that work is defined by force times distance (W=F x D); if you try to move a building for 100 years but fail to displace it from its original positions, you have done just zero work.
Our university professors are regarded highly intellectuals which means thay must contribute to the knowledge and innovation. Without bringing creativity inside themselves, nobody can inculcate such qualities to his/her apprentices. I have studied the profiles of American, European, Chinese, Malaysian and Indian Professors and I have found that all most all of them have published more than 30 papers in indexed journals and have minimum h-index 15. Unfortunately, most of our professors do not know what is h-index. The h-index is an author-level metric that attempts to measure both the productivity and citation impact of the publications of a scientist or scholar. You may publish 100 papers but if they are not cited by others, your h-index is zero; i.e. your work has failed to make any impact to the literature.
In Malaysia, each university lecturer has KPI which is called key performance index that determines promotion, increment and grading in a neutral way. If your KPI score is less than 50%, you might be terminated or lose your job; if it is 50-59% you may stay with your job but will not receive any salary incentives. On the other hand, if it is 60-84% you will receive salary increment but if it is above 85% you are exception and may be received promotion before your expected time. The KPI score comes from the following factors:
1. �Teaching and Learning2. �Student Supervision (PhD, Master, Final year project �� for undergrads)3. �Research and Publication4. �Research Grants5. �Innovation and commercialization6.�Collaboration and Networking7. �Recognition (National and International)8. �Membership in Professional Bodies9. �Administration10.�Discipline11.�Communication12.�Politeness 13.�Team work14.�Leadership15.�Community services or contribution to society and �� many more.
Bangladesh Universities and Professional Institutes may introduce this system in teacher grading to bring a positive change in higher education systems. Initially, our university teachers might be unhappy, but ultimately it will bring long term benefit in their career and of course to our graduates who are the future and hope of our nation. We have learnt that mother will not give you milk if you do not cry. If university teachers are promoted just on the basis of teaching experience, then I do not see much difference between them and school teachers who can teach but cannot think much. I feel very sad when I found some associate or full professors from my country are doing PhD in Malaysia or elsewhere and proudly telling people that are university professors in BD. It's a great shame for our nation and quality of our education. How a person can be promoted to such a highly dignified position in the 21st century perspectives where there no shortage of PhD holders? Many of our PhDs are not getting jobs; then why a master holder will be given such as a big post; are they super charismatic like Newton or Einstein? Our senior professors and policy makers should deeply think where are they are leading our future? May be they understand but do not like to take the initiatives because they fear that their juniors will be unhappy with them but you do not hesitate to be hard with your children if they neglect their studies despite being unhappy?
KEYPERFORMANCEINDEX:A Tool to Upgrade Teachers' Skills and toProduce Quality Professionals

56 THE COST AND MANAGEMENTISSN 1817-5090, VOLUME-45, NUMBER-1, JANUARY-FEBRUARY 2017
CMA career path has opened opportunities for CMAs of ICMAB to work as global conglomerate professionals. Mr. Monwar Hossain Chowdhury FCMA, ACMA (CIMA, UK), CGMA is a senior member of ICMAB and at present, he has been working as Country Finance Manager (Finance Head) and Board of Director at Intertek Bangladesh (Bangladesh Country Office of Intertek Group Plc.UK, a FTSE 100 Company) since 2003. When ICMAB signed an MoU with CIMA, UK in 2014 it gave him to get the benefit of full exemption from CIMA, UK, provided that a three hour online Strategic Case Study Exam is passed to receive CIMA UK designation. Mr. Monwar enrolled himself with CIMA, UK in early 2015 and passed the SCS Exam in the same year. This qualification provides Mr. Monwar with a great advantage and here he shares the details of his experience with us.
Mr. Monwar Hossain Chowdhury is a performance-driven management professional accountant with an extensive professional experience in Multinational and several large local companies of which, a substantial amount of time has been in a significant leadership and senior management role within the corporate finance function. In 1996, Monwar qualified as a CMA from the Institute of Cost and Management Accountants of
Bangladesh and is currently a Fellow Member of the Institute. He obtained his MBA major in Marketing from DarulIhsan University and M.Com. major in Finance from the University of Dhaka. Before joining Intertek, he worked in Singer Bangladesh Ltd., Square Pharmaceuticals Ltd. and Dhaka WASA at various capacities. He has an extensive experience and leadership exposure in corporate finance, cash management, controllership, solving complex finance problems of global magnitude, financial compliance, and managing diverse finance projects.
What is the secret to your success as a leader in the corporate environment?
Every profession requires honesty and sincerity. I personally believe, there is no single factor of success. It's a combination of various actions and results. We should be honest in our self-judgement, hard work, need continuous improvement and consistent performance, and above all, of course, blessings from the Almighty is very important. Success is not absolutely based on academic results and there are no standard definitions. It depends on how we set our goals and to what extent we want to reach and satisfy ourselves.
Mr. Monwar Hossain Chowdhury FCMA, ICMAB, qualified CIMA, UK Strategic Case Study Exam and awarded with ACMA (CIMA, UK) and CGMA designation
CMAsWorking in theCorporate World
This section focuses on reflections from CMAs of ICMAB working in global Conglomerates and how they have been preparing themselves to survive in the corporate arena and facing global competition.
INTERVIEWwith

57 THE COST AND MANAGEMENTISSN 1817-5090, VOLUME-45, NUMBER-1, JANUARY-FEBRUARY 2017
What other interests do you have and how do you fit these around your studies?
I always try to respect everyone irrespective of their position or status. I believe, honesty and sincerity should be the top most priorities for any one in life. As a member of CMA and the working area, most of us working as leaders or such, should be honest and sincere in our commitment as well as in the practical life. Balancing Work life is very important. I always value my work as well as my family by trying to spend quality time with my family and friends.
What do you suggest for the future leaders of CMA profession both at home and abroad?
We should work together and uphold the image of CMA as a profession instead of justfocusing on our ownpersonal interests. Different views and opinions have always been out there but for the betterment of the CMA profession itself, we should be united. During the election campaigns, I found that a few parties were somehow involved in a sort of blame game. This really upset me and I was shocked to see that the very people who swore to uphold the values of this organisations weren't doing so. We cannot let other professions to take advantage of such situations.We should overcome these issues by discussion among us.
CMA has inevitably become a part of our identity. The we behave reflects our identities and whatever we say will ultimately bounce back to us.
As a global professional, what are the challenges you are facing at your work place?
We are living in a spontaneously changing world. We should try to adopt to these changes and use them to benefit ourselves instead, and try to grow with change. Otherwise, it simply becomes impossible to survive. As a MNC, my company is not that exceptional. Changes in strategies, goals, actions, etc. are a common phenomenon. In fact, it is not really like we have a choice in this matter. It's either we like it or we are forced to like it. We should try to make ourselves as Fit for Future as possible
What are your long-term ambitions?
I believe in reciprocity. Born and grown up in Bangladesh, I really want to do right to this country. With whatever limited capacities I have, I would like to go on working for this country in every opportunity I get. And I also strongly believe development of oneself can never be done if others around him are in a dire state.
[Interviewed by Mr. Naba Krishna Muni FCMA, Editor, THE COST & MANAGEMENT.]
We should decide our goal first, then make a plan and work to achieve the target. The hunger for learning and continuous development is what I think is very important. We should adapt and absorb the change management, disciplined performance and try to deliver consistent results with precision, pace and passion.The main challenge here is how we tackle those problems and adapt to those changes, still somehow managing to put our best selves in front of others.
What does your job entail?
Currently, I'm working in Intertek Bangladesh as Country Finance Manager (Finance Head) and Board of Director since 2003.
Intertek Bangladesh is the affiliated company of Intertek Group Plc, a UK based public limited company. Intertek Group Plc is a leading Total Quality Assurance provider to industries worldwide. It has more than 1,000 laboratories and offices and over 42,000 people in more than 100 countries.
Under this role, I'm responsible for delivering key business and financial results through leading the country's finance team in, financial planning & reporting, tax & treasury and statutory financials. The role directly interacts with other local senior management, regional office in India and Intertek group office in London,
Why did you choose ICMAB for CMA designation?
Any kind of professional education and expertize knowledge makes value in practical life. I found, CMA is the best profession, where anyone can explore his/her career in the business arena. Be it an entrepreneur or a job holder. We can't survive in the modern world without financial knowledge. Financial knowledge for any business head brings the additional feather. CMA is the right place to acquire such knowledge. In my practical life, I have seen how the business managers struggle without such knowledge. CMA gives me the right track in my career.
CMA gives me the opportunity to step foot in the local business arena and CIMA helps further accelerate me up to the global platform. After completing the CIMA, I can now truly feel the taste of being a global professional.
Which part of the CMA learning have you found the most interesting and the most challenging?
Case study is what I found to be themost interesting part as it gives the examinee a taste of the problems faced by businesses in the corporate world. As I have been working for a long time in the multinational environment, I found that the similarities were quite evident. The most intriguing part is that, we should justify and convince the examiner by our logic, no matter the answer is positive or negative.
58 THE COST AND MANAGEMENTISSN 1817-5090, VOLUME-45, NUMBER-1, JANUARY-FEBRUARY 2017
The Journal is running a series of updates on IFRS, IAS, IFRIC and SIC. In this issue, Md. Monowar Hossain, FCMA, FCPA, CPFA(UK),FCS, FCA, former 'Consultant, ED, (Office of the Chief Accountant)' of BSEC, former GM, (ICC) of Rupali Bank Ltd., former Head of CGFRC, DSE, former Head of Finance & Company Secretary, Brummer & Partners AB, former Financial Management Consultant of ISS, Netherlands, has taken the responsibility to give a reflection of 'IFRS CHANGES FOR THE LAST YEAR AND LATER', who has been working with Agrani Bank Limited, a state owned commercial Bank having 936 branch networking with 14,000 employees, as GM & Head of Internal Control and Compliance (ICC).
recalculate the contracts or transactions under the new rules, compare the calculations with the amounts stated under the older rules and need to recognize a difference as one-off adjustment at 1 January 2017.
IFRS -16 applies from 2019, but strongly recommend dedicating more effort and work now and apply earlier, together with other two standards (IFRS-9 and IFRS-15), because this way only need to restate the financial statements once.
If apply IFRS-9 and IFRS-15 from 2018 and IFRS-16 from 2019, will need to restate twice with the disclosure. Regulators are also calling for more extensive, relevant and transparent disclosure.
3 Other changes applicable from 1 January 2018 or later
Besides the above, other smaller or bigger changes are coming, but they will not affect all companies.
IFRS-17: Insurance Contracts
The new insurance standard is expected in the first half of 2017. IASB agreed that the new IFRS-17 would be effective for the periods starting on or after 1 January 2021.
IFRS Changes for the last year and later
3 The changes applicable from 1 January 2018 or later
n IFRS-9: Financial Instruments - effective for the periods starting on or after 1 January 2018
n IFRS-15: Revenue from Contracts with Customers - effective for the periods starting on or after 1 January 2018
n IFRS-16: Leases - effective for the periods starting on or after 1 January 2019.
All of these standards affect almost every single company in some way. Some companies will not be affected that much, but some of them will suffer a lot and need a plan and budget to implement the changes.
In the year 2017, they are not mandatorily applicable, but be aware that need to present comparative amounts. Preparing financial statements for the year ended 31 December 2018, will have to show comparative amounts for the year ended 31 December 2017 restated under the new rules.
It means that the "transition date" or the application date be 1 January 2017. When
Update onIFRS, IAS, IFRIC and SICfor Professional Accountants

59 THE COST AND MANAGEMENTISSN 1817-5090, VOLUME-45, NUMBER-1, JANUARY-FEBRUARY 2017
We do have an insurance standard - IFRS-4: Insurance Contract, but it is very criticized because it does not contain unified model of accounting for insurance contracts and also it does not provide transparent information in the financial statements, and that is why IASB worked on the new insurance standard - IFRS-17. Amendment in IFRS-2: Share-based Payment
(Source: ifrsbox)
The newest amendment in IFRS-2 clarifies and amends the following transactions:
o Cash-settled share-based payment transactions that include a performance condition (vesting conditions)o Share-based payment transactions with net settlement features (mostly classified as equity-settled)o Modifications of share-based payment transactions from cash-settled to equity- settled.
This amendment is effective from 1 January 2018, with earlier application permitted. Amendment in IAS-40: Investment Property
The amendment provides further guidance on the transfers into or out of investment property. Such a transfer is possible only when there is a change in use of the property and that happens only if that property meets or ceases to meet the definition of investment property. So, a mere change in management's intentions is not sufficient evidence of change in use.
This amendment is effective from 1 January 2018, with earlier application permitted.
3 Changes were applicable from 1 January 2016
"Disclosure Initiative" changes (IAS-1, IAS-7)
What is "Disclosure Initiative"?It is a document published by IASB and in fact, it represents amendments to IAS-1: Presentation of Financial Statements.
The Disclosure Initiative should help the people preparing the IFRS financial statements, to use the judgement when making the reports.
Conditions Example How accounted for in cash settled liability? Vesting-non-market Target sales/profit l No impact on fair value. l Adjust number of awards expected to vest.Vesting-market Target share price l Adjust fair value at each reporting date until settlement.Non-vesting. Future commodity price l Adjust fair value at each reporting date until settlement.

60 THE COST AND MANAGEMENTISSN 1817-5090, VOLUME-45, NUMBER-1, JANUARY-FEBRUARY 2017
Namely, the amendments relate to:
l MaterialitySetting materiality is a difficult task for many preparers of IFRS financial statements and IASB has a special "materiality project" that should contain detailed guidance about materiality.
IAS-1 clarifies that, should not hide any useful information under the materiality cover and should not obscure the financial statements by stating lots of information about immaterial amounts.
l Statement of financial position and statement of profit or loss and other comprehensive incomecan aggregate or disaggregate the line items as relevant. IAS-1 contains certain considerations about subtotals and presenting entity's share of Other Comprehensive Income (OCI) of associates and joint ventures.
l Notes to the financial statementsshould consider understandability and comparability when deciding on the order of the notes. Can decide on own order (not necessarily the same as listed in IAS-1).
This amendment was applicable from 1 January 2016.
IAS-7: Statement of Cash Flows was amended under the Disclosure Initiative.
Under the new amendment, need to show disclosures about certain changes of liabilities from financing activities separately, namely:
l Changes from financing cash flows,l Changes arising from obtaining / losing control of subsidiaries or other businesses,l Effect of changes in foreign exchange rates,l Changes in fair values andl Other changes.
This amendment applies from 1 January 2017.
Consolidation and investment entities
Investment entities became exempt from preparing the consolidated financial statements, some time ago.IASB issued clarifications in this amendment.
Disclosure problem?
Disclosure Initiative
PODIASB
draftingguide
BetterDisclosurereq'ments
Reviewexisting
andproposedStandards
Addressindividualdisclosure
issues
TechnologyEnablingpreparer
judgement
Materially IAS 1
Not enough relevantinformation
Too much irrelevantinformation (overload) Poor communication
Improved disclosures
(source: ifrs)

61 THE COST AND MANAGEMENTISSN 1817-5090, VOLUME-45, NUMBER-1, JANUARY-FEBRUARY 2017
These clarifications relate to:l Intermediate parent who is a subsidiary of an investment entity does not need to consolidate;l A subsidiary who is an investment entity and provides services to the parent's investment activities should
not be consolidated;l Non-investment entity investor holding a share in an associate or joint venture who is an investment
entity can retain the fair value measurement applied by the associate or joint venture to its subsidiaries;l Disclosures are required under IFRS-12.
This amendment was applicable from 1 January 2016.
Amendment in IFRS-11: Joint Arrangements
Amendment in IAS-27: Separate Financial StatementsThe amendment permits using the equity method for measuring investment in subsidiaries, joint ventures and associates in investor's separate financial statements.
Few changes within "Annual Improvements 2012-2014" cycleAnnual improvement cycles are special projects of IASB that should improve the quality of IFRSs, their readability and understandability. These changes are not that significant and in most cases, they clarify guidance or correct the wording to be more understandable.The summary of changes were applicable from 1 January 2016:
l IFRS-5: Non-current Assets Held for Sale and Discontinued Operations - the change adds the guidance for reclassifications from "held for sale" to "held for distribution" (or the opposite way).
l IFRS-7: Financial Instruments - Disclosures: the amendment adds clarifications about servicing contracts and how IFRS-7 applies to condensed interim financial statements.
l IAS-19: Employee Benefits - The amendment clarifies that should use the high quality corporate bonds denominated in the same currency as benefits to be paid, in order to determine the discount rate for post-employment benefits.
l IAS-34: Interim Financial Reporting - The amendment explains "elsewhere" term and cross-referencing is required.
Amendments related to long-term assets (IAS-16, IAS-38 and IAS-41)IASB issued minor changes related to IAS-16, IAS-38 and IAS-41 in the year 2014 and these changes were mandatorily applicable from 1 January 2016 and they relate to:
l Bearer plants: they are living organisms, but should treat them as any other property, plant and equipment - i.e. at cost less accumulated depreciation rather than at fair value.
In joint operations, constituting a business,how to account for acquisitions of interests, that was unclear until this amendment was issued.
It classifies that when acquire an interest in a joint operation constituting a business, then need to apply all principles of business combinations accounting under IFRS-3: Business Combinations and other IFRS standards.
(Source: ifrsbox)

62 THE COST AND MANAGEMENTISSN 1817-5090, VOLUME-45, NUMBER-1, JANUARY-FEBRUARY 2017
Bearer plants are simply plants used solely to grow produce and therefore, they were covered by the standard IAS-41 : Agriculture as they were considered "biological assets". Examples: grape wines (but not the fruit grown on the grape wine); oil palms; apple trees, etc.
IAS- 41 requires carrying biological assets at their fair value.
The experiences shown that the sense of carrying bearer plants at fair value was questionable, because bearer plants are usually used for more than one period, they do not transform biologically (they don't grow) and they are used to produce some other assets.The newest amendment permits treating bearer plants under IAS-16: Property, Plant and Equipment instead of under IAS-41 : Agriculture.
l Bearer plants will be measured under IAS-16: Property, Plant and Equipment.l Produce from bearer plants will continue to be measured under IAS-41: Agriculture.
l Depreciation and amortization methods: nothing much changed, as there was only a clarification of acceptable depreciation or amortization methods issued.
The clarification says that the revenue-based methods of depreciation are not acceptable, as they reflect "generation of economic benefits by the asset" and not "consumption of an asset".
Example: can depreciate machine based on number of units produced by that machine. But should not depreciate the same machine based on the revenues expect to get from the sale of the produced units.
IFRS-14: Regulatory Deferral Accounts
The new standard IFRS-14 was issued in January 2014 and applies from 1 January 2016.
Unless preparing the IFRS financial statements for the first time and work in a company selling goods or services at prices regulated by some regulator, can forget everything about IFRS-14.
Conclusion
IFRS are continually changing. The above technical update is designed to help ensure that finance teams are aware of those changes, allowing them to consider the impact that they may have on their company.
Gain confidence with an update knowledge of IFRS, to help respond to the ever increasing complexity and changes in the financial reporting environment, professional accountants have to be developed him/herself as a specialist in IFRS - to support and achieve the organizational achievable positive goals. Companies in about 120 countries worldwide use and support IFRS, so the impact of regulatory changes under updated IFRS should understand by the professional accountants. Because the objective of general purpose financial reporting is to provide financial information about the reporting entity that is useful to existing and potential investors, lenders, creditors and other stakeholders in making decisions about providing resources to the entity through understand how recent changes to accounting standards may impact company analysis, stay up-to-date on changes that are in the pipeline, especially those that will impact financial statements. These would make it easier for public companies to compete abroad, raise capital, win global contracts, and provide financial details, and that's why we all have to know and understand the updated knowledge of IFRS. (Reference: ifrs, ifrsbox, ey, grant-thornton, etc).
The four most dangerous words in investing are: 'this time it's different.- Sir John Templeton

63 THE COST AND MANAGEMENTISSN 1817-5090, VOLUME-45, NUMBER-1, JANUARY-FEBRUARY 2017
The Journal is running a series of updates on Income Tax issues. In this issue of THE COST & MANAGEMENT, Mr. Kamrul Hoque Maruf FCMA has taken the responsibility to give a reflection of recent updates on Income Tax Issues related to Tax Heaven and Offshore Banking. Mr. Maruf is presently working with the Joint Director - Central Intelligence Cell, National Board of Revenue (NBR) as Joint Commissioner of Taxes.
International Tax Avoidance and Tax Havens
UPDATE ON INCOME TAX
Government loses corporate tax revenue from the shifting of profits and income into low-tax countries. The annual cost of offshore tax abuses is estimated to be around $ 100 billion per year. Tax avoidance and evasion may take different forms like a multinational firm constructs a factory in a low-tax jurisdiction rather than in a high tax jurisdiction to take advantage of low foreign corporate tax rates. There are many activities that are often referred to as avoidance but they can also be classified as evasion, such as transfer pricing. When a firm charge low prices for sales to low-tax affiliates but pay high prices for purchases from them. If these prices, which are supposed to be arm's length, are set at an artificial level, then this activity might be viewed as evasion. In case of tax avoidance and evasion terms like tax minimization, tax sheltering, and aggressive tax scheme or tax aggressiveness are frequently used. Therefore a clear understanding of their meaning and scope is very important.
Tax minimization refers to any activity that reduces explicit taxes. This includes tax concessions such as capital allowances, accelerated depreciation, and research and development tax deductions that are designed to encourage investment and growth in the economy. Tax avoidance refers to companies (and individuals) entering into transactions that have no economic significance, and with the sole or dominant purpose of reducing taxes. Tax sheltering is similar to tax avoidance, but usually refers to schemes that are marketed by tax consultants and sometimes involve a series of transactions in an attempt to disguise the ultimate nature of the arrangement.Tax evasion refers to activities that are illegal under tax legislation such as not reporting foreign income or claiming fraudulent deductions.
The decision to enter into an aggressive tax scheme involves balancing the costs and benefits involved. The main benefits of corporate tax aggressiveness are:
(I)�increased after-tax profits represented in a firm's performance metrics such as earnings per share;
(II) a reduced tax liability;
(III)�A reduced effective tax rate that can send a positive signal to investors, thereby reducing the cost of equity; and
(IV)�increased cash and liquidity;
The costs of tax aggressiveness include:(i) transaction costs incurred in setting up the tax planning
strategy, such as registration and legal fees to establish off-

64 THE COST AND MANAGEMENTISSN 1817-5090, VOLUME-45, NUMBER-1, JANUARY-FEBRUARY 2017
tax of newly established industrial undertakings, exemption from tax of new established physical infrastructure facility, exemption of income from the business of software development or Nationwide Telecommunication Transmission Network, Information Technology Enabled Services etc. However, these provision are there only for the industrial and economic development of Bangladesh.
Tax Havens - Jurisdictions:
Some jurisdictions have been identified as tax havens by OECD in 2000. The table below lists the countries that appear on various lists, arranged by geographic location.
The geographical distribution shows that the tax havens are concentrated in the Caribbean and West Indies and Europe.The OECD has three lists: a white list of countries implementing an agreed-upon standard, a gray list of countries that have committed to such a standard, and a black list of countries that have not committed. The gray list includes countries not identified as tax havens but as "other financial centers." Many counties that were listed on the OECD's original blacklist protested because of the negative publicity and many now point to having signed agreements to negotiate tax information exchange agreements (TIEA) and some have negotiated agreements. Most recently, the OECD has focused attention on its Base Erosion and Profit Shifting (BEPS) initiative. As part of this initiative the Global Forum on Transparency and Exchange of Information for Tax purposes has begun rating countries on various criteria. The countries are rated
shore subsidiaries;
(ii) the risk of detection if the activities are illegal, or in the "grey" area. However, the risk of detection increases as more firms engage in the same strategy, and also with the length of period a firm pursues the strategy;
(iii) the increased ability of managers to use the opaqueness required to disguise some transactions in order to extract rents for themselves; and
(iv) the incentives required to encourage the tax manager or director to engage in these activities, as they face personnel costs if detected.
There are further costs involved if the activity is detected and disallowed, such as:
a. the unpaid tax liability and back taxes;
b. tax benefits that may be disallowed;
c. interest on the tax deficiency;
d. penalties imposed on both managers and the firm; and
e. staffs and managers time along disruption from normal activities in order to comply with a tax audit.
In the discussion of tax avoidance or tax evasion or aggressive tax compliance literature the term which is most frequently used is tax haven. Global big corporate houses and multinationals often use tax haven as a tool to reduce tax liability. Therefore we need to know what a tax haven is. Although there is no precise definition of tax haven, according to the OECD definition, a tax haven refers to a country which imposes low or no tax, and it can be used by corporation to avoid taxes which otherwise would be payable in a high-tax country. Most tax havens are characterized by the following features: no or low taxes, lack of effective exchange of information, lack of transparency, and no requirement of substantial activity.Corporations often have very few assets and employees in tax havens and may only operate cash boxes in that jurisdiction to legally manage their affairs.
The presence of MNE's subsidiaries in tax haven jurisdictions through the use of shell companies may be a deliberate decision to take advantage of tax avoidance mechanisms. There are also some jurisdictions with statutory tax rates that are in line with global averages provides companies with individual incentives, to entice investment into the country. These incentives include tax holidays, reduced tax rates and patent boxes. These arrangements can encourage companies to transfer substantial portions of their global income to that jurisdiction, regardless of the economic activity that is actually occurring there. Income Tax Ordinance of Bangladesh have such provisions like exemption from
Caribbean/West Indies Anguilla, Antigua and Barbuda, Aruba, Bahamas, Barbados, British Virgin Islands, Cayman Islands, Dominica, Grenada, Montserrat, Netherlands Antilles, St. Kitts and Nevis, St. Lucia, St. Vincent and Grenadines, Turks and Caicos, U.S. Virgin Islands
Central America Belize, Costa Rica, Panama
Coast of East Asia Hong Kong, Macau, Singapore
Europe/Mediterranean Andorra, Chanel Islands (Guernsey and Jersey), Cyprus, Gibraltar, Isle of Man, Ireland, Liechtenstein, Luxembourg, Malta, Monaco, San Marino, Switzerland
Indian Ocean Maldives, Mauritius, Seychelles
Middle East Bahrain, Jordan, Lebanon
North Atlantic Bermuda
Pacific, South Pacific Cook Islands, Marshall Islands, Samoa, Nauru, Niue, Tonga, Vanuatu
West Africa Liberia

65 THE COST AND MANAGEMENTISSN 1817-5090, VOLUME-45, NUMBER-1, JANUARY-FEBRUARY 2017
A subsidiary of an MNE in a low corporate tax regime can lend money to a subsidiary in a high-tax regime. The debt repayments and interest expenses are then offset against corporation tax in the high-tax regime, thus reducing tax payments. In certain cases intra-company debt balances at certain companies may be many multiples higher than its external debt balances. Similarly, interest rates paid on intra-company debt may be multiples higher than interest rates paid on external debt. Lack of disclosures over intra-company debt enables abuses and keeps investors from being able to assess any earnings impact of potential regulatory changes.
Transfer Pricing:
The second major way that firms can shift profits from high-tax to low-tax jurisdictions is through the pricing of goods and services sold between affiliates. To properly reflect income, prices of goods and services sold by related companies should be the same as the prices that would be paid by unrelated parties. By lowering the price of goods and services sold by parents and affiliates in high-tax jurisdictions and raising the price of purchases, income can be shifted. An important and growing issue of transfer pricing is with the transfers to rights to intellectual property, or intangibles. If a parent developed in the United States is licensed to an affiliate in a low-tax country income will be shifted if the royalty or other payment is lower than the true value of the license. For many goods there are similar products sold or other methods such as cost plus or markup can be used to determine whether prices are set appropriately. Intangibles such as new inventions or new drugs, tend not to have comparables, and it is very difficult to know the royalty that would be paid in an arm-length price. Thus, intangibles represent particular problems for policing transfer pricing.
One problem with shifting profits to some tax haven jurisdictions is that if real activity is necessary to produce the intangibles, these countries may not have labor and other resources to undertake the activity. However, firms have developed techniques to take advantage of tax laws in other countries to achieve both a productive operation while shifting profits to no-tax jurisdictions. An example is the double Irish, Dutch sandwich method that has been used by some U.S. firms. In this arrangement, the U.S. firm transfers its intangible asset to the Irish holding company. This company has a subsidiary sales company that sells advertising (the source of Google's revenue) to Europe. However, sandwiched between the Irish holding company and the Irish sales subsidiary is a Dutch subsidiary, which collects royalties from the sales subsidiary and transfers them to the Irish holding company. The Irish holding company claims company management in Bermuda, with a 0% tax rate. This strategy allows the Irish operation to avoid even the low Irish tax of 12.5% and, by using the Dutch sandwich, to avoid Irish withholding taxes.
as compliant, largely compliant, partially compliant, or noncompliant. As of 2014, 71 countries have been reviewed out of which 42 countries have been rated as noncompliant.
There are criticisms that many countries are tax havens or have aspects of tax havens. But they are not treated as tax havens. These jurisdictions include countries such as the United States, the UK, the Netherlands, Denmark, Hungary, Iceland, Israel, Portugal, and Canada. Three States in the USA also gets focused, they are Delaware, Nevada and Wyoming. There are also some smaller countries or areas in countries that have been characterized as tax havens like Campioned'Italia, an Italian town located within Switzerland. Netherlands is often considered as a tax haven, particularly for corporations which allows firms to reduce taxes on dividends and capital gains from subsidiaries and for a wide range of treaties that reduce taxes. In 2006, Bono and other members of the U2 band moved their music publishing company from Ireland to the Netherlands after Ireland changed its tax treatment of music royalties. Newspaper report shows that the role of Netherlands in facilitating movement to tax havens through provisions such as the various "Dutch sandwiches", which allow money to be funneled out of other countries that would charge withholding taxes to non-European countries, to be passed on in turn to tax havens such as Bermuda and the Cayman Islands. These stories forced European Commission tobegin investigating whether certain arrangements in Ireland, Luxembourg, and the Netherlands constitute prohibited state aid.
Methods of Corporate of Tax Avoidance:
If a firm can shift profits to a low-tax jurisdiction from a high-tax one, its taxes will be reduced without affecting other aspects of the company. There are different methods for shifting profit from a high-tax jurisdiction to low-tax jurisdiction, such as allocation of Debt and Earnings Stripping, Transfer Pricing, Contract manufacturing, Hybrid Entities, and Hybrid Instruments, Cross Crediting and Sourcing Rules for Foreign Tax Credits.
Allocation of Debt and Earning Stripping:
Under this method of shifting profits from a high-tax jurisdiction to a low-tax jurisdiction, the taxpaying company borrow more in high-tax jurisdiction and less in the low-tax one. This shifting of debt can be achieved without changing the overall exposure of the firm. A more specific practice is referred to as earnings stripping, where either debt is associated with related firms or unrelated debt is not subject to tax by the recipient. As an example of the stripping method, a foreign parent may lend to its U.S. subsidiary. Alternatively, an unrelated foreign borrower not subject to tax on U.S. interest income might lend to a U.S. firm.

66 THE COST AND MANAGEMENTISSN 1817-5090, VOLUME-45, NUMBER-1, JANUARY-FEBRUARY 2017
OECD BEPS Project:
The project on Base Erosion and Profit Shifting (BEPS) was initiated by the Organization for Economic Cooperation and Development (OECD), and backed by the G20 world leaders in the St Petersburg Declaration of September 2013. Its final outputs were released on October 2015, approved by the OECD Council and the G20 Finance Ministers. The general aim of the BEPS reforms is to ensure that MNEs are taxed "where their economic activities take place, and value is created". However, these are still proposals, which need to be implemented through national law and administrative action, as well as tax treaty changes. The project will continue and pursue uncompleted work on some topics. Implementation will take three main forms:
l changes to national law, in some cases regionally coordinated;
l revisions of the OECD Transfer Pricing Guidelines (TPG); these are expected to be applied immediately through administrative action by OECD members, as well as by G20 states, although some may enact domestic regulations to apply their own versions;
l changes to tax treaties and their commentaries: a multilateral convention aiming to ensure rapid revisions to existing treaties is to be negotiated, open to all states; however, states will take their own decisions whether to ratify the convention, and it remains to be seen whether it will have a core package of provisions that must be accepted as a package, or be an optional list.
Hence, although its first stage is completed, the BEPS project entail a period of major changes in tax rules at every level, creating considerable uncertainty and risk. The approach chosen - to provide tax authorities with stronger tools, mainly to disallow deductions and to adjust transfer prices - will exacerbate the problem of uncertainty, since the proposals generally entails increased complexity, as well as depending on general principles involving subjectivity and discretion in their application. This will place considerable responsibility on both the tax officials charged with applying them, and companies and their tax advisers who must decide how to comply.
The main areas in which new rules or significant revisions will be introduced are:
a) Detailed templates have been agreed for MNEs to file in each country a Master File and a local file, to make it easier for tax authorities to audit transfer pricing. Also from 2017 every MNE with a turnover higher than US$1bn will be required to file a Country-by-Country Reporting (CBCR) with the tax authority where its parent is resident, to be sent automatically to every other country where it
Contract Manufacturing:
When a subsidiary is set up in a low-tax country and profit shifting occurs as in the acquisition of rights to an intangible, a further problem occurs: the low-tax country may not be a desirable place to actually manufacture and sell the product. For example, an Irish subsidiary's market may be in Germany and it would be desirable to manufacture in Germany. But to earn profits in Germany with its higher tax rate does not minimize taxes. Instead the Irish firm may contract with a German firm as a contract manufacturer, who will produce the item for cost plus a fixed markup.
Marketing Services and Trading Company Structures:
Companies can fragment functions (e.g. R&D, product design, logistics, transport, order fulfilment, or customer support) using marketing services or trading company structures, shifting profits from high-tax to low-tax jurisdictions. In a marketing services agreement, an MNE designates sales staff in high-tax jurisdictions as "marketing" personnel. Although these marketing personnel maintain sales relationships, the company's remote employees in a low-tax jurisdiction actually finalize the sale, so that the majority of the profit is then booked in the low-tax jurisdiction rather than in the high-tax jurisdiction when the real sales activity took place.
In a principal or trading company structure, the potential abuse comes when a company designates a subsidiary in a low-tax jurisdiction to control function such as ordering from third-party manufacturers and inventory management for the whole group, despite the actual products and inventory in many cases never flowing through the country where this subsidiary is based. The company will then state that subsidiaries in high-tax jurisdictions, which generally account for the bulk of sales, are simply responsible for distribution, in spite of the physical products being held or services to end customers being provided, in that jurisdiction.
Cross Crediting and Sourcing Rules for Foreign Tax Credits:
Income from a low-tax country that is received in a country can escape taxes because of cross crediting: the use of excess foreign taxes paid in one jurisdiction or one type of income to offset tax that would be due on other income. In the past the foreign tax credit was proposed on a country-by-country basis. Because firms can choose when to repatriate income, they can arrange realizations to maximize the benefits of the overall limit on the foreign tax credit. Firms that have income from jurisdictions with taxes in excess of U.S. taxes can also elect to realize income from jurisdictions with low taxes and use the excess credits to offset U.S. tax due on that income.
67 THE COST AND MANAGEMENTISSN 1817-5090, VOLUME-45, NUMBER-1, JANUARY-FEBRUARY 2017
lists a taxable entity; there is also a secondary mechanism for direct local filing if the country of the parent does not obtain or share the report. The CBCR is to be confidential to tax authorities, and must be used only for risk assessment. It must include a listing of every entity in the group, their country of formation and residence, and principal activity as well as a breakdown for each country of revenue, profit before income tax, income tax paid and accrued, number of employees, stated capital, retained earnings and tangible assets.
b) Deduction will be denied for payments to the extent that (i.e. in proportion that) they are not included in the income of the recipient, if this is because there is a different treatment in the countries involved in classification of the entity (e.g. it is considered to be a company in one country but a partnership in the other), or of the instrument (e.g. treated as debt in one but equity in the other). If the country of the payer does not deny a duplicate deduction or tax the payment; and taxation in the country of the payee has been adopted as the rule in the EU, under an amendment to the parent-subsidiary directive. The regulations proposed are highly complex, especially to deal with abstruse arrangements, e.g. imported mismatches, so may not be considered a high priority in smaller countries. They may also lead to attempts by tax planners to devise even more complex structures to avoid them.
c) Some chapters of transfer pricing guidelines have been extensively revised. The main effect is to give tax authorities greater powers to adjust prices of transactions between related parties, so that they reflect the actual functions performed, assets deployed, and risks assumed by the various parties. The intentions is the disallow attribution of significant profit to entities within a corporate group claiming to perform activities, such as management of intellectual property or financial management, unless they can be shown to have the genuine capacity to do so, while those transmitting capital (cash boxes) would get only a routine return. However, there is scope for considerable discretion, and hence disagreement, in evaluating functions, and especially deciding where risk is borne.
d) Countries are recommended to establish a fixed cap for deduction of interest, within a range of 10%-30% of either EBIT or EBITDA, with the possibility for the company to choose a group ratio if it is higher. This safety valve may make it easier for countries that already have a fixed cap to reduce it (a number of countries currently have a 30% cap, the US 50% plus specific deductions). Many countries are likely to change their rules along the lines
recommended - especially those that currently apply thin capitalization rules, which have been found to be ineffective - but since the report allows considerable flexibility, the rules are likely to vary significantly.
e) Tax incentive or preferences will be scrutinized under a peer-review system through the Forum on Harmful Tax Practices, with a strengthened requirement to show substantial economic activity in the country, and a nexus between expenditure on that activity and the income benefiting from the preference. An initial review found 16 innovation box regimes as wholly or partially non-compliant, and these should be revised. At the same time, the clarification of criteria is likely to encourage other countries to introduce regimes, and several have already announced their intention to introduce innovation boxes (e.g. Ireland, Italy and Switzerland). A procedure has also been agreed for automatic exchange of information on tax rulings between tax authorities, aiming to prevent sweetheart deals.
f) Revisions are proposed to the tax treaty definition of a permanent establishment (PE), which defines taxable presence. These will make it more difficult for a firm to avoid attributing profit from sales in a country if it has an affiliate or agent there that concludes the contracts, or performs sales-related functions, unless they are merely "preparatory or auxiliary".
g) Countries are encouraged to introduce requirements for disclosure of aggressive or abusive transactions, arrangements or structures, either by their promoters or users or both, with recommendations for rules targeting international schemes. Arrangements for exchange of information and cooperation between tax authorities regarding such schemes will be strengthened and extended.
References:
Jane G. Gravelle, 2015, Tax Havens: International Tax Avoidance and Evasion, Congressional Research Service Report.
Organization for Economic Development and Cooperation (OECD), 2000, Towards Global Tax Competition
Organization for Economic Development and Cooperation (OECD), 1998, Harmful Tax Competition: An Emerging Global Issue.
Dharmapala and James R. Hines, 2009, "Which Countries Become Tax Havens" Journal of Public Economics, Vol. 93, October 2009, pp. 1058-1068.
AthanasiaKarananou and Anastasia Guha, 2015, Engagement Guidance on Corporate tax Responsibility: Why and How to Engage with Your Investee Company,
Martin Sulivan, 2009, "Proposals to Fight Offshore Tax Evasion, Part 3", Tax Notes, pp. 515-520.

Macro-economy UpdateMonetary Policy Statement (MPS) (January-June 2017)
Bangladesh Bank declared the Monetary Policy Statement (MPS) for the second half of FY 2016-17 (January-June 2016) period. The MPS does not have any significant changes compared to the last MPS of 1H'FY2016-17. The Central Bank's focus on keeping inflation. No change in policy interest rate and/or reserve requirement.
As at November 2016, Broad Money (M2) witnessed a growth of 13.8% staying within the Bangladesh Bank's set target of 15.5%. M2 Growth target for FY17 remains unchanged at 15.5%. Inflation mostly remained passive during the 1H'FY17 supported by cautious monetary stance, modest pickup in commodity market and self-sufficiency in food sector. BB projects the inflation to be at 5.3%-5.6% during the 2nd half of FY2017. Domestic credit is projected to grow by 16.4% y-o-y in FY17, with credit to private sector credit growing by 16.5% and credit to the public sector by 15.9%, in line with the target set at 1H'FY17. Bank's policy interest rates (repo, reverse repo rates) will continue to remain unchanged at the current levels of 6.75% and 4.75%, respectively. At present the remittances have slowed down, BB's purchase of USD from the market to stabilize BDT/USD has been stalled momentarily. As a result, BDT has been depreciating continuously for the last 2-3 months.
Implications for Capital Market: Due to a rebounding private sector credit growth that touched 16.5%+ during mid 2016, the financial services industry has already witnessed a robust turnaround rally
in the beginning of 2017. As the capital market most recently witnessed a buoyancy, reflecting recovery from its depressed state since 2011, the Central Bank has called for caution to ensure that the exuberance does not become irrational. As the monetary policy largely remained unchanged, there is hardly any implication for the capital market.
68 THE COST AND MANAGEMENTISSN 1817-5090, VOLUME-45, NUMBER-1, JANUARY-FEBRUARY 2017
The Journal is running a series of updates on Dhaka Stock Market. In this issue of THE COST & MANAGEMENT, A.K. M. Shahidul Kirmany FCMA, CMA (CIMA, UK) has taken the responsibility to give a reflection of relevant changes and updates on the Dhaka Stock Market. The analysis of the Dhaka Stock Market has been done considering the period from October 2, 2016 to December 29, 2016. Mr. Kirmany is presently working with the VIPB Asset Management Company Limited as Chief Operating Officer.
Dhaka Stock MarketUPDATE ON
�Index� Open� Close� Point Change� % ChangeDSEX� 4,690.93� 5,036.05� 345.12� 7.36%DSES� 1,123.46� 1,191.87� 68.41� 6.09%DS30� 1,776.52� 1,810.91� 34.40� 1.94%
Changes in Indices (from October 2, 2016 to December 29, 2016)
2. Total market capitalization of DSE increase by1.05% to Tk. 2,855.50 billion as on December 29, 2016 from Tk. 2,708.08 billion on September 29, 2016. Banks, Pharmaceuticals & Chemicals, Telecommunication, Fuel & Power holds 16.95%, 15.19%, 14.12%, 12.62% of the market capitalization respectively.
Stock Market UpdatesOctober 2, 2016 to December 29, 2016
1. 1. The benchmark index of Dhaka Stock Exchange (DSEX) was up by 7.36% during the period. The daily turnover was highest on November 23, 2016.
DSE Performance (from October 2, 2016 to December 29, 2016)
DSEX and Turnover movement
Tota
l Val
ue in
Tk.
(mn)
DSE
X IN
DEX

69 THE COST AND MANAGEMENTISSN 1817-5090, VOLUME-45, NUMBER-1, JANUARY-FEBRUARY 2017
Sector % of totalMarket Cap
TurnoverTk in mn
Market CapTk in mn
% of totalturnover
TICKER� GAIN (%)� TICKER� LOSS (%)
FINEFOODS� 165.56%� ALLTEX� -46.86%
RAHIMAFOOD� 125.79%� BANGAS� -30.04%
SHASHADNIM� 105.08%� RAHIMTEXT� -28.98%
ZEALBANGLA� 104.59%� BSRMLTD� -28.31%
PENINSULA � 100.00%� TALLUSPIN� -27.81%
GHAIL � 98.15%� LIBRAINFU� -27.25%
SHYAMPSUG� 83.33%� LEGACYFOOT� -26.75%
BDAUTOCA � 71.59%� NORTHERN� -25.16%
REPUBLIC � 70.34%� MARICO� -24.63%
DSSL � 69.81%� MITHUNKNIT� -24.50%
Top ten gainer Top ten loser
Sectoral Market Capitalization and turnover(December 29, 2016)
�Sl� Name � Mkt.Cap.�% of total� No.�� Tk. Mn �Mkt. Cap.�1� Grameenphone Ltd.� 383,620.24� 13.43�2� Square Pharmaceuticals Ltd.� 170,868.95� 5.98�3� British American Tobacco Bangladesh �148,980.00� 5.22�4� Lafarge Surma Cement � 95,348.76� 3.34�5� Investment Corporation Of Bangladesh �66,128.91� 2.32�6� Renata Ltd. � 66,103.19� 2.31�7� Olympic Industries � 61,561.18� 2.16�8� Berger Paints Bangladesh Ltd. � 53,747.33� 1.88�9� United Power Generation � 51,392.97� 1.80�10�Titas Gas Trans. & Dist. Co � 48,867.56� 1.71
Top 10 Companies by Market Cap - December 29, 2016
Sectoral market capitalizationMiscellaneous
3.43%CorporateBond 0.21%
Banks16.95%
Insurance2.96%
MutualFunds1.23%
Food & AlliedProduct 8.20%
Pharmaceuticals &Chemicals15.19%
Textile3.67%Engineering
6.27%Ceramic0.90%
Tannery0.94%
Paper &Printing0.06%
Jute0.03%
Cement5.50%
Travel andLeisure0.88%
FinancialInstitutions
5.64%
Fuel &Power12.62%
Services &Realestate
079%
IT - Sector0.41%
Telecommunication14.12%
3. In December, 2016 the total turnover in the public market of DSE was up by 104.62 % to Tk. 177.80 billion from Tk. 86.89 billion in September, 2016.
4. Among the companies traded in DSE, FINEFOODS (165.56%), RAHIMAFOOD (125.79%) were the top gainer during the period September 29, 2016 to December 29, 2016. On the other hand the major loser companies during the period were ALLTEX (-46.86%), BANGAS (-30.04%).
5. Popular Life First Mutual Fund had the lowest Price/NAV ratio (49.51%) whereas Prime Finance First Mutual Fund was traded at highest Price/NAV ratio (107.14%). Price of ICB AMCL 1st NRB Mutual Fund increased by 10.65% during the period. Among the listed closed end funds, only Prime Finance First Mutual Fund traded at premium and rest of the funds at discount.
Sectoral Turnover (December 29, 2016)
Top ten gainers and losers in terms of market price(from September 29, 2016 to December 29, 2016)
Sectoral Turnover
Banks� 484,068.34� 16.95%� 15,042.86� 8.46%
Financial Institutions� 160,990.32� 5.64%� 11,968.94� 6.73%
Insurance� 84,553.15� 2.96%� 3,726.28� 2.10%
Mutual Funds� 35,078.88� 1.23%� 2,047.75� 1.15%
Food & Allied� 234,073.85� 8.20%� 11,355.97� 6.39%
Pharma& Chemicals� 433,712.47� 15.19%� 21,137.08� 11.89%
Textile� 104,911.51� 3.67%� 23,057.26� 12.97%
Engineering� 179,115.21� 6.27%� 38,637.82� 21.73%
Ceramic� 25,726.84� 0.90%� 2,253.51� 1.27%
Tannery� 26,895.48� 0.94%� 2,705.60� 1.52%
Paper & Printing� 1,621.08� 0.06%� 253.40� 0.14%
Jute� 983.99� 0.03%� 124.03� 0.07%
Cement� 156,993.90� 5.50%� 7,715.21� 4.34%
Fuel & Power� 360,271.24� 12.62%� 13,372.30� 7.52%
Services & Real estate� 22,663.65� 0.79%� 5,558.19� 3.13%
IT - Sector � 11,793.82� 0.41%� 5,397.58� 3.04%
Telecommunication � 403,178.03� 14.12%� 2,005.55� 1.13%
Travel and Leisure � 25,040.57� 0.88%� 3,897.01� 2.19%
Miscellaneous � 97,927.37� 3.43%� 7,535.26� 4.24%
Corporate Bond� 5,895.58� 0.21%� 10.45� 0.01%
Grand Total� 2,855,495.28� 100.00%� 177,802.05� 100.00%
PharmaceutTaTaT nnery0 94%
FinanciaInstitution
5.64%Sector.41%
14.12%
Engineering21.73%
Ceramic1.27%
Tannery1.52%
Paper & Printing.14%
Jute 0.07%
Cement 4.34%
Fuel & Power7.52%
Services & Realestate3.13%
IT - Sector3.04%
Telecommunication1.13%
Travel and Leisure2.19%
Miscellaneous4.24%
Corporate Bond0.01%
FinancialInstitutions
6.73%
Banks8.46%
Textile 12.97%
Insurance2.10%
Mutual Funds1.15%
Food & AlliedProduct 6.39%
Pharmaceuticals &Chemicals 11.89%
27%
In

70 THE COST AND MANAGEMENTISSN 1817-5090, VOLUME-45, NUMBER-1, JANUARY-FEBRUARY 2017
6. Fortune Shoes Limited was listed in October 20, 2016 and Yeakin Polymer Limited was listed on September 22, 2016.
7. The subscription period for CAPM BDBL Mutual Fund 01 was from October 16, 2016 to October 30, 2016.
8. Bangladesh Securities and Exchange Commission has included four new chartered accountancy firms in its panel of auditors as they have fulfilled regulatory requirements. After the inclusion, the total number of eligible chartered accountancy firms now stands at 40.
9. Private companies cannot join the bourses under the direct listing system, a regulatory measure to protect the interests ofinvestors as well as the capital market. Only the government companies or state-owned enterprises can apply the mechanism.
10. The World Federation of Exchanges in principle has decided to award full membership to the Dhaka Stock Exchange as the bourse has fulfilled all criteria required for the up-gradation. DSE which became demutualized in 2013, has been trying to increase
its international recognition by strengthening ties with international organizations.
11. The BTRC slapped a cash fine of Tk 30 crore on mobile operator Grameenphone for violating telecom rules by providing internet services under its "Go Broadband" brand. GP violated its license condition by providing internet connectivity to 551 branches of state-run Sonali Bank through its own fiber transmission.
Disclaimer:
Investing involves risk. The value of an investment and the income from it will fluctuate and investors may not get back the principal invested.
Past performance is not indicative of future performance. It is for informational purposes only. This document does not constitute investment advice or a recommendation to buy, sell or hold any security and shall not be deemed an offer to sell or a solicitation of an offer to buy any security.
Certain data used are derived from various sources believed to be reliable, but the accuracy or completeness of the data is not guaranteed and no liability is assumed for any direct or consequential losses arising from their use. This material has not been reviewed by any regulatory authorities.
Performance of Mutual Funds
POPULAR1MF� 10.56� 10.93� 4.70� 5.40� 3.50%� 14.89%� 49.41%IFIC1STMF� 10.42� 10.87� 4.90� 5.40� 4.32%� 10.20%� 49.68%PHPMF1� 10.35� 10.62� 4.70� 5.40� 2.61%� 14.89%� 50.85%ABB1STMF� 11.15� 11.46� 5.20� 5.90� 2.78%� 13.46%� 51.48%FBFIF� 10.83� 11.20� 6.60� 6.00� 3.42%� -9.09%� 53.57%TRUSTB1MF� 10.88� 11.20� 5.00� 6.00� 2.94%� 20.00%� 53.57%1JANATAMF� 10.75� 10.97� 4.90� 5.90� 2.05%� 20.41%� 53.78%EBL1STMF� 10.40� 10.74� 5.30� 6.20� 3.27%� 16.98%� 57.73%EBLNRBMF� 10.48� 10.76� 5.60� 6.90� 2.67%� 23.21%� 64.13%ICBAMCL2ND� 8.30� 9.17� 4.90� 6.00� 10.48%� 22.45%� 65.43%MBL1STMF� 10.70� 10.88� 7.00� 7.20� 1.68%� 2.86%� 66.18%PRIME1ICBA� 7.81� 8.40� 4.90� 5.60� 7.55%� 14.29%� 66.67%NCCBLMF1� 10.52� 10.76� 7.10� 7.30� 2.28%� 2.82%� 67.84%LRGLOBMF1� 10.56� 10.32� 7.20� 7.10� -2.27%� -1.39%� 68.80%GREENDELMF� 10.34� 10.59� 7.10� 7.30� 2.42%� 2.82%� 68.93%DBH1STMF� 10.26� 10.52� 7.10� 7.30� 2.53%� 2.82%� 69.39%ICB3RDNRB� 7.40� 8.06� 4.60� 5.60� 8.92%� 21.74%� 69.48%EXIM1STMF� 10.80� 11.18� 7.40� 7.90� 3.52%� 6.76%� 70.66%GRAMEENS2� 16.37� 17.32� 10.60� 12.30� 5.80%� 16.04%� 71.02%ICBSONALI1� 8.63� 8.83� 6.10� 6.40� 2.32%� 4.92%� 72.48%PF1STMF� 7.69� 8.27� 4.90� 6.00� 7.54%� 22.45%� 72.55%IFILISLMF1� 8.94� 9.60� 6.50� 7.10� 7.38%� 9.23%� 73.96%ICB2NDNRB� 10.09� 11.11� 7.80� 8.40� 10.11%� 7.69%� 75.61%AIBL1STIMF� 10.75� 10.94� 8.80� 8.30� 1.77%� -5.68%� 75.87%RELIANCE1� 11.74� 12.69� 8.20� 9.70� 8.09%� 18.29%� 76.44%ICBEPMF1S1� 7.50� 8.27� 6.00� 6.50� 10.27%� 8.33%� 78.60%ATCSLGF� 12.00� 12.42� 10.50� 10.60� 3.50%� 0.95%� 85.35%VAMLBDMF1� 11.15� 10.74� 9.40� 9.20� -3.68%� -2.13%� 85.66%SEBL1STMF� 13.03� 13.36� 11.80� 12.20� 2.53%� 3.39%� 91.32%NLI1STMF� 13.92� 14.26� 12.70� 13.10� 2.44%� 3.15%� 91.87%ICB1STNRB� 19.16� 21.20� 18.90� 20.50� 10.65%� 8.47%� 96.70%SEMLLECMF� 10.18� 10.19� 10.40� 10.00� 0.10%� -3.85%� 98.14%1STPRIMFMF� 10.40� 11.76� 9.20� 12.60� 13.08%� 36.96%� 107.14%
Name of the Fund
NAV
29-Sep2016
29-Dec2016
29-Sep2016
29-Dec2016
Closing Price% changein NAV
% changein price
Closingprice /NAV
Know what you own, and know why you own it.
- Peter Lynch

71 THE COST AND MANAGEMENTISSN 1817-5090, VOLUME-45, NUMBER-1, JANUARY-FEBRUARY 2017
WorldCMA Students'
This section focuses on reflections from young students of ICMAB and how they have been pursuing their CMA career path and facing
challenges in CMA study at the beginning of their career.
Why do you pursue CMA education from ICMAB? Explain in detail.
When I was studying in H.S.C, my father told me to be a girl that makes a glorious for not only my family but also for village. On B. Com study at Agrabad Mohila College, my teacher informed me that he study CMA course and advised me to admit in CMA Course after completion of B.Com. I came to Chittagong Branch of ICMAB to know the detailed enrollment procedure. I also came to know that ICMAB is a government institution and the institute has got international affiliations. The institute is one of the affiliate members of SAFA, CAPA, CIMA, CIPFA and ICAB, for mutual recognition with world class professional accounting bodies to strengthen its curriculum and mutual benefits. If anyone
INTERVIEWwithA CMA Student at Strategic Level ofICMAB, Chittagong Branch
CMA career path has opened for the students who completed their graduation could start the CMA education at the business level. ICMAB opened this career path to new generation students who have completed graduation in any discipline may start CMA education which has been considered as a career path of life time CMA profession in Bangladesh. This is an exciting career path for the new generation students of Bangladesh. The country has been growing witnessed by its development indicators but Indicators witnessed that Bangladesh has been growing but at the same time the corruption index rating has also been increasing. To address such circumstances, we need more cost & management accountants to combat corruption by establishing corporate governance, transparency, accountability and ethics at all levels in the value chain. This is a great opportunity for young talented students of Bangladesh to serve their motherland and play a much stronger role in the days ahead. We have about 160 million population but we have only about 3,000 qualified professional accountants (both CAs and CMAs). We have very poor ratio between professional accountants and population of the country in compare to neighboring countries. We welcome brilliant students to come to the most vibrant CMA profession to make a difference in their career path.
Asma Begum is a student of Final level (1800 Marks Completed) of ICMAB, Chittagong Branch and her registration number is 20113271. She comes of a religious family. She had completed S.S.C. at Rasullabad U.A. Khan High School, Nobinagar, Barahman Baria, H.S.C at Govt. Girl's College, Barahman Baria , B.Com. at Agrabad Mohila College, Chittagong and M. Com (Mangt.) Govt. Commerce College, Chittagong. She worked as Accounts Head in Chittagong Branch of Banglalion Communications Limited in 2011.

72 THE COST AND MANAGEMENTISSN 1817-5090, VOLUME-45, NUMBER-1, JANUARY-FEBRUARY 2017
enters into this profession and completes the course, s/he will be regarded as a prestigious professional citizen not in Bangladesh but also worldwide.
How do you make a comparison between CMA education and other academic qualifications?
To qualify a CMA course, will help me in looking for potential employments in challenging business world. Now without professional degree, it is hard to survive a better position in workplace. I think there is a far different between CMA education and other academic qualifications not only theoretically but also practical knowledge. CMA course provide CPD program for student in practical aspect which is unable to receive in academic education. CMA is a professional qualification that means a person who holds this qualification can give decisions independently following ICMAB value code. The members of this profession must have some ethical principles which are integrity, objectivity, confidentiality, professional competence and due care and professional behavior. Academic qualifications don't have such obligations.
What are the main challenges you faced in studying for CMA education?
Besides academic study, I engage myself in this course and continue my study. Due to marriage and a baby I cannot complete the course in time. Now, I again back to my study to complete my study in time. The other challenge is to make available the course materials, question papers and solutions of previous question papers. The students enrolled in Dhaka are getting more opportunities in terms of quality teaching, books and course materials, etc than other branches. If online lectures is arranged for Chittagong Branch Council students or other branch councils would be extremely beneficial for students.
Do you think that CMA qualification will help you to get added advantage in the job market?
In our country, there are many precincts in getting a proper job as per knowledge and expertise. Most of the employees work in different jobs which is not accomplishes which he getter in academic. Every time he face constraint in skilled human resource. Transparency, accountability and good governance in business world are always found a question! Moreover GOB takes a lot of project in around the country where a billion of Taka investment involved. JICA, World Bank a lot of development country wants to invest in structural and infrastructure development. To complete these projects on time as huge costs are involved and there are dire needs to have a proper accounting in recording expenses and income. To provide accurate services from qualified CMAs have no alternative. Bangladesh government is now taking qualified CMAs to do such valuable jobs. A CMA can get new jobs quickly and even switch to upper level easily compared to other academic graduates. CMA education can help us to have an access to a larger area of job opportunities growing recently.
What are the strategy you are following to complete the CMA education on schedule?
To complete the CMA course in time, it requires studies so much. Already I formed a group who are mindful, energetic and helpful to sharing each others. If I face any trouble beyond our group then communicate with senior mates and qualified member to have a full idea about the syllabus and then divided into many parts and make acceptable routine for course. I take some time for revision and study. I used to go to the library every day. Some one wishes to get CMA Qualification requires being involved in regular, right time, and proper study.
What do you expect to get from ICMAB as a student?
It expect that ICMAB world provide guideline and question pattern for the student so that no unexpected situation is created. Moreover, we need special guideline and advice from the teachers. We are outside form Dhaka. It online teaching is better for the students who are not in Dhaka. For CMA study requires new edition texts books and study materials. So, as a student I think that, all branches need update and relevant books available in the library. We also need a specific guideline on how we can pass the exams fasted. Now, overall the country and world has been changing so quickly and fasted. To meet these changes require specific job patterns and prospects, So, we expect the right and proper direction to face with the global challenging market from our institute. Teachers must have right training to improve their teaching efficiency and styles which help us giving the accurate instruction and appropriate guidance.
Could you remember any memorable event during your study at ICMAB?
I could not believe that I would not be able be going to have access to a larger world of knowledge and opportunities. The Office Bearers of ICMAB motivated and inspired us through their precious speech and advices. In addition the recent Qualified CMAs were also the speakers. They showed us the path of progress and told that CMA profession is a life time profession and sharing their knowledge and way to pass exam. Every profession have obligation to follow ethical values and norms. They gave us proper guideline and demonstrate the step to achieve the qualification of CMA. It is the most excited moment for me when I passed 6 subjects out of seven in level 1 and 2 in one exam.
To fulfill your future dream comes true, do you think the CMA qualification will be able to fulfill your aspirations?
As a woman, I have a lot of challenges to face than a man. When I got admitted to CMA education, faced tremendous and unexpected blockade to study. Very few women of our country are getting opportunity to fulfill their dreams. Women are always in question marks for doing anything even through better for the family and the country. They have the ability to work as side by side as a man. If I qualify CMA first, then I will be able to play a vital role in positioning our county economy ahead with my innovative ideas and energetic work. I believe that I must hold the top position of the company one day which I dreams with the help of this CMA.
[Interviewed by Mr. Naba Krishna Muni FCMA, Editor, THE COST & MANAGEMENT.]

73 THE COST AND MANAGEMENTISSN 1817-5090, VOLUME-44, NUMBER-6, JANUARY-FEBRUARY 2017
AGM OF ICMAB45th
The 45th Annual General Meeting of the Institute of Cost and Management Accountants of Bangladesh (ICMAB) was held on December 30, 2016 at ICMAB Ruhul Quddus Auditorium, ICMA Bhaban, Dhaka. Mr. Arif Khan FCMA, President of the Institute presided over the Meeting. Mr. Md. Abdur Rahman Khan FCMA, Secretary of the Institute presented the Annual Report for the year 2015-2016. Prof. Dr. Swapan Kumar Bala FCMA, Treasurer of the Institute presented the Audited Accounts and Financial Reports for the year 2015-2016. Significant numbers of Fellow and Associate members of the Institute spontaneously participated in the discussion on Annual Report throughout the day from 11:30 a.m. till 5:15 p.m. Mr. Jamal Ahmed Choudhury FCMA and Prof. Mamtaz Uddin Ahmed FCMA, Vice Presidents of the Institute replied to the questions raised by the members relating to the Examination and Education respectively. President, Secretary and Treasurer of the Institute replied to the questions in relation to Administration, Finance and other matters of the Institute. Past Presidents, Council Members and a large number of Fellow & Associate Members of the Institute attended the Annual General Meeting. President of the Institute Mr. Arif Khan FCMA announced the name of the 12 newly elected Councilors of 16th Council of ICMAB and declared the AGM closed at 7:45 p.m.

74 THE COST AND MANAGEMENTISSN 1817-5090, VOLUME-44, NUMBER-6, JANUARY-FEBRUARY 2017
President of the Institute Mr. Arif Khan FCMA announced the name of the 12 newly elected Councilors of 16th Council of ICMAB.
Election of 16th Council of the Institute for the term 2017-2019 was held on the 45th Annual General Meeting on December 30, 2016. A three-member Election Commission chaired by Mr. A.F.M. Amir Hossain FCMA (F-0085) and Mr. Md. Anowar Hossain FCMA (F-0089) & Mr. Md. Zahurul Islam, FCMA (F-0106) as the Members was formed under the CMA Regulations 1980 and Mr. Nazmus Salehin, Director (Corporate affairs Division) was the Secretary of the Election Commission. The commission released the election schedule on October 10, 2016. Twenty five candidates express their interest to serve the Institute as Councilors. Out of 1147 electoral 1065 casted their votes during the election schedule. Counting of votes started at 2.30 p.m. After counting of votes the Chairman of the Election Commission handed over the results of election to the President in the evening.
Counting of Votes ofthe 16th National Council Election-2016 of ICMAB
Counting of Votes ofthe 16th National Council Election-2016 of ICMAB
The President announced the election result before the members in the AGM. The 12 (twelve) elected Councilors for the three-year term (2017-2019) are as follows:
Name of the Candidates Fellowship Number
1.Mr. M. Abul Kalam Mazumdar FCMA F-0103
2.Mr. Abu Bakar Siddique FCMA F-0181
3.Prof. Mamtaz Uddin Ahmed FCMA F-0191
4.Mr. A. K. M. Delwer Hussain FCMA F-0215
5.Mr. Mohammed Salim FCMA F-0218
6.Mr. Arif Khan FCMA F-0304
7.Mr. Md. Abdur Rahman Khan FCMA F-0305
8.Mr. Md. Mamunur Rashid FCMA F-0314
9.Prof. Dr. Swapan Kumar Bala FCMA F-0328
10.Mr. Jamal Ahmed Choudhury FCMA F-0411
11.Mr. Md. Munirul Islam FCMA F-0412
12.Kazi Muhammad Ziauddin FCMA F-0870
Apart from the 12 elected members Governmentnominated 4 members are as follows:
i)Begum Shamima Yeasmin Additional Secretary Ministry of Commerce Govt. of Bangladesh
ii)Mr. A R M Nazmus Sakib Additional Secretary, Finance Division Ministry of Finance Govt. of Bangladesh
iii)Dr. Dilip Kumar Sharma ndc Additional Secretary Ministry of Industries Govt. of Bangladesh and
iv)Mr. Md. Aminul Islam Khan Joint Secretary Ministry of Education Govt. of Bangladesh
of thNational Council Election-201616 ICMAB

75 THE COST AND MANAGEMENTISSN 1817-5090, VOLUME-44, NUMBER-6, JANUARY-FEBRUARY 2017
The 16th Council of the Institute in its 1st meeting held on February 09, 2017 elected the following Office Bearers for the year 2017:
1.� Mr. Jamal Ahmed Choudhury FCMA� President
2.� Prof. Mamtaz Uddin Ahmed FCMA� Vice-President
3.� Mr. Mohammed Salim FCMA� Vice-President
4.� Mr. Md. Abdur Rahman Khan FCMA� Secretary
5.� Prof. Dr. Swapan Kumar Bala FCMA� Treasurer
New President of ICMAB Mr. Jamal Ahmed Choudhury FCMA presided over the 1st meeting of the 16th Council of the Institute held on February 09, 2017.
Institute's newly elected President Mr. Jamal Ahmed Choudhury FCMA is congratulated by immediatepast President Mr. Arif Khan FCMA on February 09, 2017 after assuming his presidentship.

76 THE COST AND MANAGEMENTISSN 1817-5090, VOLUME-44, NUMBER-6, JANUARY-FEBRUARY 2017
Mr. Jamal Ahmed Choudhury FCMA has been elected President of the Institute of Cost and Management Accountants of Bangladesh (ICMAB) in its meeting held on 09 February 2017. Prior to his new role, Mr. Jamal Ahmed Choudhury FCMA served the ICMAB as Vice-President in 2015 & 2016 and Secretary in 2014. He was also the Chairman (2005) of Dhaka Branch Council and Member of the National Council (2010-2013).
He is the Executive Director, Accounts & Finance, Beximco Pharmaceuticals Ltd. - a leading Pharmaceutical industry in the country. He has wealth of experience as a professional accountant in national and multinational companies. Mr. Choudhury takes keen interest in education and research. He has been a part-time faculty in several public and private universities for over a decade. He has to his credit, a good number of publications in national and international journals. He is a frequent contributor to the national dailies and writes on business, economy and finance related issues. He obtained his post-graduation in Accounting from the University of Dhaka and MBA from IBA.
President
Professor Mamtaz Uddin Ahmed FCMA has been working as a Professor in the Department of Accounting & Information Systems, University of Dhaka. He was the President of the ICMAB for 2007 and 2012, and Vice President for 2005 and 2006. He was the Secretary of the Dhaka Branch Council of ICMAB for 1991. Before joining as a faculty in Dhaka University on July 14, 1986, he served as a Lecturer in the Department of Accounting, University of Chittagong from April, 1984 to July 13, 1986. He is a life member of Bangladesh Economic Association; Independent Director, Chittagong Stock Exchange; Member, Board of Governors, Insurance Academy; Director, Ashuganj Power Station; Chairman, Governing Body, Sheikh Borhanuddin College, Dhaka. He was working as a nominated member of ICMAB at Advisory Committee of Road Fund Maintenance Board. He was elected member of Senate and Finance Committee of Dhaka University. He also served as a Consultant in different World Bank and GOB funded projects and acted as a resource person in different training programs. Professor Ahmed, a brilliant student, obtained 1st class/divisions with merit position in all public examinations. Prof. Ahmed acted as a Member of National Pay & Service Commission; Chairman, Dept. of Accounting & IS, Dhaka University; Director, Dhaka Power Distribution Company. He has more than 28 articles published in various recognized journals.
Vice President
Mr. Mohammed Salim FCMA was the President of the ICMAB for the year 2014 and was the Vice President in 2011, 2012 & 2013. He was the Secretary and Treasurer of the Institute in 2005 and 2006 respectively. He was Chairman and Treasurer of Dhaka Branch Council of ICMAB for the year 2001 and 1993 respectively. He was elected four times as member of Dhaka Branch Council for the years 1992, 1993, 1994 and 2001. Mr. Mohammed Salim FCMA is currently working as Financial Management Specialist in Central Procurement Technical Unit (CPTU), IMED of the Ministry of Planning of the Government of Bangladesh. Mr. Salim obtained his Masters of Business Administration (MBA) in Finance and Diploma of Management Studies (DMS) from University of Hull (UK) in 1995 and 1997 respectively. He is also a member of National Institute of Accountants (NIA), Australia. Mr. Salim participated in many training programs and seminars on financial issues, Energy and Power Management etc. in home and abroad. Mr. Salim is a widely traveled man.
Vice President
New Office Bearersof the Institute for 2017

77 THE COST AND MANAGEMENTISSN 1817-5090, VOLUME-44, NUMBER-6, JANUARY-FEBRUARY 2017
Mr. Md. Abdur Rahman Khan FCMA has been working as Deputy Secretary in Finance Division of the Ministry of Finance of the Government of Bangladesh. Before this, he worked in income tax administration for about 22 years in home and abroad. He started his taxation career in 1994 as an Assistant Commissioner of Taxes and later on worked as Deputy Commissioner, Joint Commissioner and Additional commissioner of Taxes. As Additional Commissioner of Taxes, he worked as First Secretary (Tax Policy) in National Board of Revenue (NBR) and had been involved in formulation of Finance Act 2014 and Finance Act 2015. He also worked as an International Adviser of the United Nations and as a consultant of the World Bank during 2004-2011 periods.
Mr. Khan is the Secretary of the Institute (2015, 2016 & 2017) and a Board Member of Public Sector Financial Management Committee (PSFMC) in Confederation of Asian and Pacific Accountants (CAPA).
After obtaining post graduation degree in Accounting from University of Chittagong, Mr. Khan obtained his second masters in Government Financial Management from University of Ulster of the United Kingdom. He has written a good number of articles on taxation in reputed professional journals and presented number of papers in national and international seminars and workshops. Mr. Khan has strong passion in teaching and worked as a part time faculty in Dhaka University, North South University, Jahangir Nagar University, University of Development Alternative, ICMAB, Financial Management Academy (FIMA), and BPATC.
Secretary
Prof. Dr. Swapan Kumar Bala FCMA has currently been working as the Commissioner of Bangladesh Securities and Exchange Commission (BSEC) since April 19, 2016. Earlier he served Dhaka Stock Exchange (DSE) as Managing Director/CEO. Under his able management leadership, DSE has been demutualized in November 2013. He began his teaching career at Dhaka University as a Lecturer of Accounting in 1991 and became Professor in 2011. He is an IFRS professional from ICAEW (UK). He obtained his Bachelor and Masters in Accounting from Department of Accounting & Information Systems, Dhaka University. He obtained 'Certificate of Achievement on BIDS Advanced Course on Economics and Quantitative Techniques', an M. Phil. equivalent program, from BIDS. He did his Ph.D. on VAT from Dhaka University.
Dr. Bala is the Treasurer of the Institute (2015, 2016 & 2017) and present Chairman, SAFA Committee on NPOs and Cooperative Sector. He was the Editor of the ICMAB Journal (March 2012 to Feb. 2013). He was also the Chairman of Dhaka Branch Council of ICMAB (2008).
Dr. Bala is a Professional Member of IMA (USA), an Associate Member of Virtual Institute, UNCTAD and a life member of the Asiatic Society of Bangladesh. He has extensive Training of Trainers (ToT) experience including Leadership ToT Programs organized by IFC at Dhaka and IIM Calcutta held at Kuala Lumpur, Malaysia. Dr. Bala also rendered professional services to Bangladesh Bank, NBR, ISTCL and BICM. He participated in several Securities Market Development Programs held in USA (SEC, US XBRL and MIT), Qatar, South Korea, Germany, Brazil, China, Maldives, the Philippines and Hong Kong. To his credit, he has 71 research articles (26 international), 9 research monographs, 9 books, 1 study manual, 44 seminar papers and 9 entries in Banglapedia.
Treasurer
New Office Bearersof the Institute for 2017

78 THE COST AND MANAGEMENTISSN 1817-5090, VOLUME-44, NUMBER-6, JANUARY-FEBRUARY 2017
ICMAB delegation called onExecutive Chairman, BIDA
A delegation of ICMAB headed by its President Mr. Jamal Ahmed Choudhury FCMA called on Kazi M. Aminul Islam, Executive Chairman, Bangladesh Investment Development Authority (BIDA) at his office on February 23, 2017. The ICMAB President apprised the Executive Chairman, BIDA about the role of Cost and Management Accountants in enterprise management, cost control and performance evaluation of business and industrial undertakings. He informed that ICMAB has got global standard academic curriculum. The Institute is producing highly skilled professional accountants to meet the demand for accounting expertise in the country. He
said that the trade and industries of the country could be benefited through implementation of Cost and Performance Audit. The Executive Chairman of BIDA emphasized on the role of the professional accountants in the economic development of the country. He assured his support for the development of the Cost and Management Accounting profession. Among others, Secretary Mr. Md. Abdur Rahman Khan FCMA, Treasurer Prof. Dr. Swapan Kumar Bala FCMA, Council Members and Past Presidents Mr. Mohammed Salim FCMA, Mr. Arif Khan FCMA and Executive Director of the Institute Mr. Md. Mahbub Ul Alam FCMA were present in the meeting.
President's DinnerThe Councilors and past Presidents and Past Vice Presidents of the Institute were invited by the immediate Past President Mr. Arif Khan FCMA to kindly participate in a President's Dinner in Santoor Restaurant, Dhaka held on February 09, 2017 and to offer suggestions for betterment of the Institute and the profession. Among the Past Presidents Mr. Md. Uttam Ali Miah FCMA, Mr. Md. Ruhul Amin FCMA, Mr. M. Abul Kalam Mazumdar FCMA, Prof. Mamtaz Uddin Ahmed, FCMA, Mr. Md. Abdul Aziz FCMA, Mr. Md. Abdur Rashid FCMA and Mr. Mohammed Salim FCMA attended the meeting. The council members also attended the dinner.

79 THE COST AND MANAGEMENTISSN 1817-5090, VOLUME-44, NUMBER-6, JANUARY-FEBRUARY 2017
Dr. Md. Salim Uddin has been Reappointed as Director of Rupali Bank Ltd for second term.
Dr. Md. Salim Uddin, FCMA, FCA, MBA is a fellow member of three professional accounting bodies such as the Institute of Cost and Management Accountants of Bangladesh-ICMAB, the Institute of Chartered Accountants of Bangladesh-ICAB and the Chartered Institute of Public Finance and Accountancy (CIPFA), UK. He has recently been Reappointed as Director of Rupali Bank Ltd for second term by the Government of Bangladesh. Now he is a faculty member, Professor in the Department of Accounting, University of Chittagong, Bangladesh. At present he is also a Director of Rupali Investment Limited. He worked as Independent Director of Premier Bank Ltd, and also worked as Director and Chairman of audit committee of Chittagong Stock Exchange Ltd.
He has been working as Financial Consultant/Adviser in different organisations since 1993 and gathered vast experiences in the fields of designing accounting system, project management, project financing through debt and equity, business negotiation and regulatory compliance etc. Mr. Salim has keen interest in theoretical and applied research. His main areas of interest are International Accounting, IAS/IFRS, Forensic Accounting, Creative Accounting and Capital Market. He has more than fifty research publications at home and abroad in various fields of Accounting and Finance. He also actively participated and presented valuable papers in many national and international seminars, training programs and workshops. He worked and completed a project on E-Brokerage in Belgium and gathered experience in negotiating international business and finalizing contract.
Our Fellow member Mr. Md. Mahsudur Rahman FCMA, FCA (Enrolment -487), participated Fed Ex Bangladesh Golf Tournament at Savar Army Golf Club held on 28 January 2017. He achieved "Golf Cup" in this tournament as winner of best "Front Nine". Major General Waker-Uz-Zaman, GOC of Savar Cantonment, Md. Tanveer Madar Managing Director of Fed Ex Bangladesh Ltd and many distinguish guest & golfers were present in the prize distribution ceremony.
Mr. Mahsud is also a professional Bodybuilder and achieved "Bronze Medal" in the Asian Bodybuilding & Fitness Championship held in Japan in 2015. Mr. Mahsud achieved three times "Gold Medal" in the National Bodybuilding Championship and titled as "Mr. Bangladesh".
Achievementmember's
Mr. Abdus Samad, the ex-Electrician of ICMAB has breathed his last on January 30, 2017 in America due to old age complication. Mr. Samad served ICMAB for a long time. He was the owner of "Samad Light House". He acted as the "Light Director" of the famous Bangla Cinema "Rupban".
We Mourn

DBC News
80 THE COST AND MANAGEMENTISSN 1817-5090, VOLUME-45, NUMBER-1, JANUARY-FEBRUARY 2017
The Annual Picnic-2016 organized by the Dhaka Branch Council of ICMAB was held on February 10, 2017 at Megher Chaya Resorts & Picnic Spot, Konabari, Gazipur. More than 800 Dhaka-based members, guests, and family members participated in the picnic and spent the whole day with joy and merriment. Among the events important ones are: raffle draw, pillow-passing for the babies, and children's sports. Office Bearers of the National Council and Office Bearers of Dhaka Branch Council attended the enthusiastic picnic.
Name of the Members Mem. No.Mr. Md. Abdus Satter Sarkar FCMA F-0457Mr. Md. Mushfiqur Rahman FCMA F-0491Mr. A.K.M. Kamruzzaman FCMA F-0497Mr. Mohammad Alamgir FCMA F-0499Mr. Monjur Md. Shaiful Azam FCMA F-0537
Name of the Members Mem. No.Mr. Md. Shafiqul Alam FCMA F-0639Mr. S. M. Afjal Uddin FCMA F-0660Mr. Zillur Rahman FCMA F-0749Mr. Md. Mumlook Hossain FCMA F-0761Mr. Md. Mashiur Rahaman ACMA A-1084
Dhaka Branch Council (DBC) Election-2016 for the term - 2017
Nomination of Members to the Dhaka Branch Council-2017Mrs. Jhohora Akter FCMA (F-0665)
Mr. Mohammed Harun-Ar- Rashid FCMA(F-0770)
2016Annual Picnic

DBC News
81 THE COST AND MANAGEMENTISSN 1817-5090, VOLUME-45, NUMBER-1, JANUARY-FEBRUARY 2017
The DBC of ICMAB organized a Probhat Ferry on 21st February, 2017 in observance of Amar Ekushey which is now internationally recognized as the International Mother Language Day. Associate and Fellow members of the Institute, their family members, a good number of ICMAB students and DBC staff took part in the Probhat Ferry. Floral wreath was placed at the central Shahid Minar to commemorate the contribution of the brave patriots who laid down their lives for their mother language. Kazi Muhammad Ziauddin FCMA, Chairman of DBC led the procession, which was also attended by the Past President of the Institute Mr. Rafiq Ahmad FCMA, Present President Mr. Jamal Ahmed Choudhury FCMA & Secretary of the Institute Mr. Md. Abdur Rahman Khan FCMA.
The Dhaka Branch Council (DBC) of the Institute organized a Prize Giving Ceremony of DBC Indoor Games Competition 2016 on February 28, 2017 at ICMAB DBC Training Room. Kazi Muhammad Ziauddin FCMA, Chairman of DBC presided over the program, while Mr. Jamal Ahmed Choudhury FCMA, president of the Institute was present as the Guest of Honor distributed prizes among the winners of the different indoor games. Mr. Md. Abdus Satter Sarkar FCMA, Secretary of the Dhaka Branch Council gave welcome Address. Mr. Md. Abdur Rahman Khan FCMA, Secretary of the Institute, Mr. Mohammad Mahbubur Rahman FCMA, Chairman of Dhaka Branch Sports Committee-2016 also spoke on the occasion.
Homage to the Martyrs of Language Movement
ofPrize Giving CeremonyDBC Indoor Games Competition-2016.

CBC News
82 THE COST AND MANAGEMENTISSN 1817-5090, VOLUME-45, NUMBER-1, JANUARY-FEBRUARY 2017
Projection Meeting onProfessional Accountancy-A Glorious Career Aheadheld at East Delta University, Chittagong
Name of the Members Mem. No.Mr. Md. Arshad Ullah FCMA F-0380Qazi Meraz Uddin Arif FCMA F-0554Mr. Imtiaz Alam FCMA F-0556Mr. Kanchan Chandra Shom FCMA F-0635Mr. Mohammed Nurul Huda Siddiquee FCMAF-0658
Name of the Members Mem. No.Mr. Mohammad Saiful Islam FCMA F-0721Mr. Mohammed Monoarul Hoque FCMAF-0745Mr. Golam Kibria FCMA F-0866Mr. Mohammad Arif ACMA A-1240Mr. Asadur Rahaman ACMA A-1285
Chittagong Branch Council (CBC) Election-2016 for the term - 2017
Nomination of Members to the Chittagong Branch Council-2017Mr. Mohammed Rafiqul Alam FCMA (F-0436)
Mr. Md. Moazzam Haider FCMA (F-0513)
The Chittagong Branch Council of the Institute of Cost and Management Accountants of Bangladesh (ICMAB) organized a discussion on "the life of the Prophet Muhammad (PBUH)" on Monday, January 02, 2016 at CMA Bhaban, CDA R/A, Agrabad, Chittagong. Sheikh Billal Madani, Assistant Professor, International Islamic University was discussant in this program. The members who attended in the program also discussed on the holy life of the great Prophet Hazrat Muhammad (PBUH) and the ideals and teachings of Islam.
The discussion was followed by a Milad Mahfil with due religious fervor, festivity and solemnity. Sheikh Billal Madani led the Munajat seeking the blessings of Almighty Allah for peace and prosperity of the CMA family & Muslim Ummah. Doa was also offered for the soul of the ICMA members & Muslim Ummah who were previously deceased.
Discussion on the life of the Prophet Muhammad (PBUH)
ICMAB Chittagong Branch organized a Projection Meeting on "Professional Accountancy-A Glorious Career Ahead" at East Delta University, Chittagong on January 26, 2017 in collaboration with Faculty of Business Studies of the university. Mr. Mohammed Sekander Ali Khan, Vice Canceller of the university was present in the program as Chief Guest and presided over by the Program.
Mr. Mohammed Nurul Huda Siddiquee FCMA, Chairman, Chittagong Branch Council and Mr. Imtiaz Alam, FCA, FCMA were present as guest of honor in the program. Mr. Ashik Mahmood Chowdhury ACMA was present as key note speaker.

CBC News
83 THE COST AND MANAGEMENTISSN 1817-5090, VOLUME-45, NUMBER-1, JANUARY-FEBRUARY 2017
The Chittagong Branch Council of ICMAB organized two days picnic for its members, their spouse and children at Sayeman Beach Resort, Cox's Bazar on 27th & 28th January 2017. More than 50 CMA family of Chittagong based members and Prof. Mamtaz Uddin Ahmed FCMA, Vice-President, ICMAB participated in the Picnic and spent two days with joy and happiness.
CBC Annual Picnic 2016
Key note speaker of the program portrait how to achieve CMA designation and put valuable suggestion for the students. He also spoke on the opportunities available for the students of business studies in entrance in the profession.
A good number of Professors, Assistant Professors, and Lecturers from different department and students of East Delta University were present in the occasion. The Fellow & Associate members of ICMAB also attended the program.
The Chief Guest thanks ICMAB for arranging such a gathering at East Delta University and hope this kind of co-operation will continue in future.
The Employees of the Chittagong Branch of ICMAB organized picnic at Cox's Bazar on 10th January 2017. Employees with their spouse and children participated in the picnic and spent whole day with pleasure.
Employees Annual Picnic 2016

CBC News
84 THE COST AND MANAGEMENTISSN 1817-5090, VOLUME-45, NUMBER-1, JANUARY-FEBRUARY 2017
Seminar onProfessional Cost & Management Accountancy:Implication for the Business Graduates
The Institute of Cost and Management Accountants of Bangladesh (ICMAB) and Accounting Communication Club, University of Chittagong jointly organized a seminar on "Professional Cost & Management Accountancy: Implication for the Business Graduates" on Monday, February 13, 2017 at auditorium, Business Administration Faculty of University of Chittagong. Professor Dr. Iftekhar Uddin Chowdhury, honorable Vice-Chancellor, University of Chittagong was present as Chief Guest on this occasion while Mr. Jamal Ahmed Choudhury, FCMA, President, ICMAB and Prof. Mamtaz Uddin Ahmed, FCMA, Vice President, ICMAB and Professor Dr. A.F.M Aowrangazab, Dean, Faculty of Business Administration, University of Chittagong were present in this program as special guests. Mr. Mohammed Nurul Huda Siddiquee FCMA, Chairman, Chittagong Branch Council, ICMAB delivered the welcome speech.
Honorable Vice-Chancellor thanked ICMAB and Accounting Communication Club, University of Chittagong for arranging a timely suited seminar to develop skilled human resources in our country and expresses that to survive in this competitive world highly skilled manpower with strong morality, honesty, efficiency, patriot and professional human resource is required. He also states that our young generation is very talented and unbound possibilities.

CBC News
85 THE COST AND MANAGEMENTISSN 1817-5090, VOLUME-45, NUMBER-1, JANUARY-FEBRUARY 2017
The Vice- Chancellor opts that this seminar will play a vital role to convert the young generation as manpower with proper education is to operate business efficiently, efficient manager, professional accountant and to gain overall professional excellence. Special Guest & Keynote Speaker Mr. Jamal Ahmed Choudhury FCMA on his speech said that there is a scarcity of professional accountant in comparison with demand in our country. Professional accountants are playing important role in the economical development of our country. He also said that if the talented students of universities enter into this profession, the scenario of the professional accountant will be changed. Mr. Mohammed Monoarul Hoque FCMA presented a power point presentation on the pathways of how to become professional accountants. Honorable teachers & Chittagong based members of ICMAB and a large number of students of Chittagong University were presents on the occasion. The program was ended up with thanks by Mr. Rakibul Islam Mysan ACMA, Assistant Professor, University of Chittagong.
A Joint Meeting of Chittagong Branch Council (CBC) of the Institute of Cost & Management Accountants of Bangladesh (ICMAB) was held on 25th February, 2017 at CMA Bhaban, Agrabad, Chittagong. In this meeting CBC members unanimously elected Mr. Golam Kibria FCMA as Chairman and Mr. Mohammad Arif ACA, ACMA as Secretary for the year 2017. Beside this, Qazi Meraz Uddin Arif FCMA and Mr. Mohammad Saiful Islam FCMA has been elected as Vice- Chairman & Treasurer of CBC respectively for the same tenure.
It is to be mentioned here that, newly elected CBC Chairman Mr. Golam Kibria FCMA has been serving as CFO in SEACOM Group, Mr. Mohammad Arif ACA, ACMA, as CFO, BSRM Steels Limited, Chittagong. Qazi Meraz Uddin Arif FCMA has been serving as Sr. Finance Officer, Chittagong Port Authority & Mr. Mohammad Saiful Islam FCMA has been serving as Deputy General Manager, PHP Family, Chittagong.
ICMAB CHITTAGONG BRANCH ELECTED ITS OFFICE BEARERS
Chairman SecretaryVice-Chairman Treasurer

CBC News
86 THE COST AND MANAGEMENTISSN 1817-5090, VOLUME-45, NUMBER-1, JANUARY-FEBRUARY 2017
CPD Program on Offshore Banking: Impact and Scope in Bangladesh EconomyChittagong Branch Council (CBC) of The Institute of Cost and Management Accountants of Bangladesh (ICMAB) recently organized CPD Program on "Offshore Banking: Impact and Scope in Bangladesh Economy" at CMA Bhaban, Agrabad CDA, Chittagong.
Mr. Mohammed Nurul Huda Siddiquee FCMA, Chairman, Chittagong Branch Council of ICMAB presided over the Program. Mr. Imtiaz Alam FCA, FCMA, Proprietor, Imtiaz Alam & Company Chartered Accountants attended at the program as Chief Guest. Mr. Mohammed Rafiqul Islam, CDCS, First Assistant Vice President & Head of Offshore Banking, Bank Asia Ltd. presented the technical paper in the program.
The Chairman of CBC said in his welcome address, the topic is very important, it will help to the participants in practical field and he also express his opinion regarding various features of CPD Program.
The paper presenter highlighted the latest development in the international trade finance through offshore banking. He also described various tools & techniques of offshore banking method and etc.
The Chief Guest thanks the CBC for organizing such timely suited CPD program and stated that Bangladesh is an important market for offshore banking because its trade volume is increasing rapidly. He thanked the participants for giving their valuable time.
A large number of Fellow & Associate members of ICMAB based at Chittagong region participated and enjoyed the program.

KBC News
87 THE COST AND MANAGEMENTISSN 1817-5090, VOLUME-45, NUMBER-1, JANUARY-FEBRUARY 2017
Name of the Members Mem. No.Mr. Ratan Kumar Debnath FCMA F-0265Mr. Ashok Kumar Debnath FCMA F-0289Mr. Md. Morshed Ali FCMA F-0387Mr. Abdul Motaleb FCMA F-0877Sheikh Ziaul Islam FCMA F-0911
Name of the Members Mem. No.Mr. S. M. Zakir Hossain ACMA A-0804Mr. Md. Habibur Rahman Sk. ACMA A-0991Mr. Arifur Rahman ACMA A-1126Mr. Md. Moslem Uddin ACMA A-1166Mr. K. M. Neamul Hoque ACMA A-1197
Khulna Branch Council (KBC) Election-2016 for the term - 2017
Nomination of Members to the Khulna Branch Council-2017Principal, Azam Khan Govt. Commerce College, Khulna
Principal, Govt. Brajalal University College, Khulna
Homage to the Martyrs of Language MovementKhulna Branch Council (KBC) of ICMAB organized a Probhat Ferry rally on 21st February 2017 in observance of Amar Ekushey and International Mother Language Day. In order to observe the occasion Mr. Ratan Kumar Debnath FCMA, Chairman of KBC, Mr. Ashok Kumar Debnath FCMA, Mr. Md. Alauddin Akanda FCMA and a good number of students of Khulna Branch participated in the rally towards Khulna Hadish Park Shaheed Minar and presented flower bouquets to commemorate the contribution of the brave patriots who laid down their lives to establish our mother language in every walks of life.
ICMAB Khulna Branch Council (KBC) organized its annual picnic in the name of "Students day out Program-2017" on February 24, 2017. This year, the venue was YC Resort & Picnic Corner, Batiaghata, Khulna. The journey started at 8:30 am by two buses lead by Mr. Ratan Kumar Debnath FCMA, Chairman of KBC. A good number of Fellow & Associate members, Students and their family members participated and enjoyed many events and games in the day long program. The program was concluded by a dynamic raffle draw and prize giving ceremony along with thanks giving speech of Chairman, KBC.
Annual Picnic 2017

KBC News
88 THE COST AND MANAGEMENTISSN 1817-5090, VOLUME-45, NUMBER-1, JANUARY-FEBRUARY 2017
Name of the Members Mem. No.01. Mr. G. M. S. Aziz Uddin Ahmed FCMAF-021302. Mr. Tanveer Ahammad Wares FCMA F-087303. Mr. Abu Tareque ACMA A-019604. Mr. Naeemul Azeez Rahman ACMA A-0480
Name of the Members Mem. No.Mr. Nayeem Ali Kadri ACMA A-048206. Mr. Md. Mahfuzur Rahman ACMA A-062407. Mr. Md. Mamunur Rashid ACMA A-064708. Mr. Munir AHM ACMA A-0902
ICMAB Canada Chapter Council Election - 2016 (for the term 2017 - 2018)
Nomination of Members to the ICMAB Canada Chapter for 2017-2018Mr. Md. Anisur Rahman FCMA (F-0096)
Mr. Md. Ghulam Faruk ACMA (A-0405)
Introductory Class of January-June 2017 Session
Discussion meeting on Safe Investment in Capital Market
Before starting the classes of January-June 2017 session, KBC of ICMAB arranged a program on introductory class on February 26, 2017 to inform the course curriculum and study procedure of ICMAB to the newly admitted students. Mr. Ratan Kumar Debnath FCMA, Chariman of Khulna Branch Council & Executive Director (Finance) of WZPDCL presided over the Program while Mr. Azizur Rahman a newly qualified CMA, delivered the welcome speech. Mr Md. Alauddin Akanda FCMA, Mr. Ashok Kumar Debnath FCMA also spoke on the program and Sheikh Ziaul Islam FCMA Seceretary, KBC of ICMAB offered vote of thanks. A good number of fellow & associate members, teachers and newly admitted students of Khulna Branch actively participated in the program.
Khulna Branch Council (KBC) of ICMAB arranged a Discussion meeting on "Safe Investment in Capital Market" on February 28, 2017. Mr. Mohammed Mohiuddin FCMA, Past-President of ICMAB and Managing Director of Island Securities Ltd. conducted the session. He delivered a speech regarding the key points of analysis of stocks before making decision to invest in the capital market. Mr. Ratan Kumar Debnath FCMA, Chairman KBC of ICMAB and Executive Director (Finance) of WZPDCL presided over the program. A good number of Fellow & Associate Members and students of Khulna Branch actively participated in the program.

The ICMAB Council 2017
Mr. Mohammed Salim FCMAVice-President
Mr. Md. Abdur Rahman Khan FCMASecretary
Prof. Dr. Swapan Kumar Bala FCMATreasurer
Mr. M. Abul Kalam Mazumdar FCMAMember
Mr. Abu Bakar Siddique FCMAMember
Kazi Muhammad Ziauddin FCMAMember
Begum Shamima YeasminMember
Mr. A.K.M. Delwer Hussain FCMAMember
Mr. Md. Munirul Islam FCMAMember
Mr. A R M Nazmus SakibMember
Mr. Jamal Ahmed Choudhury FCMAPresident
Prof. Mamtaz Uddin Ahmed FCMAVice-President
Dr. Dilip Kumar Sharma ndcMember
Mr. Md. Aminul Islam KhanMember
Mr. Arif Khan FCMAMember
Mr. Md. Mamunur Rashid FCMAMember

Regd. DA 34/82TK. 200.00 (home) US$ 8.00 (overseas)
ICMA Bhaban, Nilkhet, Dhaka-1205, BangladeshTel: 8615989, 9611799, 9615477, Fax: 88-02-58615703Email: [email protected], Web : www.icmab.org.bd