volumetric measurement of tumors david f. yankelevitz, md
TRANSCRIPT

Volumetric Measurement of TumorsVolumetric Measurement of Tumors
David F. Yankelevitz, MDDavid F. Yankelevitz, MD

Why Measure Tumor Volumes?Why Measure Tumor Volumes?
• Surrogate for knowing the amount of viable tumor
• Implied is this:– Larger volumes, therefore progression– Smaller volumes, therefore response

How do we measure volumes?How do we measure volumes?
• Surrogates– Uni-dimension (RECIST)– Bi-dimension (WHO)– Tri-dimension
• Genuine volume measurements

Advantages of Volume MeasurementsAdvantages of Volume Measurements
• Greater proportional change– 26% diameter increase corresponds to 100%
volume increase
• Measurement of asymmetric growth• Tumor volume doubling time

Days to ERCT from initial CT
Initial nodule diameter (mm)
Doubling time (days)
30 90 120 150 180
28 10 12.41
(24 vs 93%)
10.75 10.55 10.44 10.37
(4 vs 12%)
Expected Change in DiameterExpected Change in Diameter

Asymmetric GrowthAsymmetric Growth
• SPN (6.9 mm) at baseline and 36 days later• Virtually unchanged according to 2D metrics• Apparently benign (DT=9700)
• Area: 36.5 mm2
• Perimeter: 22.7 mm
• Length: 8.27 mm
• Width: 5.62 mm
• Area: 36.6 mm2
• Perimeter: 23.4 mm
• Length: 8.23 mm
• Width: 5.66 mm

Volumetric AnalysisVolumetric Analysis
• 3D analysis reveals significant growth along scanner axis! (DT = 104, malignant)

8 mm Stable Nodule8 mm Stable Nodule
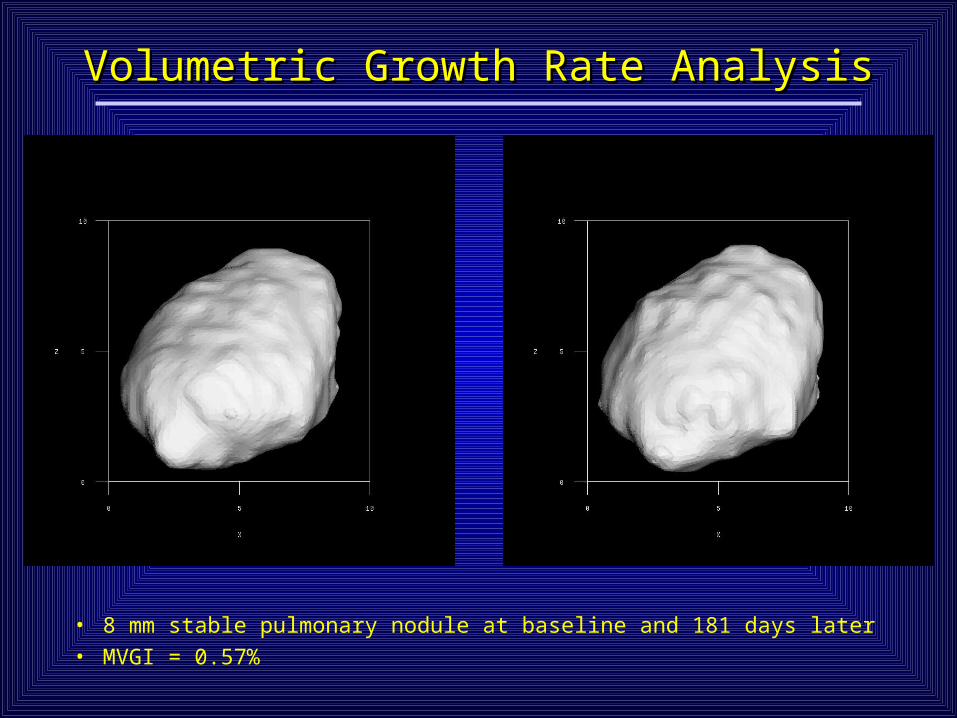
Volumetric Growth Rate AnalysisVolumetric Growth Rate Analysis
• 8 mm stable pulmonary nodule at baseline and 181 days later• MVGI = 0.57%
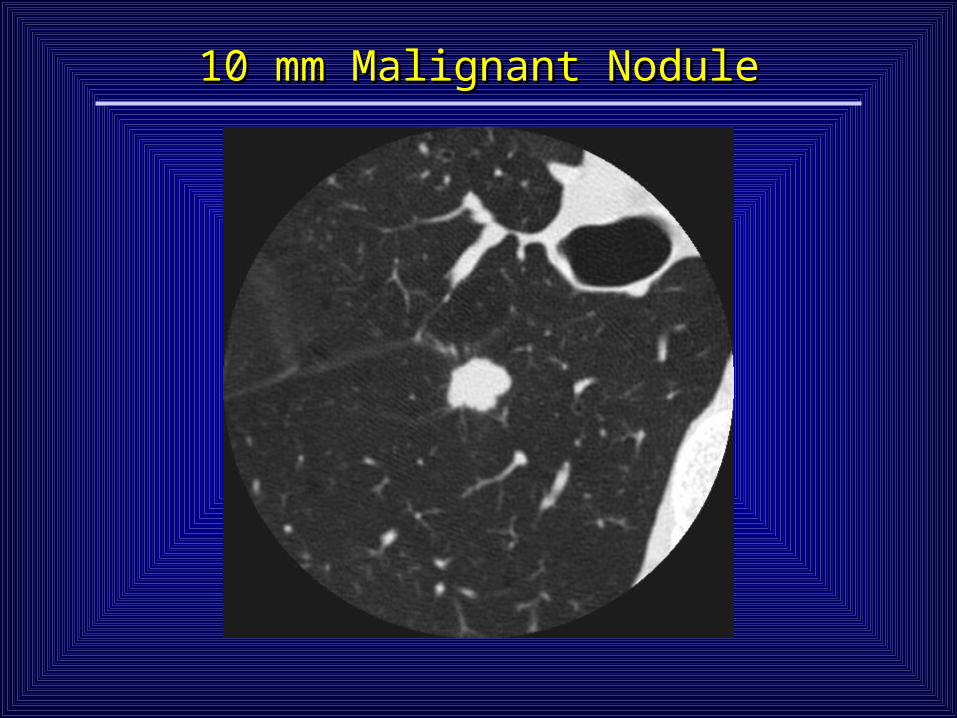
10 mm Malignant Nodule10 mm Malignant Nodule

Volumetric Growth Rate AnalysisVolumetric Growth Rate Analysis
• 10 mm malignant pulmonary nodule at baseline and 32 days later• MVGI = 22.0% -- Squamous Cell Carcinoma

Inputs Into Volume EstimatesInputs Into Volume Estimates
• Accuracy of measuring device (machine)– Inplane (x,y), out of plane (z)
• Ability to define borders of target (anatomic)– Removal of attached structures
• CAD
– Defining edges• Margin of tumor• Adjacent edema/inflammation
– Stability of structures
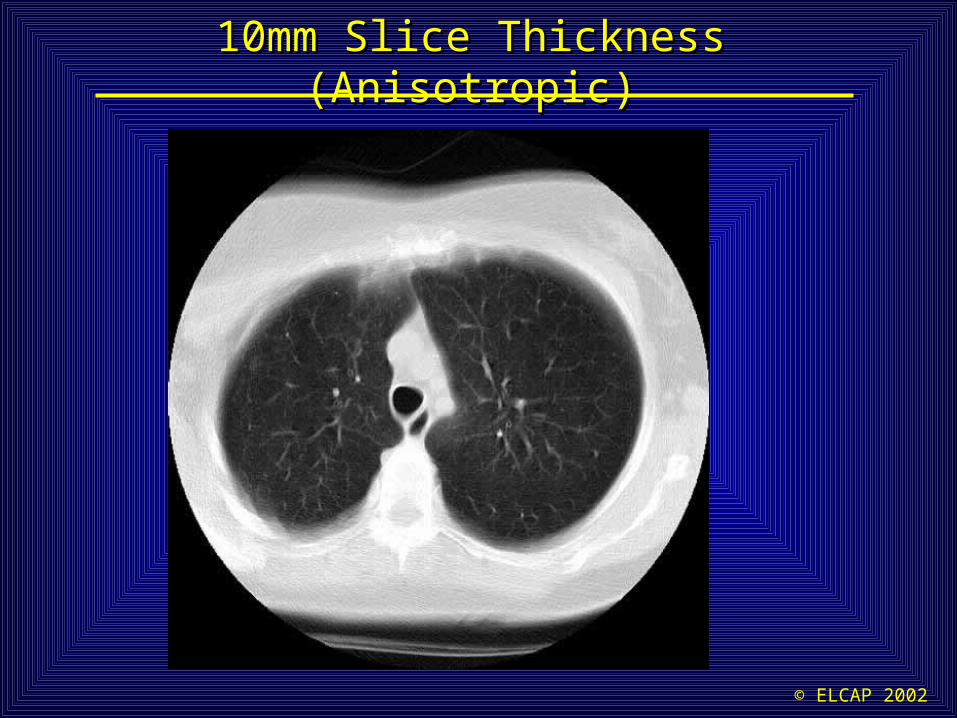
10mm Slice Thickness (Anisotropic)10mm Slice Thickness (Anisotropic)
© ELCAP 2002

5mm Slice Thickness5mm Slice Thickness
© ELCAP 2002
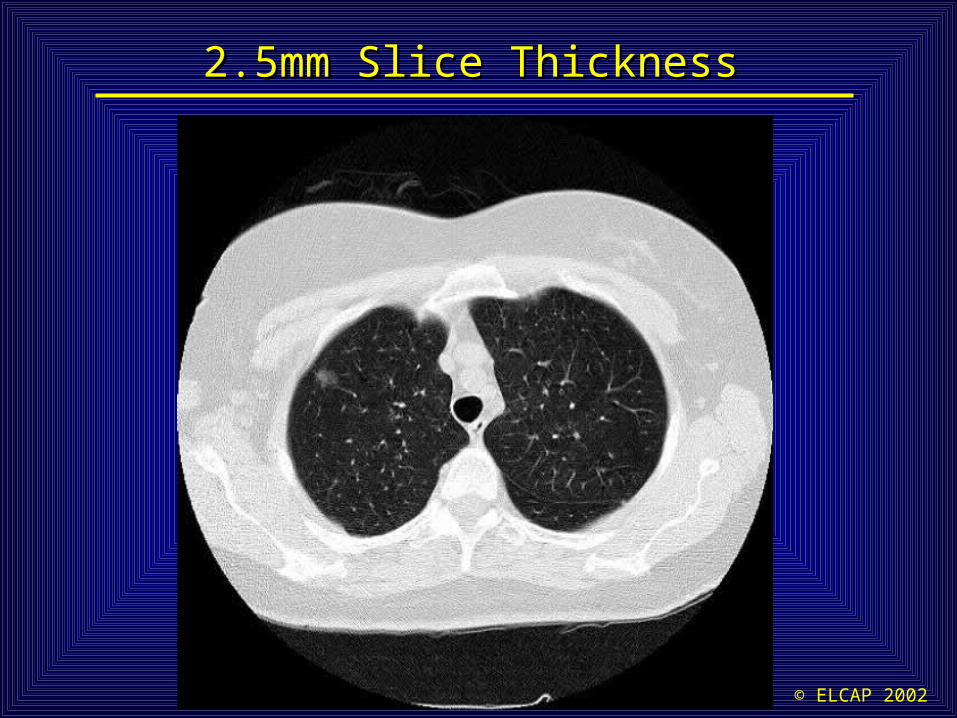
2.5mm Slice Thickness2.5mm Slice Thickness
© ELCAP 2002

1mm Slice Thickness1mm Slice Thickness
© ELCAP 2002

HeadlineHeadline
Courtesy of University of Erlangen, Department of Radiology and Institute of Medical Physics
SOMATOM Sensation 64
6 sec for 400 mm64 x 0.6mm (2x32)Resolution 0.4 mmRotation 0.37 sec120 kV / 100 mAs

HeadlineHeadline
Courtesy of University of Erlangen, Department of Radiology and Institute of Medical Physics
SOMATOM Sensation 64
6 sec for 400 mm64 x 0.6mm (2x32)Resolution 0.4 mmRotation 0.37 sec120 kV / 100 mAs
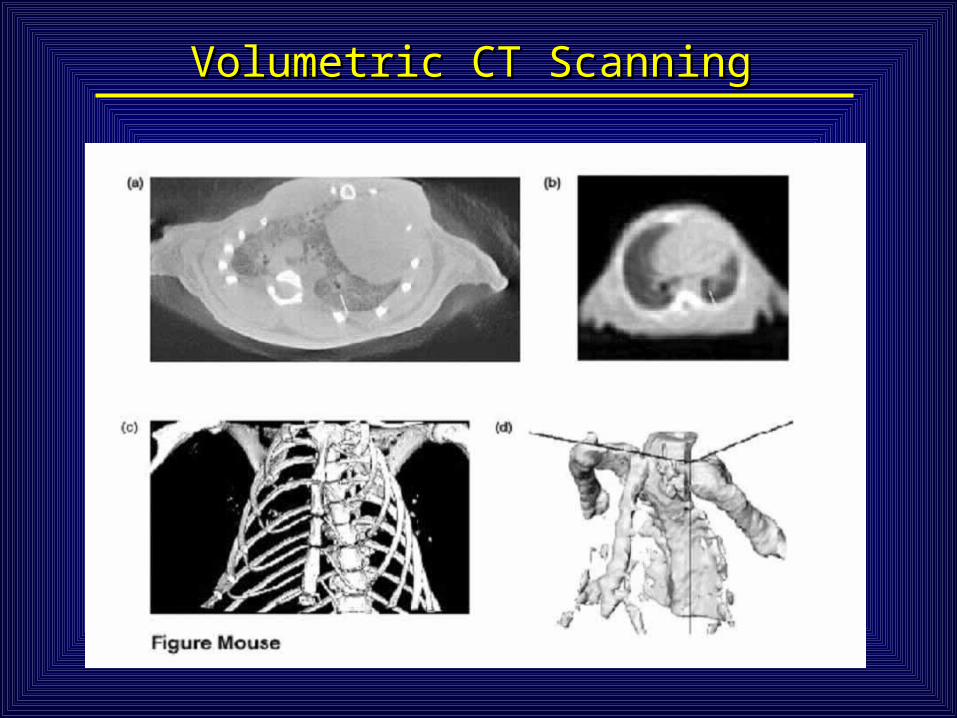
Volumetric CT ScanningVolumetric CT Scanning

Accuracy of Area MeasurementsAccuracy of Area Measurements
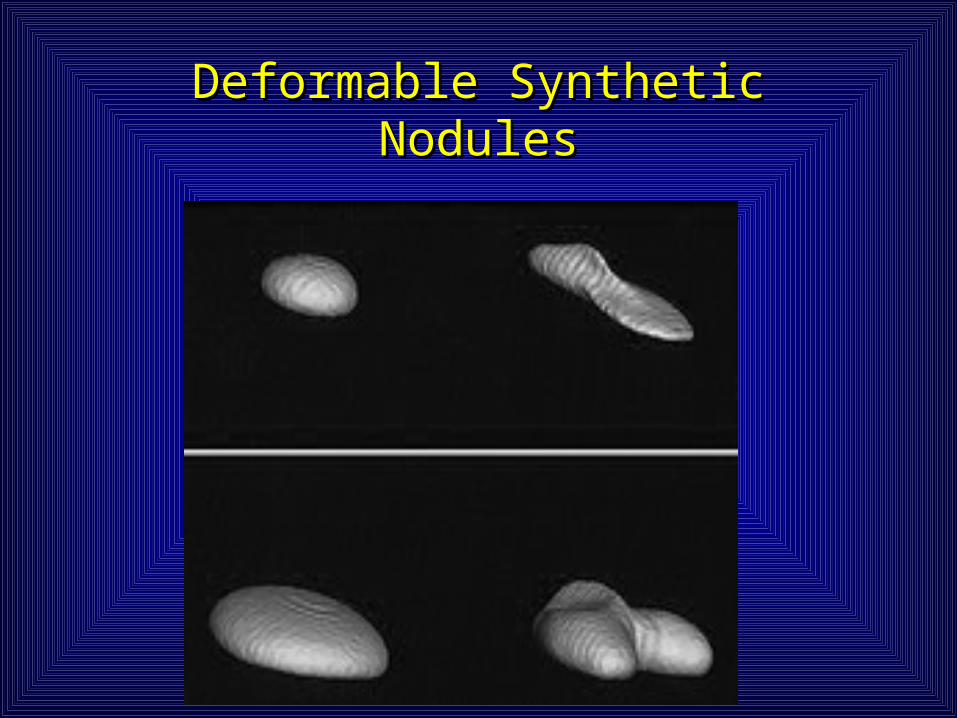
Deformable Synthetic NodulesDeformable Synthetic Nodules

Volumetric Measurement - Synthetic NodulesVolumetric Measurement - Synthetic Nodules
• Volume Error: (3-6 mm) = 1.1% RMS, 2.8% max(6-11 mm) = 0.5% RMS, 0.9% max
• Function of nodule size
Yankelevitz, et al. Radiology 2000

Removal of Attached StructuresRemoval of Attached Structures
Jan 27 1999, (X,Y) resolution: 0.1875 mm, Slice thickness : 1 mm
Images ©1999, ELCAP Lab, Weill Medical College of Cornell University
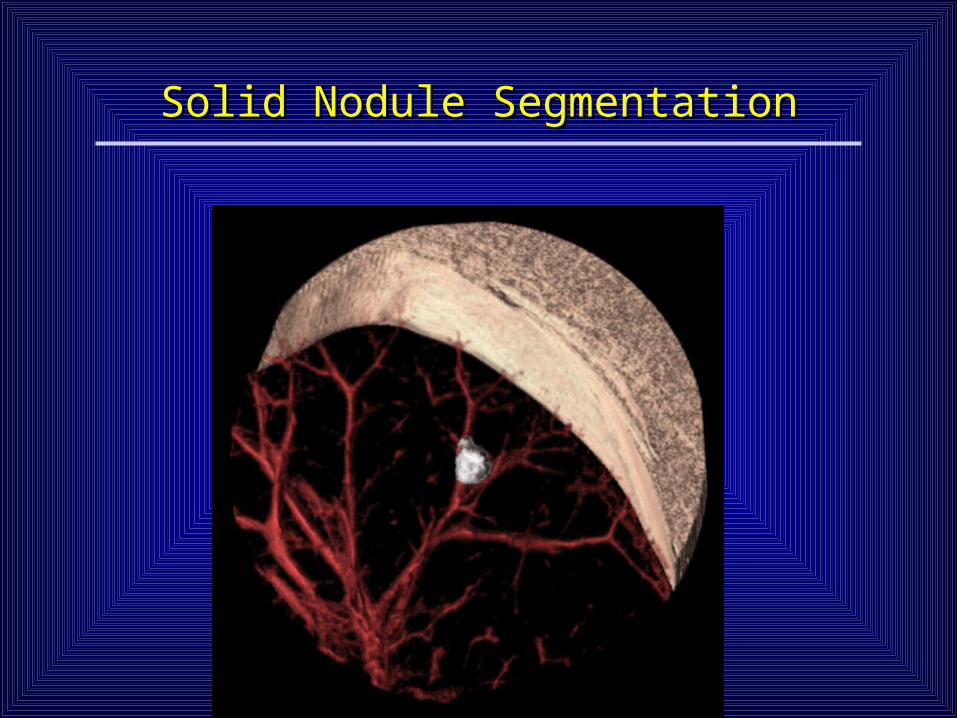
Solid Nodule SegmentationSolid Nodule Segmentation

Solid Nodule SegmentationSolid Nodule Segmentation

Images ©1999, ELCAP Lab, Weill Medical College of Cornell University
74-Day Doubling Time
Volumetric Doubling Time EstimationVolumetric Doubling Time Estimation

Limitations of SegmentationLimitations of Segmentation

Part-Solid Nodule: Complex SegmentationPart-Solid Nodule: Complex Segmentation
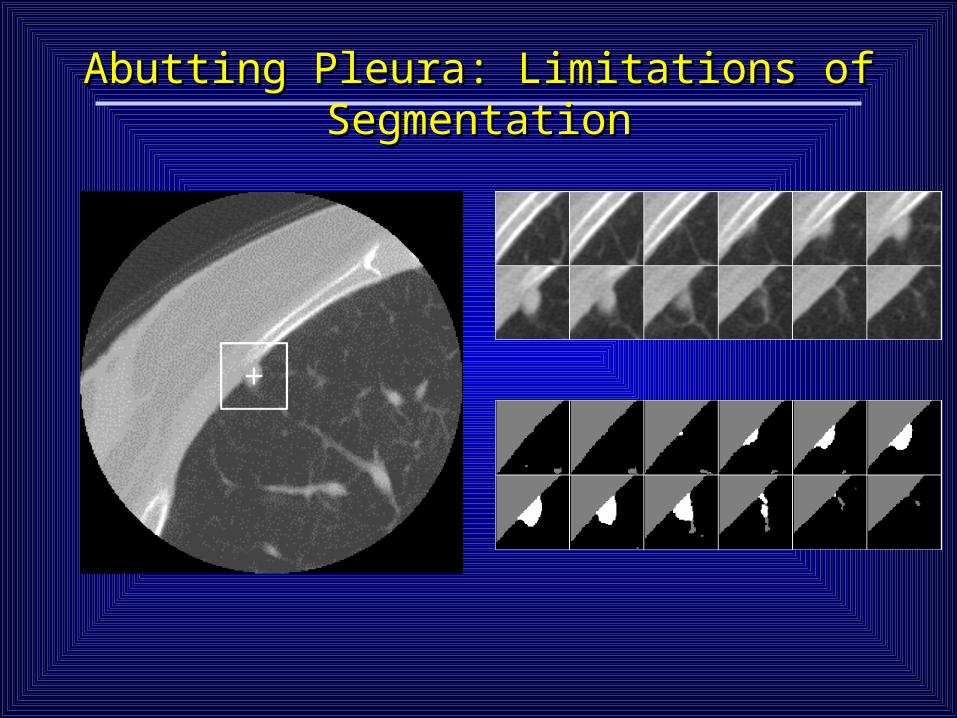
Abutting Pleura: Limitations of SegmentationAbutting Pleura: Limitations of Segmentation

Nonsolid Nodule: Indistinct BorderNonsolid Nodule: Indistinct Border

Less Natural ContrastLess Natural Contrast

SPICULATED NODULEInstructions to Thoracic Radiologists were
“Draw the Boundary of the Nodule”
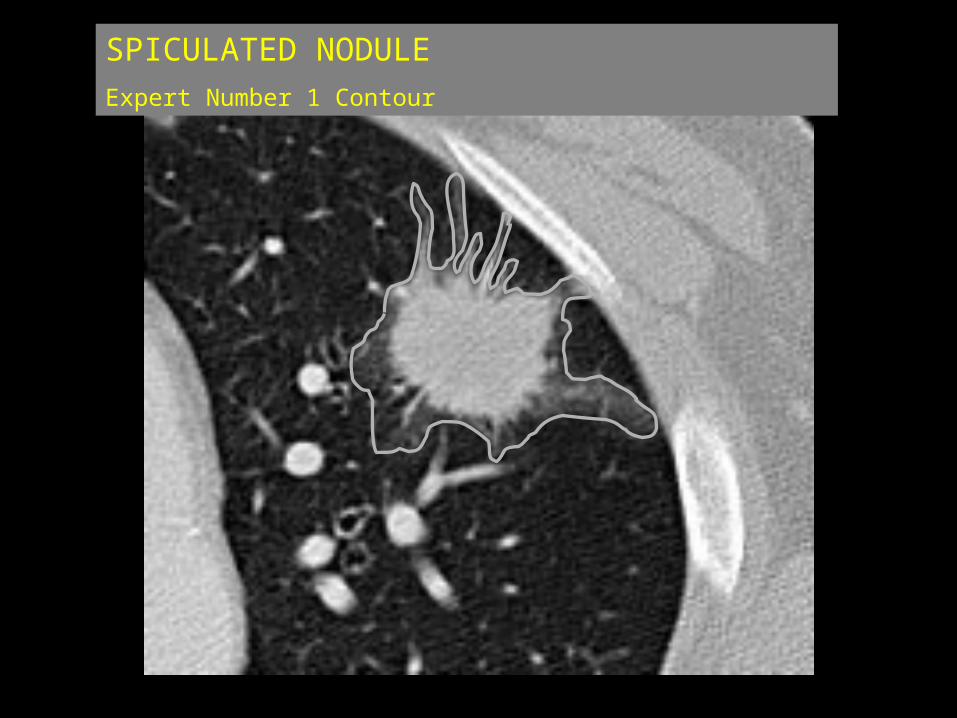
SPICULATED NODULEExpert Number 1 Contour

SPICULATED NODULEExpert Number 2 Contour

SPICULATED NODULEComparison of Contours

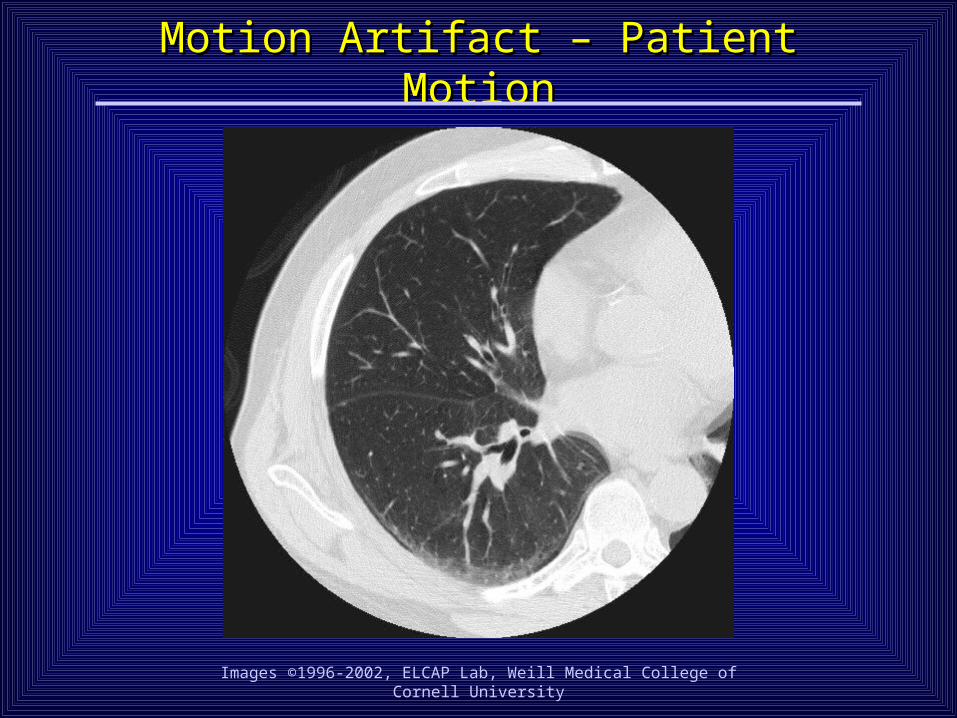
Motion Artifact – Patient MotionMotion Artifact – Patient Motion
Images ©1996-2002, ELCAP Lab, Weill Medical College of Cornell University

Motion Artifact – Patient MotionMotion Artifact – Patient Motion
Images ©1996-2002, ELCAP Lab, Weill Medical College of Cornell University
Motion Artifact – Patient MotionMotion Artifact – Patient Motion
Images ©1996-2002, ELCAP Lab, Weill Medical College of Cornell University

Motion Artifact – Patient MotionMotion Artifact – Patient Motion
Images ©1996-2002, ELCAP Lab, Weill Medical College of Cornell University

Motion Artifact – Patient MotionMotion Artifact – Patient Motion
Images ©1996-2002, ELCAP Lab, Weill Medical College of Cornell University

Motion Artifact – Patient MotionMotion Artifact – Patient Motion
Images ©1996-2002, ELCAP Lab, Weill Medical College of Cornell University

Motion Artifact – Patient MotionMotion Artifact – Patient Motion
Images ©1996-2002, ELCAP Lab, Weill Medical College of Cornell University

Motion Artifact – Patient MotionMotion Artifact – Patient Motion
Images ©1996-2002, ELCAP Lab, Weill Medical College of Cornell University

Motion Artifact – Patient MotionMotion Artifact – Patient Motion
Images ©1996-2002, ELCAP Lab, Weill Medical College of Cornell University

Motion Artifact – Patient MotionMotion Artifact – Patient Motion
Images ©1996-2002, ELCAP Lab, Weill Medical College of Cornell University

Motion Artifact – Patient MotionMotion Artifact – Patient Motion
Images ©1996-2002, ELCAP Lab, Weill Medical College of Cornell University

Motion Artifact – Patient MotionMotion Artifact – Patient Motion
Images ©1996-2002, ELCAP Lab, Weill Medical College of Cornell University

Motion Artifact – Patient MotionMotion Artifact – Patient Motion
Images ©1996-2002, ELCAP Lab, Weill Medical College of Cornell University

Nonsolid nodule: Nonsolid nodule: Adenocarcinoma, bronchioloalveolar subtypeAdenocarcinoma, bronchioloalveolar subtype

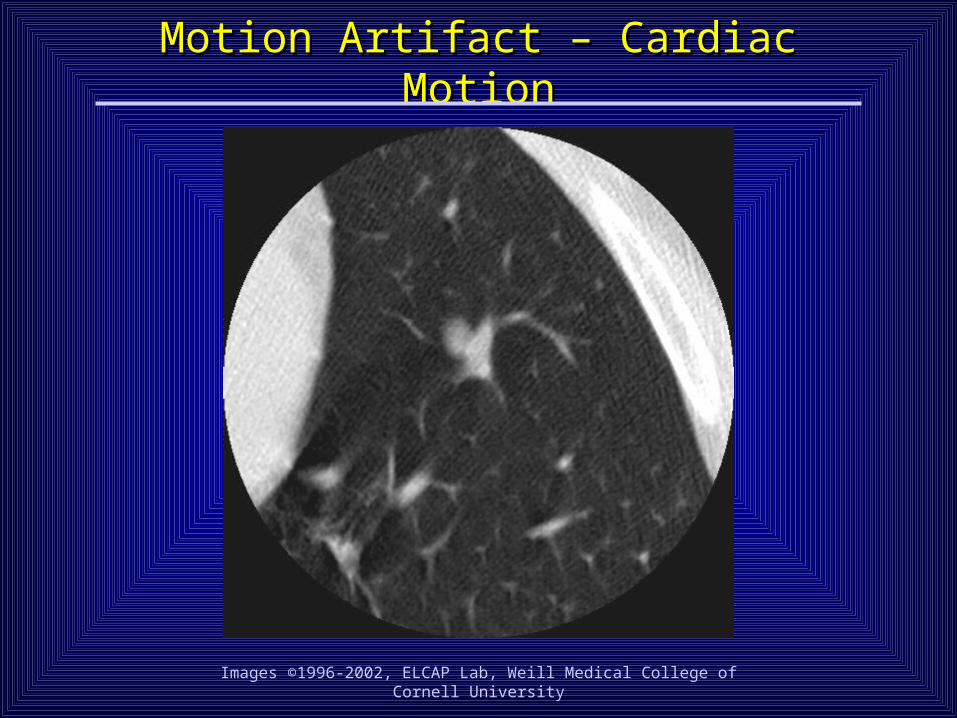
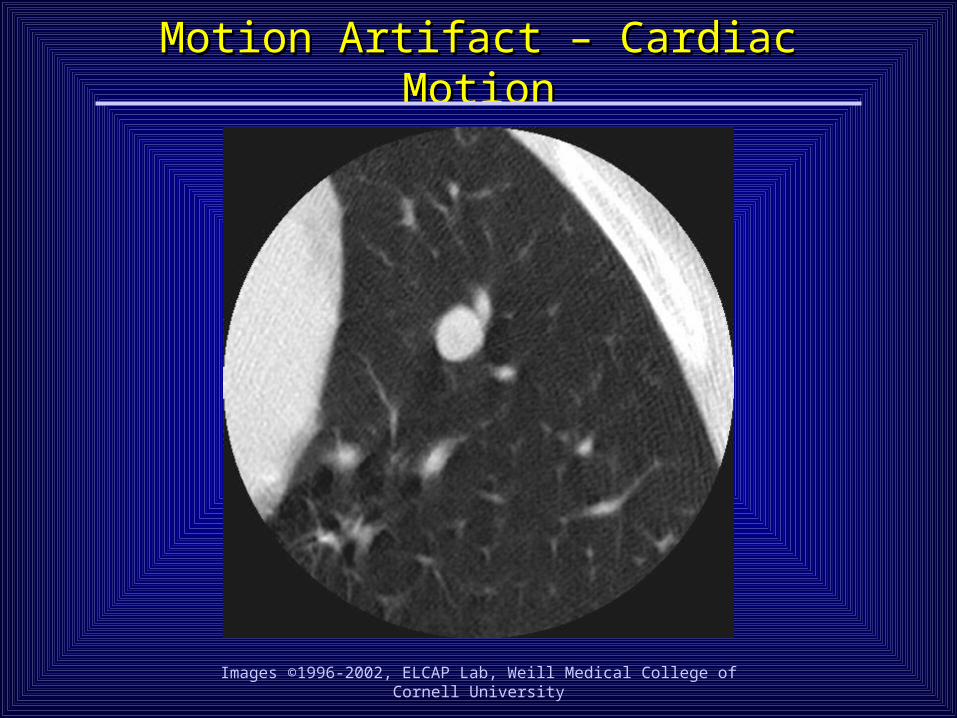
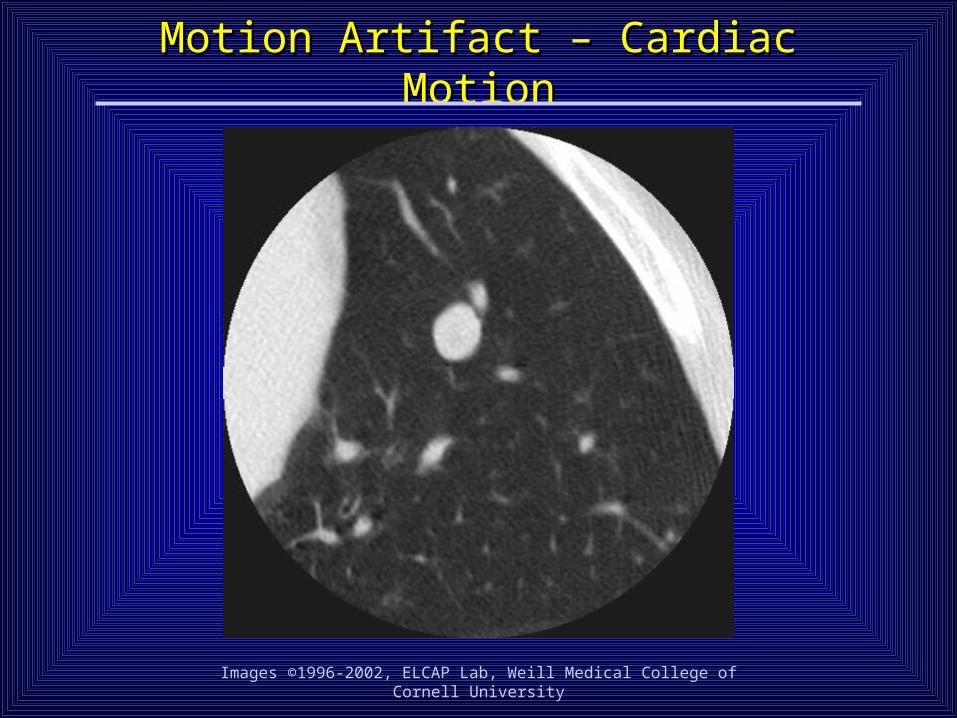
Motion Artifact – Cardiac MotionMotion Artifact – Cardiac Motion
Images ©1996-2002, ELCAP Lab, Weill Medical College of Cornell University

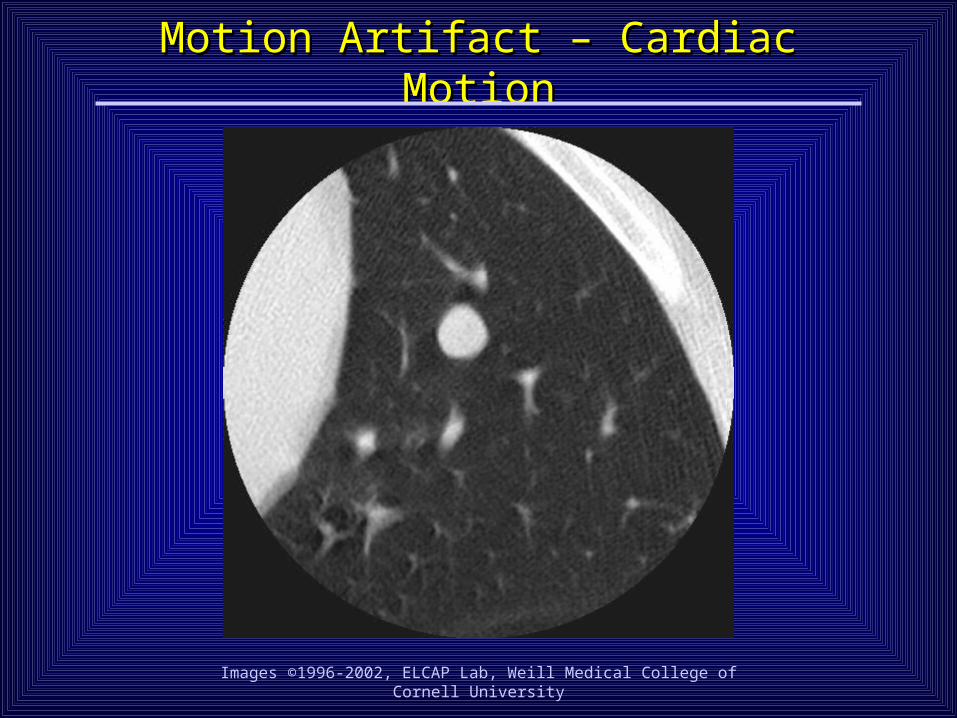
Motion Artifact – Cardiac MotionMotion Artifact – Cardiac Motion
Images ©1996-2002, ELCAP Lab, Weill Medical College of Cornell University

Motion Artifact – Cardiac MotionMotion Artifact – Cardiac Motion
Images ©1996-2002, ELCAP Lab, Weill Medical College of Cornell University

Motion Artifact – Cardiac MotionMotion Artifact – Cardiac Motion
Images ©1996-2002, ELCAP Lab, Weill Medical College of Cornell University
Motion Artifact – Cardiac MotionMotion Artifact – Cardiac Motion
Images ©1996-2002, ELCAP Lab, Weill Medical College of Cornell University

Motion Artifact – Cardiac MotionMotion Artifact – Cardiac Motion
Images ©1996-2002, ELCAP Lab, Weill Medical College of Cornell University

Motion Artifact – Cardiac MotionMotion Artifact – Cardiac Motion
Images ©1996-2002, ELCAP Lab, Weill Medical College of Cornell University

Motion Artifact – Cardiac MotionMotion Artifact – Cardiac Motion
Images ©1996-2002, ELCAP Lab, Weill Medical College of Cornell University
Motion Artifact – Cardiac MotionMotion Artifact – Cardiac Motion
Images ©1996-2002, ELCAP Lab, Weill Medical College of Cornell University
Motion Artifact – Cardiac MotionMotion Artifact – Cardiac Motion
Images ©1996-2002, ELCAP Lab, Weill Medical College of Cornell University

Motion Artifact – Cardiac MotionMotion Artifact – Cardiac Motion
Images ©1996-2002, ELCAP Lab, Weill Medical College of Cornell University

Motion Artifact – Cardiac MotionMotion Artifact – Cardiac Motion
Images ©1996-2002, ELCAP Lab, Weill Medical College of Cornell University
Motion Artifact – Cardiac MotionMotion Artifact – Cardiac Motion
Images ©1996-2002, ELCAP Lab, Weill Medical College of Cornell University

Motion Artifact – Cardiac MotionMotion Artifact – Cardiac Motion
Images ©1996-2002, ELCAP Lab, Weill Medical College of Cornell University

Motion Artifact – Cardiac MotionMotion Artifact – Cardiac Motion
Images ©1996-2002, ELCAP Lab, Weill Medical College of Cornell University

Motion Artifact – Cardiac MotionMotion Artifact – Cardiac Motion
Images ©1996-2002, ELCAP Lab, Weill Medical College of Cornell University

Motion Artifact – Cardiac MotionMotion Artifact – Cardiac Motion
Images ©1996-2002, ELCAP Lab, Weill Medical College of Cornell University

Motion Artifact – Cardiac MotionMotion Artifact – Cardiac Motion
Images ©1996-2002, ELCAP Lab, Weill Medical College of Cornell University

Motion Artifact – Cardiac MotionMotion Artifact – Cardiac Motion
Images ©1996-2002, ELCAP Lab, Weill Medical College of Cornell University

Motion Artifact – Cardiac MotionMotion Artifact – Cardiac Motion
Images ©1996-2002, ELCAP Lab, Weill Medical College of Cornell University

Motion Artifact – Cardiac MotionMotion Artifact – Cardiac Motion
Images ©1996-2002, ELCAP Lab, Weill Medical College of Cornell University

Motion Artifact – Cardiac MotionMotion Artifact – Cardiac Motion
Images ©1996-2002, ELCAP Lab, Weill Medical College of Cornell University

Motion Artifact – Cardiac MotionMotion Artifact – Cardiac Motion
Images ©1996-2002, ELCAP Lab, Weill Medical College of Cornell University

Nodule Growth RatesNodule Growth Rates
• Exponential Growth Model
• Nodule Doubling Time (DT)
• Traditional 2D Approximation

Appropriate Time to Follow-up CTAppropriate Time to Follow-up CT
• When should the follow-up CT be done?
where d is the reliably-detectable percent volume change, a function of initial nodule size
d = two standard deviations of PVC in stable nodules by size category
DTD = 400 days for baseline cases
DTD = upper bound on doubling time for repeat cases
example: 208 days for 3 mm nodule

Time to Follow-up CTTime to Follow-up CT
Appropriate time to follow-up CT by initial nodule size detected onbaseline or repeat screening
Time to Follow-up CT (days) for
nodules detected on
Size (mm) (d) (%) Baseline Repeat
2 - 5 37.0 182 95
5 - 8 21.2 111 26
8 - 11 15.0 81 12
Review of LiteratureReview of Literature
• Limited data on comparison of 3D volume measurements to 2D or 1D, notably for large lesions
• Most report that volume is better for large ‘well-defined’ abnormalities
• Limited impact on change in category for RECIST

SummarySummary
• Technology has greatly improved– Measuring device– Image processing
• Little work has been done in regard to complex abnormalities
• Potential to markedly improve response estimates
Volumetric Measurement of In Vivo NodulesVolumetric Measurement of In Vivo Nodules
• Although we had quantified the relative error in phantom nodule measurement by size, the error for in vivo nodules must be greater– partial volume– vascular geometry– motion artifacts
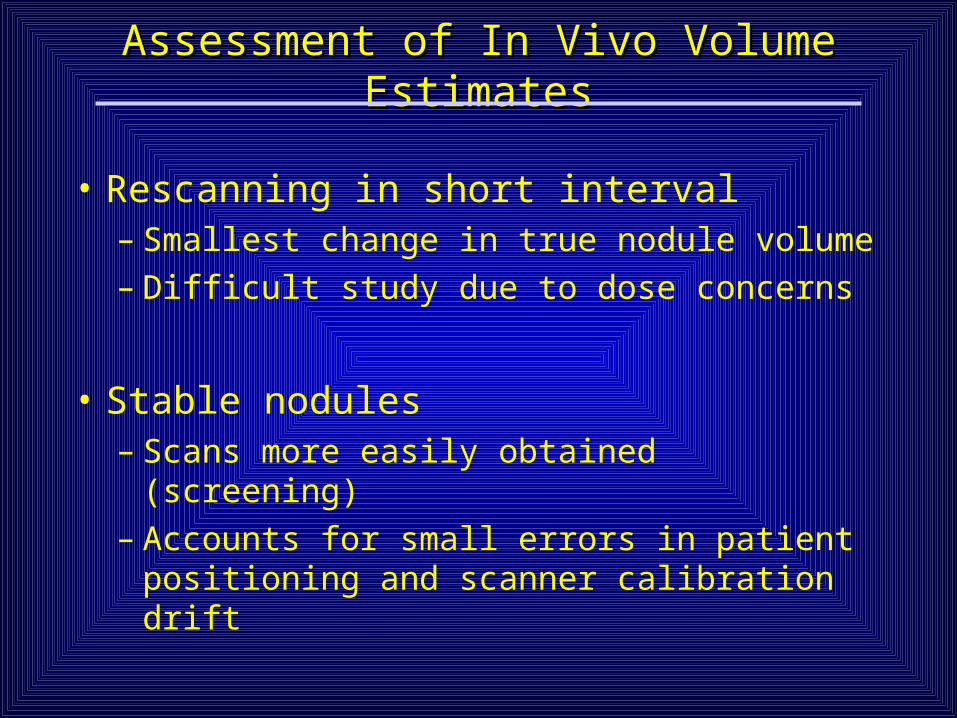
Assessment of In Vivo Volume EstimatesAssessment of In Vivo Volume Estimates
• Rescanning in short interval– Smallest change in true nodule volume– Difficult study due to dose concerns
• Stable nodules– Scans more easily obtained (screening)– Accounts for small errors in patient
positioning and scanner calibration drift

CasesCases
• 262 HRCT scans of 120 stable nodules– Standard dose, small FOV, HRCT– Nodules 2-11 mm in diameter– Determination of stability based on radiologist
evaluation over period of 2 or more years– Assessment of technical artifacts
• Incomplete acquisition• System error
– Assessment of motion artifacts• Five-point scale• Patient motion (gross movement, respiration)• Cardiac motion
• 20 HRCT scans of 10 malignant nodules
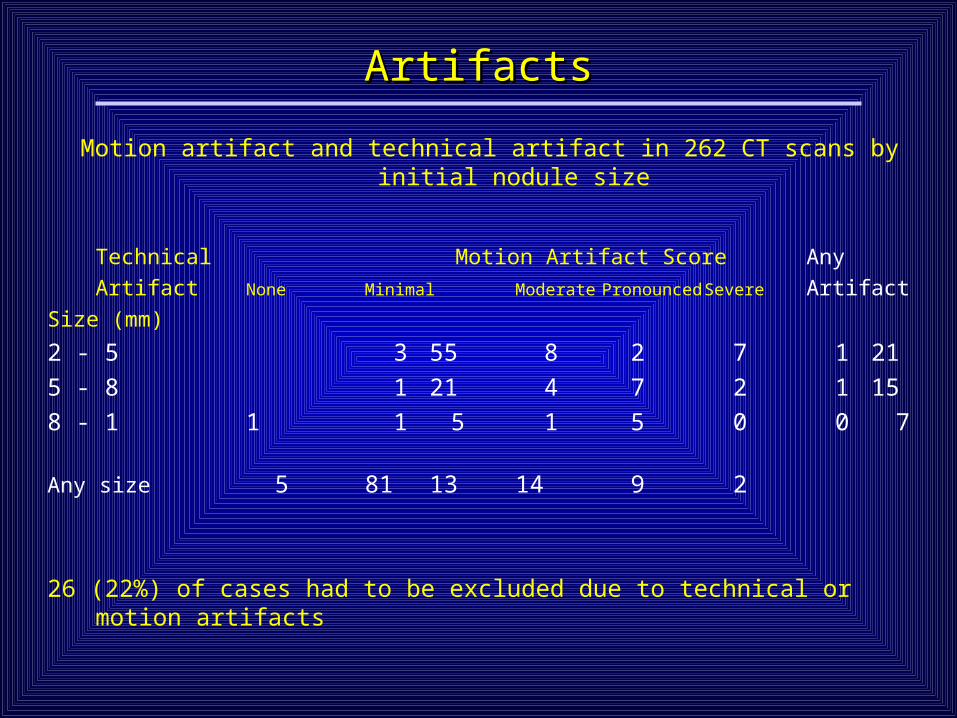
ArtifactsArtifacts
Motion artifact and technical artifact in 262 CT scans by initial nodule size
Technical Motion Artifact Score Any
Artifact None Minimal Moderate Pronounced Severe Artifact
Size (mm)
2 - 5 3 55 8 2 7 1 21
5 - 8 1 21 4 7 2 1 15
8 - 11 1 5 1 5 0 0 7
Any size 5 81 13 14 9 2
26 (22%) of cases had to be excluded due to technical or motion artifacts

Stable NodulesStable Nodules
Frequency distribution of 94 stable nodules by initial size and time tofollow-up CT
Time to Follow-up CT (months)
0 - 6 6 - 12 12 - 30 Any Interval
Size (mm)
2 - 5 21 29 13 63
5 - 8 11 12 2 25
8 - 11 2 2 2 6
Any size 34 43 17 94

Monthly Volumetric Growth IndexMonthly Volumetric Growth Index
• Monthly Volumetric Growth Index, MVGI– Percent change in volume per month– Remaps growth estimates into two distinct classes
Reeves, et al. RSNA 2001

Nodule Growth RatesNodule Growth Rates
MVGI = 32.5
MVGI = 15.1
MVGI = 4.3
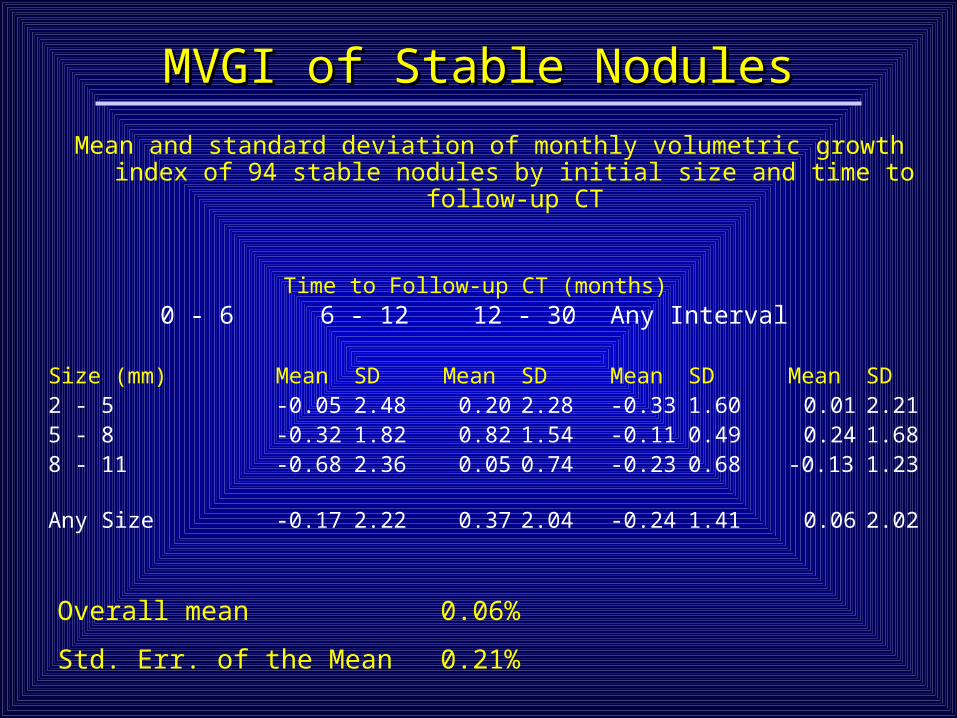
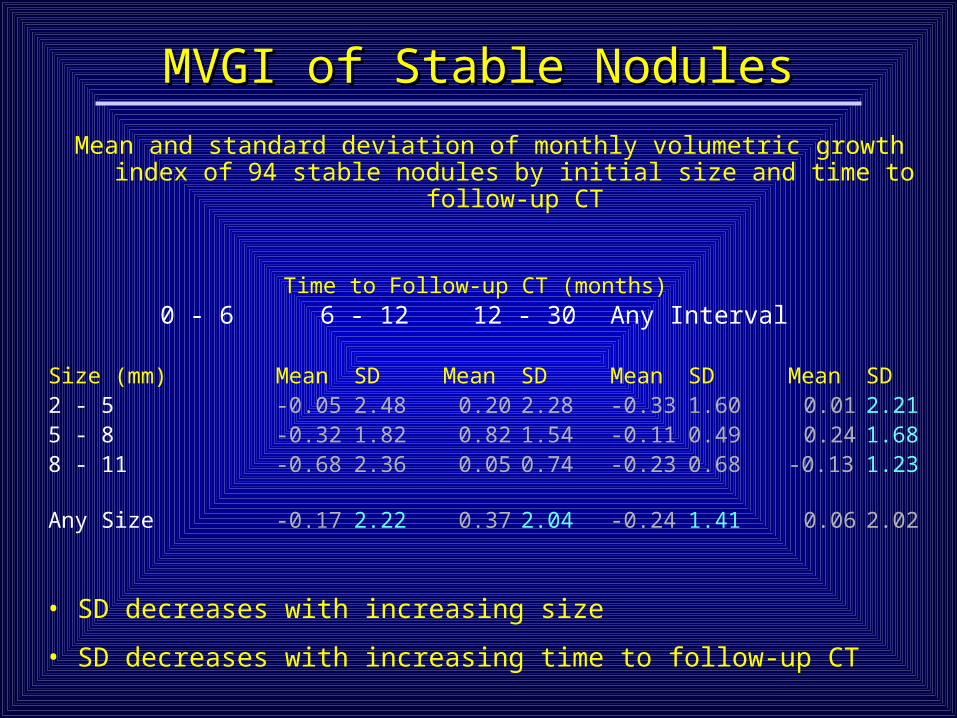
MVGI of Stable NodulesMVGI of Stable Nodules
Mean and standard deviation of monthly volumetric growth index of 94 stable nodules by initial size and time to follow-up CT
Time to Follow-up CT (months) 0 - 6 6 - 12 12 - 30 Any
Interval
Size (mm) Mean SD Mean SD Mean SD Mean SD2 - 5 -0.05 2.48 0.20 2.28 -0.33 1.60 0.01 2.215 - 8 -0.32 1.82 0.82 1.54 -0.11 0.49 0.24 1.688 - 11 -0.68 2.36 0.05 0.74 -0.23 0.68 -0.13 1.23
Any Size -0.17 2.22 0.37 2.04 -0.24 1.41 0.06 2.02
Overall mean 0.06%
Std. Err. of the Mean 0.21%
MVGI of Stable NodulesMVGI of Stable Nodules
Mean and standard deviation of monthly volumetric growth index of 94 stable nodules by initial size and time to follow-up CT
Time to Follow-up CT (months) 0 - 6 6 - 12 12 - 30 Any
Interval
Size (mm) Mean SD Mean SD Mean SD Mean SD2 - 5 -0.05 2.48 0.20 2.28 -0.33 1.60 0.01 2.215 - 8 -0.32 1.82 0.82 1.54 -0.11 0.49 0.24 1.688 - 11 -0.68 2.36 0.05 0.74 -0.23 0.68 -0.13 1.23
Any Size -0.17 2.22 0.37 2.04 -0.24 1.41 0.06 2.02
• SD decreases with increasing size
• SD decreases with increasing time to follow-up CT

PVC of Stable NodulesPVC of Stable Nodules
Mean and standard deviation of percent volume change of 94 stable nodules by initial size and time to follow-up CT
Time to Follow-up CT (months) 0 - 6 6 - 12 12 - 30 Any
Interval
Size (mm) Mean SD Mean SD Mean SD Mean SD2 - 5 1.15 10.5 3.54 20.0 -0.17 25.2 1.98 18.55 - 8 -0.88 6.02 5.86 12.9 -3.74 13.1 2.13 10.68 - 11 -5.53 9.11 -1.02 6.29 -1.86 10.0 -1.56 7.47
Any Size 0.15 9.09 3.98 17.7 -0.35 22.3 1.79 16.1
• SD decreases with increasing size
• SD increases with increasing time to follow-up CT

Malignant NodulesMalignant Nodules
Monthly volumetric growth index of 10 malignant nodules with initial size, time to follow-up CT, and histologic diagnosis
Initial Time to Follow-up HistologicCase Detection Size (mm) CT (days) MVGI (%) Diagnosis
1 Baseline 9.3 20 51.2 Adenocarcinoma2 Baseline 10.4 32 22.0 Squamous Cell3 Baseline 11.1 84 18.7 Large Cell4 Baseline 8.3 197 7.73 Adenocarcinoma
5 Repeat 2.8 58 37.3 Adenocarcinoma6 Repeat 10.6 12 36.5 Squamous Cell7 Repeat 5.1 33 33.3 Adenocarcinoma8 Repeat 6.9 36 22.4 Adenocarcinoma9 Repeat 7.3 42 5.37 Adenocarcinoma10 Repeat 9.8 34 5.01 Large Cell
Comparison of MVGI ValuesComparison of MVGI Values
• All of the stable nodules had values within two standard deviations of the corresponding mean value by size, while each of the 10 malignant nodules exceeded that corresponding value.
ConclusionsConclusions
• The mean value of MVGI for stable nodules was 0.06% and its standard error was 0.21%.
• All of the stable nodules had values within two
standard deviations of the corresponding mean value by size, while each of the 10 malignant nodules exceeded that corresponding value.
• Conclusion: Three-dimensional computer methods can be used to reliably characterize growth in small solid pulmonary nodules. Factors affecting the reproducibility of growth rate estimates include the initial nodule size, the timing of the follow-up scan, and the presence of patient-induced or technical artifacts.