voluminous icelandic basaltic eruptions appear to cause
TRANSCRIPT

Voluminous Icelandic Basaltic Eruptions Appear To Cause
Abrupt Global Warming Peter L Ward
Teton Tectonics, Jackson, WY 83001

(1) Flood Basaltic Eruptions in Iceland Load Massive Amounts of SO2 into the Troposphere Causing Warming
Eldgja 934 Laki 1783 Pinatubo 1991
Magma volume 18 km3 15 km3 5 km3
Erupted to 13 km? 13 km 35 km
Mass SO2 120 Mt 17 Mt
Onset Medieval Warming
Period
Up to 3.3oC warming of
Europe during eruption
-0.7oC global cooling
for nearly 3 years
24 Mt SO2 in stratosphere carried eastward and northward
98 Mt SO2 in troposphere carried Southeastward toward Europe
Tropopause
80% of the SO2 and fine ash erupted by Laki in 1783 stayed in the troposphere and drifted southeastward towards Europe while the cooling effects associated with the SO2 that reached the stratosphere moved eastward and northward

(2) A similar distribution of tropospheric ash and gases from Eyjafjallajökull as observed on April 15, 2010 at 3 pm
The density of “dry fog” haze observed in Grund, Iceland and Mannheim, Germany following the 10 eruptive phases of Laki
Deviation of surface temperature in oC during July, 1783, from the 1768-1798 mean
Regions of highest temperature increase tend to correlate with regions of greatest density of “dry fog” (SO2)
(Thordarson and Self, 2003)
(Thordarson and Self, 2003)
The highest mean temperatures in England since observations began in 1659 until 1983
Laki, 1783

(3) Volcanic sulfate concentrations measured in the GISP2 drillhole at Summit Greenland were highest when the earth was warmed out of the last ice age (11.6 to 9.6 ka) and during each of the Dansgaard-Oeschger sudden warmings
Circled numbers are the number of contiguous layers of ice containing significant volcanic sulfate Layers typically represent 2 years
Dansgaard-Oeschger warmings

(4) Widespread Evidence of Major Sub-glacial Basaltic
Volcanism in Iceland
Herðubreið tuya in northeastern Iceland
They provide widespread evidence of major sub-glacial volcanism in Iceland during Dansgaard-Oeschger warmings at 11.6, 13.1, and 14.6 ka
Melting of a 1+ kilometer thick ice sheet would reduce pressure on magma chambers, concentrating volcanism into more intense phases of less than a few decades duration, providing the sudden influxes of fresh water into North Atlantic circulatory systems observed during DO events
Tuyas are a type of sub-glacial volcano that consists of nearly horizontal beds of basaltic lava capping outward-dipping beds of fragmental volcanic rocks
There are numerous older tuyas that are not well-enough dated to compare to DO events

(5) What Could Cause the Warming?
UV has enough energy to drive essentially all atmospheric photochemistry of importance
The most energetic radiation in the atmosphere is ultraviolet (λ < 0.400 μm) from the sun
NO2, SO2, tropospheric O3, black carbon and fine volcanic ash absorb UV energy strongly.
Total thermal energy radiated by the atmosphere to earth = σT4 (Stefan-Boltzmann Law)
Temperature is an intensive physical property of matter, independent of volume
A thin layer of these solar-ultraviolet-energy-absorbing gases and particulates will have a much higher temperature than a whole atmosphere full of much larger concentrations of terrestrial-energy-absorbing greenhouse gases
(a) Solar flux absorbed at the earth’s surface is at a maximum when the sun is directly overhead and the area illuminated by a pencil of sunlight is at a minimum
(b) But gas molecules in the atmosphere absorb energy radiating from all directions and are more likely to absorb energy when the path length is longer
(d) The majority of energy associated with electronic transitions (UV and visible wavelengths only) is shared by radiation in all directions at a slightly lower frequency (fluorescence or phosphorescence) (Rayleigh scattering)
(c) Most ultraviolet energy is being absorbed in the atmosphere during mornings and afternoons especially poleward of the tropics
UV energy is concentrated in thin layers because:
The Warm Thin Layer Theory of Global Warming

(6) Temperature is Indicative of the Frequency of Oscillation of and within Molecules and Atoms
Vibrational transitions: Atoms attracted by Coulomb forces to form molecules repel each other when too close, forming a minimum in potential energy. Each degree of freedom of motion across each chemical bond will oscillate around this minimum with the largest amplitudes at certain resonant frequencies, normal modes of oscillation, determined by the physical dimensions and other properties of the atoms involved
Rotational transitions: an oscillating electromagnetic field applies an oscillating torque on molecules containing three or more atoms that have a dipole moment, causing the molecule to oscillate about its moment of inertia
Electronic transitions: electrons in atoms that absorb sufficient energy move into a higher frequency excited state and radiate slightly smaller amounts of energy when they return to ground state
Electronic transition
(Visible And UV)
Vibrational transition
(in IR)
Rotational transition
(in microwave)
Ground State
Dissociation Energy
Excited electronic state
Frequency approaches zero as temperature approaches absolute zero
Higher frequencies mean higher temperatures
Energy of light = frequency of oscillation times Planck’s constant (E=hν)

Color temperature (Tc) of light equals 2897 divided by λmax
(7) Spectral Radiance of Black Bodies is a Function of Temperature
Rotational Vibrational Wavelength (μm)
Frequency (THz) S
pect
ral r
adia
nce
W /
(m 2 s
r μm
) E
nergy of oscillation (eV)
Oscillations: Electronic
λmax (μm) Tc (K)
0.502 5770
1.07 2700
3.62 800
10.1 288
29.0 100
A problem with greenhouse gas theory: Radiation from the earth cannot make the atmosphere warmer than earth and thus cannot warm the earth. There must be a source of higher frequency energy, the sun, to warm the earth
λmax
0.2
Although not exactly correct because 93% of absorption by CO2 is around 4.2 μm where Tc=690K

(8) Absorption Occurs in Narrow Bandwidths
UV dissociates O2 to form O3
OH, the primary oxidant, is
formed from O3
The most energetic UV to reach earth’s surface is absorbed
strongly by tO3, SO2, NO2 and BC

(9) Greenhouse Gases Absorb Along Spectral Lines
Detail of the 15 μm peak for CO2
Each spectral line has a finite width and is typically assumed to have a Lorentz line shape Absorption by the line equals the area under the line which equals π/4 times peak intensity times twice the half-width at half-maximum
Inte
nsi
ty
Wavenumber
Area

(10) Solar-Energy-Absorbing Pollution Gases Absorb Along a Continuum
Note the very high absorption in the UV-A and UV-B bands where energy is rising rapidly and the actinic flux at the earth’s surface is decreasing rapidly
Actinic flux was calculated by Madronich (1998) when global pollution was high
The energy that caused global warming was dominantly in UV-B band
Documenting this energy depends on determining the actinic flux precisely as a function of elevation both with and without pollution

(11) Net Energy Absorbed per Molecule as a Function of Bandwidth
Molecule
Wavelength range, μm
Total energy absorbed per
molecule, eV/sec times 10-15
Percent total
energy absorbed
CO2 0.782-28.4 3.57 100.0% 0.8-2.4 0.00437 0.1% 2.4-3.0 0.143 4.0% 4.1-4.4 3.33 93.3%
10.0-20.0 0.0866 2.4%
H20 0.4-139 1.12 100.0% vapor 1.0-2.1 0.163 14.5%
2.1-4.0 0.519 46.2% 4.0-10 0.303 26.9%
10.0-139 0.134 11.9%
CH4 1.09-10.0 0.530 100.0% 1.0-2.0 0.015 2.7% 2.0-3.1 0.046 8.7% 3.1-3.5 0.384 72.5% 7.0-8.5 0.076 14.3%
N2O 1.28-70 2.26 2.5-9.0 2.24 99.2%
Molecule
Wavelength range, μm
Total energy absorbed per
molecule, eV/sec times 10-15
O3 0.280-0.343 18.8 0.300-0.343 1.22 0.380-0.788 0.04
SO2 0.280-0.416 9.83 0.300-0.416 2.25
NO2 0.280-0.666 19.7 0.300-0.666 18.8
Note the very high absorption in the narrow 0.28-0.34 band

(12) High Concentrations of tO3 and SO2 Travel the World
Royal Society, 2008, Ground-level ozone in the 21st century
EPA monitoring sites throughout the US SO2 measured from an airplane NW of Ireland
EPA monitoring sites throughout the US
Pre-industrial surface ozone Present-day surface ozone
(13) Many Issues Must Be Addressed to Show Quantitatively that Pollution such as tO3, SO2, NO2, and BC Can Cause Global Warming
We need considerably more data showing at what elevation UV-A and UV-B energy is absorbed in the atmosphere and by which gases and particulates
We need more reanalysis of pollution data to quantify its global distribution over space and time since 1950
We need to improve radiation codes to include UV absorption by pollutants and to address issues of color temperature and back radiation to a warm earth
We need to document the rates of absorption of solar energy by atmospheric gases and particulates during mornings and afternoons and poleward of the tropics
We need to recognize that greenhouse gas theory may not be as well proven as we typically assume and should be reexamined carefully
We need more detailed observations of voluminous basaltic volcanic eruptions like Laki that are not explosive enough to put most of the SO2 in the stratosphere
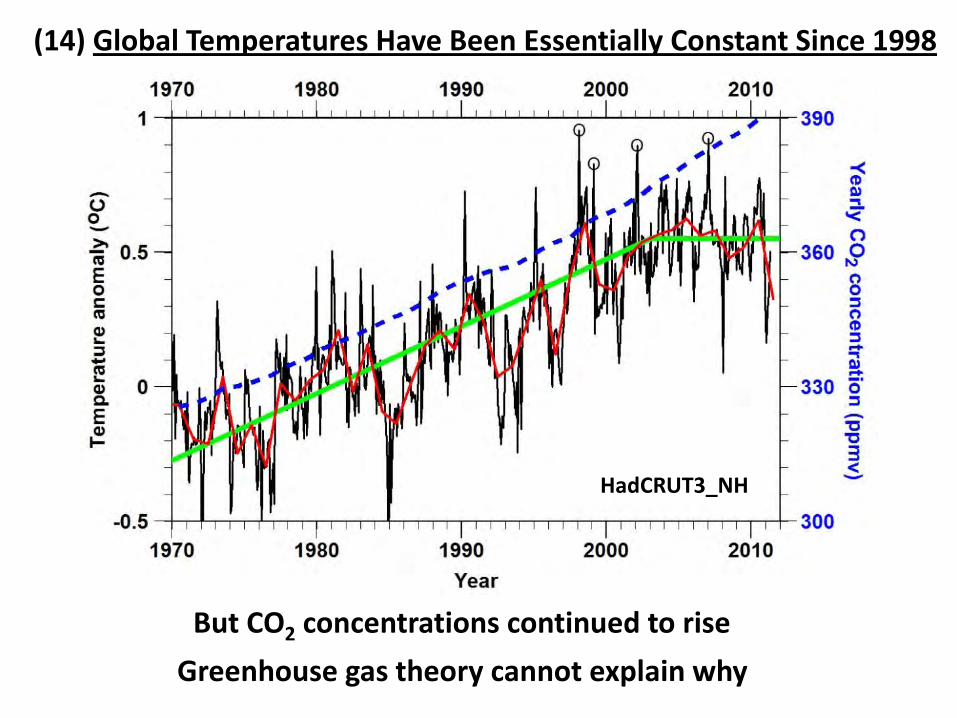
(14) Global Temperatures Have Been Essentially Constant Since 1998
But CO2 concentrations continued to rise
Greenhouse gas theory cannot explain why
HadCRUT3_NH

(15) But Increases & Decreases in Pollution Provide a Clear Explanation
SO2 concentrations peaked in 1974, decreased 22% by 2002 and are increasing again
It takes 20-30 years of warm air to raise the mean temperature of the oceanic mixed layer

(16) Conclusions
SO2 emissions played a major role in 20th century warming, but tropospheric ozone appears to have been most important
Reducing pollution to reduce acid rain appears to have slowed global warming since 1998, but rapid development in Asia threatens renewed warming
Periods of most rapid global warming during the past 46,000 years all correlate in time with the highest concentrations of sulfate recorded in the Greenland ice sheet
Absorption of solar UV energy by tO3, SO2, NO2, BC, etc. appears to warm thin layers of the atmosphere to higher temperatures than greenhouse gases absorbing terrestrial infrared energy
The Warm Thin Layer Theory of Global Warming
Temperature in atmospheric layers is affected more strongly by the color temperature (frequency) of the radiation absorbed than by the concentration of absorbing gases
Total thermal energy radiated by the atmosphere to earth is a function of temperature, not volume
Best documented, pre-industrial warmings are contemporaneous with known eruptions of basaltic volcanoes in Iceland, volcanoes that emit large quantities of SO2 primarily into the troposphere